Acquisition of innate odor preference depends on spontaneous and experiential activities during critical period
- Stowers Institute for Medical Research, United States
- Interdisciplinary Graduate Program in Biomedical Sciences, University of Kansas Medical Center, United States
- Department of Anatomy and Cell Biology, University of Kansas Medical Center, United States
Figures
Figure 1
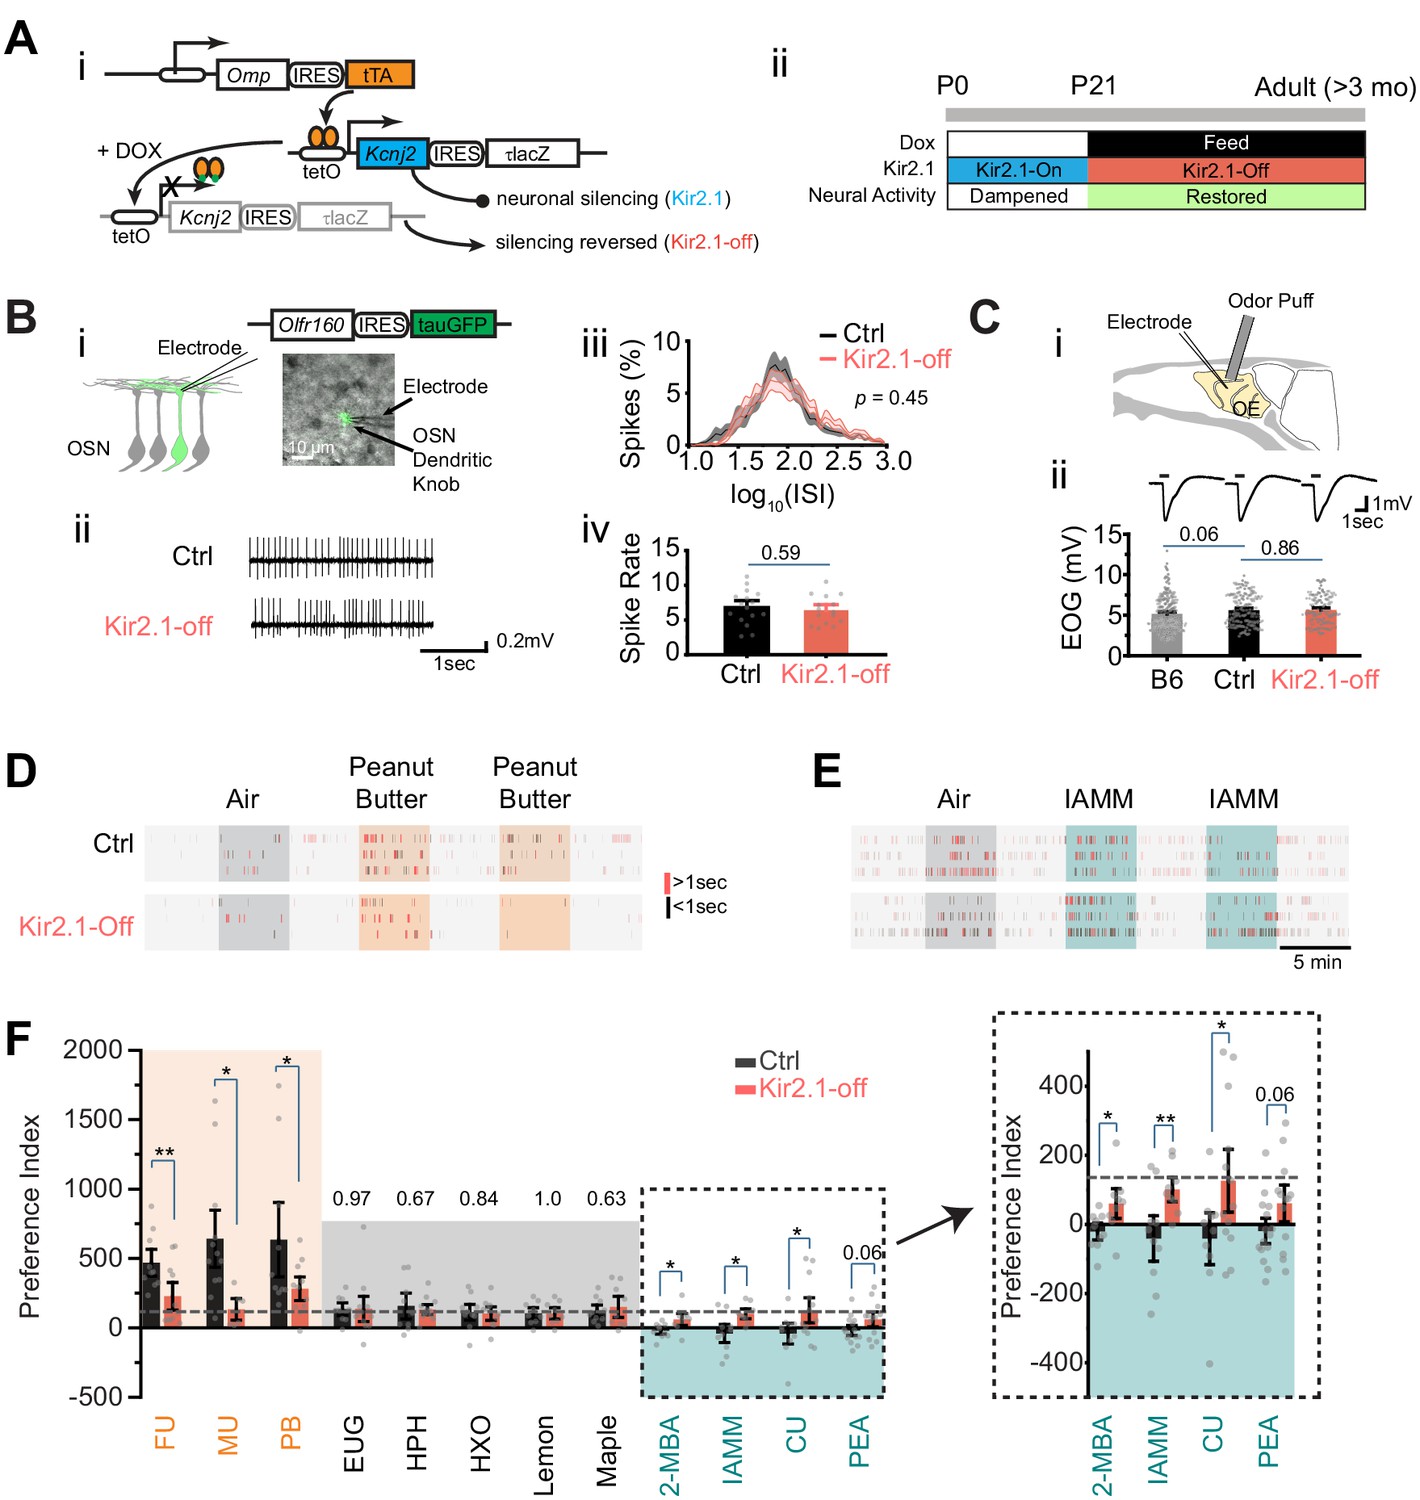
Suppressing spontaneous activity during early development alters odor preference in adulthood.
(A) i. Illustration of the inducible transgene expression in the Omp-IRES-tTA/tetO-Kcnj2-IRES-tauLacZ (Kir2.1) mice. ii. Schematic illustration of genetic silencing olfactory sensory neurons (OSNs) during early postnatal period. (B) i. Dendritic recording of an OSN in Olfr160-IRES-tauGFP (M72-GFP) animal. Superimposed bright field and fluorescent images show a recording pipette attached to the dendritic knob of an M72-GFP OSN. ii. Raster plots showing examples of spontaneous spiking patterns of OSNs from control and Kir2.1-off mice. iii. Distribution of inter-spike interval (ISI) in control (black, neuron n = 16) and Kir2.1-off (red, n = 14) animals. Spike count: Ctrl, 8187; Kir2.1-off, 5076. The ISIs follow lognormal distributions. One-way ANOVA test on average log (ISI) was performed, p=0.45. iv. Bar plot of average firing frequencies of M72 OSNs in control (black) and Kir2.1-off (red) mice. (C) i. Illustration of electro-olfactogram (EOG) recording. ii. Response sample traces (top) and average amplitude (bottom) of C57Bl/6 (B6, n = 189), littermate control (Ctrl, n = 132), and Kir2.1-off mice (n = 104). (D and E) Raster plots of odor port investigation of air, peanut butter (PB, D), and isoamylamine (IAMM, E). Each tick represents an investigation event. Investigations longer and shorter than 1 s are marked by red and black ticks, respectively. Preference index is calculated as the average difference of port investigations between the first two odor epochs and the last air epoch. (F) Bar graph showing preference indices for control (black) and Kir2.1-off (red) mice. Shaded areas indicate innate preference to animals: orange indicates attraction; blue indicates aversion; gray indicates neutral. The gray dashed line indicates the average of preference indices to the five neutral odors. Inlet: enlarged graph showing preference indices to aversive odors. The following odorants were used. Neutral odors, eugenol (EUG, Ctrl n = 9, Kir2.1-off n = 12), heptanal (HPH, Ctrl n = 9, Kir2.1-off n = 9), 2-hexanone (HXO, Ctrl n = 10, Kir2.1-off n = 10), lemon (Ctrl n = 9, Kir2.1-off n = 9), and maple (Ctrl n = 10, Kir2.1-off n = 9); attractive odors, PB (Ctrl n = 10, Kir2.1-off n = 11), female urine (FU, Ctrl n = 10, Kir2.1-off n = 11), and male urine (MU, Ctrl n = 12, Kir2.1-off n = 6); aversive odors, 2-MBA (Ctrl n = 10, Kir2.1-off n = 9), IAMM (Ctrl n = 10, Kir2.1-off n = 9), coyote urine (CU, Ctrl n = 10, Kir2.1-off n = 13), and 2-phenylethylamine (PEA, Ctrl n = 15, Kir2.1-off n = 13). All bar graph data are shown in mean ± SEM. Individual data points are shown as gray dots. One-way ANOVA performed. *, p<0.05; **, p<0.01; ***, p<0.01.
-
Figure 1—source data 1
Quantification of neuronal activity and odor preference.
- https://cdn.elifesciences.org/articles/60546/elife-60546-fig1-data1-v2.xlsx
Figure 2 with 1 supplement
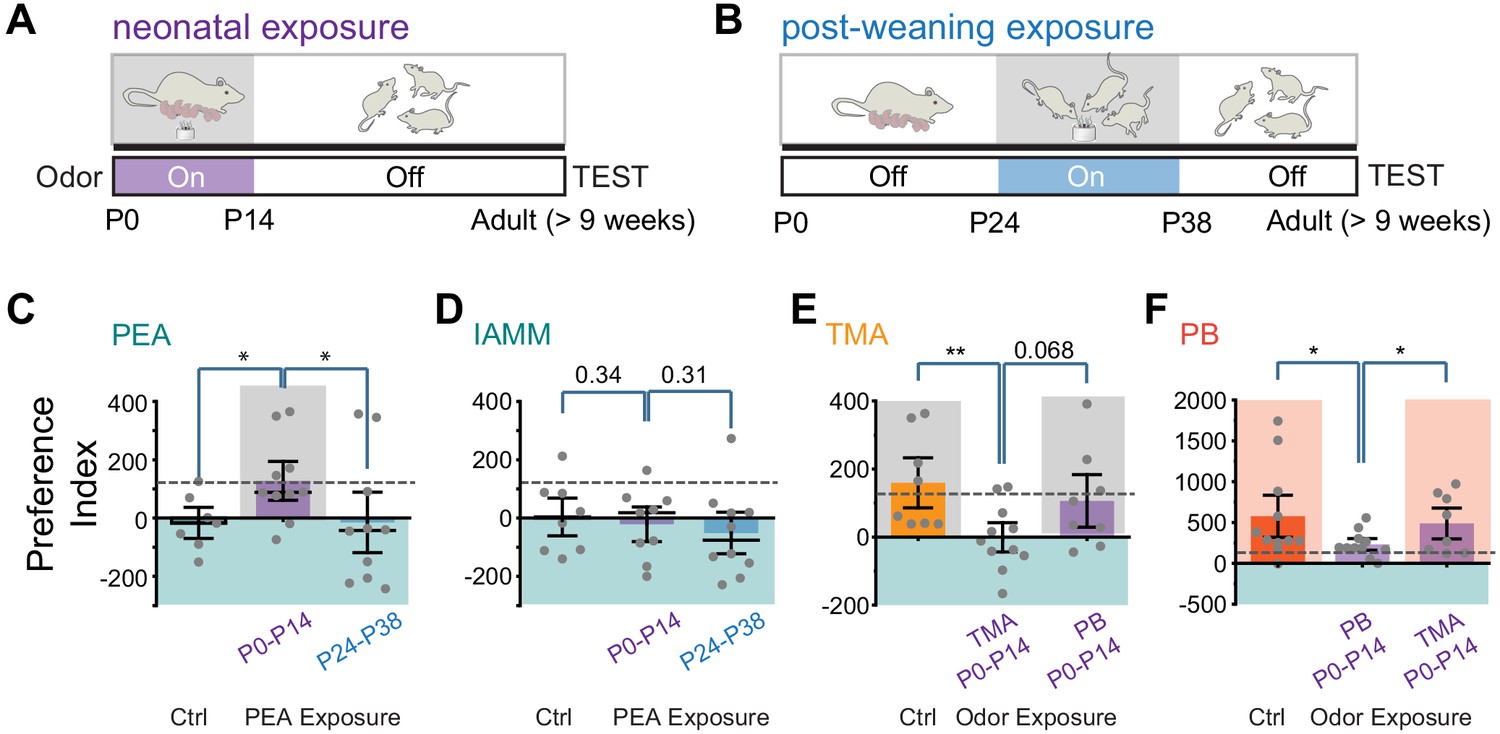
Early postnatal exposure to odors alters innate odor recognition in adulthood.
(A and B) Schematic illustration of the experimental paradigms. CD-1 pups were exposed to 2-phenylethylamine (PEA) between P0 and P14 (A) or between P24 and P38 (B). The animals were tested at the adult stage. Shaded areas indicate PEA exposure. (C and D) Bar plots of preference indices to PEA (C, Ctrl n = 7, P0–P14 PEA exposed n = 10, P24–P38 PEA exposed n = 10) and IAMM (D, Ctrl n = 8, P0–P14 PEA exposed n = 9, P24–P38 PEA exposed n = 10). (E and F) Bar plots of preference indices to TMA (E, Ctrl n = 8, P0–P14 TMA exposed n = 11, P0–P14 peanut butter [PB] exposed n = 8) and PB (F, Ctrl n = 11, P0–P14 PB exposed n = 11, P0–P14 TMA exposed n = 8). The gray dashed line indicates the average preference to neutral odors as in Figure 1F. One-way ANOVA performed. *, p<0.05.
-
Figure 2—source data 1
Quantification of odor preference after early postnatal exposure.
- https://cdn.elifesciences.org/articles/60546/elife-60546-fig2-data1-v2.xlsx
Figure 2—figure supplement 1
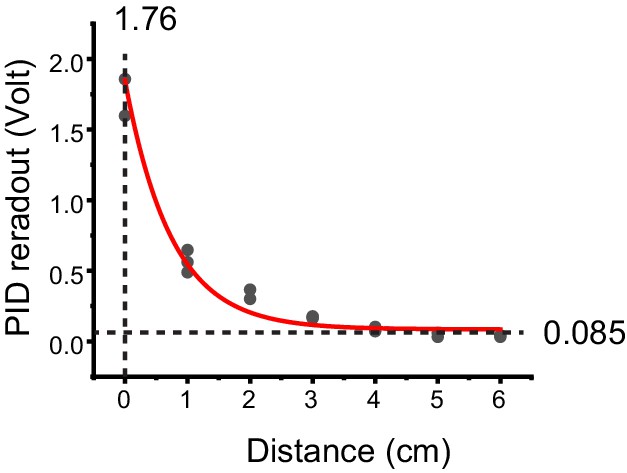
Measuring odor concentration in home cage.
Photoionization detector readout of 2-phenylethylamine (PEA) at various distances from the odor vial opening. Three measurements were conducted for each distance. The data were fit with an exponential decay curve. At steady state, the readout (0.085 v) is at 4.8% of that within the odor vial (1.76 v).
-
Figure 2—figure supplement 1—source data 1
Numerical data of PID measurement of odor signal.
- https://cdn.elifesciences.org/articles/60546/elife-60546-fig2-figsupp1-data1-v2.xlsx
Figure 3
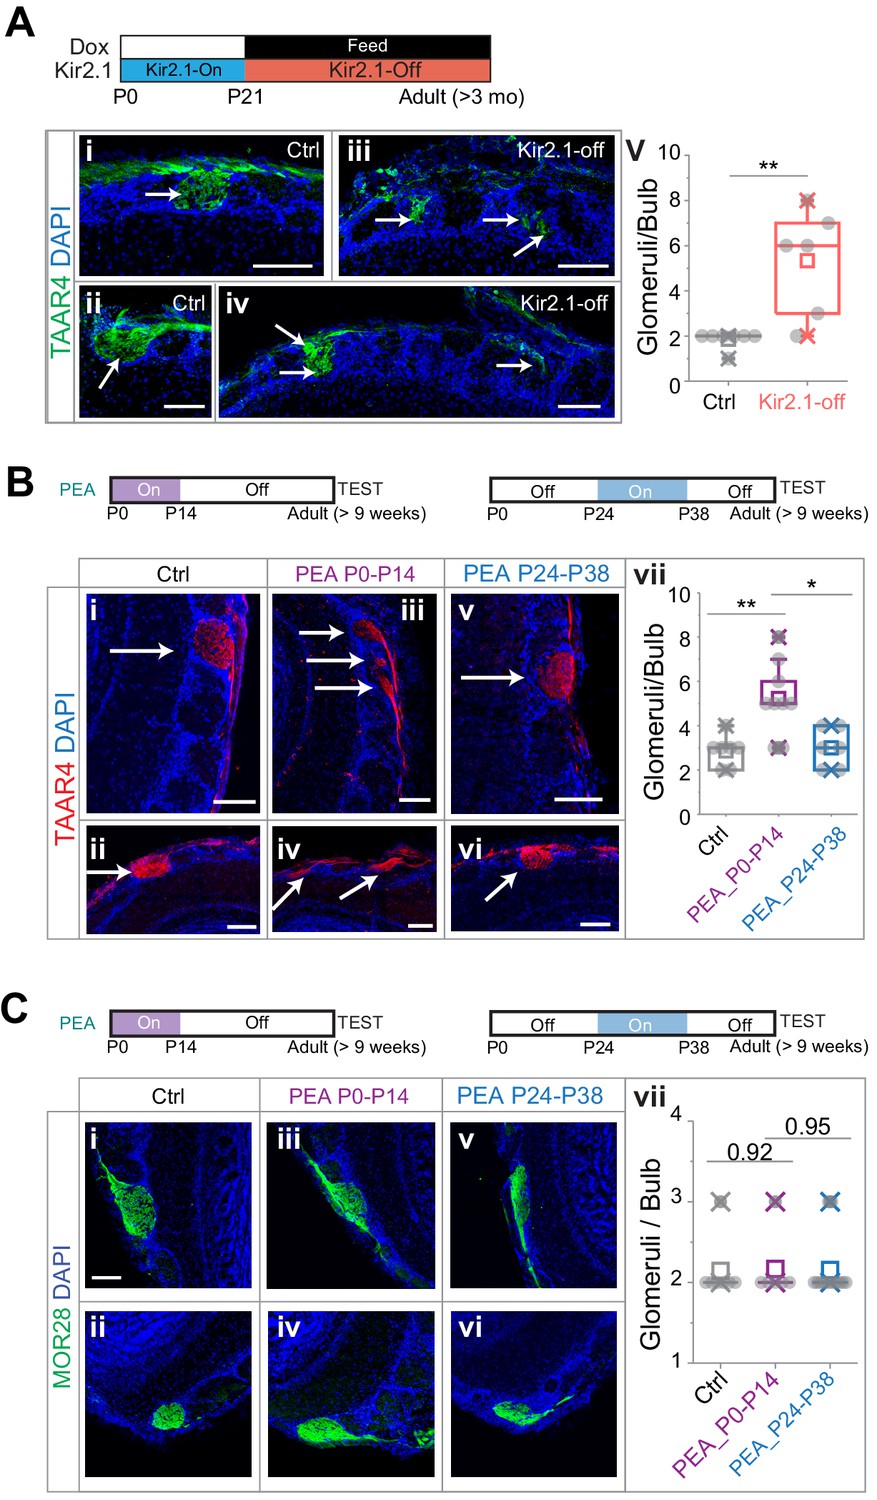
Altered projection patterns of TAAR4 expressing olfactory sensory neuron (OSN) axons in Kir2.1-off and 2-phenylethylamine (PEA) treated mice.
(A) Immunofluorescent staining of TAAR4 receptor in olfactory bulb sections from control animals (i and ii, n = 7) and Kir2.1-off animals (iii and iv, n = 6). Green, TAAR4 signal. Blue, DAPI. v. Quantification of TAAR4+ glomeruli each OB. Box plot edges indicate the first and third quartiles of the data, while whiskers indicate 1.5 interquartile range. (B) TAAR4 staining of olfactory bulb sections for control (i and ii, n = 7), P0–P14 PEA exposed (iii and iv, n = 9) and P24–P38 exposed (v and vi, n = 6) CD-1 animals. Red, TAAR4. Blue: DAPI. vii. Quantification of TAAR4+ glomeruli for each OB. (C) Confocal images of MOR28 receptor immunofluorescent staining in olfactory bulb sections for control (i and ii, n = 7), P0–P14 PEA exposed (iii and iv, n = 6) and P24–P38 exposed (v and vi, n = 13) animals. Green, MOR28. Blue: DAPI. vii. Quantification of MOR28+ glomeruli for each OB. One-way ANOVA result is shown. **, p<0.01. Arrows point to each glomerulus. Scale bars, 100 µm.
-
Figure 3—source data 1
Quantification of axon projection changes induced by Kir2.1 expression and PEA exposure.
- https://cdn.elifesciences.org/articles/60546/elife-60546-fig3-data1-v2.xlsx
Figure 4 with 1 supplement
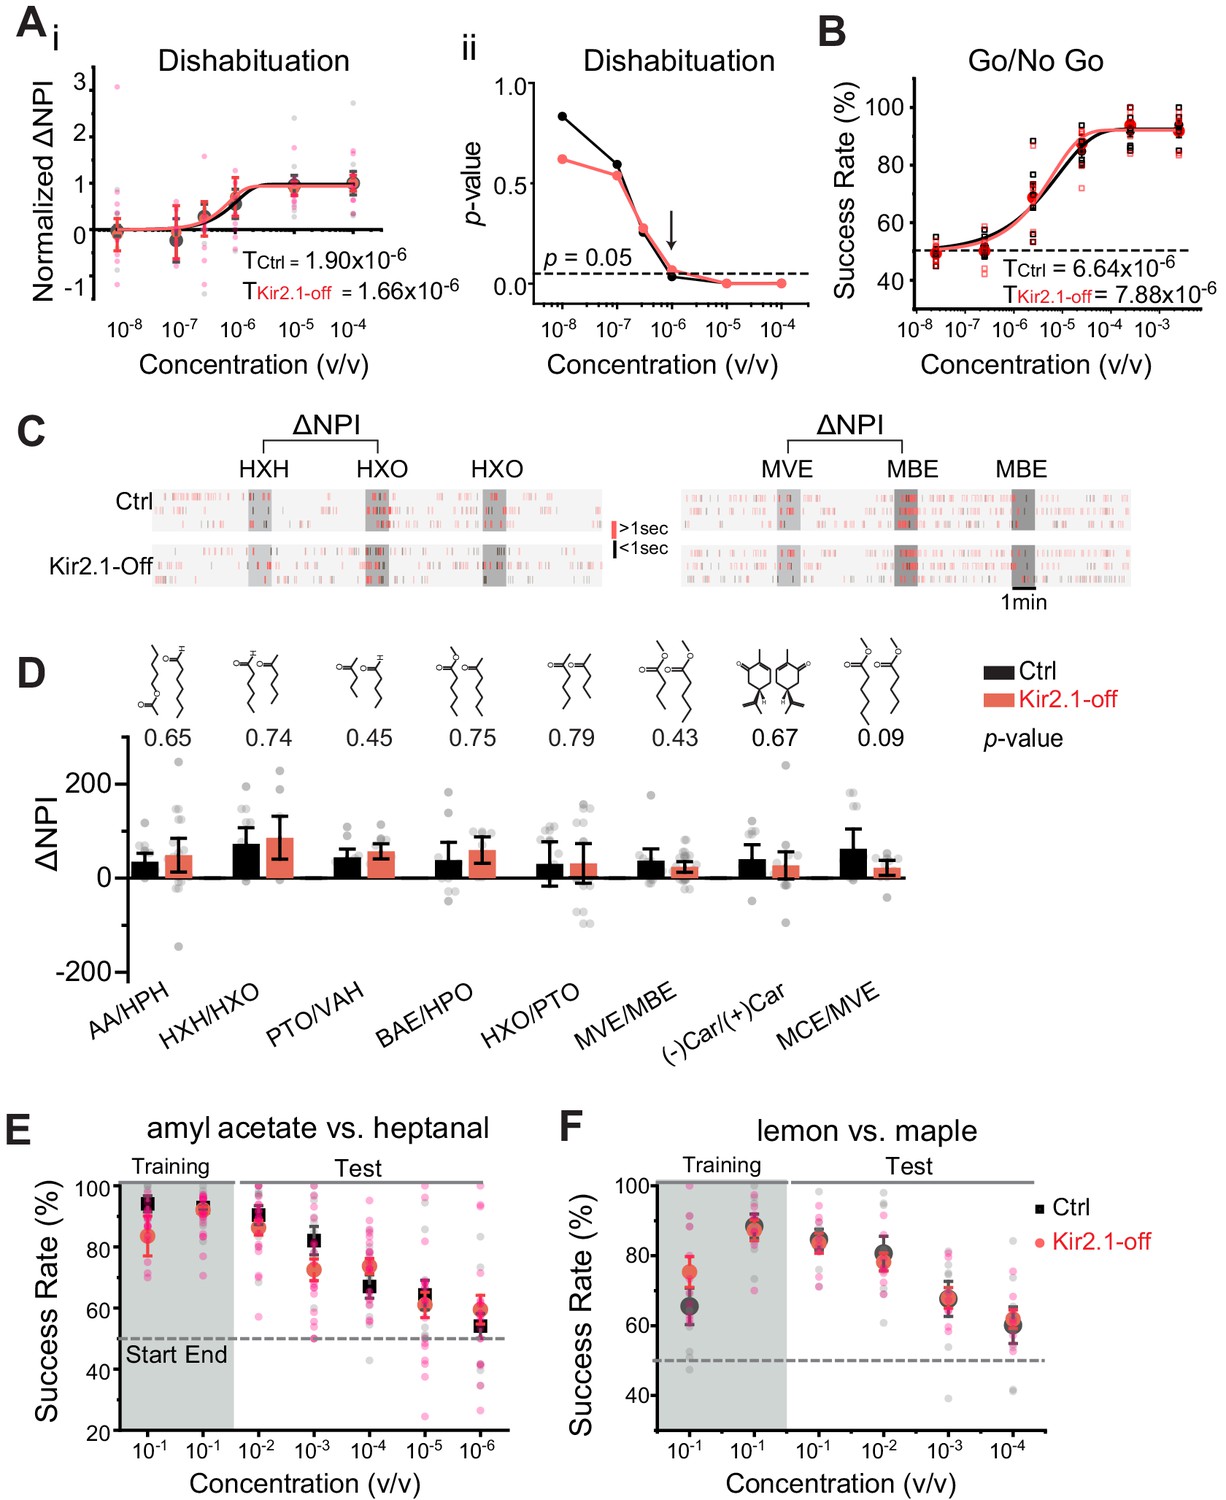
Suppressing spontaneous activity during early development does not impact odor detection, discrimination, and association.
(A) Detection threshold of amyl acetate (AA) is determined by dishabituation assay. i. Mean ΔNPI values for AA presented at different concentrations (10−8 to 10−4 v/v) for control (black, n = 9) and Kir2.1-off (red, n = 10) mice. Data are fitted with Weibull psychometric function with threshold values (T) shown. ii. p-values of ΔNPI at different odor concentrations from (i). Arrow indicates the concentration at which p-value is at 0.05. Dashed line indicates where the p-value is 0.05. (B) Success rates in Go/No Go test with increasing odor concentrations of AA (Ctrl, n = 9; Kir2.1-off, n = 9). Data are fitted with a Weibull psychometric function. Threshold values (T) calculated from the fitting are indicated. Dashed line in indicates success rate at chance level of 50%. (C) Cross habituation test. Raster plots of odor port investigation by control (Ctrl) and Kir2.1-off mice. Animals are habituated with hexanal (HXH, left) or methyl valerate (MVE, right) before exposed to 2-hexanone (HXO, left) or methyl butyrate (MBE, right) respectively. Odor deliveries are marked by gray boxes. Only the last habituation and first two novel stimulation periods are shown. (D) Bar plot of ΔNPI (mean ± SEM) in Ctrl (black) and Kir2.1-off (red) for discrimination of different odor pairs. Chemical structures of the odorants are shown. Numbers above the bars indicate the p-values between the scores obtained from Ctrl and Kir2.1-off. Animals used: AA/HPH, Ctrl n = 10, Kir2.1-off n = 14; HXH/HXO, Ctrl n = 9, Kir2.1-off n = 8; PTO/VAH, Ctrl n = 9, Kir2.1-off n = 9; BAE/HXO, Ctrl n = 9, Kir2.1-off n = 6; HXO/PTO, Ctrl n = 9, Kir2.1-off n = 10; MVE/MBE, Ctrl n = 10, Kir2.1-off n = 14; (−)Car/(+)Car, Ctrl n = 8, Kir2.1-off n = 14;, MCE/MVE, Ctrl n = 7, Kir2.1-off n = 8. (E and F) Two-choice odor discrimination assay. Scatter plots show the success rate for Ctrl (black, n = 4) and Kir2.1-off (red, n = 5) mice in discriminating AA versus heptanal (E), and lemon versus maple (Ctrl, n = 8; Kir2.1-off, n = 8) (F) at decreasing concentrations.
-
Figure 4—source data 1
Quantification of odor detection and discrimination.
- https://cdn.elifesciences.org/articles/60546/elife-60546-fig4-data1-v2.xlsx
Figure 4—figure supplement 1
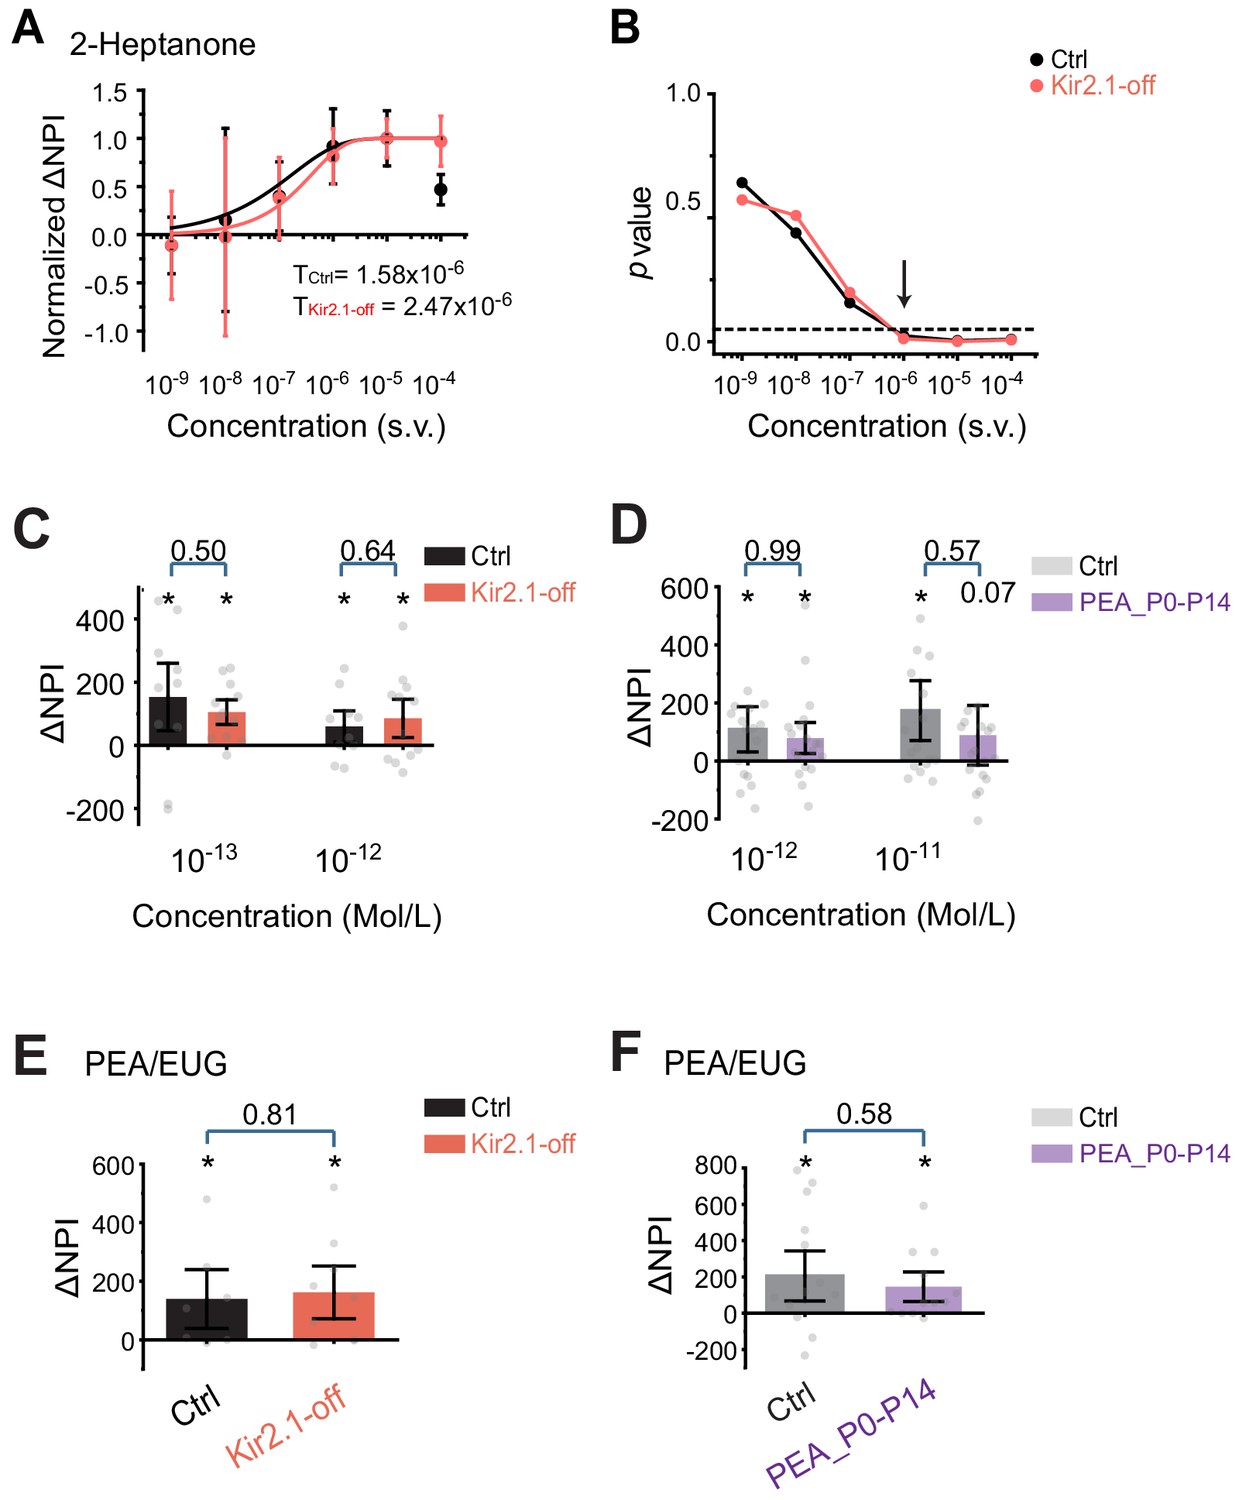
Odor detection at low concentration.
(A) Detection threshold of 2-heptanone is determined by dishabituation assay. Mean ΔNPI values of each animals for amyl acetate presented at different concentrations (10−9 to 10−4 v/v) in mineral oil (diluent) for control (black, n = 9) and Kir2.1-off (red, n = 9) mice. Data are fitted with Weibull psychometric function with threshold values (T) shown. (B) p-values of ΔNPI at different odor concentrations from A. One-way ANOVA performed. Arrow indicates the concentration at which p-value is at 0.05. Dashed line indicates where the p-value is 0.05. (C) Detection of 2-phenylethylamine (PEA) at threshold concentrations measured as ΔNPI values in dishabituation to PEA over air control for Kir2.1-off mice (red, n = 12) and littermate controls (black, n = 10). PEA was presented at 10−13 M and 10−12 M. Stars above each bar indicate p<0.05. The p-values of comparison between the two groups are indicated. One-way ANOVA is performed. (D) Detection threshold of PEA for control (light gray, n = 17) and P0–P14 PEA-exposed animals (dark gray, n = 19) mice. PEA was presented at 10−12 M and 10−11 M. (E and F) Cross-habituation analysis of odor discrimination between PEA and eugenol (EUG). EUG was presented first. ΔNPI (mean ± SEM) for Ctrl (black) and Kir2.1-off (red; E), and Ctrl (light gray) and PEA P0–P14 exposed (dark gray, F) are plotted. Numbers of animals were the same as C and D. Individual data points are shown as gray dots.
-
Figure 4—figure supplement 1—source data 1
Quantification of odor detection and discrimination.
- https://cdn.elifesciences.org/articles/60546/elife-60546-fig4-figsupp1-data1-v2.xlsx
Figure 5 with 1 supplement
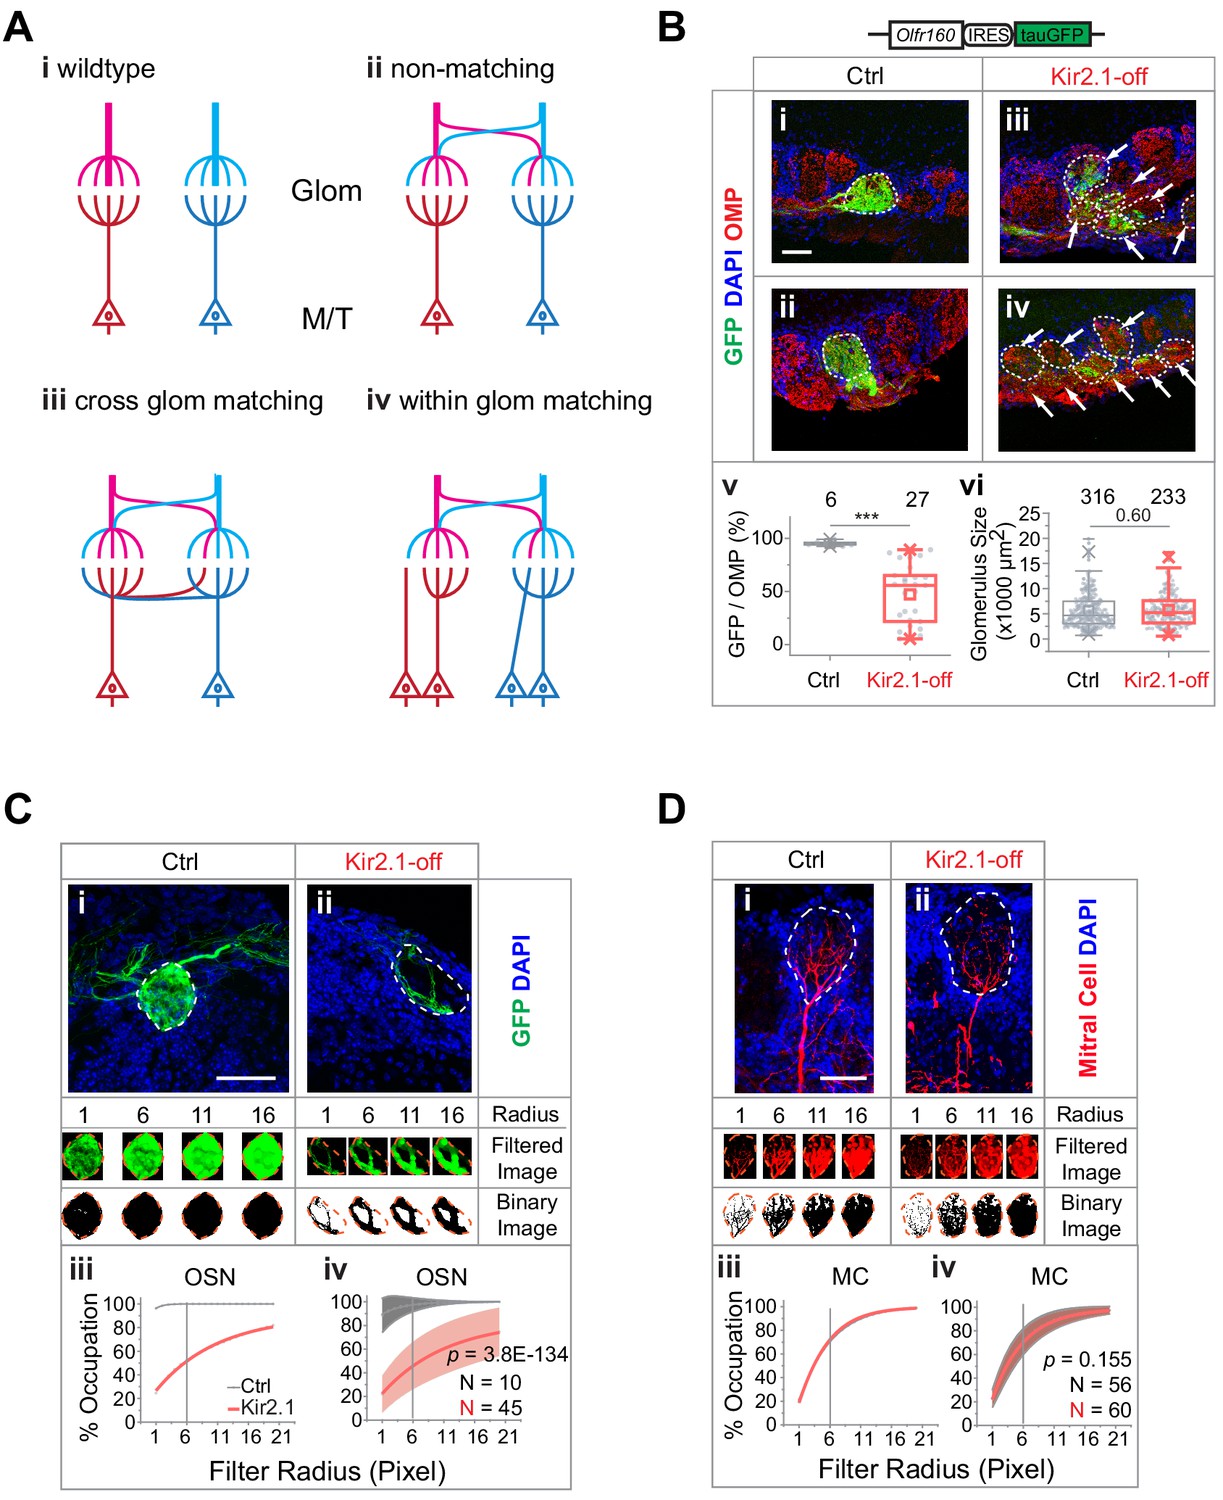
Mismatch between olfactory sensory neuron (OSN) axons and M/T cell dendrites in Kir2.1-off mice.
(A) Models of connectivity between OSN axons and mitral/tufted cell dendrites. i, In the wild type, each glomerulus receives input from axons expressing the same odorant receptors (ORs; color coded), which are connected to the same primary dendrites of the mitral/tufted cells. ii, Divergent projection of OSN axons does not influence dendritic innervation such that the primary dendrites receive input from OSNs expressing different ORs. iii, Axon-dendritic connection is made through cross-glomerular matching such that the same dendrite is always innervated by OSNs expressing the same OR. iv, Matching axon-dendritic connection is restricted only in the glomeruli. (B) Confocal images of olfactory bulb sections from mice carrying homozygotic Olfr160-IRES-tauGFP (M72) allele. Immunofluorescent signals show GFP (green), DAPI (blue), and OMP (red) in control (i and ii) and Kir2.1-off (iii and iv) mice. Dotted circles circumscribe the glomeruli containing green fibers. Glomeruli are identified based on the density of periglomerular cell nuclei. Arrows point to fibers in the glomerular layer that are not counted toward quantification. Scale bar, 50 µm. v. Quantification of the overlap between OMP signals and GFP signal in individual glomeruli in the control and Kir2.1-off mice. vi. Quantification of the glomerular size (diameter) in control and Kir2.1-off mice (N = 3 animals each). Numbers in the panel indicate the total glomeruli counted. (C) Glomerular occupancy by OSN axons. Immunofluorescent staining in Ctrl (i) and Kir2.1-off (ii) mice to label Olfr160-IRES-tauGFP (M72) axons (green). Spatial filters with 1-, 6-, 11-, and 16-pixel radii were applied to obtain filtered images. After applying a binary threshold, any pixel that contains fluorescent signal is shown in black. Scale bar, 50 µm. Percentages of glomerular occupancy calculated as a function of filter radius are plotted for individual images (iii) for images shown in (i) and for all data (iv). Data are shown in mean (dashed line) ± standard deviation (shaded area). Two-way ANOVA applied for comparing Kir2.1-off and control, p=3.8E-134. (D) Same as C but for mitral cell dendrites (BDA, red). Two-way ANOVA applied for comparing Kir2.1-off and control, p=0.155. Note that black and red lines almost overlap in iii and iv. Scale bar, 50 µm.
-
Figure 5—source data 1
Quantification of axon and dendritic innervation of olfactory glomeruli.
- https://cdn.elifesciences.org/articles/60546/elife-60546-fig5-data1-v2.xlsx
Figure 5—figure supplement 1
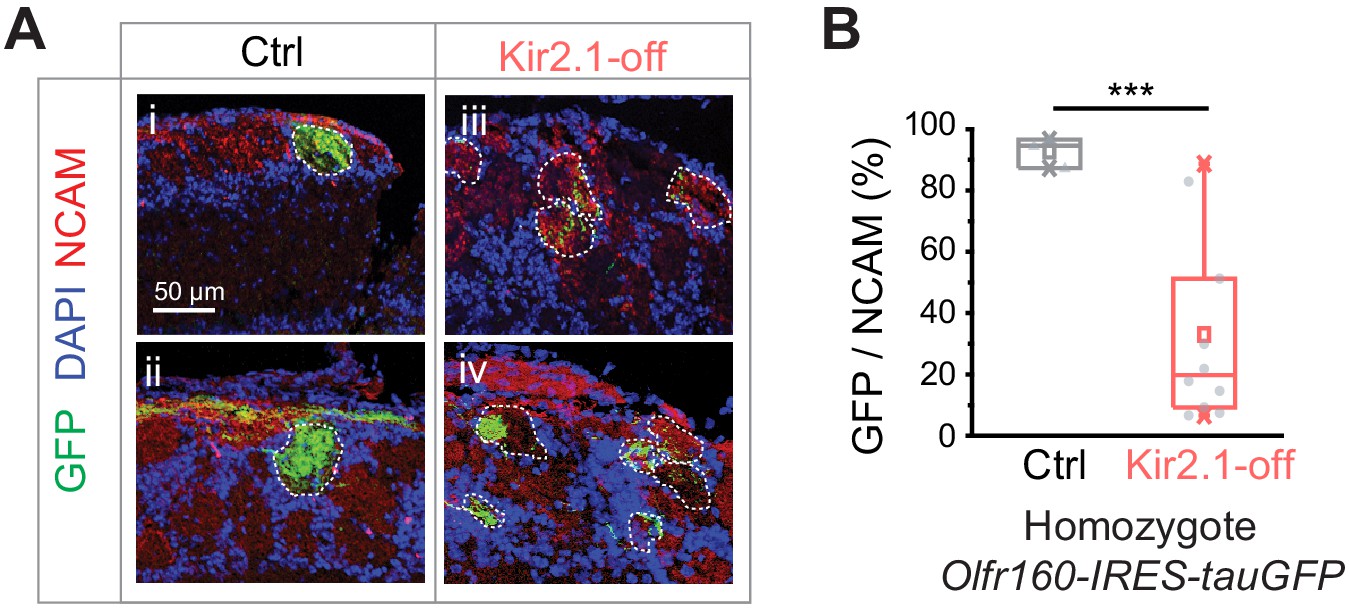
Olfactory sensory neuron (OSN) projection patterns in the Kir2.1-off animals.
(A) Confocal images of olfactory bulb sections from mice homozygotic for the Olfr160-IRES-tauGFP (M72) allele. Immunofluorescent signals show GFP (green), DAPI (blue), and NCAM (red) in control (Ctrl; i and ii) and DOX-fed Kir2.1 (Kir2.1-off; iii and iv) mice. Dotted circles circumscribe the glomeruli containing green fibers. Glomeruli are identified based on the density of periglomerular cell nuclei. Scale bar, 50 µm. (B) Quantification of the overlap between NCAM signals and GFP signal in individual glomeruli in the control and Kir2.1-off mice (n = 3 animals each). One-way ANOVA performed. ***, p<0.001.
-
Figure 5—figure supplement 1—source data 1
Quantification of OSN axon projection in Kir2.1-off mice.
- https://cdn.elifesciences.org/articles/60546/elife-60546-fig5-figsupp1-data1-v2.xlsx
Figure 6 with 1 supplement
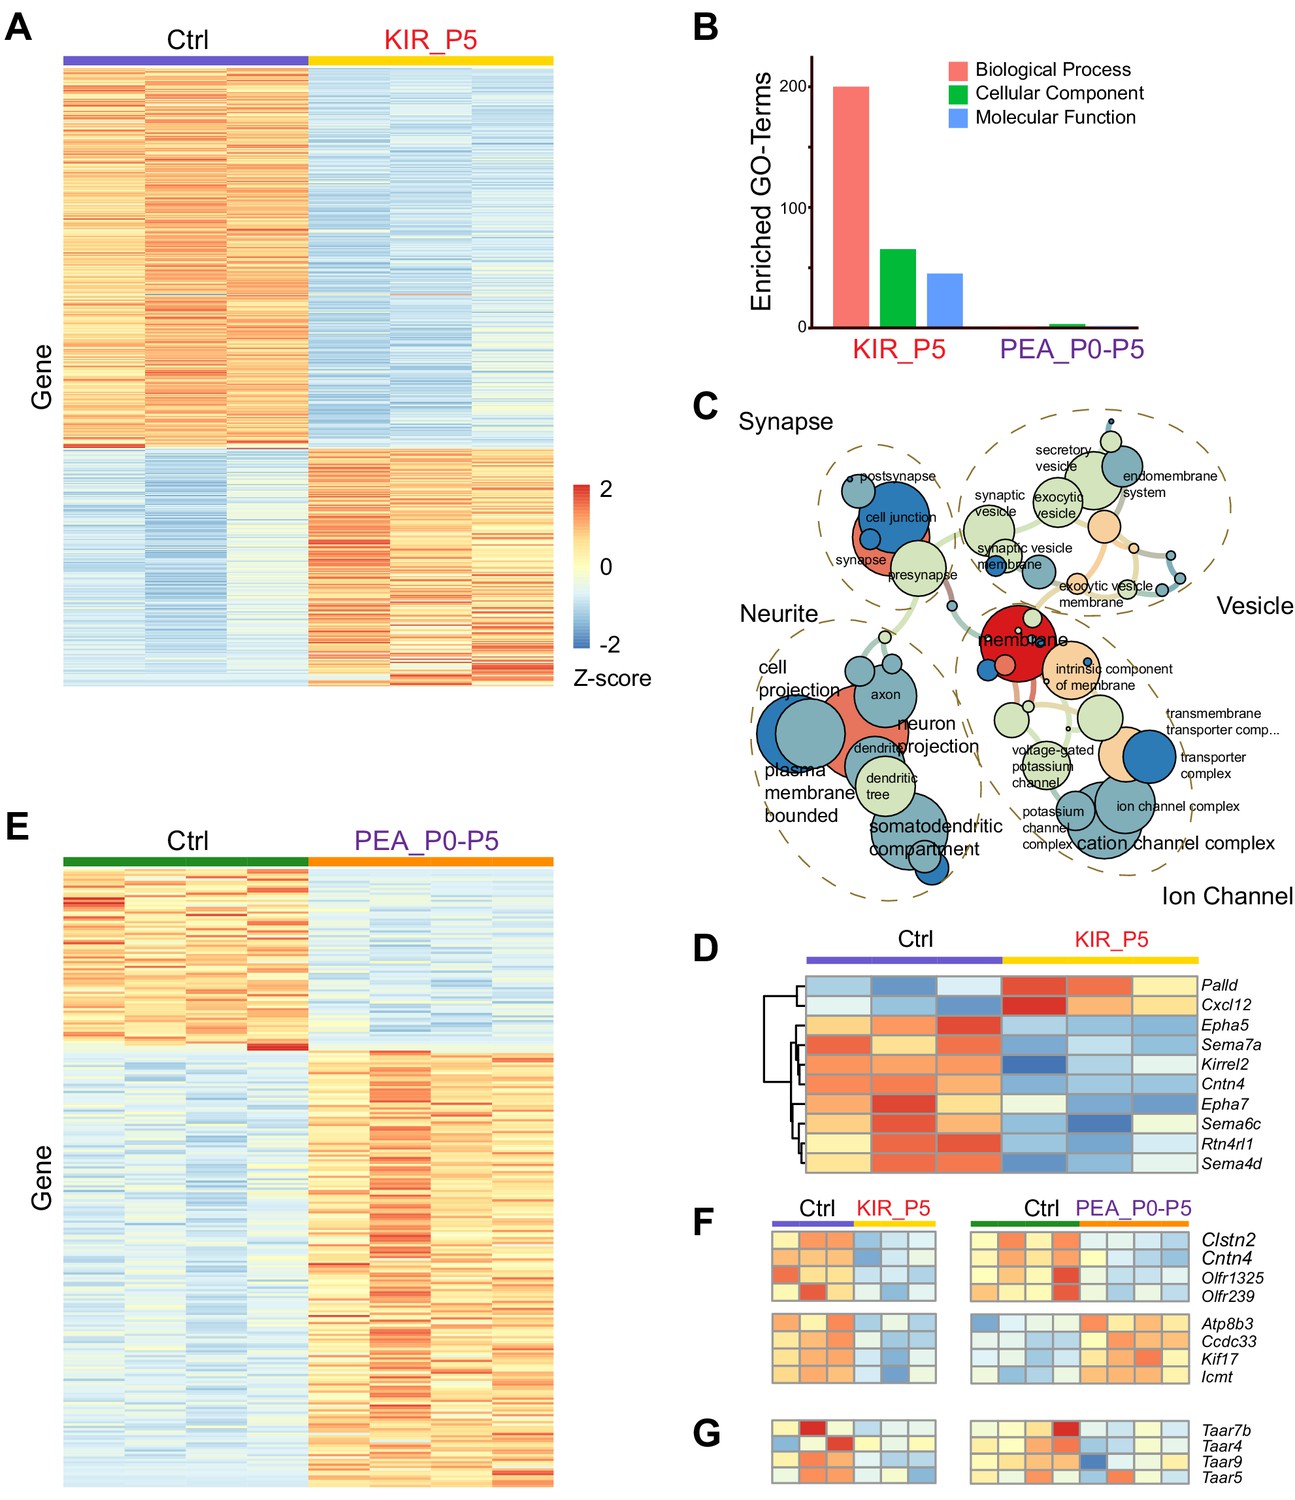
Transcriptomic changes modulated by neural activity.
(A) Heatmap of differentially expressed genes in the olfactory epithelia between control and Kir2.1 mice at P5. Each row is a gene. Each column is from one mouse. Color indicates Z-score. (B) Number of enriched GO term of differentially expressed genes for Kir2.1 and 2-phenylethylamine (PEA) data. (C) GO term analysis of the Kir2.1 data. GO term enrichment is represented as a hierarchical map built from differentially expressed genes in the group. The size of the circle represents –log2 p-value derived from Fisher’s test. Colors indicate the level of connectivity of a GO term. Only major GO terms are shown to simplify the graphs. (D) Heatmap showing differentially expressed genes associated with axon guidance in the Kir2.1 data. (E) Heatmap of genes differentially expressed between control and PEA-treated mice. (F) Heatmaps showing the expression of eight genes common to both Kir2.1 and PEA data. (G). Heatmap showing the expression of four Taar genes in the two data sets. Note that the expression of these four genes were not identified as statistically significant.
Figure 6—figure supplement 1
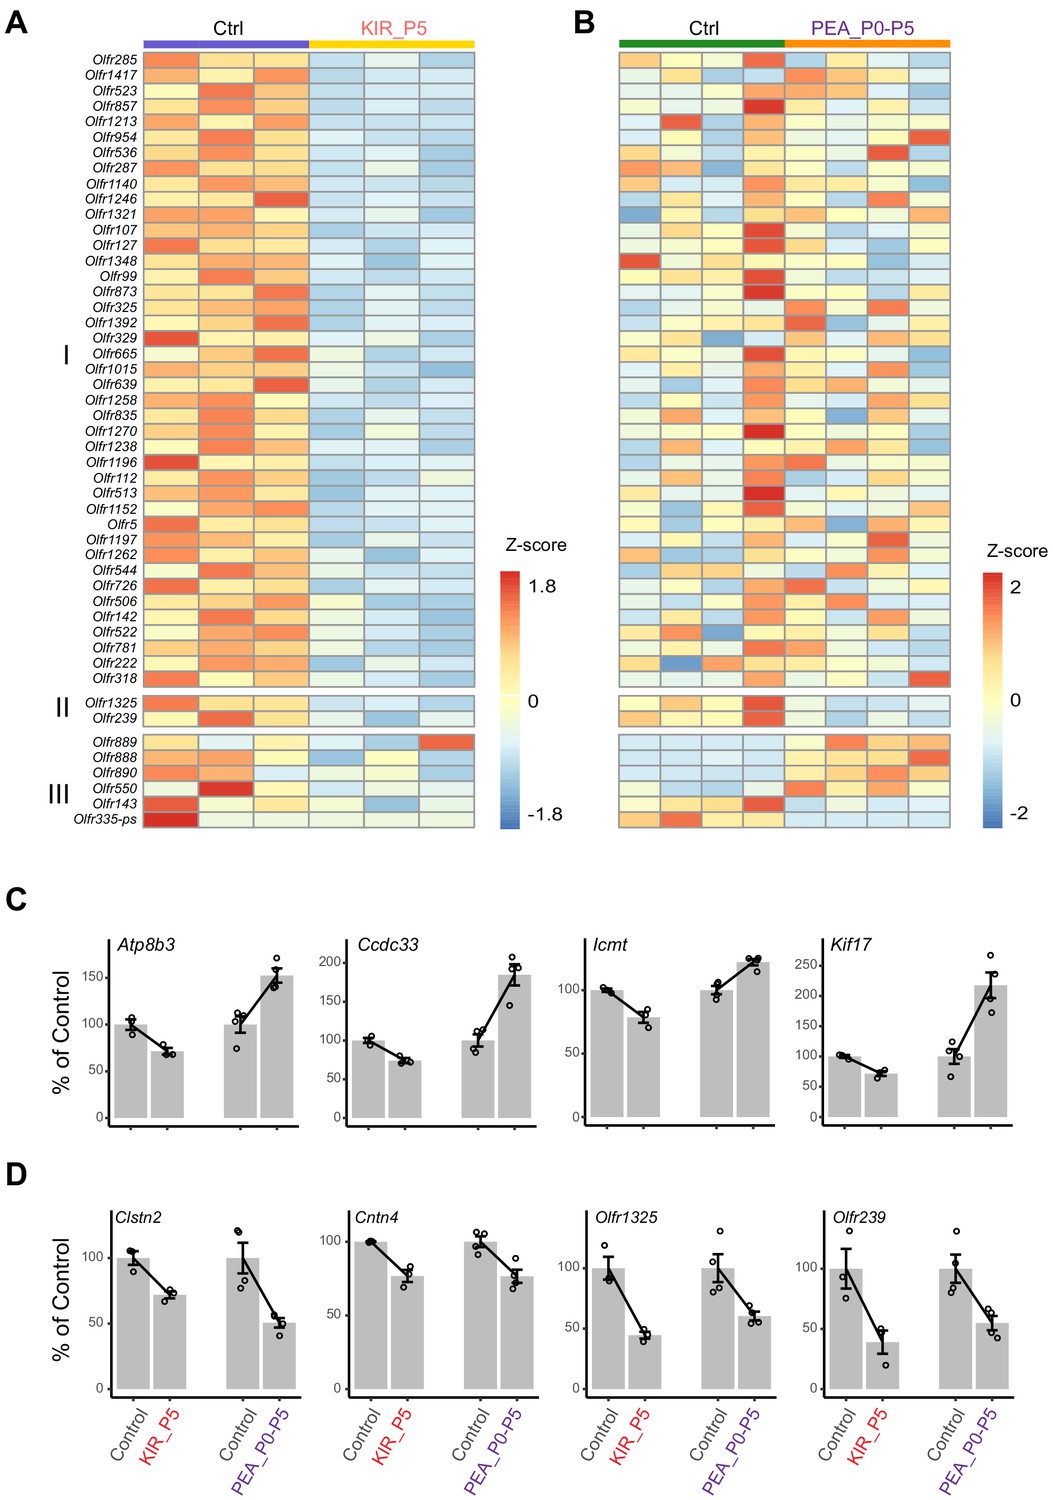
Differentially expressed genes.
(A and B) Differentially expressed odorant receptor genes at P5 in the Kir2.1 (A) and 2-phenylethylamine (PEA)-exposed (P0–P5) mice (B). Changes of Group I genes were statistically significant in the Kir2.1 mice. Group II genes were significant in both the Kir2.1 and the PEA-exposed mice. Group III was only significant in the PEA-exposed group. (C) Expression level of four genes that are significant in both experiment but show opposite change in the Kir2.1 and PEA-exposed animals. (D) Expression level of four genes that show the same change in the two experiments.
Figure 7 with 1 supplement
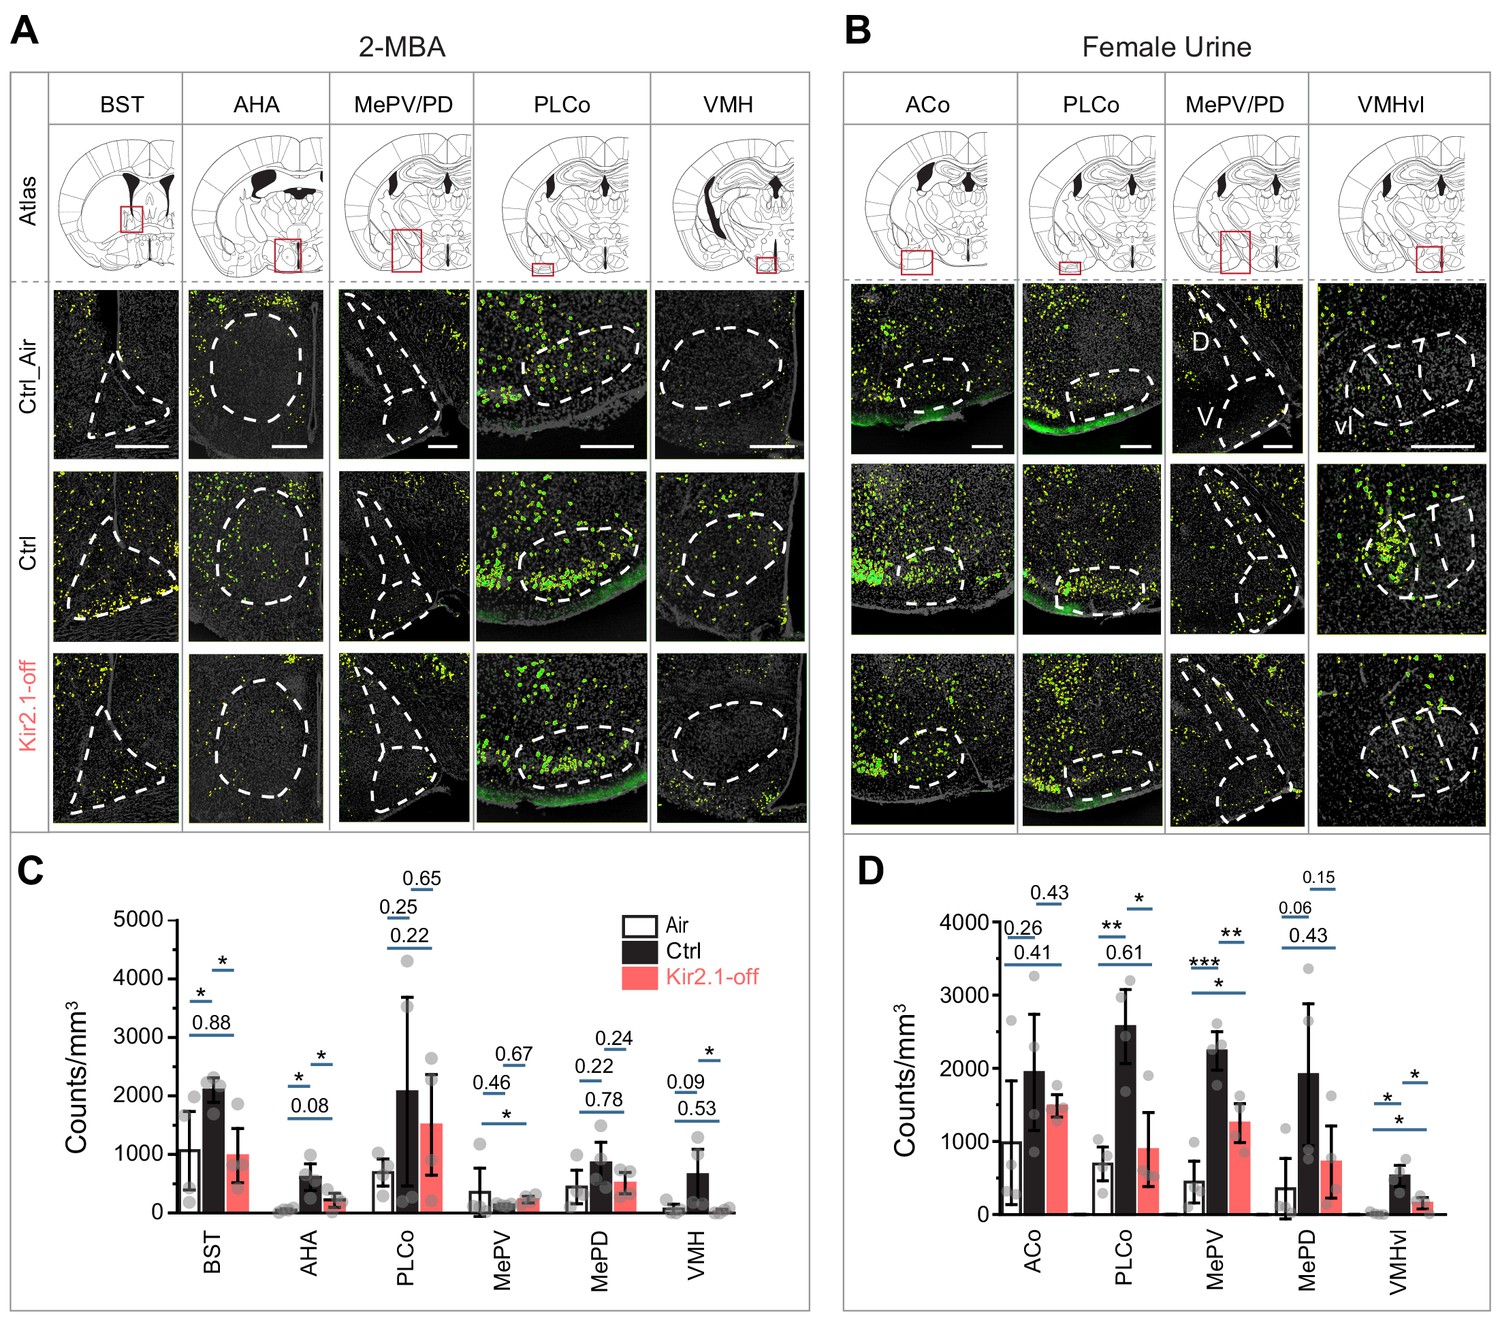
Suppression of spontaneous activities during development alters representation of innate odors in the adult brain.
(A and B) Immunofluorescent staining of phospho-S6 (green) of brain sections from Ctrl and Kir2.1-off animals treated with 2-MBA Green channel is enhanced to make cells visible (A) and female urine (B). Cell nuclei are counterstained with DAPI (gray). Top panel shows the atlas maps (adapted from The Mouse Brain Stereotaxic Coordinates) (Paxinos and Franklin, 2013), with the boxes indicating the brain regions in the lower panels. Scale bar, 300 µm. (C and D) Bar plots show the density of activated cells in different brain areas in Ctrl (C) and Kir2.1-off mice (D) (data are shown in mean ± SEM, n = 4 hemispheres). Individual data points are shown as gray dots. One-way ANOVA performed pairwise comparison. *, p<0.05; **, p<0.01; ***, p<0.01.
-
Figure 7—source data 1
Quantification of cells activated by innate odors in various brain regions in control and Kir2.1-off mice.
- https://cdn.elifesciences.org/articles/60546/elife-60546-fig7-data1-v2.xlsx
Figure 7—figure supplement 1
Altered representation of innate odors in the brain by suppression of spontaneous activity.
(A) Immunofluorescent staining of phospho-S6 (green) of brain sections from control (Ctrl) animals treated with air, control and Kir2.1-off animals treated with 2-phenylethylamine (PEA). Cell nuclei are counterstained with DAPI (gray). Scale bar, 500 µm. (B) Bar plots of the density of activated cells in different brain areas in the three sets of mice (data are shown in mean ± SEM, n = 6 hemispheres). One-way ANOVA performed. *, p<0.05; **, p<0.01; ***, p<0.01.
-
Figure 7—figure supplement 1—source data 1
Quantification of cells activated by 2-phenylethylamine in various brain regions of KIr2.1-off mice.
- https://cdn.elifesciences.org/articles/60546/elife-60546-fig7-figsupp1-data1-v2.xlsx
Figure 8

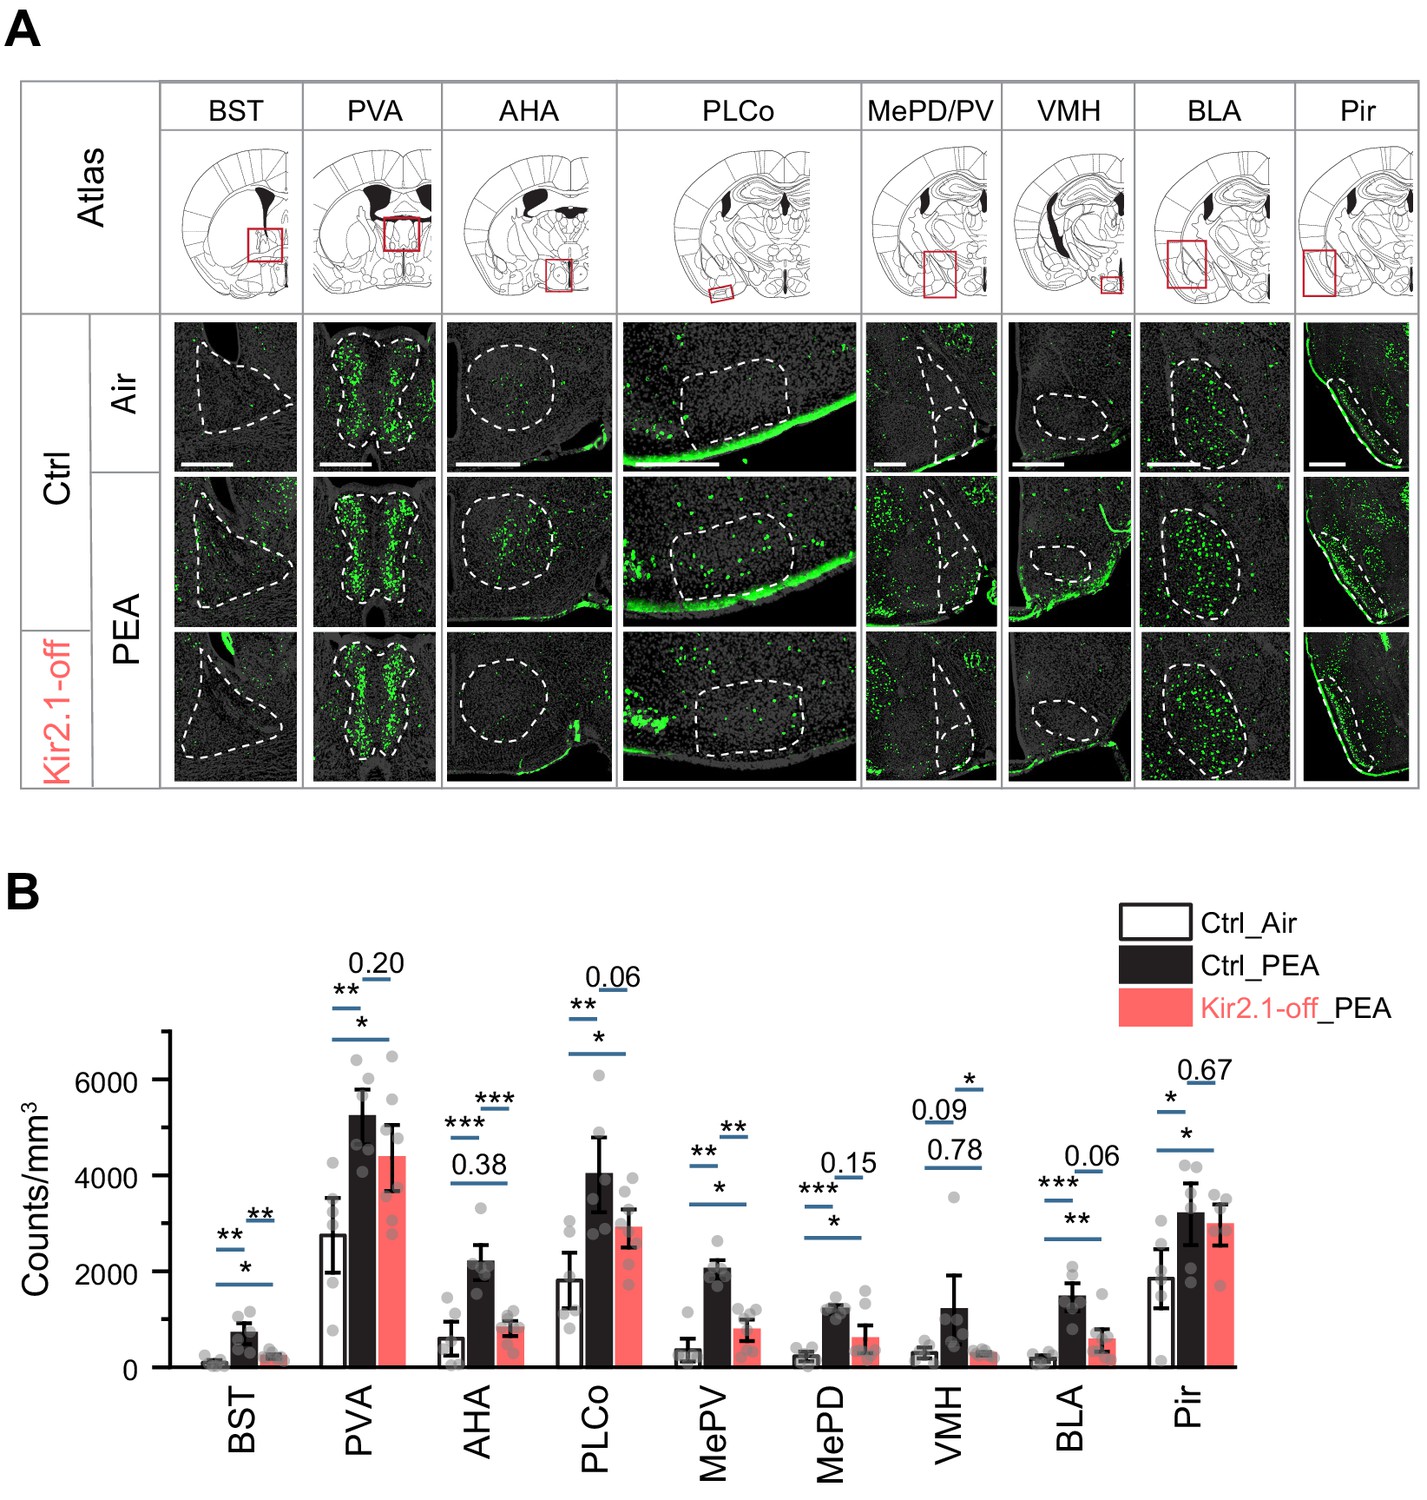
Early postnatal exposure to aversive odor alters representation of innate odors in the adult brain.
(A) Immunofluorescent staining of phospho-S6 (green) of brain sections from 2-phenylethylamine (PEA)-treated mice. Cell nuclei are counterstained with DAPI (gray). Scale bar, 500 µm. (B) Bar plot shows the density of activated cells in different brain areas (data are shown in mean ± SEM, n = 6 hemispheres). One-way ANOVA was applied to pairwise comparison. *, p<0.05; **, p<0.01; ***, p<0.01.
-
Figure 8—source data 1
Quantification of cells activated by innate odors in various brain regions in mice with postnatal odor exposure.
- https://cdn.elifesciences.org/articles/60546/elife-60546-fig8-data1-v2.xlsx
Figure 9
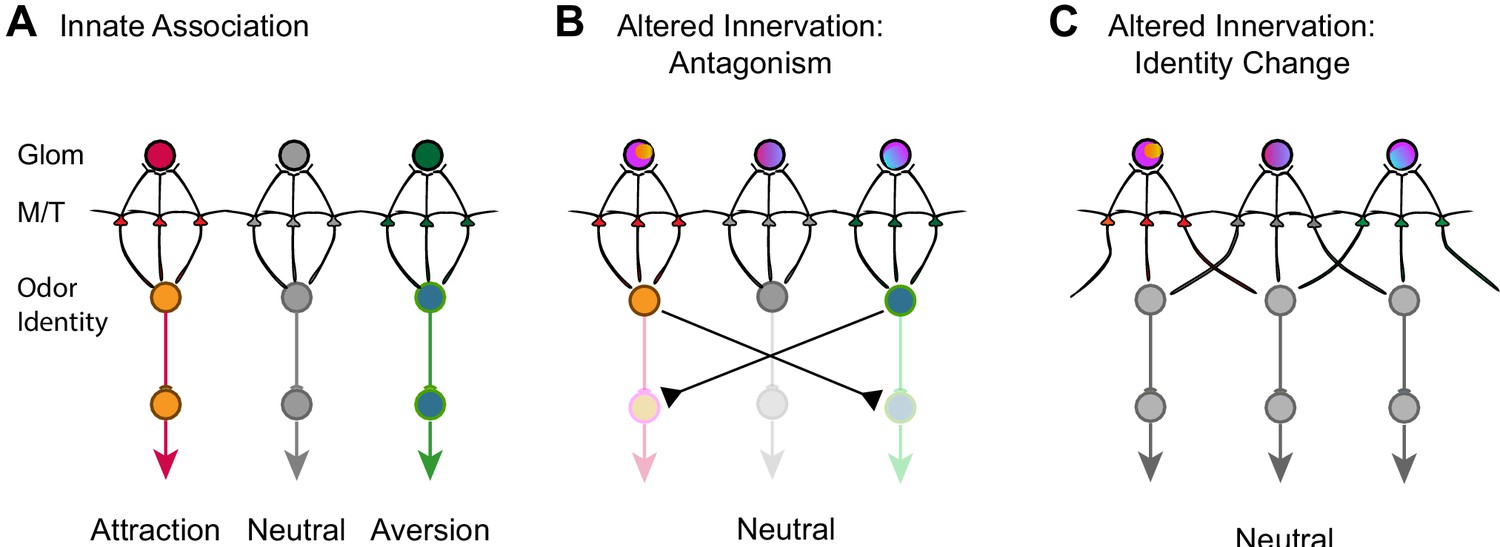
Models of encoding innate valence of odors.
(A) Wild-type connections model. The activation of specific glomeruli leads to the activation of specific sets of mitral/tufted cells that connect to behavioral centers. Color indicates different associated valence. For simplicity, only single glomeruli for each valence is depicted. Odor identities are abstracted as single nodes. (B) Altered axon innervation model. Activation pattern with altered axon projection leads to the activations of brain centers that drive opposing behaviors and abolished innate responses normally associated with the same odor. Rainbow colors of the glomeruli indicate mixed axon innervation. (C) Alternative altered axon innervation model. The change in activity pattern of the mitral/tufted cells is not the result of direct relay from the glomerular activation but the result of intercell interactions within the olfactory bulb. This change results in the recoding of odor identities (gray nodes) by the mitral cells, leading to the appetitive or aversive responses to be abolished.
Tables
Key resources table
| Reagent type (species) or resource | Designation | Source or reference | Identifiers | Additional information |
|---|---|---|---|---|
| Strain, strain background (M. musculus) | C57BL/6J | The Jackson Laboratory | RRID: IMSR_JAX:000664 | |
| Strain, strain background (M. musculus) | CD1 | The Jackson Laboratory | RRID: IMSR_JAX: 003814 | |
| Strain, strain background (M. musculus) | Omp-IRES-tTA | The Jackson Laboratory | RRID: IMSR_JAX: 017754 | |
| Strain, strain background (M. musculus) | tetO- Kcnj2-IRES-tauLacZ | The Jackson Laboratory | RRID: IMSR_JAX: 009136 | Also known as: tetO- Kir2.1-IRES-tauLacZ |
| Strain, strain background (M. musculus) | Olfr160-IRES-tauGFP | The Jackson Laboratory | RRID: IMSR_JAX:006678 | Also known as: M72-IRES-tauGFP |
| Other | Amyl acetate | Sigma-Aldrich | CAS# 628-63-7 | Abbr: AA |
| Other | Hexanal | Sigma-Aldrich | CAS# 66-25-1; | Abbr: HXH |
| Other | 2-Pentanone | Sigma-Aldrich | CAS# 107-87-9 | Abbr: PTO |
| Other | Valeraldehyde | Sigma-Aldrich | CAS# 110-62-3 | Abbr: VAH |
| Other | Butyl acetate | Sigma-Aldrich | CAS# 123-86-4 | Abbr: BAE |
| Other | 2-Heptanone | Sigma-Aldrich | CAS# 110-43-0 | Abbr: HPO |
| Other | Methyl butyrate | Sigma-Aldrich | CAS# 623-42-7 | Abbr: MBE |
| Other | Methyl propionate | Sigma-Aldrich | CAS# 554-12-1 | Abbr: MPE |
| Other | R(−)-Carvone | Sigma-Aldrich | CAS# 6485-40-1 | Abbr: (−) Car |
| Other | S(+)-Carvone | Sigma-Aldrich | CAS# 2244-16-8 | Abbr: (+) Car |
| Other | Methyl caproate | Sigma-Aldrich | CAS# 106-70-7 | Abbr: MCE |
| Other | Heptanal | Sigma-Aldrich | CAS# 591-78-6 | Abbr: HPH |
| Other | Methyl valerate | Sigma-Aldrich | CAS# 624-24-8 | Abbr: MVE |
| Other | 2-Phenylethylamine | Sigma-Aldrich | CAS# 64-04-0 | Abbr: PEA |
| Other | Eugenol | Sigma-Aldrich | CAS# 97-53-0 | Abbr: EUG |
| Other | 2-Methylbutyric acid | Sigma-Aldrich | CAS# 116-53-0 | Abbr: 2-MBA |
| Other | Isoamylamine | Sigma-Aldrich | CAS# 107-85-7 | Abbr: IAMM |
| Other | Trimethylamine | Sigma-Aldrich | CAS# 1184-78-7 | Abbr: TMA |
| Other | Female mouse urine | Fresh collected | Strain: c57bl/6 | Abbr: FU |
| Other | Male mouse urine | Fresh collected | Strain: c57bl/6 | Abbr: MU |
| Other | Coyote urine | Harmon scents | CCHCY4 | Abbr: CU |
| Other | Peanut butter | Jif Extra Crunchy | Abbr: PB | |
| Other | Maple flavor | Frontier natural products co-op | #23081 | Abbr: Maple |
| Other | Lemon flavor | Frontier natural products co-op | #23071 | Abbr: Lemon |
| Antibodies | Donkey anti-Rabbit 488 | Thermo Fisher Scientific | R37118; RRID:AB_2556546 | (1:1000) |
| Antibodies | Rabbit anti-NCAM | Millipore Sigma | ABN2181-100UG | (1:400) |
| Antibodies | Goat anti_OMP | Wako | 544–10001; RRID:AB_2315007 | (1:400) |
| Antibodies | Rat anti-NCAM | Millipore | AB5032 | (1:400) |
| Antibodies | Chicken anti-GFP | Abcam | ab13970-100; RRID:AB_300798 | (1:1000) |
| Antibodies | Rabbit anti MOR28 | Gilad Barnea Lab | RRID:AB_2636804 | (1:500) |
| Antibodies | Guinea pig anti-TAAR4 | Gilad Barnea Lab | N/A | (1:500) |
| Antibodies | Rabbit anti-Phospho-S6 (Ser235/236) | Cell Signaling | 4854; RRID:AB_390782 | (1:1000) |
| Antibodies | Goat anti-Guinea Pig Alexa Fluor 488 | Thermo Fisher Scientific | A-11073; RRID:AB_2534117 | (1:1000) |
| Antibodies | Goat anti-Guinea Pig Alexa Fluor 568 | Thermo Fisher Scientific | A-11075; RRID:AB_2534119 | (1:1000) |
| Antibodies | DAPI | Thermo Fisher Scientific | D1306; RRID:AB_2629482 | (1:1000) |
| Antibodies | TOTO-3 | Thermo Fisher Scientific | T3604 | (1:1000) |
| Antibodies | Dextran, Biotin, 3000 MW, Lysine Fixable | Thermo Fisher Scientific | D7135 | |
| Antibodies | Streptavidin, Alexa Fluor 568 conjugate | Thermo Fisher Scientific | S11226; RRID:AB_2315774 | (1:1000) |
| Other | Doxycycline diet | Envigo | TD.120046 | |
| Other | C and B Metabond Quick Adhesive Cement System | Parkell | Cat# UN1247 | |
| Other | 3 p peptide | United Peptide | biotin-QIAKRRRLpSpSLRApSTSKSESSQK | 25 nM |
| Other | Isoflurane | Patterson Veterinary | 07-893-1389; CAS# 26675-46-7; | 2–5% |
| Other | Xylazine | Patterson Veterinary | 07-893-2121 | 10 mg/kg |
| Other | Ketamine | Vedco | VINV-KETA-0VED | 100 mg/kg |
| Software and algorithms | OriginPro | Origin Lab | RRID:SCR_014212 | https://www.originlab.com/Origin |
| Software and algorithms | MATLAB | Mathworks | RRID:SCR_001622 | https://www.mathworks.com/ |
| Software and algorithms | Custom MATLAB scripts | Yu Lab | N/A | |
| Software and algorithms | ImageJ (Fiji) software | NIH | RRID:SCR_002285 | |
| Software and algorithms | R 4.0.3 | R Project for Statistical Computing | RRID:SCR_001905 | https://www.r-project.org/ |
| Software and algorithms | Salmon | https://combine-lab.github.io/salmon/ | ||
| Software and algorithms | ENSEMBL | https://www.ensembl.org/index.html | RRID:SCR_002344 | |
| Software and algorithms | tximport | https://www.bioconductor.org/packages/release/bioc/html/tximport.html | RRID:SCR_016752 | |
| Software and algorithms | DESeq2 | https://bioconductor.org/packages/release/bioc/html/DESeq2.html | RRID:SCR_015687 | |
| Software and algorithms | GOSeq | https://bioconductor.org/packages/release/bioc/html/goseq.html | RRID:SCR_017052 | |
| Software and algorithms | biomaRt | https://bioconductor.org/packages/release/bioc/html/biomaRt.html | RRID:SCR_019214 | |
| Software and algorithms | Gephi | https://gephi.org/ | SCR_004293 | |
| Software and algorithms | pheatmap | https://rdrr.io/cran/pheatmap/ | RRID:SCR_016418 | |
| Software and algorithms | rgexf | https://gvegayon.github.io/rgexf |
Additional files
Download links
A two-part list of links to download the article, or parts of the article, in various formats.
Downloads (link to download the article as PDF)
Open citations (links to open the citations from this article in various online reference manager services)
Cite this article (links to download the citations from this article in formats compatible with various reference manager tools)
Acquisition of innate odor preference depends on spontaneous and experiential activities during critical period
eLife 10:e60546.
https://doi.org/10.7554/eLife.60546


