Cryo-EM analysis of PIP2 regulation in mammalian GIRK channels
- Laboratory of Molecular Neurobiology and Biophysics, The Rockefeller University, Howard Hughes Medical Institute, United States
Figures
Figure 1 with 3 supplements

GIRK2 adopts an extended conformation in the absence of PIP2.
(A) Conformational changes upon PIP2 binding in the Kir2.2 channel viewed from side with the extracellular side above (Left: the extended conformation without PIP2, PDB: 3JYC. Right: the docked conformation upon PIP2 binding, PDB: 3SPI). Four PIP2 molecules are shown as sticks and colored according to atom type: carbon, yellow; phosphorous, orange; and oxygen, red. The CTD translates towards the TMD by 6 Å upon PIP2 binding. A set of reference atoms (Asp72 and Lys220 α-carbons) are highlighted as blue spheres in each structure. (B) Side and top views of the cryo-EM structure of the GIRK2 channel in an extended conformation.
Figure 1—figure supplement 1
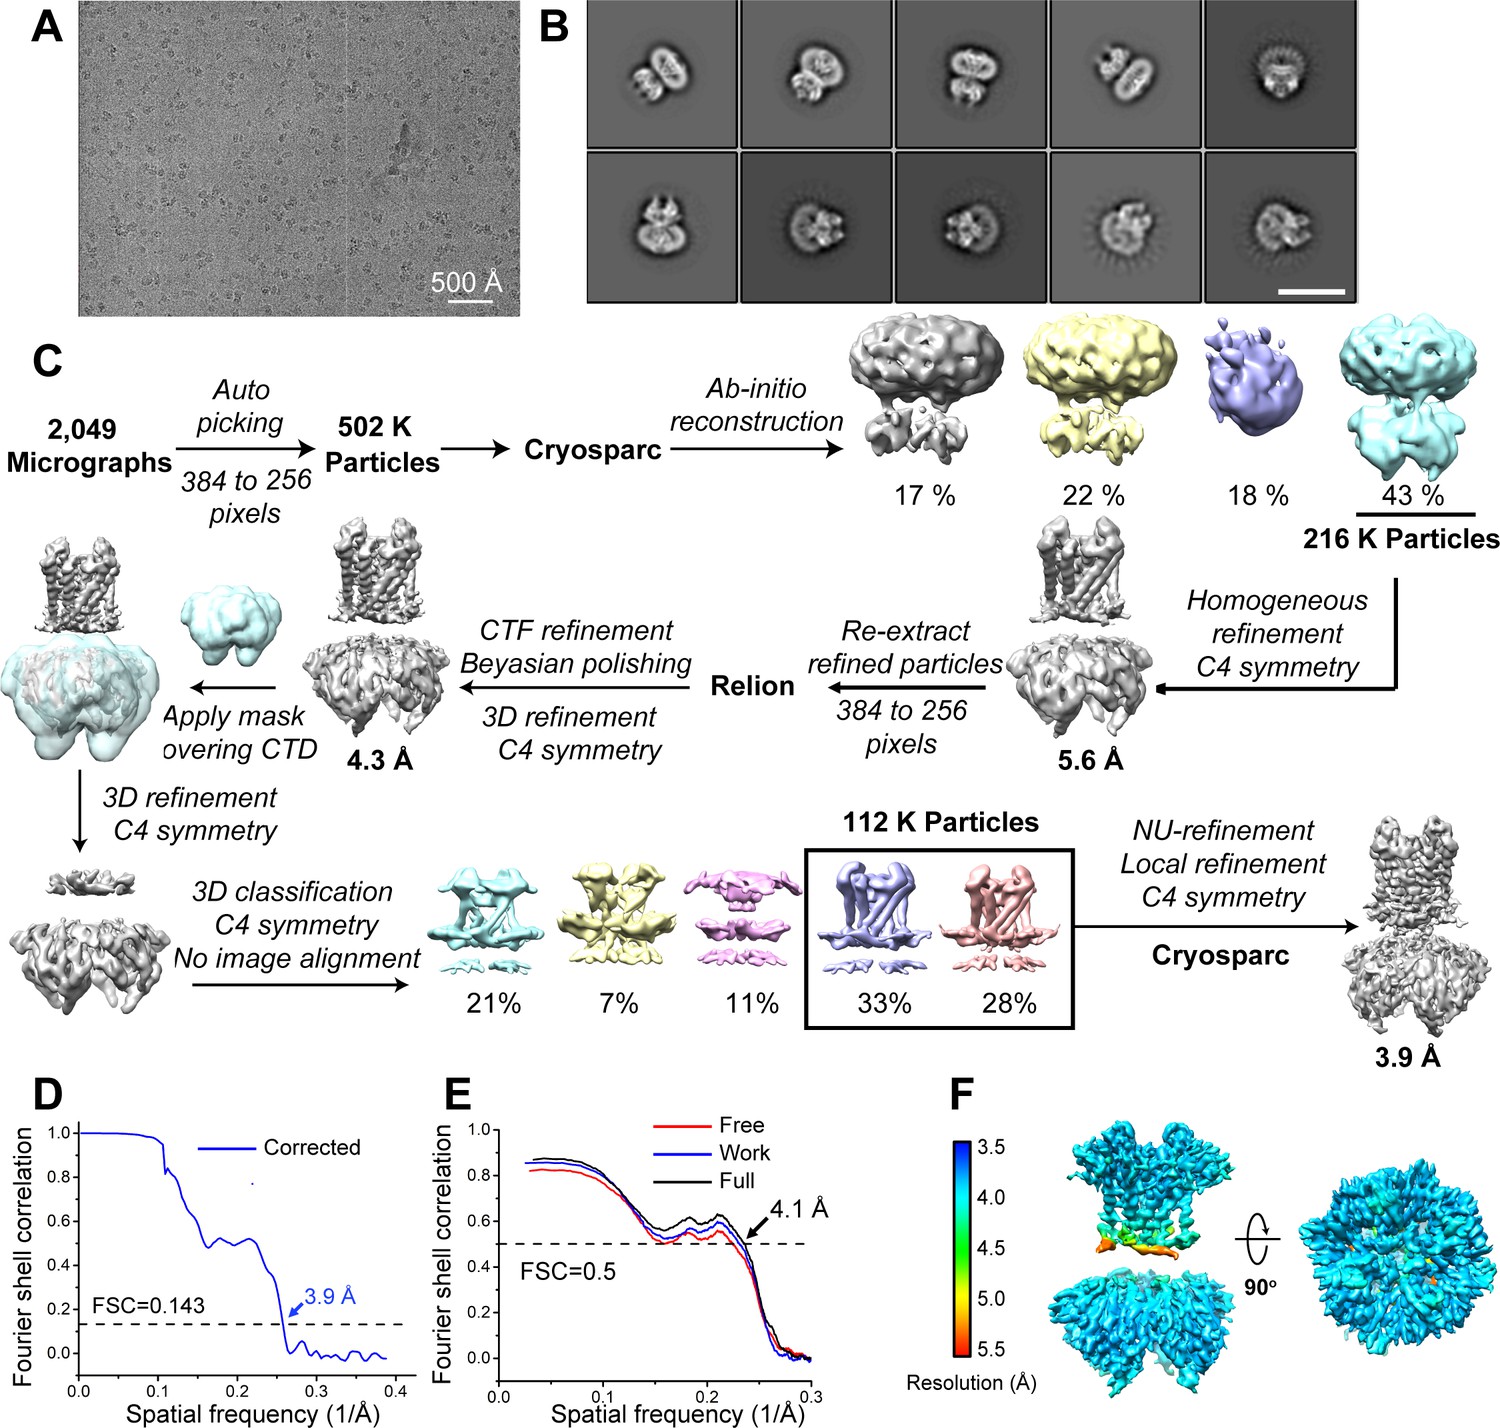
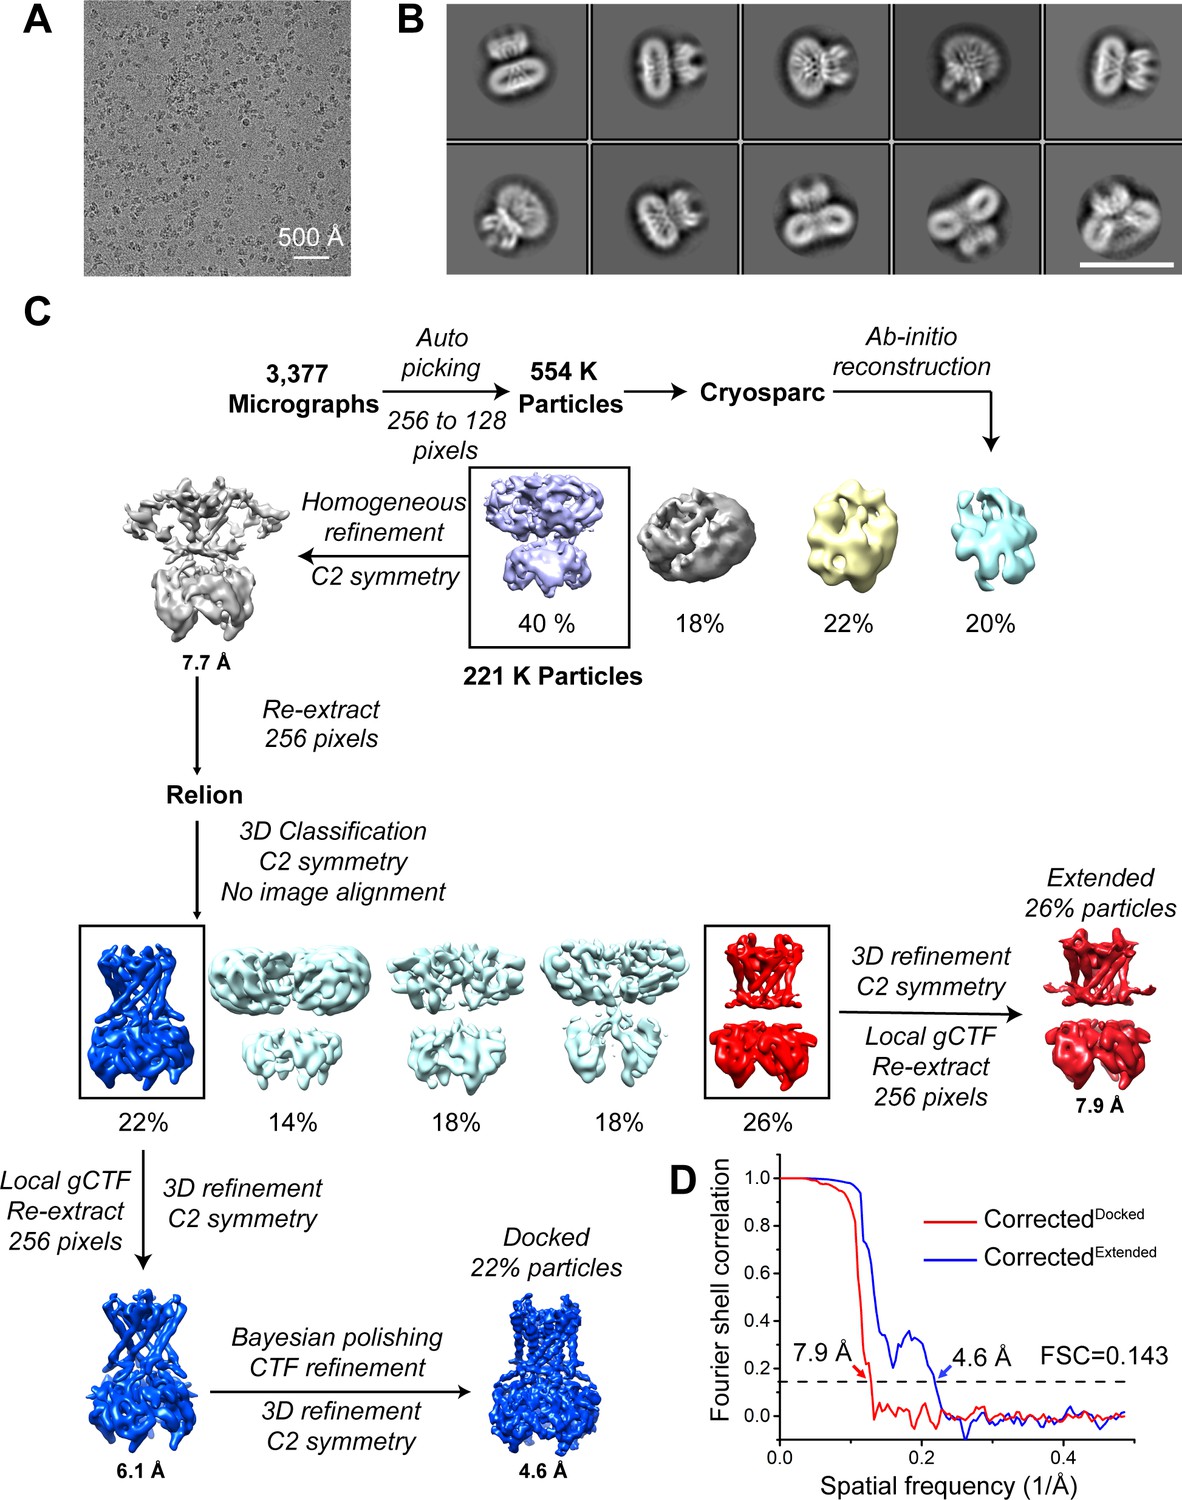
Cryo-EM analysis of the GIRK2 channel in the extended conformation, related to Figure 1.
(A) Representative cryo-EM image of the GIRK2 channel in the absence of PIP2. (B) Selected 2D-class averages of the GIRK2 channel. The scale bar is 17.5 nm. (C) Cryo-EM data processing workflow. (D) Gold-standard FSC curve after correction for masking effects. The resolution was estimated based on the FSC = 0.143 criterion. (E) Cross-validation FSC curves for the GIRK2 channel: blue curve, refined model versus half map one used for refinement (Work); red curve, refined model versus half map two not used for refinement (Free); black curve, refined model versus the combined map (Full). The similarity of the ‘work’ and ‘free’ curves suggests no substantial over-fitting. The correlation is above 0.5 up to a resolution of 4.1 Å. (F) Local resolution map calculated using Relion3.
Figure 1—figure supplement 2
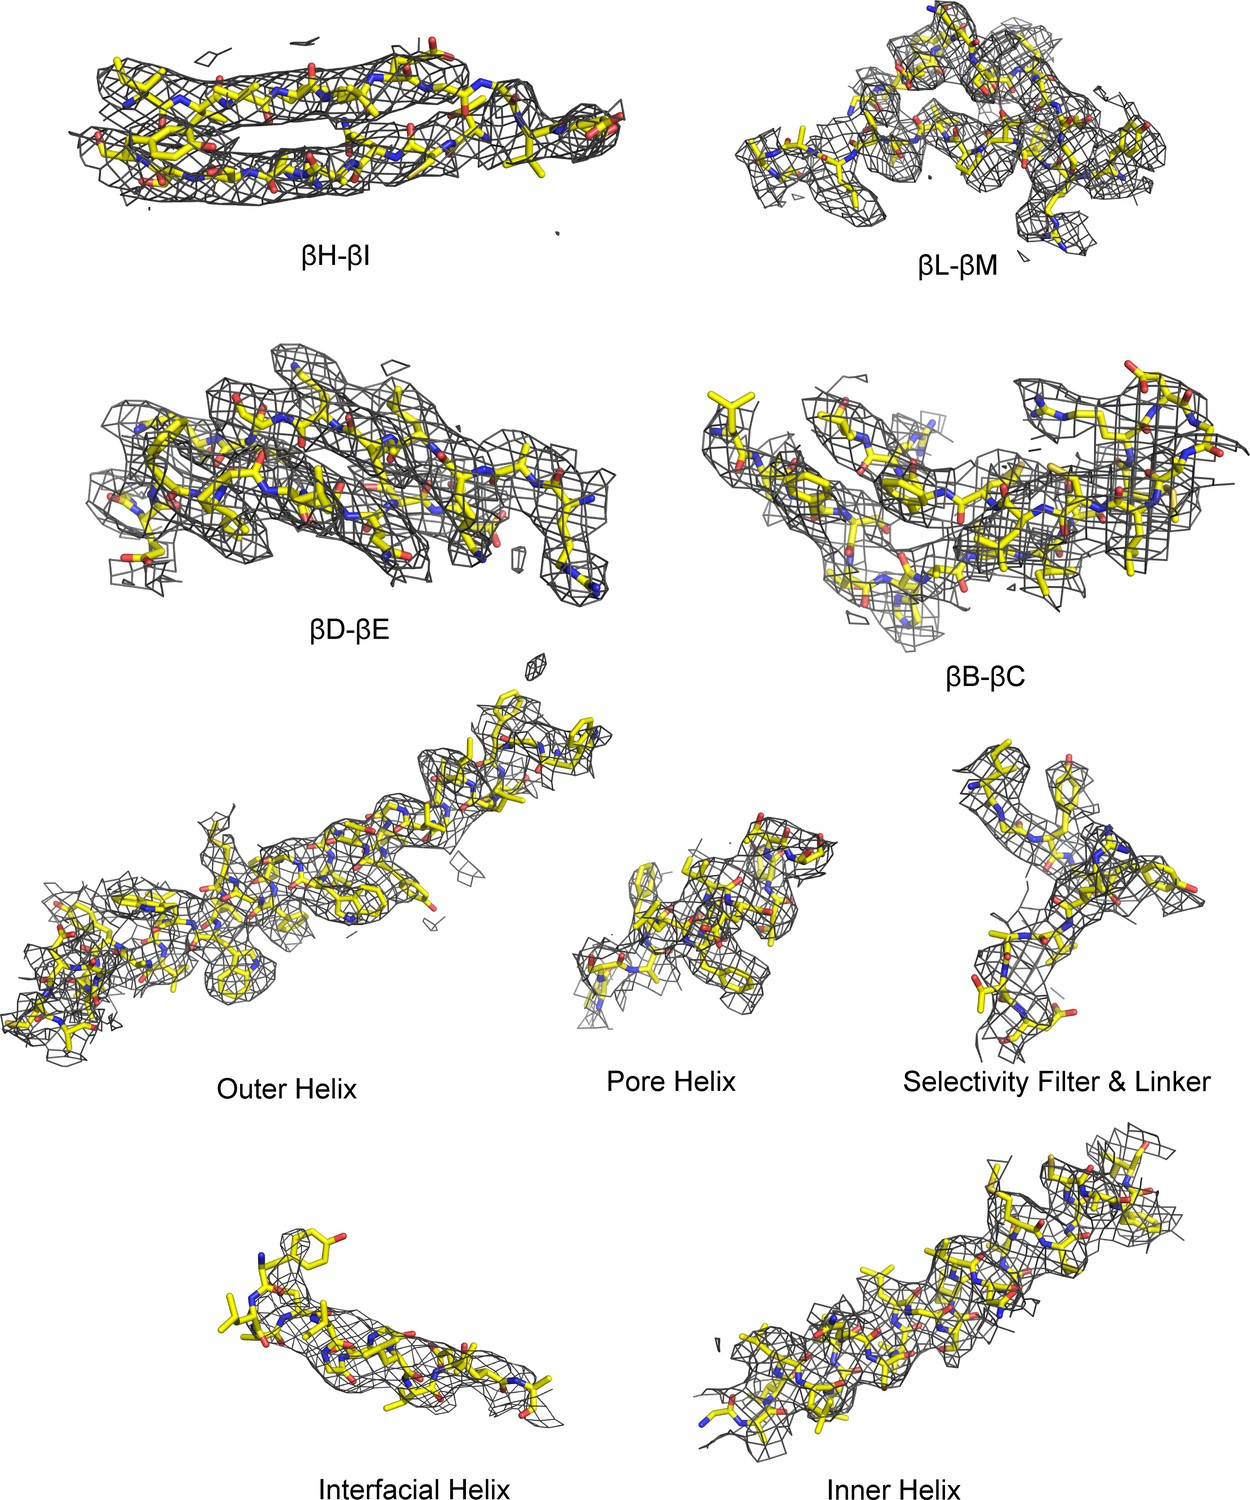
Cryo-EM densities for selected regions of the GIRK2 extended conformation (contour level 6.5 in Coot), related to Figure 1.
Figure 1—figure supplement 3
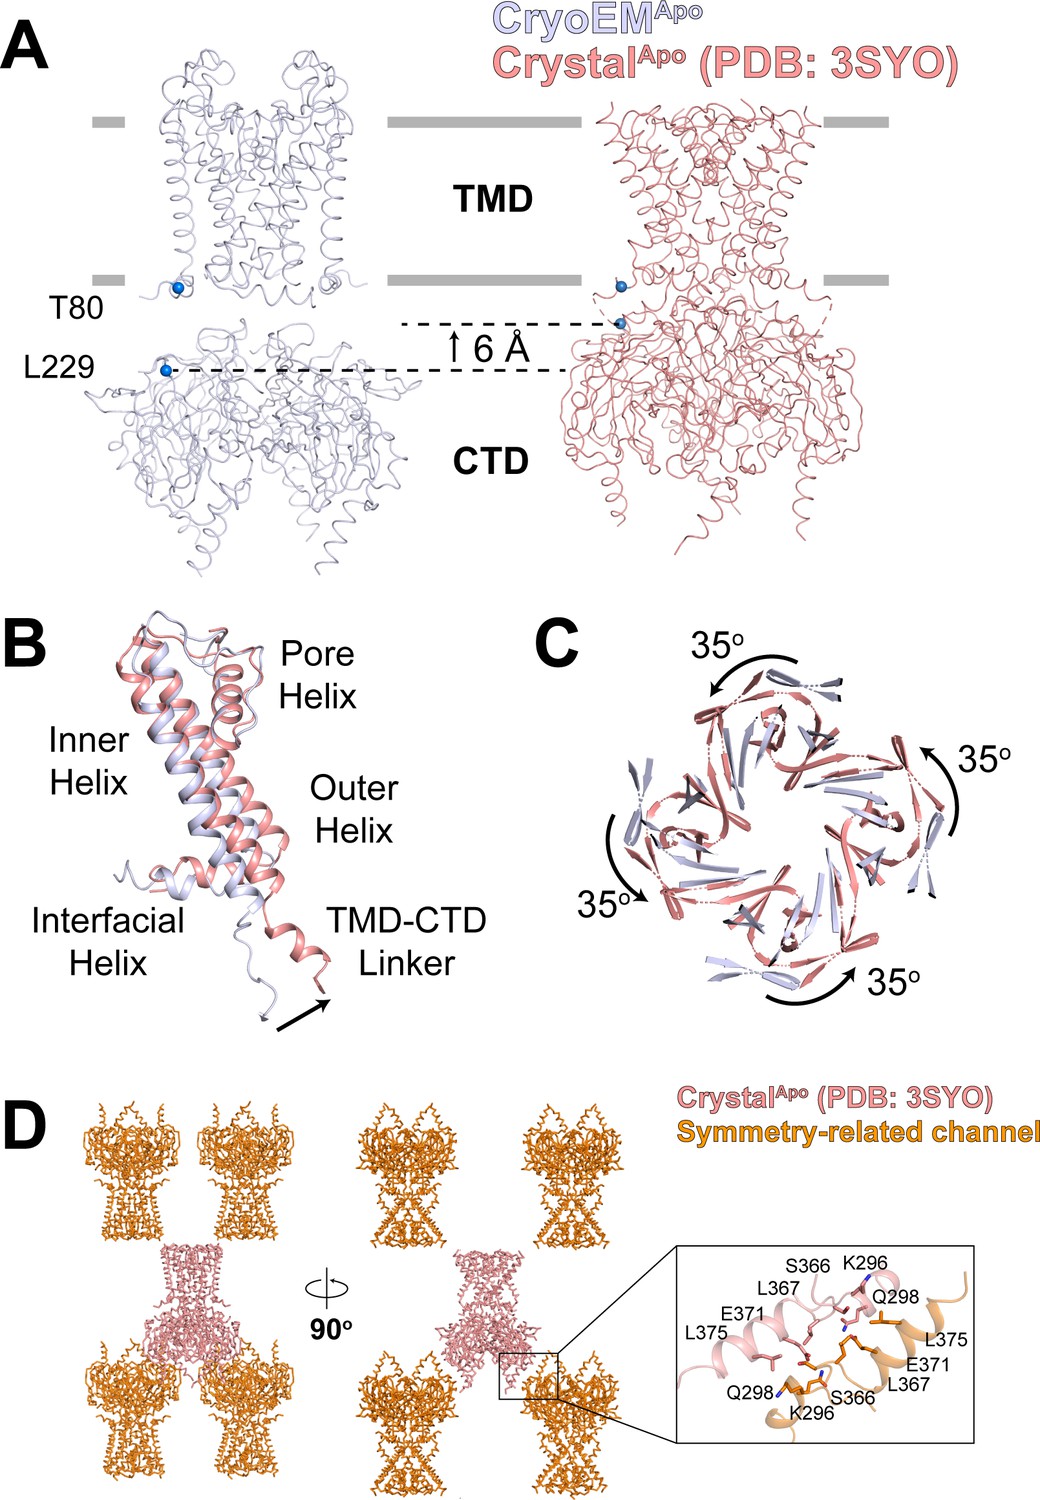
Structural comparison of the apo GIRK2 determined by cryo-EM (gray) and X-ray crystallography (salmon, PDB: 3SYO), related to Figure 1.
(A) Overall conformational changes viewed from side with the extracellular solution above. The lipid bilayer boundaries are shown as grey bars. A set of reference atoms (Thr80 and Leu229 α-carbons) are highlighted as blue spheres. The CTD in the crystal structure translates towards the TMD by 6 Å. (B and C) Conformational changes between cryo-EM and X-ray structures of apo GIRK2 in TMD (B) and CTD (C). (D) Crystal packing in the CrystalApo structure. The channel tetramer is colored salmon and symmetry-related tetramers are colored orange. The crystal contact interface is boxed and a zoomed-in view is shown.
Figure 2 with 1 supplement

GIRK2 conformation as a function of PIP2 concentration.
(A) Structural titration image analysis workflow. Representative images of GIRK2 channels recorded in the presence of 0, 0.25, 0.5, 0.75, 0.875 or 1 mM C8-PIP2. GIRK2 particles were automatically selected from the images (green circles). The extracted particles from the respective images were combined into a single titration dataset for 3D refinement with C4 symmetry in RELION. Using the angles and translations obtained from the 3D refinement, the particles from the titration dataset were classified into five classes. The extended classes are colored red and the docked class blue. (B) Representative cryo-EM images of GIRK2 in the presence of 0, 0.25, 0.5, 0.75, 0.875 or 1 mM C8-PIP2. Particles marked with a red circle were classified as extended, and those with a blue circle were classified as docked. (C) The fraction of particles classified as the docked conformation of GIRK2 is plotted against the concentration of C8-PIP2.
Figure 2—figure supplement 1
Reproducibility of the 3D classification of extended and docked classes of the GIRK2 channel, related to Figure 2.
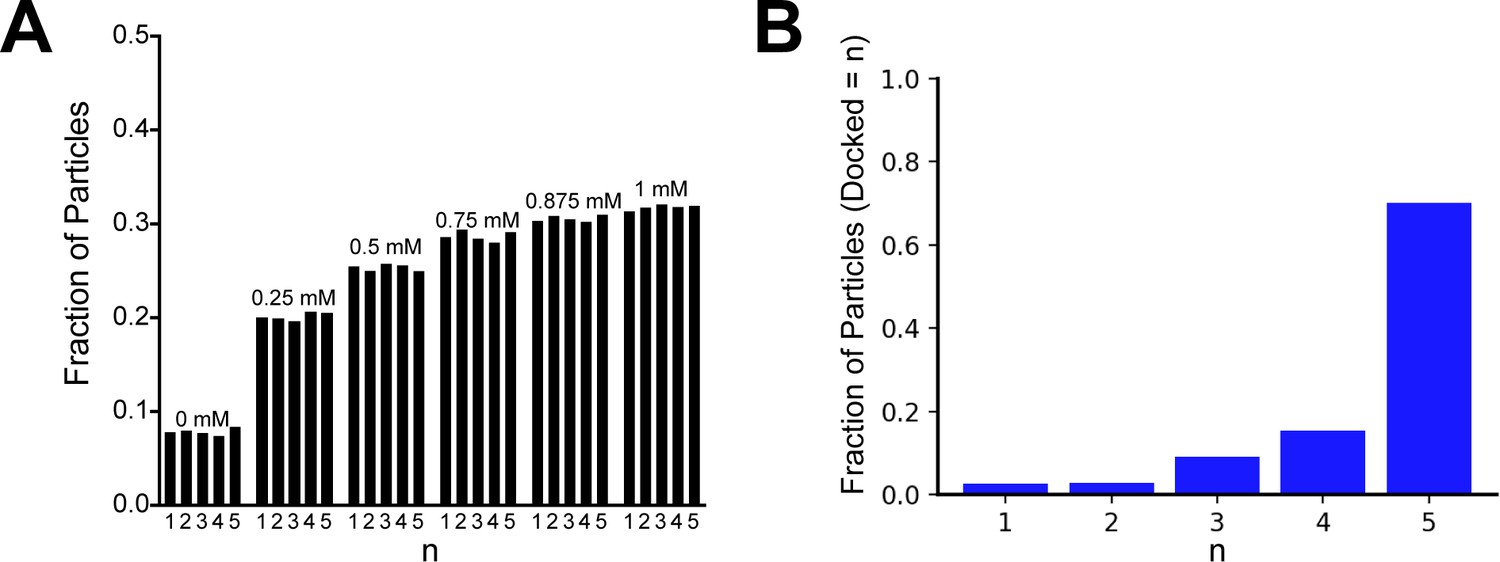
(A) Fraction of particles in the docked class from the titration dataset is plotted as a function of PIP2 concentration for five independent 3D refinement and classification runs. (B) Plot of the fraction of particles classified n times into the docked class during five independent 3D refinement and classification runs.
Figure 3 with 1 supplement
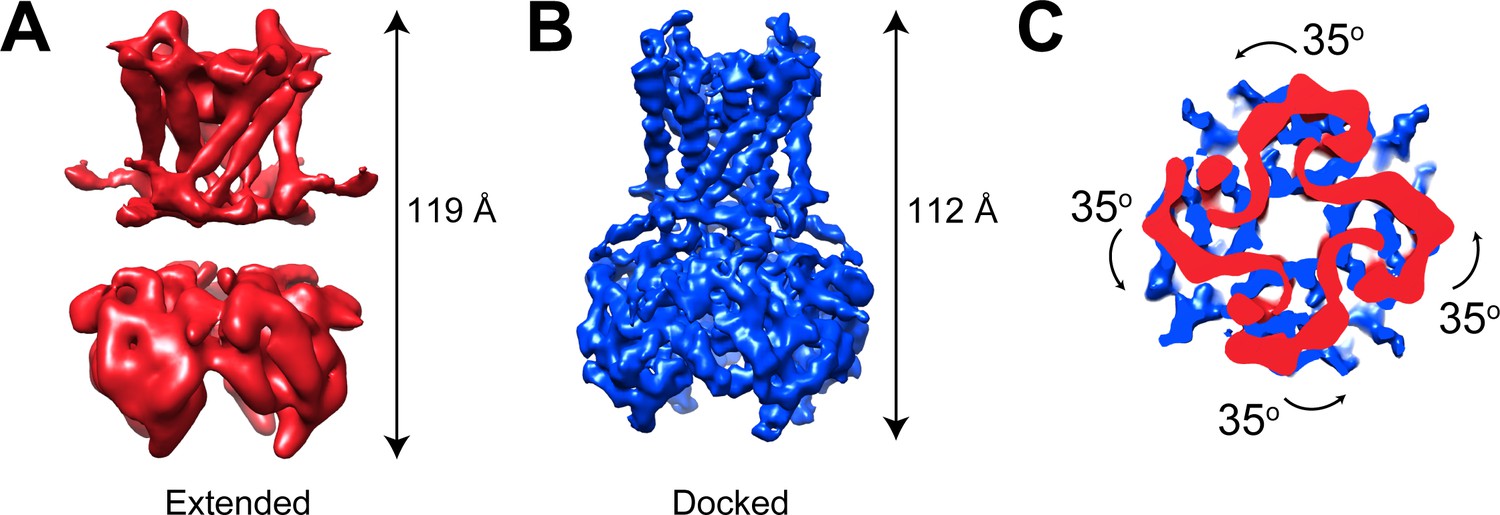
GIRK1/4 channels also form extended and docked conformations.
(A and B) Side views of the cryo-EM density map of the extended (A) and docked (B) conformations of the GIRK1/4 channel. (C) Top view of the CTD regions aligned with respect to the TMD reveals a 35° rotation from extended to docked conformations.
Figure 3—figure supplement 1
Cryo-EM analysis of the GIRK1/4 channel in the presence of 0.5 mM C8-PIP2, related to Figure 3.
(A) Representative cryo-EM image of the GIRK1/4 channel. (B) Selected 2D-class averages of the GIRK1/4 channel. The scale-bar is 17.5 nm. (C) Cryo-EM data processing workflow for the GIRK1/4 channel. (D) Gold-standard FSC curve after correction for masking effects. The resolution was estimated based on the FSC = 0.143 criterion.
Figure 4 with 3 supplements
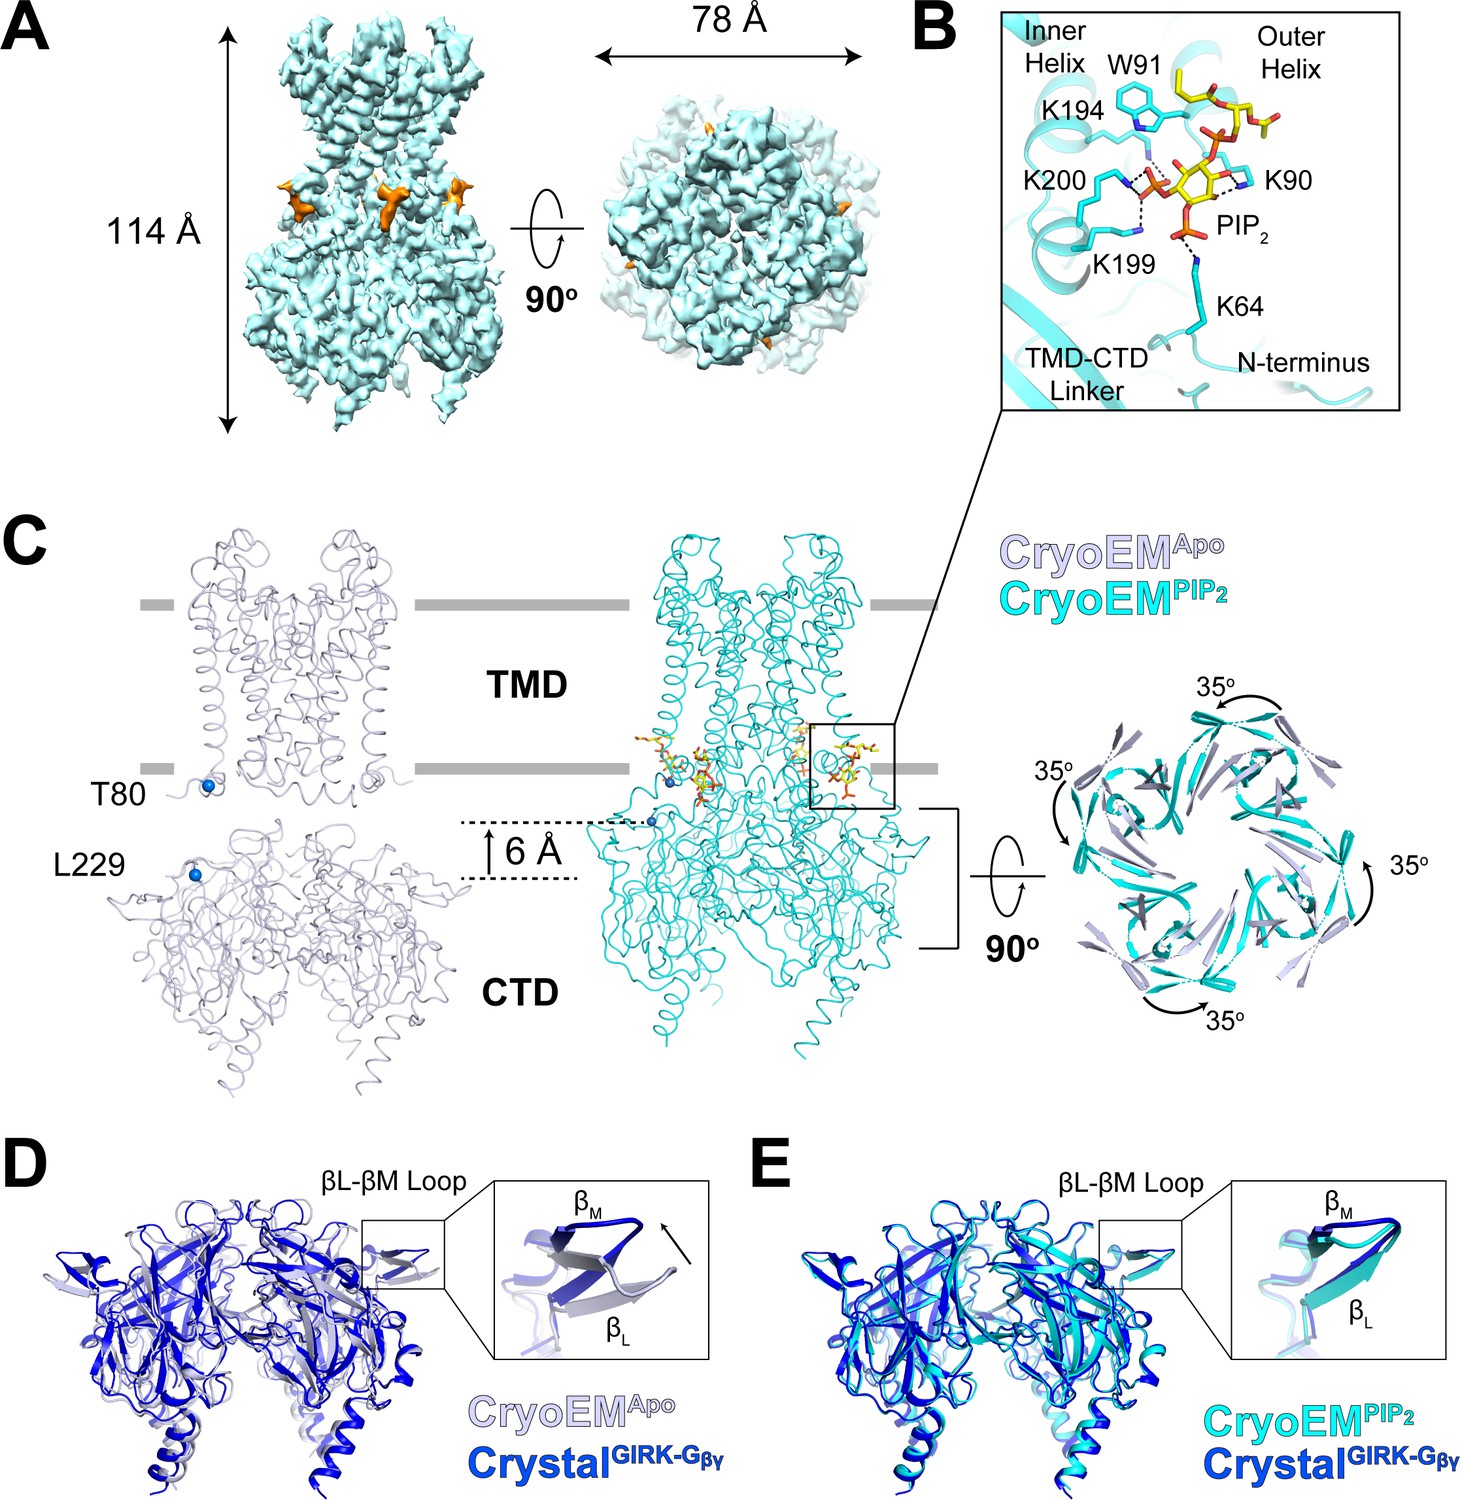
Conformational changes between the docked and extended GIRK2 channel upon PIP2 binding.
(A) Side and top views of the cryo-EM density map of the docked conformation of GIRK2 channel (cyan) with four bound PIP2 molecules (orange). The PIP2 acyl chains were only partially resolved. (B) Close-up view of the PIP2 binding pocket. PIP2 is shown as sticks and colored according to atom type (carbon, yellow; phosphorous, orange; and oxygen, red). The PIP2 interacting residues are also shown as sticks (carbon, cyan and nitrogen, blue). (C) Comparison of the extended (gray, no PIP2) and the docked (cyan, with 4 PIP2 bound) structures. The channel is viewed from the side with the extracellular side above. The lipid bilayer boundaries are shown as grey bars. Four PIP2 molecules are shown as sticks and colored as in panel (B). The PIP2 molecule in a similar orientation as in (B) is outlined by a black box. Upon PIP2 binding, the CTD in the extended structure translates towards the TMD by 6 Å accompanied by a 35° rotation viewed from the extracellular side. (D and E) Local conformational changes at the binding site for Gβγ in the βL-βM loop of GIRK2 CTD are shown by structural superposition. The CTD region of GIRK2 CryoEMApo, CryoEMPIP2 and CrystalGIRK-Gβγ structures are colored gray, cyan, and blue, respectively. Rearrangement of the βL-βM loop is indicated by an arrow.
Figure 4—figure supplement 1
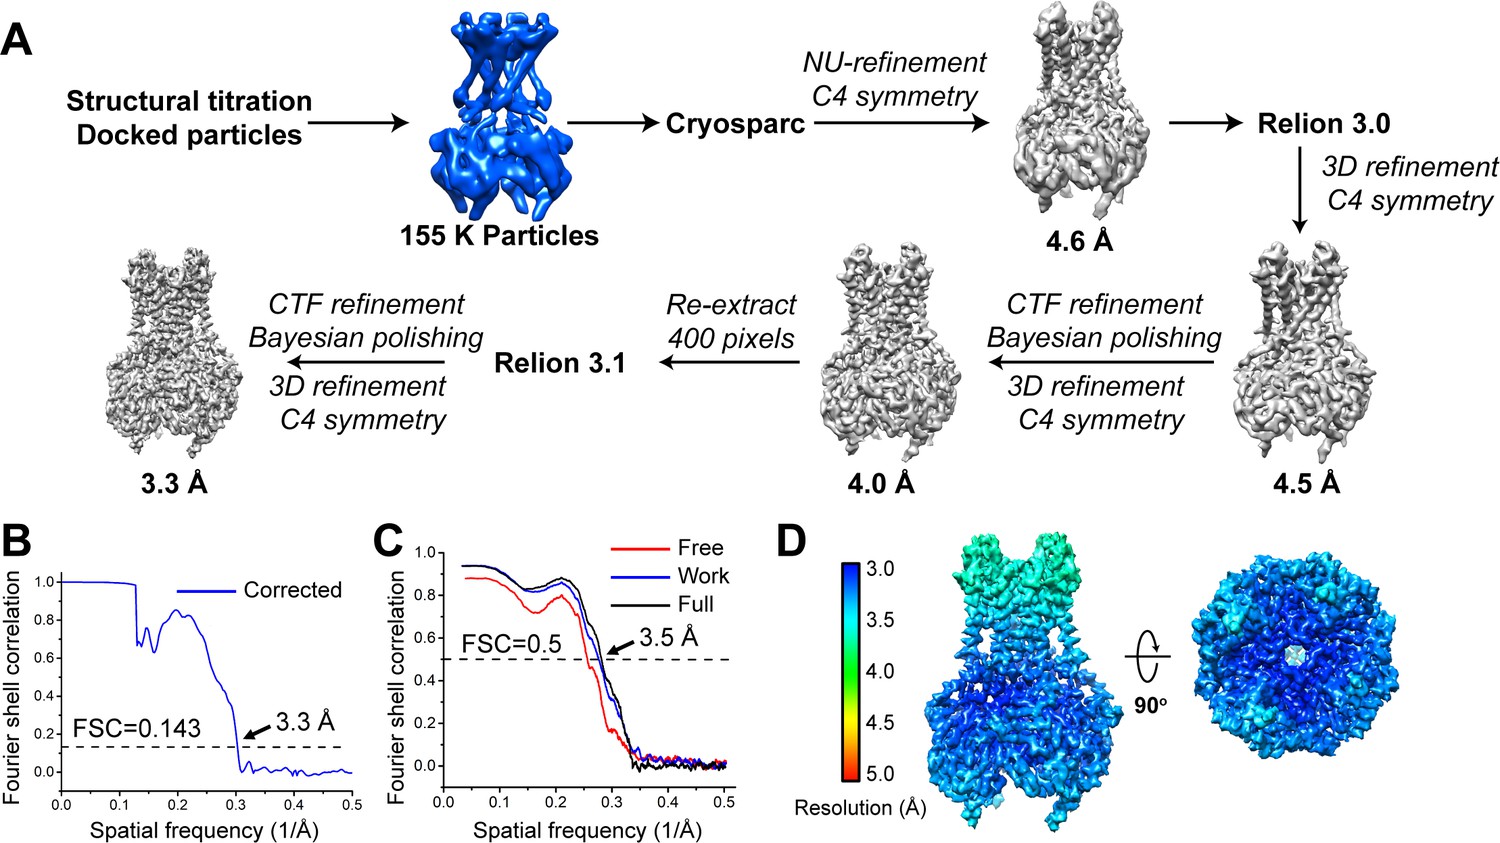
Cryo-EM analysis of the GIRK2 channel in the docked conformation, related to Figures 2 and 4.
(A) Cryo-EM data processing workflow for the GIRK2 channel. The 155 K particles correspond to all the particles classified as the docked class (class 5) in Figure 2A. (B) Gold-standard FSC curve after correction for masking effects. The resolution was estimated based on the FSC = 0.143 criterion. (C) Cross-validation FSC curves: blue curve, refined model versus half map one used for refinement (Work); red curve, refined model versus half map two not used for refinement (Free); black curve, refined model versus the combined final map (Full). The similarity of the ‘work’ and ‘free’ curves suggests no substantial over-fitting. The correlation is above 0.5 up to a resolution of 3.5 Å. (D) Local resolution map calculated using Relion3.
Figure 4—figure supplement 2

Cryo-EM densities for selected regions of the GIRK2 docked conformation (contour level 8.0 in Coot), related to Figures 2 and 4.
Figure 4—figure supplement 3
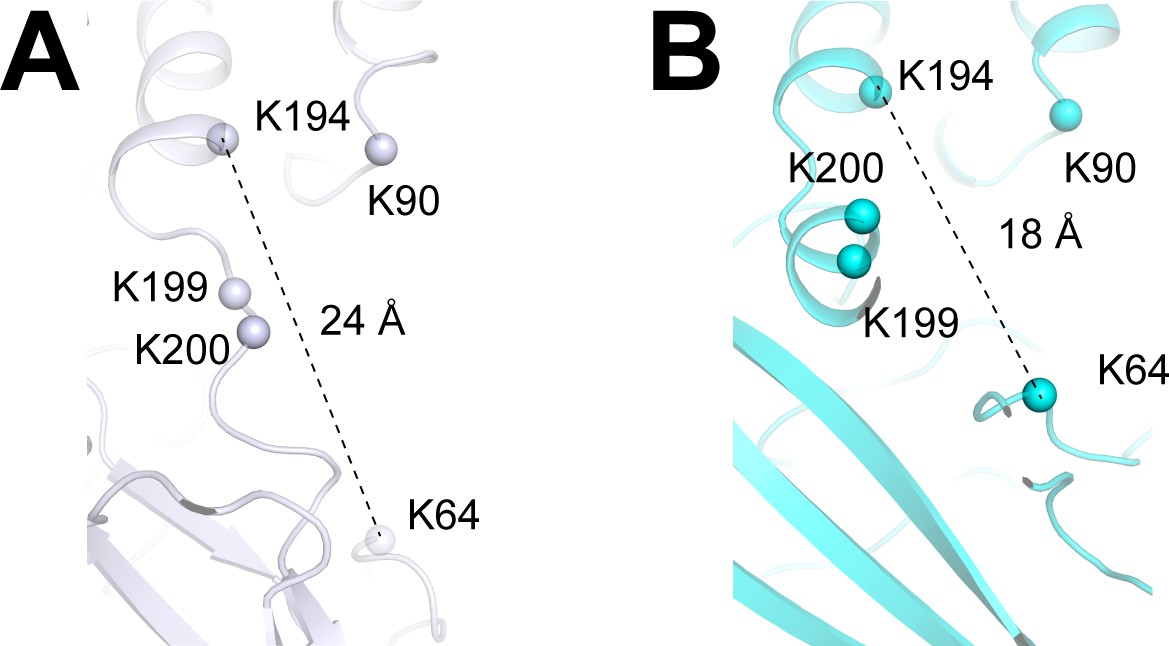
PIP2 binding pocket, related to Figure 4.
(A and B) Comparison of the PIP2 binding site in the CryoEMApo (white, panel (A)) and CryoEMPIP2 (cyan, panel (B)) structures. Cα atoms of residues involved in PIP2 binding are shown as spheres. Distances between K194 and K64 (Cα to Cα) are labeled.
Figure 5
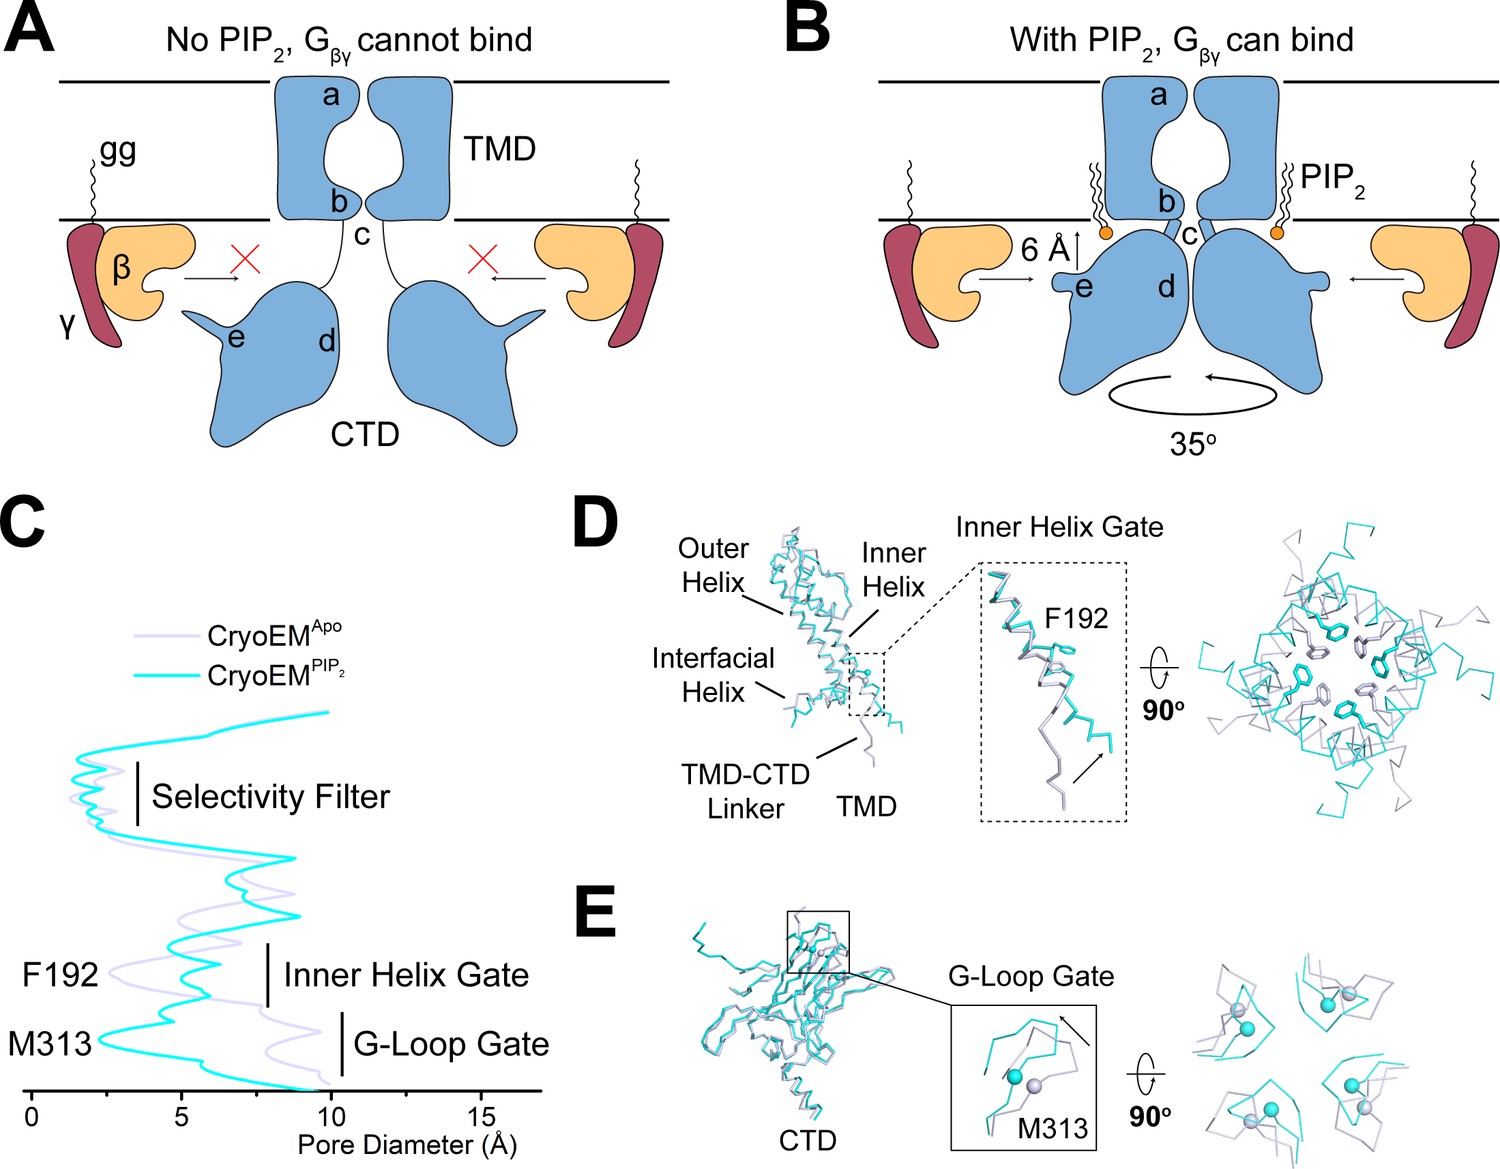
PIP2 serves as an allosteric regulator to permit Gβγ binding.
(A and B) A cartoon depiction of PIP2 regulation of GIRK channels. The blue shape depicts the GIRK channel. a, b, c, d, and e indicate the selectivity filter, inner helix gate, TMD-CTD linker, the G-loop gate, and the βL-βM loop, respectively. Circular arrow indicates the rotation about the pore axis with respect to the TMD and perpendicular arrow indicates CTD translation upon PIP2 binding. The ‘gg’ label represents the geranylgeranyl lipid modification at the C terminus of Gγ. In the absence of PIP2 (A), GIRK2 channel adopts the extended conformation and is not positioned for Gβγ binding. Upon PIP2 binding (B), the GIRK2 channel transits to the docked conformation, allowing Gβγ binding to occur. (C) Plot of pore diameter (between van der Waals surfaces, calculated with Hole) for the extended (gray) and docked (cyan) structures. (D and E) Superposition of the channel TMD from the extended (gray) and docked (cyan) structures. Conformational changes at the inner helix gate (D) and G-loop gate (E) are boxed and zoomed-in details are shown. Sidechains of the inner helix gate-forming residue Phe192 are shown as sticks. Cα atoms of the G-loop gate constriction residue Met313 are shown as spheres.
Tables
Key resources table
| Reagent type (species) or resource | Designation | Source or reference | Identifiers | Additional information |
|---|---|---|---|---|
| Gene (Mus musculus GIRK2) | GIRK2 | synthetic | Synthesized at GeneWiz. | |
| Gene (Homo sapiens GIRK1) | GIRK1 | synthetic | Synthesized at GeneWiz. | |
| Gene (Homo sapiens GIRK4) | GIRK4 | synthetic | Synthesized at GeneWiz. | |
| Strain, strain background (Escherichia coli) | DH10Bac | ThermoFisher | 10361012 | |
| Recombinant DNA reagent | pPICZ-GIRK2 | https://doi.org/10.1016/j.cell.2011.07.046 | Maintained at the Mackinnon lab | |
| Recombinant DNA reagent | GIRK1-His10-pEG BacMam | https://doi.org/10.7554/eLife.15750.001 | Maintained at the Mackinnon lab | |
| Recombinant DNA reagent | GIRK4-1D4-pEG BacMam | https://doi.org/10.7554/eLife.15750.001 | Maintained at the Mackinnon lab | |
| Cell line (Pichia pastoris) | SMD1163 | Invitrogen | C17500 | |
| Cell line (Spodoptera frugiperda) | Sf9 | ATCC | Cat# CRL-1711 | |
| Cell line (Homo sapiens) | HEK293S GnTI- | ATCC | Cat# CRL-3022 | |
| Chemical compound, drug | SF-900 II SFM medium | GIBCO | Cat# 10902–088 | |
| Chemical compound, drug | L-Glutamine (100x) | GIBCO | Cat# 25030–081 | |
| Chemical compound, drug | Pen Strep | GIBCO | Cat# 15140–122 | |
| Chemical compound, drug | Grace’s insect medium | GIBCO | Cat# 11605–094 | |
| Chemical compound, drug | Freestyle 293 medium | GIBCO | Cat# 12338–018 | |
| Chemical compound, drug | Fetal bovine serum | GIBCO | Cat# 16000–044 | |
| Chemical compound, drug | Cellfectin II reagent | Invitrogen | Cat# 10362100 | |
| Chemical compound, drug | Cholesteryl hemisuccinate (CHS) | Anatrace | CH210 | |
| Chemical compound, drug | n-Dodecyl-β-D-Maltopyranoside (DDM) | Anatrace | D310S | |
| Chemical compound, drug | n-Decyl-β-D-Maltopyranoside (DM) | Anatrace | D322S | |
| Chemical compound, drug | 1,2-dioctanoyl-sn-glycero-3-phospho-(1'-myo-inositol-4',5'-bisphosphate) (ammonium salt) (C8-PIP2) | Avanti Polar Lipids | 850185P | |
| Chemical compound, drug | (1H, 1H, 2H, 2H-Perfluorooctyl)phosphocholine (FFC8) | Anatrace | F300F | |
| Commercial assay or kit | CNBr-activated Sepharose beads | GE Healthcare | Cat# 17-0430-01 | |
| Commercial assay or kit | Superdex 200 Increase 10/300 GL | GE Healthcare Life Sciences | 28990944 | |
| Commercial assay or kit | R1.2/1.3 400 mesh Au holey carbon grids | Quantifoil | 1210627 | |
| Commercial assay or kit | Superose 6 Increase 10/300 GL | GE Healthcare Life Sciences | 29091596 | |
| Software, algorithm | RELION 3.0 | https://doi.org/10.7554/eLife.42166.001 | http://www2.mrc-lmb.cam.ac.uk/relion | |
| Software, algorithm | RELION 3.1 | https://doi.org/10.1101/798066 | http://www2.mrc-lmb.cam.ac.uk/relion | |
| Software, algorithm | MotionCor2 | https://doi.org/10.1038/nmeth.4193 | http://msg.ucsf.edu/em/software/motioncor2.html | |
| Software, algorithm | Gctf 1.0.6 | https://doi.org/10.1016/j.jsb.2015.11.003 | https://www.mrc-lmb.cam.ac.uk/kzhang/Gctf/ | |
| Software, algorithm | CtfFind4.1.8 | https://doi.org/10.1016/j.jsb.2015.08.008 | http://grigoriefflab.janelia.org/ctffind4 | |
| Software, algorithm | Gautomatch | https://www.mrc-lmb.cam.ac.uk/kzhang/Gautomatch/ | ||
| Software, algorithm | CryoSPARC 2.4.0 | https://doi.org/10.7554/eLife.46057.001 | https://cryosparc.com/ | |
| Software, algorithm | Pyem | https://github.com/asarnow/pyem | ||
| Software, algorithm | COOT | https://doi.org/10.1107/S0907444910007493 | http://www2.mrc-lmb.cam.ac.uk/personal/ pemsley/coot | |
| Software, algorithm | PHENIX | https://doi.org/10.1107/S0907444909052925 | https://www.phenix-online.org | |
| Software, algorithm | Adobe Photoshop version 16.0.0 (for figure preparation) | Adobe Systems, Inc | ||
| Software, algorithm | GraphPad Prism version 8.0 | GraphPad Software | ||
| Software, algorithm | MacPyMOL: PyMOL v2.0 Enhanced for Mac OS X | Schrodinger LLC | https://pymol.org/edu/?q=educational/ | |
| Software, algorithm | Chimera | https://doi.org/10.1002/jcc.20084 | https://www.cgl.ucsf.edu/chimera/download.html | |
| Software, algorithm | Serial EM | https://doi.org/10.1016/j.jsb.2005.07.007 | http://bio3d.colorado.edu/SerialEM | |
| Software, algorithm | HOLE | https://doi.org/10.1016/S0263-7855(97)00009-X | http://www.holeprogram.org |
Table 1
Cryo-EM data collection and refinement statistics, related to Figures 1, 2 and 4.
| GIRK2Extended | GIRK2Docked | GIRK1/4Extended | GIRK1/4Docked | |
|---|---|---|---|---|
| EMDB ID | EMD-22199 | EMD-22200 | EMD-22201 | EMD-22202 |
| PDB ID | 6XIS | 6XIT | ||
| Data collection | ||||
| Microscope | Titan Krios | |||
| Detector | K3 summit | K2 summit | ||
| Voltage (kV) | 300 | |||
| Pixel size (Å) | 0.43 | 0.5 | 0.515 | |
| Total electron exposure (e-/Å2) | 103.3 | 80.0 | 75.4 | |
| Defocus range (μm) | 1.0 to 3.0 | 1.5 to 2.5 | 1.5 to 3.5 | |
| Micrographs collected | 2103 | 11,349 | 3415 | |
| Reconstruction | ||||
| Final particle images | 112,517 | 155,128 | 57,644 | 48,757 |
| Pixel size (Å) | 1.29 | 1 | 1.03 | 1.03 |
| Box size (pixels) | 256 | 400 | 256 | 256 |
| Resolution (Å) (FSC = 0.143) | 3.9 | 3.3 | 7.9 | 4.6 |
| Map Sharpening B-factor (Å2) | −26 | −12 | - | −192 |
| Model composition | ||||
| Non-hydrogen atoms | 9460 | 10,252 | ||
| Protein residues | 1240 | 13,08 | ||
| Ligands | 0 | 4 | ||
| Metals | 0 | 3 | ||
| Refinement | ||||
| Model-to-map CC (mask) | 0.62 | 0.72 | ||
| Model-to-map CC (volume) | 0.64 | 0.75 | ||
| R.m.s deviations | ||||
| Bond length (Å) | 0.006 | 0.009 | ||
| Bond angles (°) | 1.3 | 1.3 | ||
| Validation | ||||
| MolProbity score | 2.00 | 1.80 | ||
| Clash score | 8.55 | 9.91 | ||
| Ramachandran plot | ||||
| Outliers (%) | 0 | 0 | ||
| Allowed (%) | 1.7 | 4.0 | ||
| Favored (%) | 98.3 | 96.0 | ||
| Rotamer outliers (%) | 1.40 | 0.74 | ||
| C-beta deviations (%) | 0 | 0 | ||
Additional files
Download links
A two-part list of links to download the article, or parts of the article, in various formats.
Downloads (link to download the article as PDF)
Open citations (links to open the citations from this article in various online reference manager services)
Cite this article (links to download the citations from this article in formats compatible with various reference manager tools)
Cryo-EM analysis of PIP2 regulation in mammalian GIRK channels
eLife 9:e60552.
https://doi.org/10.7554/eLife.60552


