Generic injuries are sufficient to induce ectopic Wnt organizers in Hydra
- Department of Molecular and Cellular Biology, University of California, Davis, United States
Figures
Figure 1 with 4 supplements
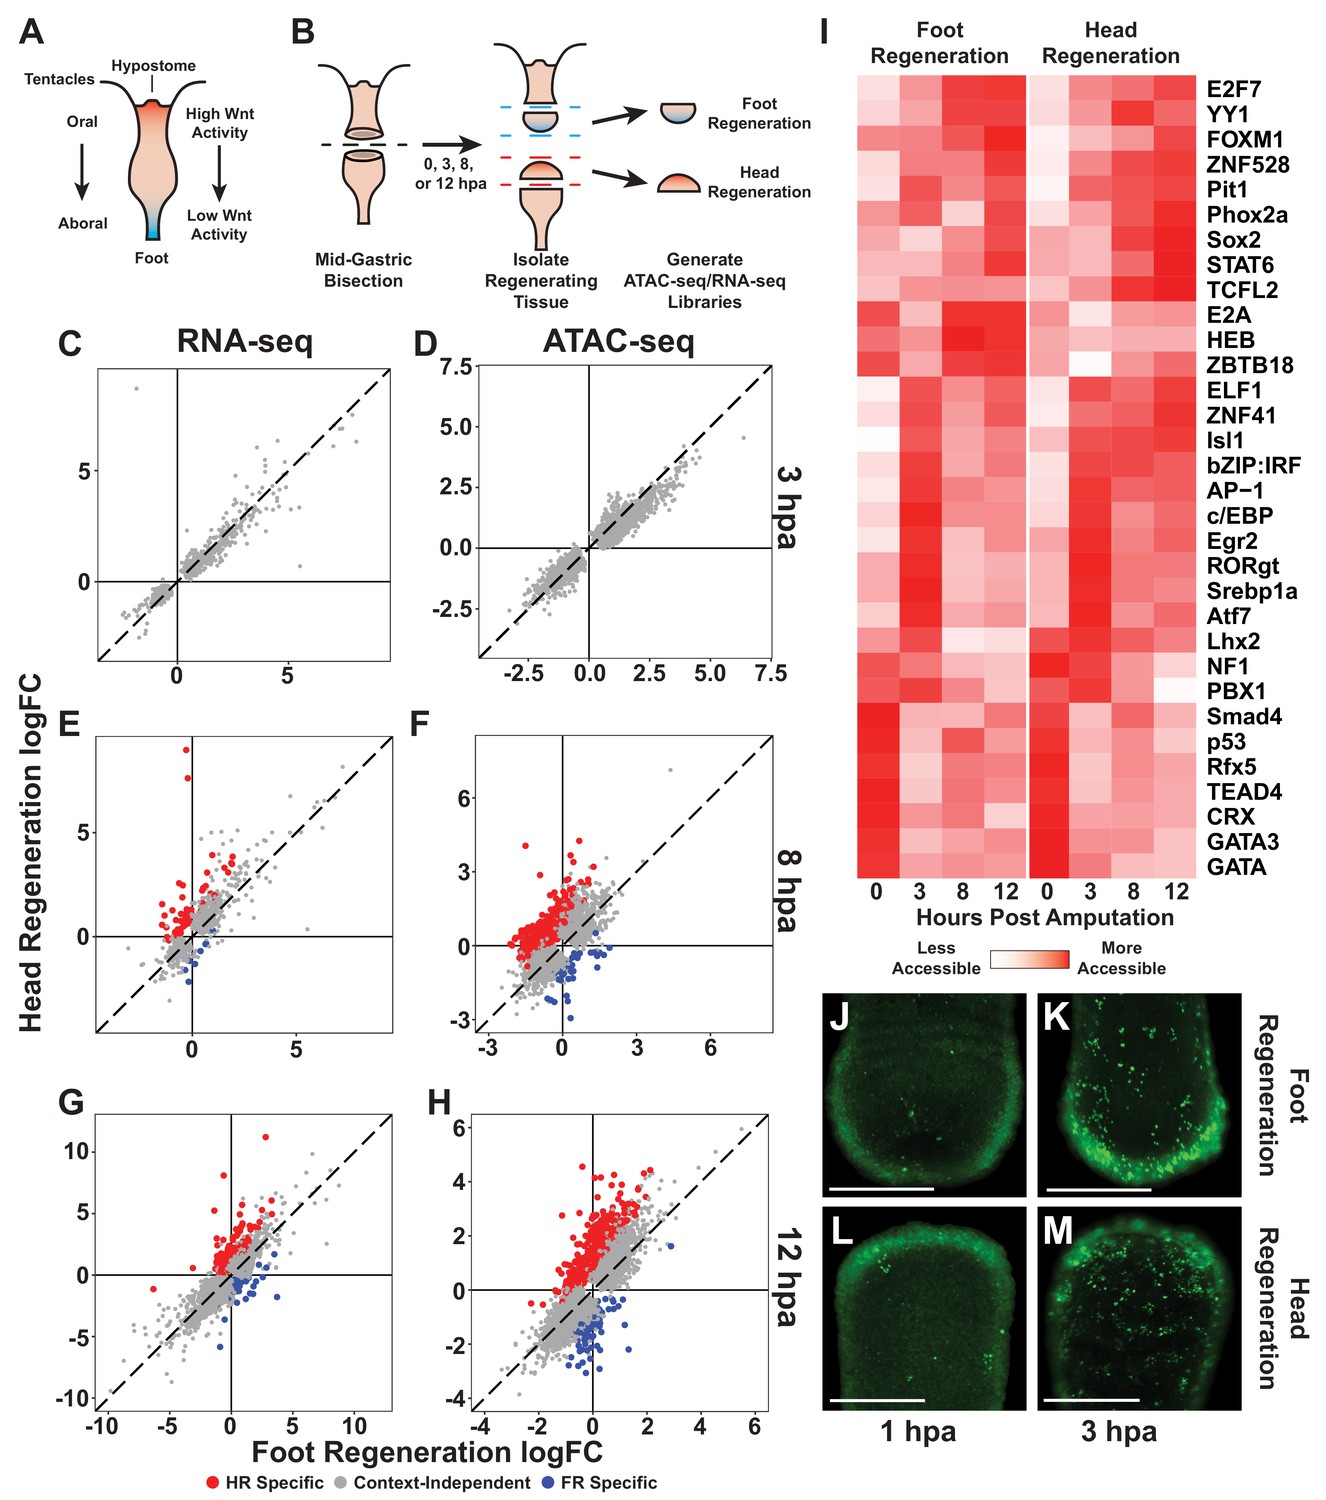
The initial transcriptional response to mid-gastric bisection is structure independent but diverges by 8 hr post amputation (hpa).
(A) A diagram of the Hydra body plan. Red coloration indicates a head-specific molecular signature. Blue coloration indicates a foot-specific molecular signature. (B) Experimental design for ATAC-seq and RNA-seq library generation. (C–H) Comparison of average log2 fold change (log2FC) in transcript abundance (C, E, G) or chromatin accessibility (D, F, H) during head and foot regeneration at 3, 8, and 12 hpa. The transcriptional response during head and foot regeneration is identical at 3 hpa but becomes distinct by 8 hpa. Features that showed significant differences in the injury response during head and foot regeneration when compared to 0 hpa controls are highlighted in red for head regeneration-specific features or blue for foot regeneration-specific features (false discovery rate [FDR] ≤ 1e-3 for RNA-seq and FDR ≤ 1e-4 for ATAC-seq). The dotted line indicates perfect correlation between regeneration types. All significance values were calculated with edgeR using quasi-likelihood tests of count data fitted to a negative binomial generalized log-linear model. Information on RNA-seq and ATAC-seq biological replicates is provided in Tables 1 and 2. Individual FDR values for all genewise/peakwise tests can be found in Supplementary files 1 and 2. (I) Heatmap of the average relative accessibility of transcription factor binding motifs during regeneration in head and foot regenerates calculated using chromVAR. Transcription factor activity during the first 12 hr of regeneration was highly dynamic and largely similar between head and foot regeneration. (J–M) Late-stage apoptotic cells labeled in Hydra undergoing head or foot regeneration using acridine orange. Widespread apoptosis was observed during head and foot regeneration at 3 hpa but was largely absent at 1 hpa. Additional representative images are presented in Figure 1—figure supplement 4. Scale bars indicate 250 µm.
-
Figure 1—source data 1
Excel workbook containing all tables that were used to generate plots for Figure 1C–I.
The first sheet in the workbook (‘Descriptions’) contains individual descriptions for all tables included in the workbook.
- https://cdn.elifesciences.org/articles/60562/elife-60562-fig1-data1-v2.xlsx
-
Figure 1—source data 2
Transcription factor binding motifs included in this study.
The sequence, shortened name, and full name for all transcription factor binding motifs (TFBMs) that were associated with significant changes in chromatin accessibility during the first 12 hr of head and foot regeneration. All TFBMs were pulled from the list of HOMER motifs provided by the chromVARmotifs package.
- https://cdn.elifesciences.org/articles/60562/elife-60562-fig1-data2-v2.docx
Figure 1—figure supplement 1
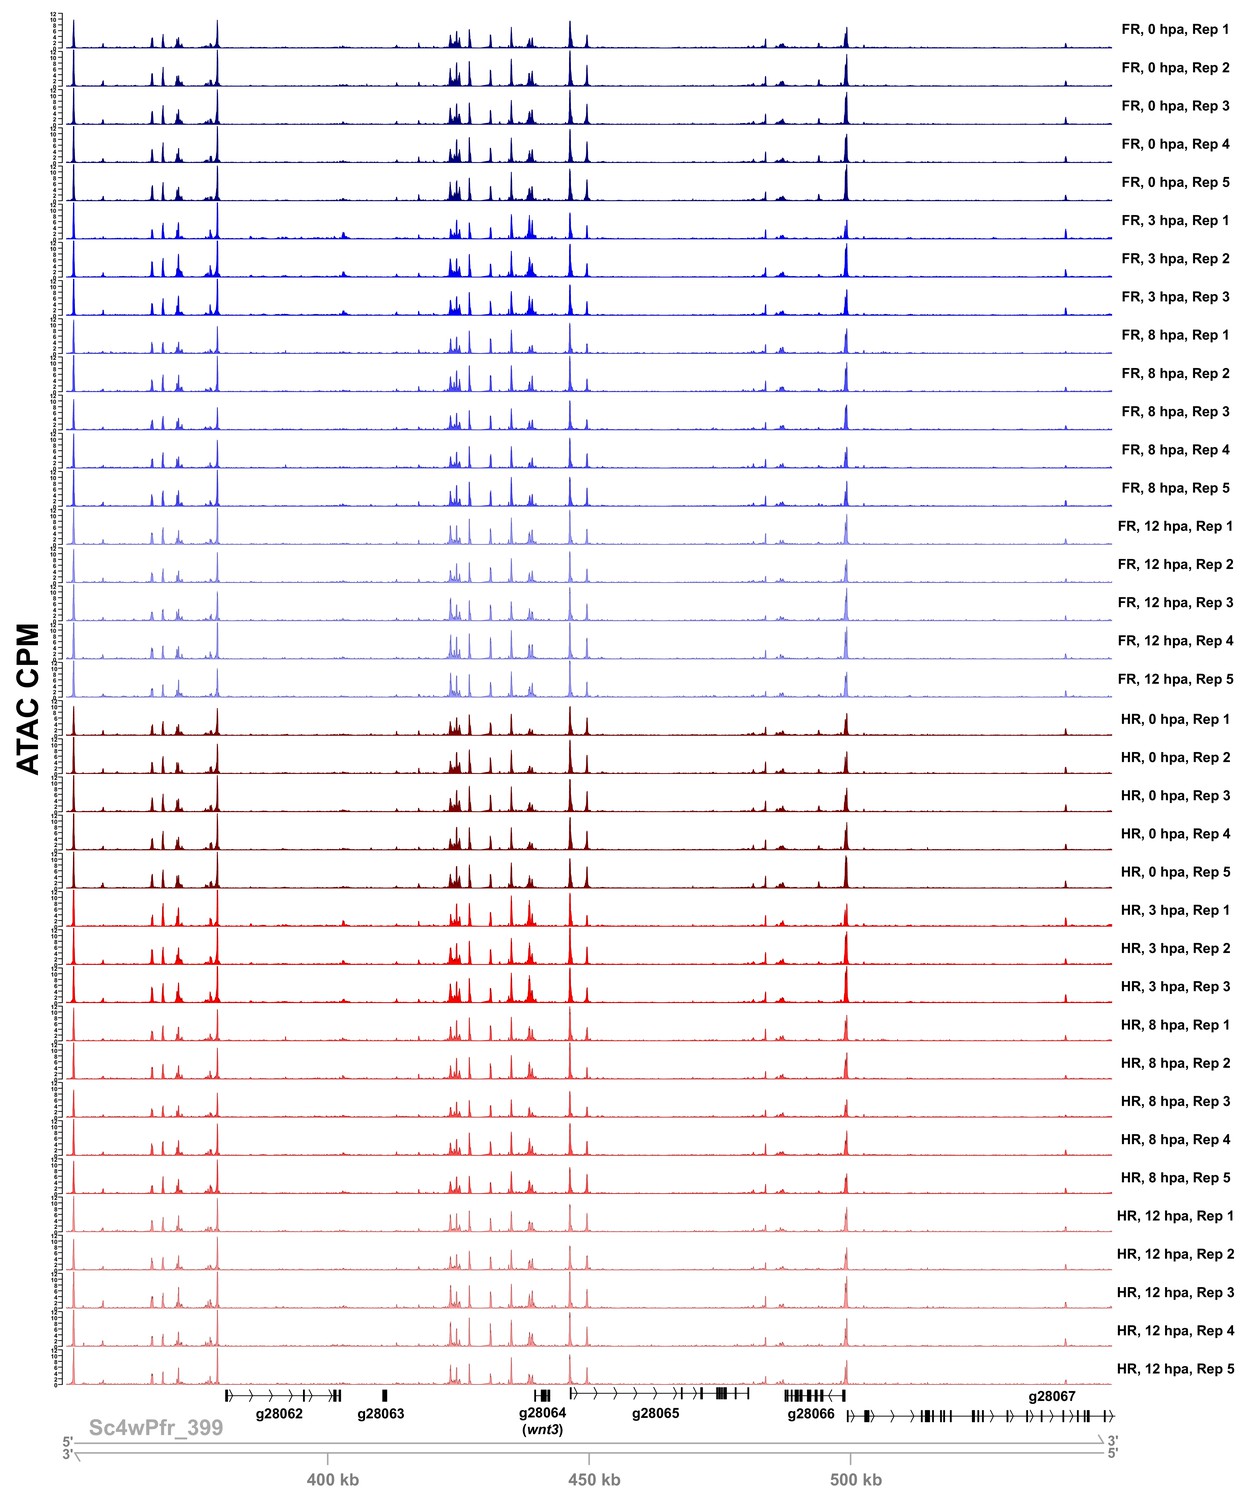
Sample ATAC-seq data centered on the wnt3 locus.
ATAC-seq accessibility data from all biological replicates in the regeneration timecourse dataset for the 200 kb surrounding the wnt3 locus. ATAC CPM: average ATAC-seq counts per million calculated using a 10 bp bin size. Gene IDs correspond to the Hydra 2.0 genome gene models. HR: head regeneration; FR: foot regeneration.
Figure 1—figure supplement 2
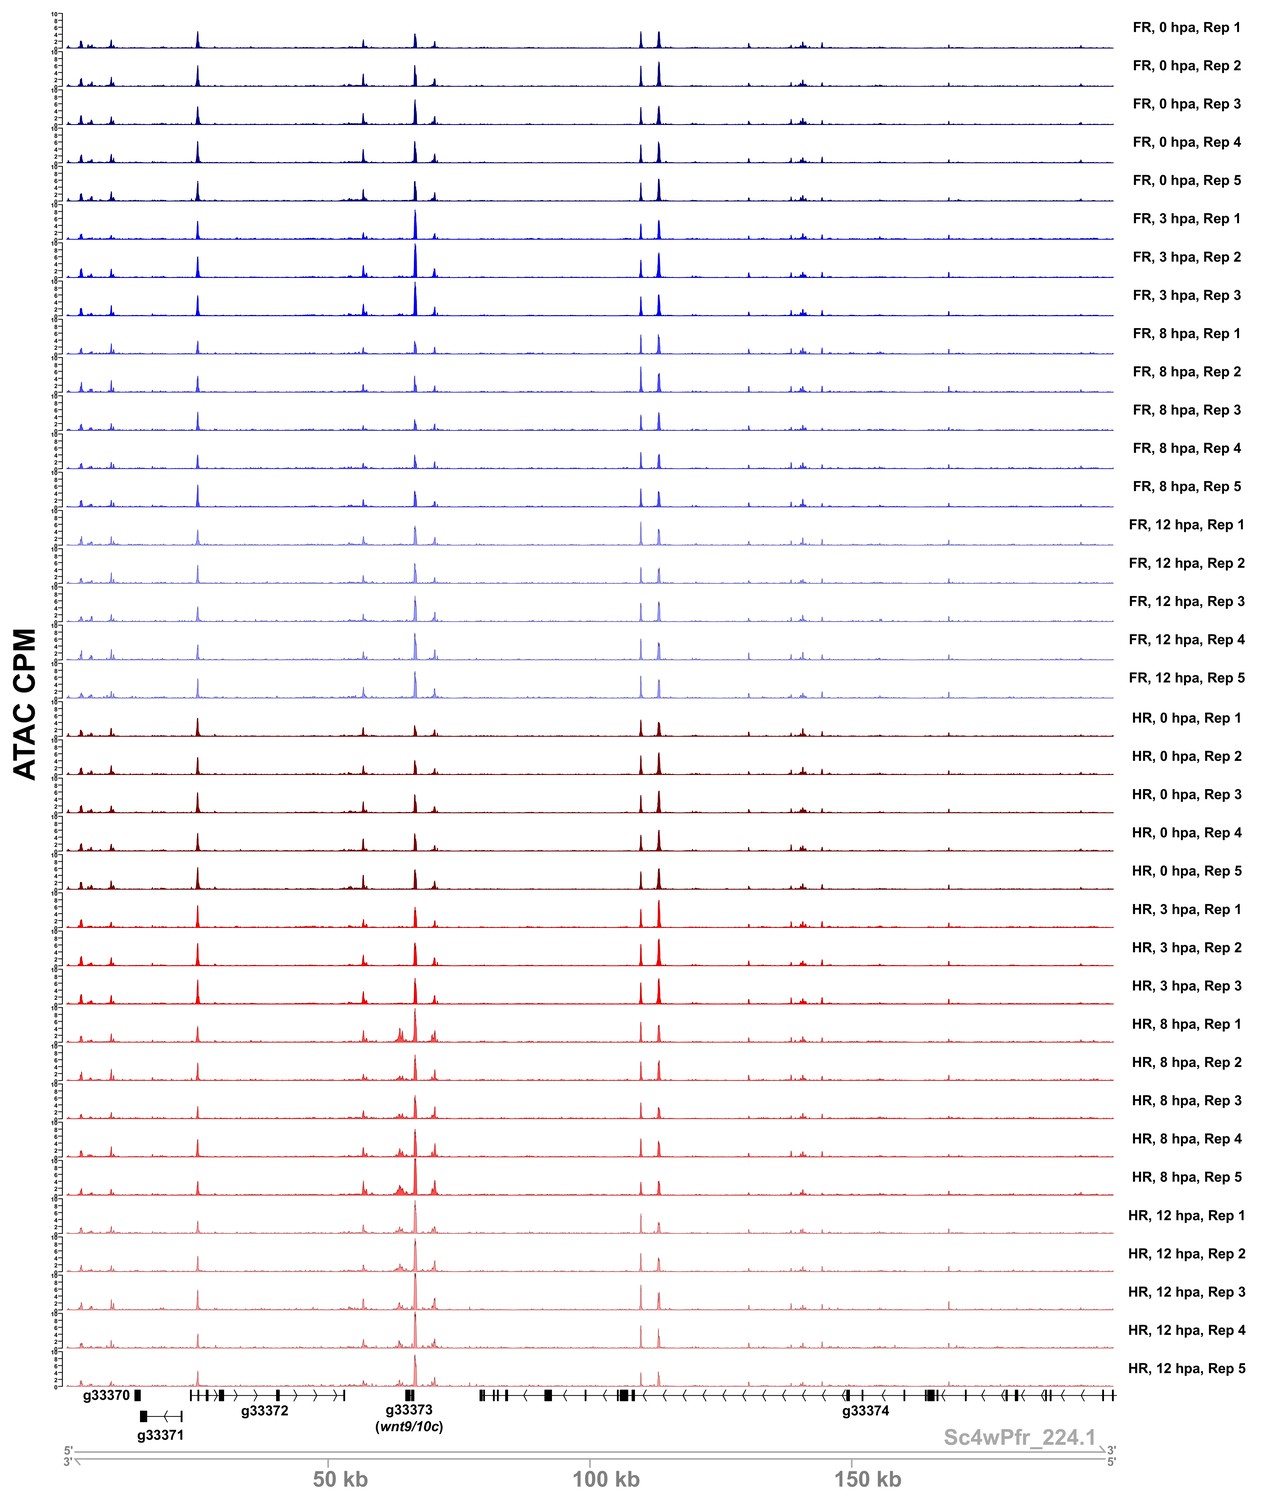
Sample ATAC-seq data centered on the wnt9/10c locus.
ATAC-seq accessibility data from all biological replicates in the regeneration timecourse dataset for the 200 kb surrounding the wnt9/10c locus. ATAC CPM: average ATAC-seq counts per million calculated using a 10 bp bin size. Gene IDs correspond to the Hydra 2.0 genome gene models. HR: head regeneration; FR: foot regeneration.
Figure 1—figure supplement 3
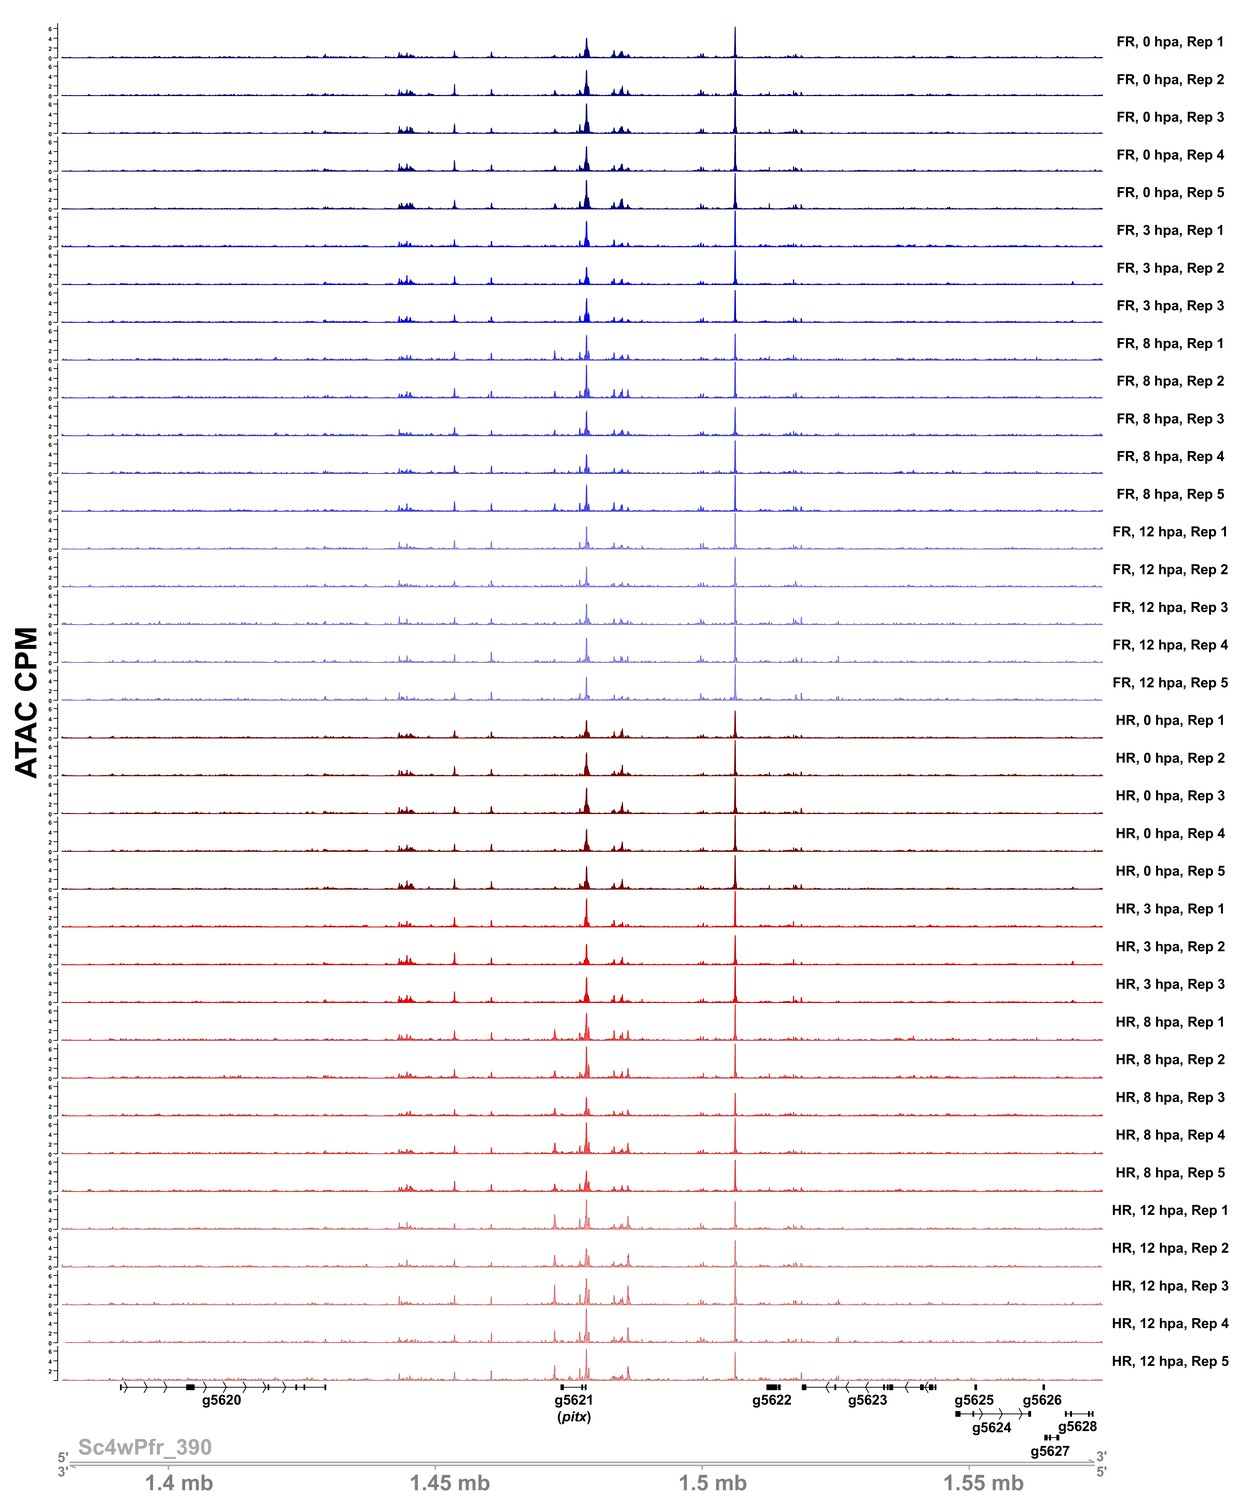
Sample ATAC-seq data centered on the pitx locus.
ATAC-seq accessibility data from all biological replicates in the regeneration timecourse dataset for the 200 kb surrounding the pitx locus. ATAC CPM: average ATAC-seq counts per million calculated using a 10 bp bin size. Gene IDs correspond to the Hydra 2.0 genome gene models. HR: head regeneration; FR: foot regeneration.
Figure 1—figure supplement 4
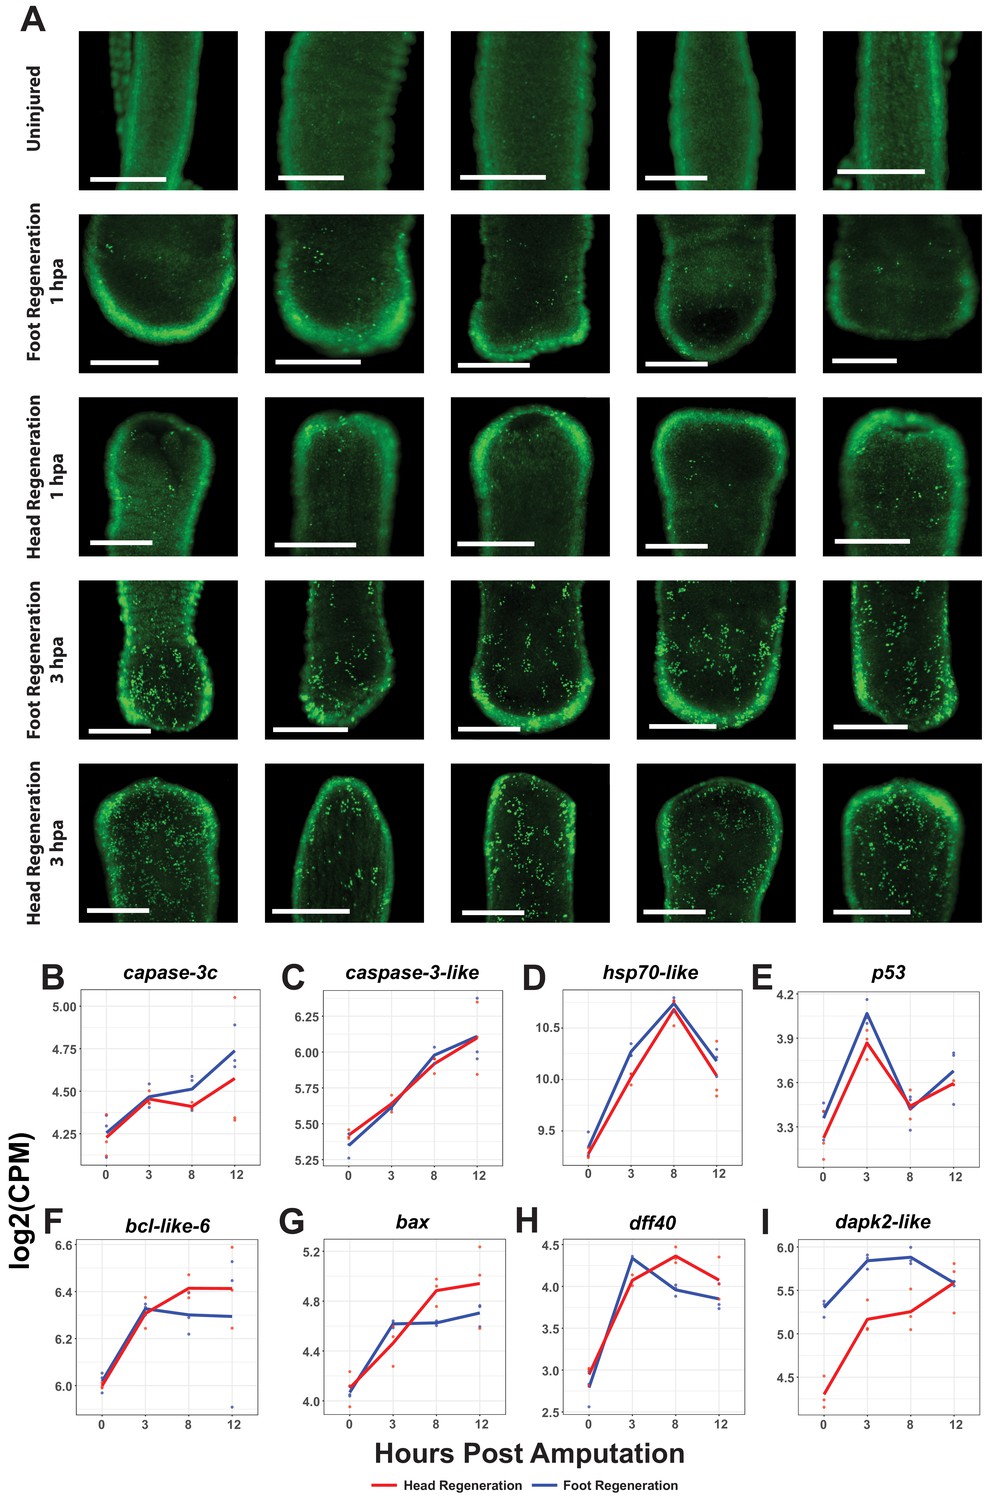
Oral and aboral amputations induce apoptosis within 3 hr post amputation (hpa).
(A) Representative images of late-stage apoptotic cells in uninjured and regenerating Hydra stained with acridine orange. Widespread apoptosis was observed during head and foot regeneration at 3 hpa but was largely absent at 1 hpa. Scale bars denote 250 µm. (B–I) RNA expression plots showing average normalized RNA-seq read counts for apoptosis-associated transcripts in log2 counts per million (log2CPM) during head and foot regeneration. Apoptotic markers are expressed symmetrically during the early wound response.
Figure 2 with 1 supplement

Wnt signaling is likely initially activated in a structure-independent manner but becomes restricted to regenerating head tissue by 8 hr post amputation (hpa).
(A–D) Plots comparing enrichment in head and foot tissue in uninjured Hydra and during regeneration. Genes associated with the homeostatic maintenance of head and foot organizers are upregulated within 12 hpa. Enrichment in uninjured head and foot tissue (i.e., single-cell [SC] Atlas Structural Enrichment) was calculated by comparing the average relative expression levels in epithelial head cells isolated from the Hydra SC atlas to expression in epithelial foot cells. A positive fold change indicates enrichment in head tissue, and a negative fold change indicates enrichment in foot tissue. Head or foot-specific activation during regeneration (i.e., Regeneration Context Effect) was calculated by subtracting the log2FC in regenerating head tissue from the log2FC in regenerating foot tissue using the 0 hpa timepoint as the control. A positive fold change indicates enrichment in head-regenerating tissue, and a negative fold change indicates enrichment in foot-regenerating tissue. Transcripts (A, C) or ATAC-seq peaks (B, D) that were enriched in head-regenerating tissue and were also enriched in uninjured head tissue are highlighted in red. ATAC-seq peaks or transcripts that were enriched in foot-regenerating tissue and were also enriched in uninjured foot tissue are highlighted in blue. (E) Average relative chromatin accessibility plot of ATAC-seq peaks containing the TCF transcription factor binding motif (TFBM) during head and foot regeneration. The TCF TFBM is associated with increases in accessibility during both head and foot regeneration at 3 hpa, but subsequent increases in accessibility are restricted to head regeneration. Relative changes in chromatin accessibility were calculated using chromVAR using the HOMER TCFL2 TFBM sequence. (F–L) RNA expression plots showing average normalized RNA-seq read counts for Wnt signaling components in log2 counts per million (log2CPM) during head and foot regeneration. Wnt signaling components are initially upregulated during head and foot regeneration but become head regeneration-specific by 12 hpa. HR: head regeneration; FR: foot regeneration.
-
Figure 2—source data 1
Excel workbook containing all tables that were used to generate plots for Figure 2A–D.
The first sheet in the workbook (‘Descriptions’) contains individual descriptions for all tables included in the workbook.
- https://cdn.elifesciences.org/articles/60562/elife-60562-fig2-data1-v2.xlsx
Figure 2—figure supplement 1
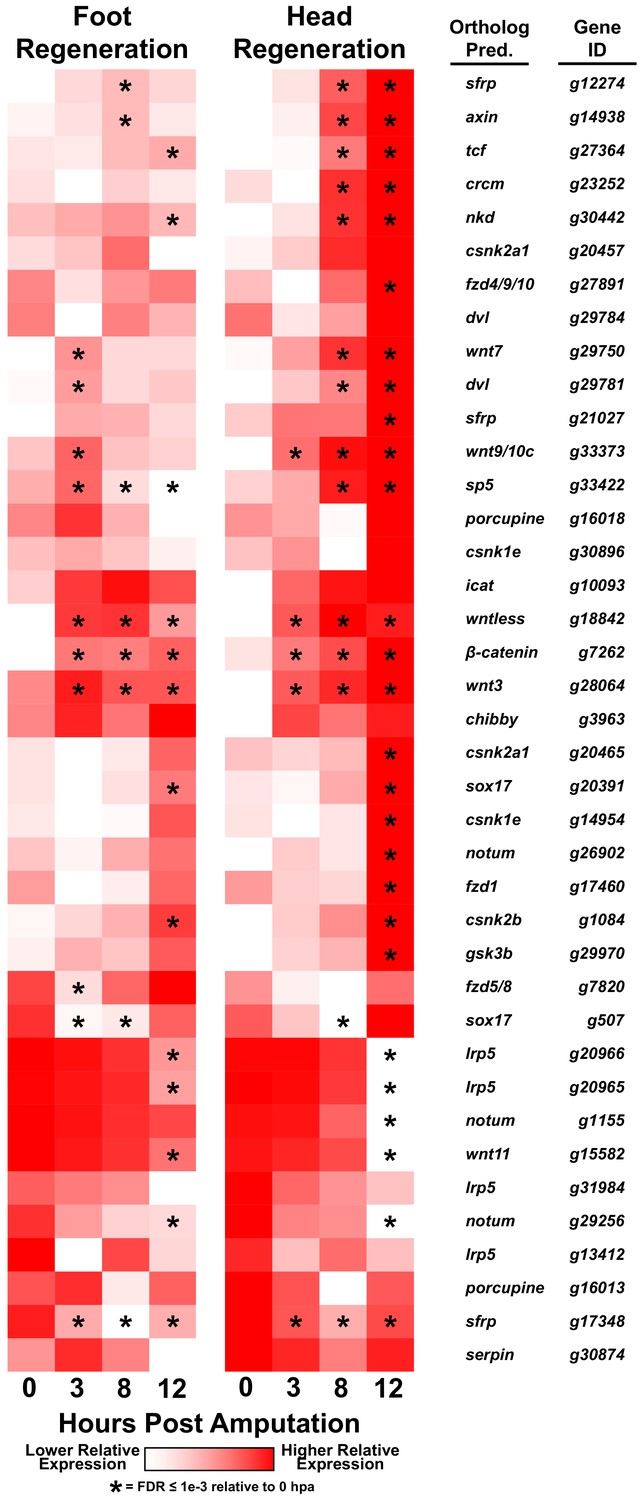
Canonical Wnt signaling components are upregulated during foot regeneration.
Heatmap of canonical Wnt signaling components during regeneration. Several canonical Wnt signaling genes were transcriptionally upregulated during early foot regeneration. The list of canonical Wnt signaling pathway components was generated by manually curating the list of Wnt pathway genes provided by the KEGG pathway database (see Materials and methods). Darker coloration indicates higher expression. Asterisks indicate a significant change (false discovery rate [FDR] ≤ 1e-3) in transcript abundance relative to 0 hr post amputation controls. Individual FDR values for all gene-wise tests can be found in Supplementary file 2.
-
Figure 2—figure supplement 1—source data 1
Excel workbook containing the table used to generate the heatmap in Figure 2—figure supplement 1.
Values in the table correspond to counts per million. For plotting the heatmap, the data were normalized by row such that the minimum value was 0 and the maximum value was 1.
- https://cdn.elifesciences.org/articles/60562/elife-60562-fig2-figsupp1-data1-v2.xlsx
Figure 3 with 2 supplements
TCF is required for the initiation of head and foot-specific transcription during regeneration.
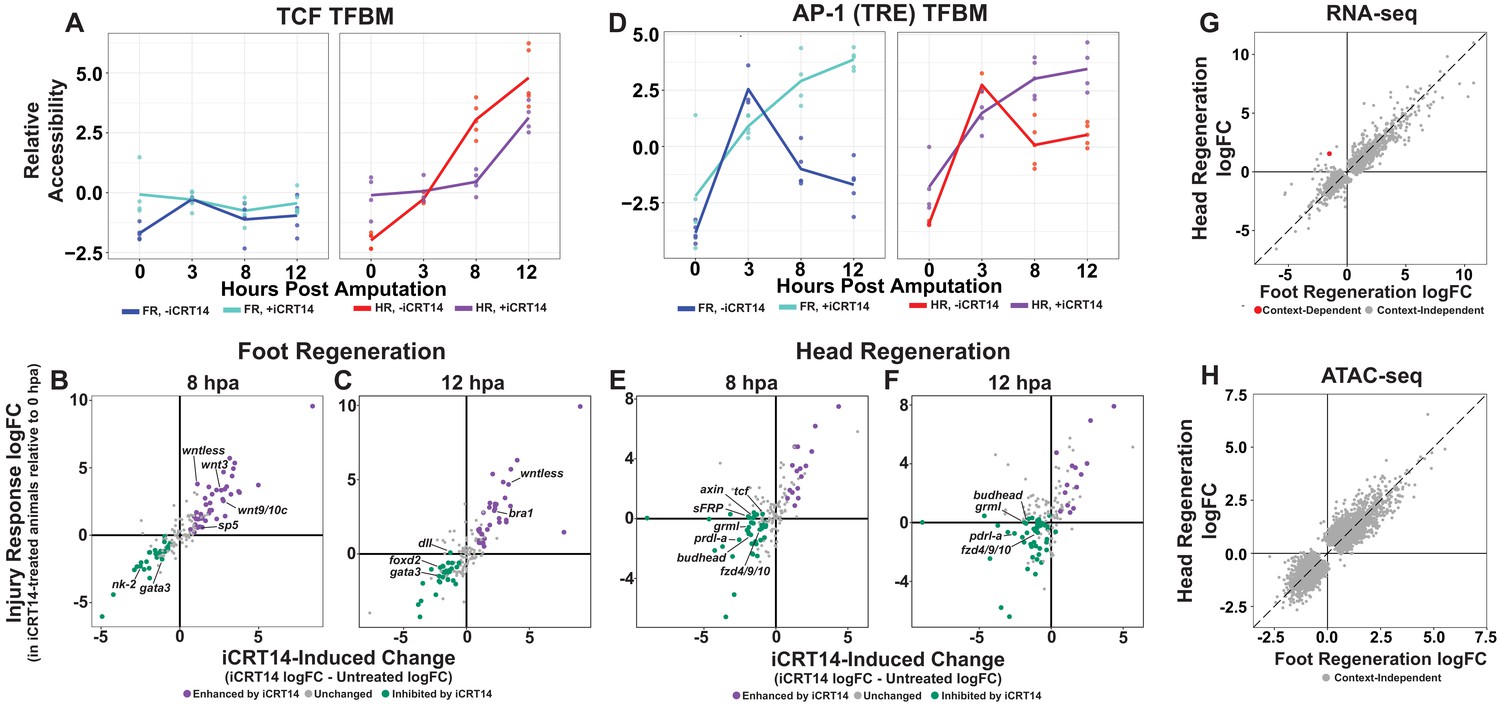
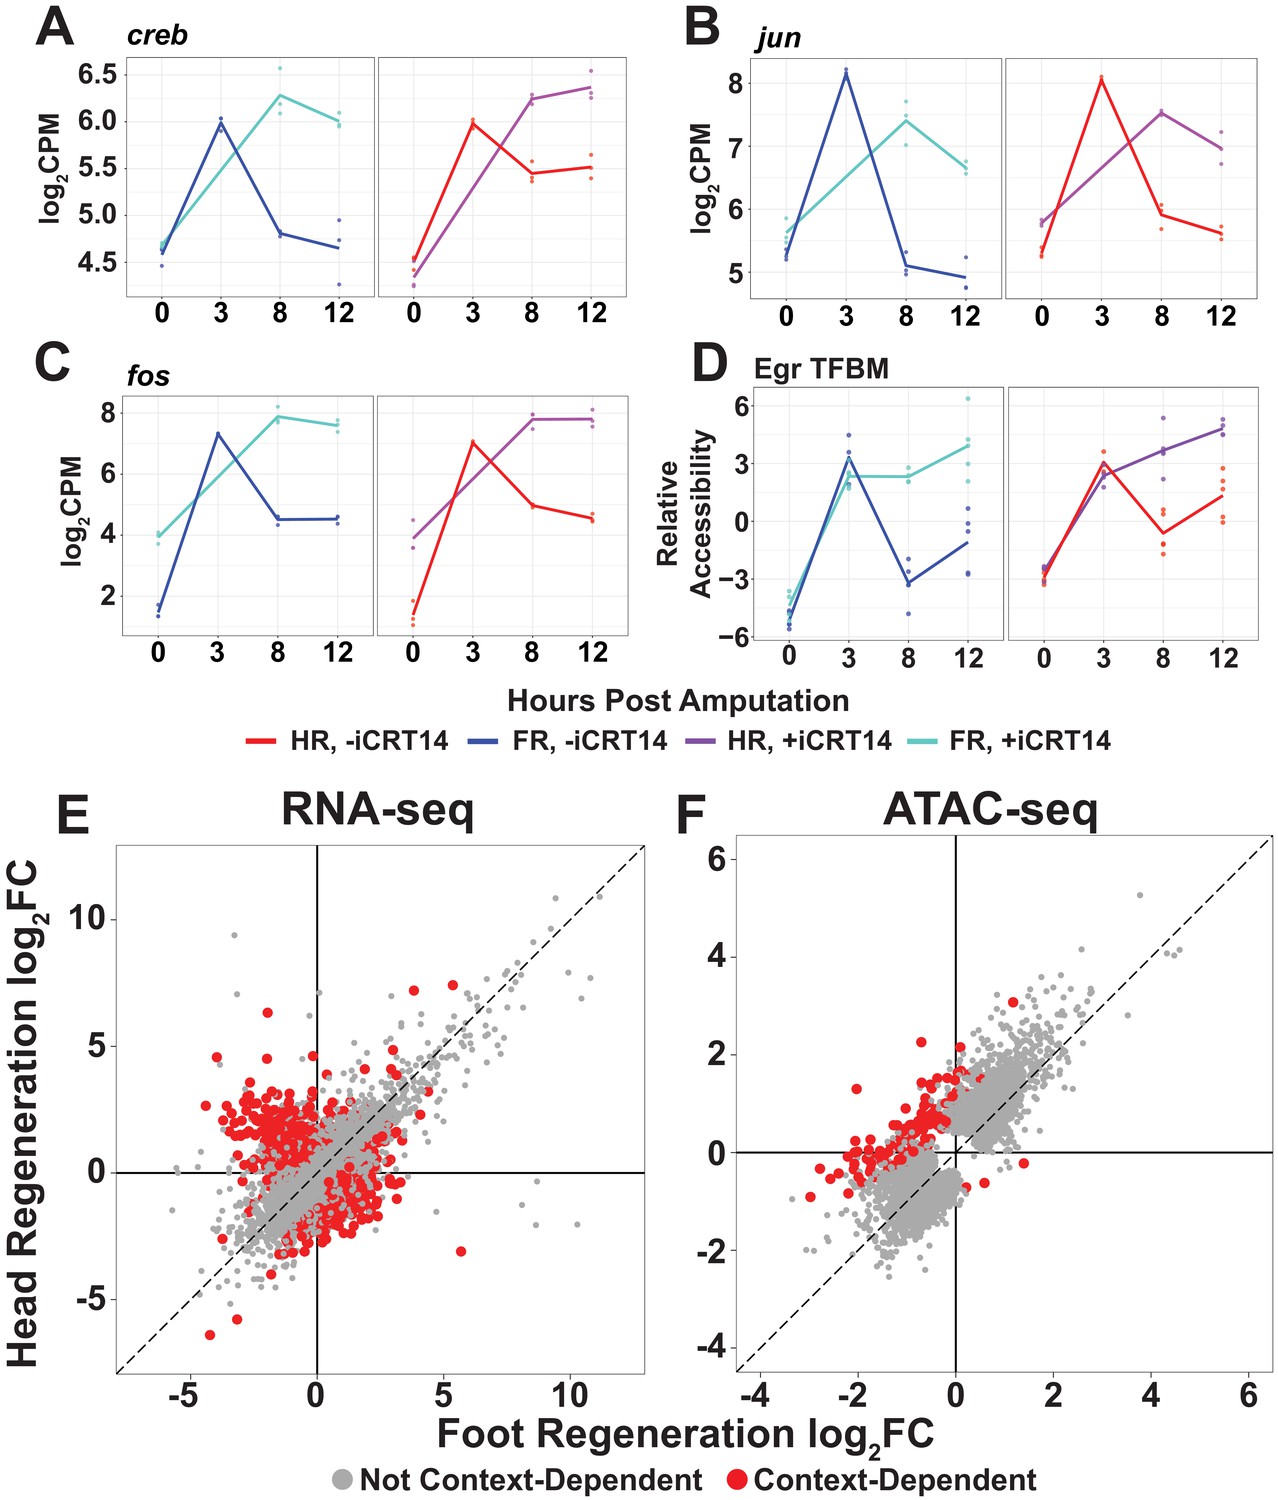
(A) Average relative chromatin accessibility plot of peaks containing the TCF transcription factor binding motif (TFBM) during head and foot regeneration in both untreated animals and animals incubated in 5 µM iCRT14. iCRT14 treatment significantly diminished and delayed increases in chromatin accessibility associated with the TCF TFBM during head regeneration. The HOMER TCFL2 motif sequence was used to identify putative TCF binding sites. (B, C) Scatter plots depicting the effect of 5 µM iCRT14 during foot regeneration on the injury induced expression of genes that were specific to head or foot regeneration in untreated animals. TCF inhibition prevents the upregulation of foot regeneration-specific genes and prolongs the expression of head-specific genes during foot regeneration. Negative values on the x-axis indicate a decrease in the injury-induced expression of a gene in iCRT14-treated animals relative to untreated controls, while positive values indicate an increase in injury-induced expression. Negative values on the y-axis indicate that the gene was downregulated relative to 0 hr post amputation (hpa) controls in iCRT14-treated animals, while positive values indicate that the gene was upregulated. Green coloration denotes transcripts that showed diminished injury-induced expression in iCRT14-treated animals (i.e., expression was TCF-dependent). Purple coloration denotes transcripts that showed enhanced injury-induced expression in iCRT14-treated animals (i.e., expression was inhibited by TCF). TCF-dependent transcripts (green) were defined as transcripts that were not significantly upregulated following injury in iCRT14-treated animals and that showed a significant (false discovery rate [FDR] ≤ 1e-3) reduction in injury-induced expression relative to untreated animals. TCF-inhibited transcripts (purple) were defined as transcripts that were significantly upregulated following injury in iCRT14-treated animals and that showed a significant increase in injury-induced expression relative to untreated animals. (D) Average relative chromatin accessibility plot of peaks containing the AP-1 TFBM during head and foot regeneration in both untreated and iCRT14-treated samples. iCRT14 treatment prolonged the injury-induced increase in chromatin accessibility associated with the AP-1 TFBM (i.e., 12-O-tetradecanoylphorbol 13-acetate[TPA] response element [TRE]) during regeneration. (E, F) Scatter plots depicting the effect of 5 µM iCRT14 during head regeneration on the injury-induced expression of genes that were specific to head regeneration in untreated animals. TCF inhibition blocks the upregulation of head-specific genes during head regeneration. (G, H) Comparison of the average log2FC in (G) transcript abundance or in (H) chromatin accessibility between head and foot regenerates treated with 5 µM iCRT14 at 8 hpa. iCRT14 virtually abolished all context-specific transcription at 8 hpa. Features that did not show a significant (FDR ≤ 1e-3) difference in the injury response between head and foot regenerates when compared to 0 hpa controls are highlighted in gray. Features that did show a significant difference are highlighted in red. The dotted line indicates perfect correlation between regeneration types.
-
Figure 3—source data 1
Excel workbook containing all tables that were used to generate plots for Figure 3C–H.
The first sheet in the workbook (‘Descriptions’) contains individual descriptions for all tables included in the workbook.
- https://cdn.elifesciences.org/articles/60562/elife-60562-fig3-data1-v2.xlsx
Figure 3—figure supplement 1
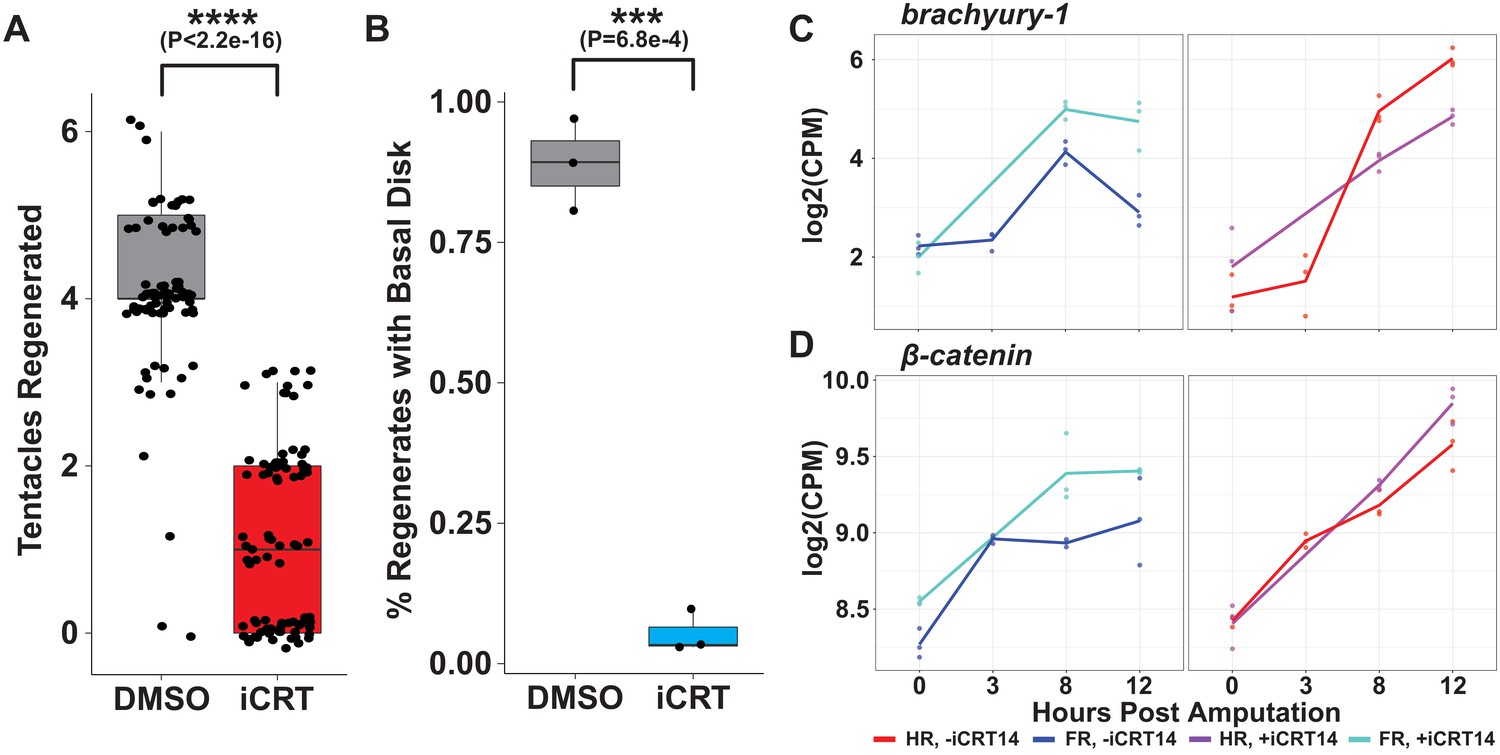
iCRT14 treatment recapitulates head and foot regeneration phenotypes reported by Gufler et al.
(A) Quantification of the number of tentacles regenerated following mid-gastric bisection at 60 hr post amputation (hpa) in animals treated with 0.05% dimethyl sulfoxide (DMSO) or 5 µM iCRT14. iCRT14 significantly reduces the number of tentacles regenerated by 60 hpa. (B) Quantification of the portion of animals with a regenerated basal disk at 36 hpa in animals treated with 0.05% DMSO or 5 µM iCRT14. iCRT14 significantly reduces the portion of animals that had regenerated a basal disk by 36 hpa. The percentage of each biological replicate, consisting of ~30 animals each, with a basal disk 36 hr after mid-gastric bisection was assessed using a previously established peroxidase staining assay (Hoffmeister and Schaller, 1985). p-Values were calculated using Student’s t-test in R. *** indicates p-value<0.001 and **** indicates p-value<1e-4. (C, D) RNA expression plots showing average normalized RNA-seq read counts for head-specific transcripts in log2 counts per million (log2CPM) during head and foot regeneration in untreated animals (–iCRT14) and animals treated with 5 µM iCRT14 (+iCRT14). iCRT14 inhibits the downregulation of head-specific transcripts during foot regeneration.
Figure 3—figure supplement 2
TCF is required for the downregulation of aspects of the injury response and the onset of structure-specific expression.
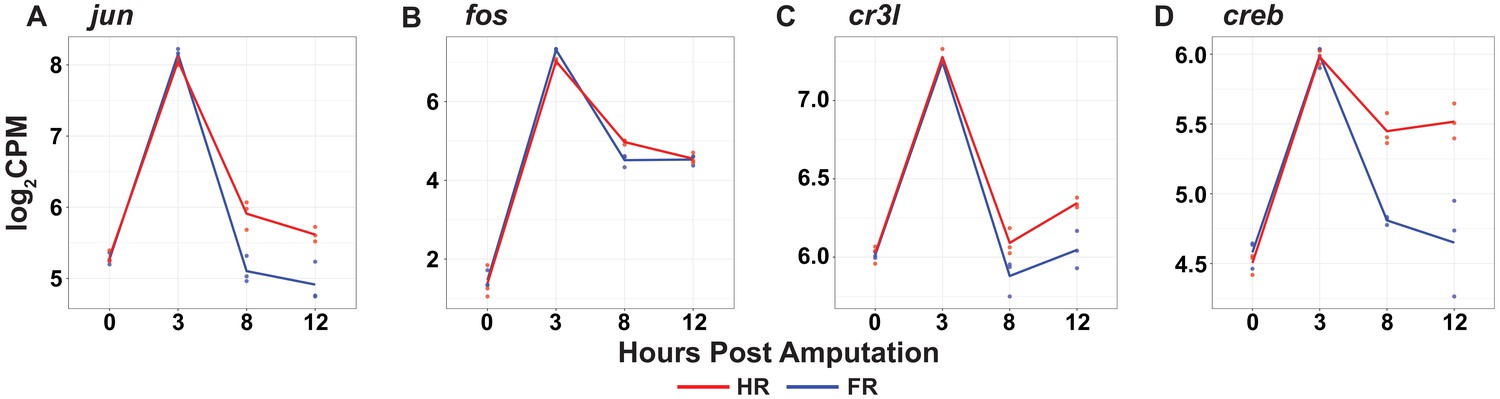
(A–C) RNA expression plots showing average normalized RNA-seq read counts for injury-responsive transcription factors (TFs) in log2 counts per million (log2CPM) during head and foot regeneration in untreated animals (–iCRT14) and animals treated with 5 µM iCRT14 (+iCRT14). iCRT14 treatment prevents the downregulation of injury-responsive TFs during head and foot regeneration. (D) Average relative chromatin accessibility plot of peaks containing the Egr transcription factor binding motif (TFBM) during head and foot regeneration in both untreated and iCRT14-treated samples. iCRT14 treatment prolonged the injury-induced increase in chromatin accessibility associated with the Egr TFBM during regeneration. (E, F) Comparison of the average log2FC in (E) transcript abundance or in (F) chromatin accessibility between head and foot regenerates treated with 5 µM iCRT14 at 12 hpa. iCRT14-treated regenerating tissue showed evidence of context-dependent transcription by 12 hpa. Features that did not show a significant (false discovery rate [FDR] ≤ 1e-3) difference in the injury response between head and foot regenerates when compared to 0 hpa controls are highlighted in gray. Features that did show a significant difference are highlighted in red. The dotted line indicates perfect correlation between regeneration types.
-
Figure 3—figure supplement 2—source data 1
Excel workbook containing tables that were used to generate plots for Figure 3—figure supplement 2E, F.
The first sheet in the workbook (‘Descriptions’) contains individual descriptions for the tables included in the workbook.
- https://cdn.elifesciences.org/articles/60562/elife-60562-fig3-figsupp2-data1-v2.xlsx
Figure 4 with 1 supplement
Canonical Wnt signaling genes may be directly activated by injury-responsive transcription factors.
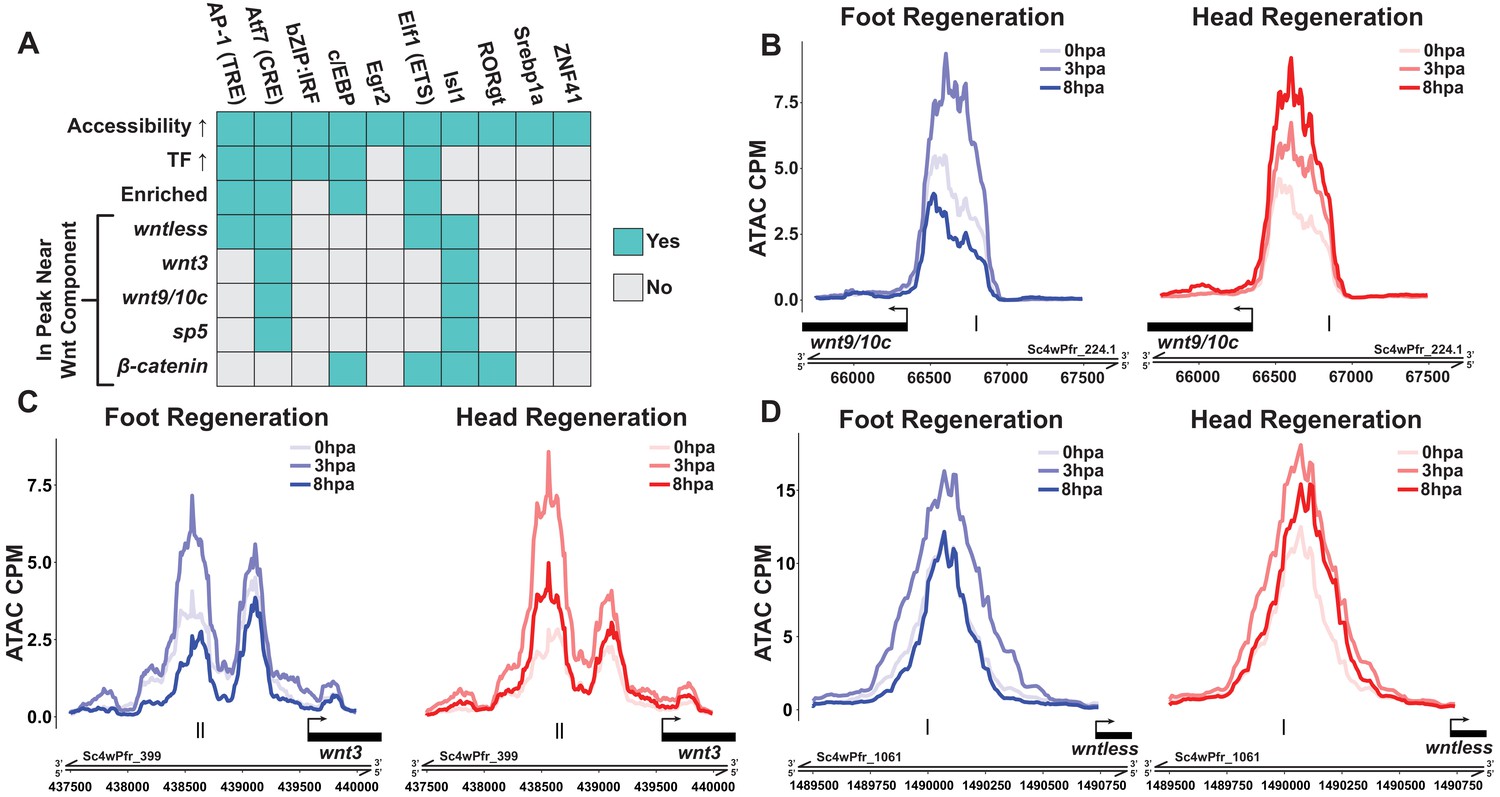
(A) Plot depicting which injury-responsive transcription factor binding motifs (TFBMs) matched the criteria of a plausible regulator of injury-induced Wnt component expression. The AP-1, Atf7, c/EBP, and Elf1 TFBMs are plausible candidate regulators of injury-induced Wnt component expression. ‘Accessibility ↑’ refers to TFBMs that were associated with a significant increase in chromatin accessibility at 3 hr post amputation (hpa) as calculated by chromVAR. ‘TF ↑’ refers to TFBMs with at least one transcription factor that could plausibly bind that TFBM showing significant upregulation during head and foot regeneration at 3 hpa. ‘Enriched’ refers to TFBMs that were significantly enriched in peaks that showed significant increases in accessibility during head and foot regeneration at 3 hpa when compared to peaks that did not increase in accessibility using HOMER. The remaining rows indicate whether or not a given TFBM was found in ATAC-seq peaks located near each respective injury-responsive Wnt signaling component. (B–D) ATAC-seq accessibility data for Wnt signaling gene loci during regeneration. The presumptive promoters of injury-induced Wnt signaling genes are likely directly regulated by basic leucine zipper transcription factors. Black tick marks indicate predicted cAMP response element (CRE) hits in putative promoter regions. CRE hits were identified using HOMER. CPM: average ATAC-seq counts per million calculated using a 10 bp bin size.
Figure 4—figure supplement 1
Basic leucine zipper (bZIP) transcription factors are transiently upregulated during head and foot regeneration at 3 hr post amputation.
(A–D) RNA expression plots showing average normalized RNA-seq read counts for bZIP TFs in log2 counts per million (log2CPM) during head and foot regeneration.
Figure 5 with 1 supplement

Prolonged injuries induce ectopic head formation.
(A) Experimental design to test for the sufficiency of injury to induce new organizer formation in tissue with or without pre-existing organizers. (B) Prolonged injuries induce ectopic head regeneration when pre-existing organizers are removed. Scale bars indicate 1 mm. (C) Quantification of the number of ectopic tentacles induced by various impalement injury conditions. Both the presence of pre-existing organizers and the duration of the injury signal significantly contributed to the ectopic head regeneration phenotype. –Org indicates that organizers were removed just prior to impalement, and +Org indicates that organizers were left intact. (D) RT-qPCR results for head-specific transcripts in tissue that had been impaled for 12 hr. The Wnt signaling genes wnt3, wntless, and wnt9/10c and the head-specific transcription factor brachyury1 (bra1) are significantly upregulated after 12 hr of impalement. Three biological replicates, each consisting of tissue originating from 15 polyps, were generated for each treatment. Error bars indicate standard deviation. All statistical analyses were performed on 2-∆Cq values using Tukey’s HSD in R. Numbers in parenthesis indicate p-values. (E) Experimental design to test both the sufficiency of injury to induce ectopic heads during foot regeneration and the inhibitory capacity of oral-facing amputations. (F) Prolonged injuries induce ectopic heads at aboral-facing amputations, but only if prolonged oral-facing amputations are removed. Scale bars indicate 0.5 mm. The white arrowhead indicates a regenerated basal disk. (G) Quantification of the number of ectopic tentacles induced by various impalement injury conditions. +reamp indicates that the oral half of the regenerating tissue fragment was removed after 12 hr of impalement. HR: head regeneration; FR: foot regeneration, * indicates p-value≤0.05, ** indicates p-value≤0.01, *** indicates p-value≤0.001. All animals were imaged 4 days post injury, giving sufficient time for any removed structures to regenerate.
Figure 5—figure supplement 1
Puncture injuries induce Wnt pathway gene expression.
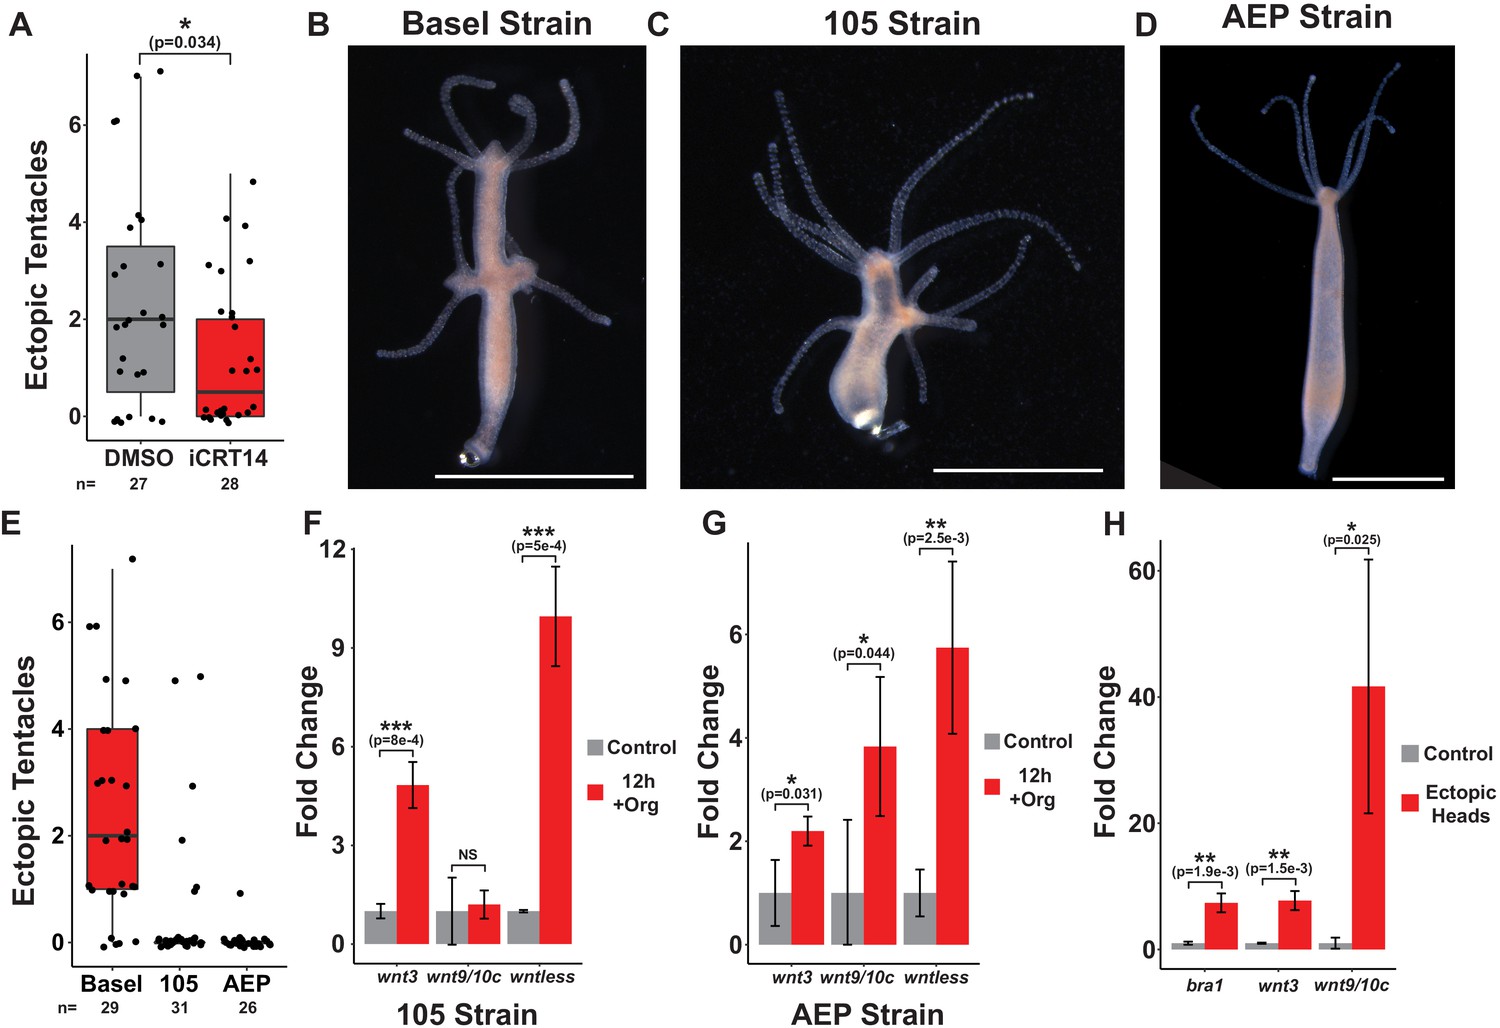
(A) Quantification of the effect of iCRT14 treatment on ectopic tentacle formation following transverse impalement. Ectopic tentacle formation following prolonged injury is TCF-dependent. Hydra polyps lacking pre-existing organizers were impaled on fishing line for 12 hr and then left to recover in either 0.05% dimethyl sulfoxide (DMSO) or 5 µM iCRT14. Ectopic tentacles were quantified at 4 days post injury. Student’s t-test was used to compare the number of ectopic tentacles in DMSO and iCRT14-treated animals. (B–D) The results of 12 hr of impalement in animals lacking pre-existing organizers across different Hydra strains. Basel (B) and 105 (C) strain Hydra exhibit ectopic head regeneration following impalement, but AEP strain Hydra (D) do not. Basel strain animals were used for all experiments in Figure 5. Scale bars indicate 1 mm. (E) Quantification of the number of ectopic tentacles induced by 12 hr of impalement for each strain. (F, G) Quantitative reverse transcription PCR (qPCR) quantification of injury-induced changes in Wnt pathway gene expression in 105 (F) and AEP (G) strain polyps with intact organizers that were impaled for 12 hr. Wnt pathway gene expression is induced following prolonged injury in 105 and AEP strain Hydra. (H) qPCR quantification of Wnt pathway gene expression in ectopic heads compared to impaled tissue that failed to form ectopic heads in Basel strain animals. Ectopic heads express Wnt pathway genes at significantly higher levels than impaled tissue that did not form ectopic heads. Error bars indicate standard deviation. All statistical analyses were performed on 2-∆Cq values using Tukey’s HSD in R. Numbers in parenthesis indicate p-values. HR: head regeneration; FR: foot regeneration, * indicates p-value≤0.05, ** indicates p-value≤0.01, *** indicates p-value≤0.001.
Figure 6 with 1 supplement
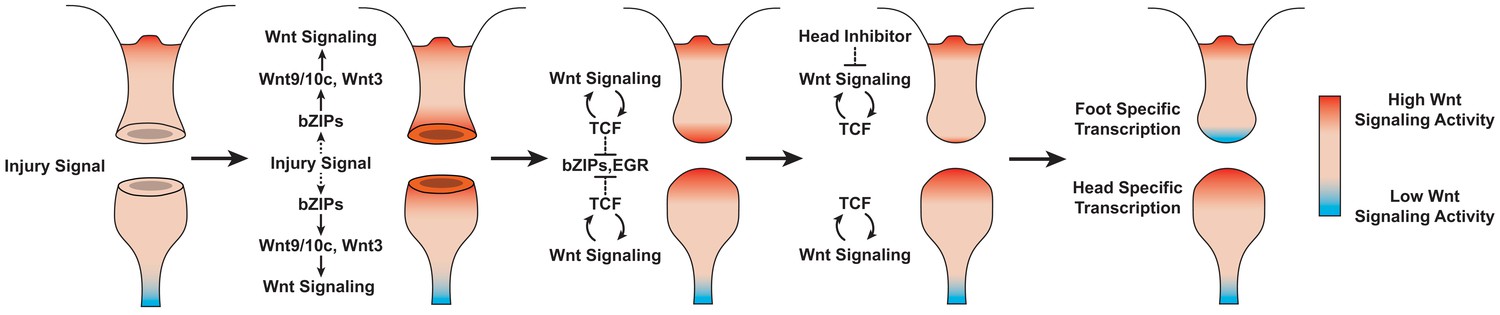
Proposed model of canonical Wnt signaling activity following mid-gastric bisection in Hydra.
Injury triggers a Wnt signaling cascade regardless of tissue context through the direct upregulation of the Wnt ligands wnt9/10c and wnt3 via injury-responsive basic leucine zipper transcription factors. An increase in Wnt signaling then represses injury-responsive transcription factors in a TCF-dependent manner. While Wnt signaling has the capacity for autocatalytic amplification, this only occurs during head regeneration as the autocatalytic amplification is blocked during foot regeneration by an uncharacterized inhibitor originating from pre-existing oral tissue. HR: head regeneration; FR: foot regeneration. Red coloration denotes high Wnt signaling activity. Blue coloration denotes low Wnt signaling activity.
Figure 6—figure supplement 1
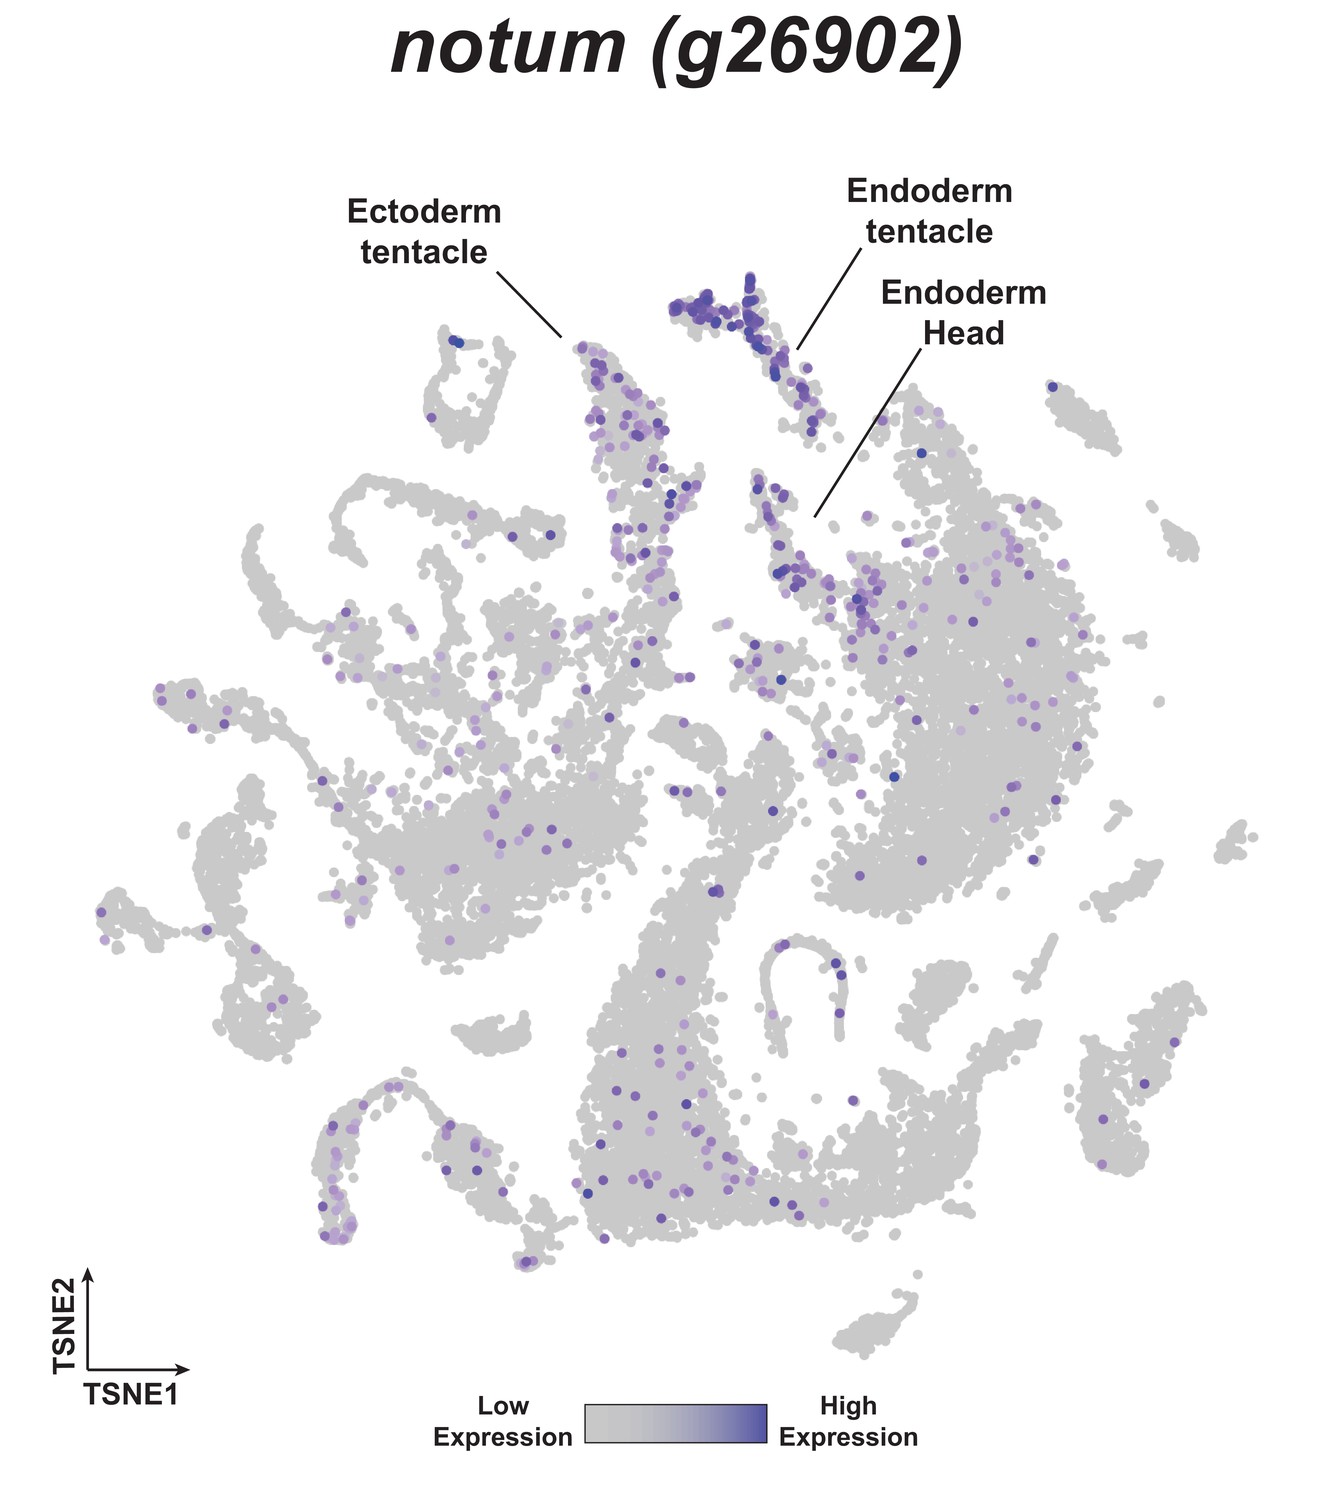
notum is expressed in head tissue in whole uninjured Hydra.
t-distributed stochastic neighbor embedding (t-SNE) plot depicting notum expression in the Hydra single-cell RNA-seq atlas (Siebert et al., 2019).
Author response image 1

TUNEL staining gives inconsistent results in uninjured and regenerating tissue.
Whole uninjured animals, or animals that were bisected and allowed to regenerate for 1 or 3 hours, were fixed and then stained using the ApopTag TUNEL kit (Σ-Aldrich, S7110). All timepoints and regeneration types, including uninjured controls, exhibited highly variable TUNEL signal..
Tables
Table 1
ATAC-seq library statistics.
A total of 71 ATAC-seq libraries were generated, with between 3 and 5 biological replicates per treatment. HPA refers to hours post amputation. + in the iCRT column indicates regenerating animals were pre-incubated in 5 µM iCRT14 for 2 hr prior to amputation and then left in the iCRT14 solution until tissue was collected for library preparation; – in the iCRT column indicates animals were left untreated. Total read pairs refers to the number of raw read pairs generated for each library. Final mapped read pairs refers to the number of read pairs remaining after mitochondrial, duplicated, and unmapped or ambiguously mapped reads were removed. Transcription start sites (TSS) enrichment refers to the fold enrichment in ATAC-seq signal at the TSS of 2000 highly expressed genes relative to regions ±1 kb from the TSS. Reproducible peaks refers to the number of peaks within each treatment group that were biologically reproducible in at least three pairwise comparisons using an irreproducible discovery rate cutoff of 0.1. Benchmarks for both the TSS score and the number of reproducible peaks are highly dependent on the model system and the quality of the reference annotation, but in well-studied systems such as mice, ENCODE considers TSS scores > 5 and >50,000,000 reproducible peaks to be acceptable. The self-consistency ratio refers to the largest fold difference in the number of reproducible peaks recovered from pseudo-replicates (see Materials and methods) when comparing biological replicates within a single treatment group. The rescue ratio refers to the fold difference in the number of reproducible peaks recovered from a dataset with perfect reproducibility (generated by pooling and then randomly splitting reads from a given treatment group) compared to the number of true biologically reproducible peaks. High-quality datasets should have self-consistency ratios and rescue ratios <2.
| Sample ID | HPA | iCRT | Total read pairs | Final mapped read pairs | TSS enrichment | Reproducible peaks | Self-consistency ratio | Rescue ratio |
|---|---|---|---|---|---|---|---|---|
| 0F1 | 0 | – | 68865654 | 31845047 | 6.15 | 78158 | 1.17 | 1.00 |
| 0F2 | 0 | – | 65301503 | 21970963 | 7.16 | |||
| 0F3 | 0 | – | 80642153 | 25843928 | 6.61 | |||
| 0F4 | 0 | – | 76300368 | 25925595 | 6.79 | |||
| 0F5 | 0 | – | 81363105 | 20714765 | 6.79 | |||
| 0H1 | 0 | – | 72424905 | 31676679 | 6.31 | 82396 | 1.17 | 1.04 |
| 0H2 | 0 | – | 68870186 | 27376967 | 6.81 | |||
| 0H3 | 0 | – | 81121398 | 31084966 | 6.50 | |||
| 0H4 | 0 | – | 67378757 | 26076124 | 6.58 | |||
| 0H5 | 0 | – | 81380944 | 26247390 | 6.44 | |||
| 3F1 | 3 | – | 120749030 | 35747201 | 6.44 | 57980 | 1.11 | 1.20 |
| 3F2 | 3 | – | 133453367 | 37551124 | 6.85 | |||
| 3F3 | 3 | – | 128451210 | 44807082 | 6.76 | |||
| 3H1 | 3 | – | 127697432 | 33201124 | 7.45 | 58259 | 1.09 | 1.15 |
| 3H2 | 3 | – | 124784335 | 38517160 | 7.09 | |||
| 3H3 | 3 | – | 130420684 | 36703497 | 7.05 | |||
| 8F1 | 8 | – | 71642160 | 20270917 | 7.30 | 84248 | 1.29 | 1.05 |
| 8F2 | 8 | – | 77325666 | 17968245 | 7.83 | |||
| 8F3 | 8 | – | 75894343 | 17391339 | 7.15 | |||
| 8F4 | 8 | – | 71117490 | 25653837 | 6.98 | |||
| 8F5 | 8 | – | 74203082 | 30614424 | 7.17 | |||
| 8H1 | 8 | – | 72411934 | 18714649 | 7.18 | 83974 | 1.18 | 1.04 |
| 8H2 | 8 | – | 76210411 | 16618719 | 7.78 | |||
| 8H3 | 8 | – | 74495918 | 22207972 | 6.53 | |||
| 8H4 | 8 | – | 68874107 | 28397085 | 6.78 | |||
| 8H5 | 8 | – | 85121623 | 26333487 | 6.31 | |||
| 12F1 | 12 | – | 35989738 | 16371364 | 7.81 | 71949 | 1.09 | 1.00 |
| 12F2 | 12 | – | 37815306 | 16333732 | 7.26 | |||
| 12F3 | 12 | – | 31696505 | 10175518 | 7.47 | |||
| 12F4 | 12 | – | 35835498 | 10383772 | 8.43 | |||
| 12F5 | 12 | – | 27753392 | 9458838 | 7.78 | |||
| 12H1 | 12 | – | 46530322 | 17225290 | 6.98 | 71463 | 1.16 | 1.05 |
| 12H2 | 12 | – | 33411133 | 16231389 | 6.68 | |||
| 12H3 | 12 | – | 38128076 | 9053148 | 8.13 | |||
| 12H4 | 12 | – | 37038785 | 8069733 | 7.94 | |||
| 12H5 | 12 | – | 35508148 | 9077295 | 7.10 | |||
| 0iF1 | 0 | + | 29450456 | 13933591 | 6.99 | 68393 | 1.13 | 1.03 |
| 0iF2 | 0 | + | 47282308 | 23905822 | 6.18 | |||
| 0iF3 | 0 | + | 54230058 | 25344368 | 6.02 | |||
| 0iF4 | 0 | + | 40244798 | 18954394 | 6.43 | |||
| 0iH1 | 0 | + | 64726838 | 26952996 | 5.79 | 70771 | 1.08 | 1.05 |
| 0iH2 | 0 | + | 46838471 | 22246978 | 6.8 | |||
| 0iH3 | 0 | + | 40909454 | 18903370 | 6.87 | |||
| 0iH4 | 0 | + | 54067924 | 25119346 | 6.35 | |||
| 3iF1 | 3 | + | 54065239 | 10886919 | 5.96 | 67391 | 1.16 | 1.06 |
| 3iF2 | 3 | + | 48714606 | 14470686 | 6.55 | |||
| 3iF3 | 3 | + | 44688328 | 16294810 | 6.71 | |||
| 3iF4 | 3 | + | 36970695 | 15737834 | 5.81 | |||
| 3iF5 | 3 | + | 32077041 | 12065542 | 5.3 | |||
| 3iH1 | 3 | + | 46903548 | 9057427 | 7.19 | 62579 | 1.12 | 1.00 |
| 3iH2 | 3 | + | 41743618 | 15654587 | 6.79 | |||
| 3iH3 | 3 | + | 38888634 | 12484017 | 6.85 | |||
| 3iH4 | 3 | + | 45598782 | 16242466 | 6.54 | |||
| 8iF1 | 8 | + | 50536148 | 13430112 | 6.78 | 61139 | 1.26 | 1.05 |
| 8iF2 | 8 | + | 54337061 | 12648440 | 7.11 | |||
| 8iF3 | 8 | + | 52282170 | 11852948 | 5.21 | |||
| 8iF4 | 8 | + | 42891267 | 12120423 | 5.43 | |||
| 8iH1 | 8 | + | 42290670 | 11796387 | 6.72 | 65043 | 1.57 | 1.10 |
| 8iH2 | 8 | + | 39596909 | 14998918 | 5.20 | |||
| 8iH3 | 8 | + | 39883594 | 12563437 | 5.27 | |||
| 8iH4 | 8 | + | 28249292 | 8393601 | 4.57 | |||
| 8iH5 | 8 | + | 43953185 | 10799451 | 7.85 | |||
| 12iF1 | 12 | + | 39257829 | 13879417 | 7.14 | 70505 | 1.05 | 1.01 |
| 12iF2 | 12 | + | 42214218 | 16259721 | 7.39 | |||
| 12iF3 | 12 | + | 40921039 | 10536561 | 7.64 | |||
| 12iF4 | 12 | + | 45775901 | 12512902 | 7.54 | |||
| 12iF5 | 12 | + | 36779064 | 10269191 | 7.39 | |||
| 12iH1 | 12 | + | 43772456 | 18806981 | 6.49 | 65492 | 1.14 | 1.01 |
| 12iH2 | 12 | + | 37690946 | 15270494 | 6.95 | |||
| 12iH3 | 12 | + | 42788391 | 11435578 | 7.54 | |||
| 12iH4 | 12 | + | 42138119 | 15016298 | 6.48 |
Table 2
RNA-seq library statistics.
A total of 42 RNA-seq libraries were generated, with three biological replicates per treatment. HPA refers to hours post amputation. + in the iCRT column indicates regenerating animals were pre-incubated in 5 µM iCRT14 for 2 hr prior to amputation and then left in the iCRT14 solution until tissue was collected for library preparation; – in the iCRT column indicates animals were left untreated. Total reads refers to the number of raw reads generated for each library. Final mapped reads refers to the number of reads that were successfully mapped to the Hydra 2.0 genome gene models.
| Sample ID | HPA | iCRT | Total reads | Final mapped reads |
|---|---|---|---|---|
| 0F1 | 0 | – | 29284004 | 21541719 |
| 0F2 | 0 | – | 24597360 | 17966439 |
| 0F3 | 0 | – | 23926341 | 17350620 |
| 0H1 | 0 | – | 25833101 | 18858726 |
| 0H2 | 0 | – | 27241258 | 19701074 |
| 0H3 | 0 | – | 26803090 | 19487287 |
| 3F1 | 3 | – | 24824468 | 18479637 |
| 3F2 | 3 | – | 23840505 | 17694124 |
| 3F3 | 3 | – | 23900532 | 17743737 |
| 3H1 | 3 | – | 25874570 | 19207371 |
| 3H2 | 3 | – | 24172310 | 17898155 |
| 3H3 | 3 | – | 23397937 | 17670977 |
| 8F1 | 8 | – | 23040344 | 17160851 |
| 8F2 | 8 | – | 26019557 | 19216264 |
| 8F3 | 8 | – | 29378123 | 22033550 |
| 8H1 | 8 | – | 25548801 | 19003624 |
| 8H2 | 8 | – | 21601150 | 16154188 |
| 8H3 | 8 | – | 23904011 | 17656019 |
| 12F1 | 12 | – | 26995204 | 18138493 |
| 12F2 | 12 | – | 23703527 | 15445837 |
| 12F3 | 12 | – | 25488245 | 16491319 |
| 12H1 | 12 | – | 34878154 | 22910100 |
| 12H2 | 12 | – | 31662571 | 21545505 |
| 12H3 | 12 | – | 28192288 | 18744249 |
| 0iF1 | 0 | – | 26635485 | 17851347 |
| 0iF2 | 0 | + | 28052169 | 18904815 |
| 0iF3 | 0 | + | 30718370 | 20708864 |
| 0iH1 | 0 | + | 36328076 | 23784082 |
| 0iH2 | 0 | + | 26044439 | 17240456 |
| 0iH3 | 0 | + | 31384073 | 20624671 |
| 8iF1 | 8 | + | 37979732 | 24369941 |
| 8iF2 | 8 | + | 31722061 | 20432162 |
| 8iF3 | 8 | + | 38252155 | 25503172 |
| 8iH1 | 8 | + | 34522120 | 22339316 |
| 8iH2 | 8 | + | 34442705 | 21537194 |
| 8iH3 | 8 | + | 29727022 | 19082280 |
| 12iF1 | 12 | + | 22354289 | 13460197 |
| 12iF2 | 12 | + | 35141637 | 21948916 |
| 12iF3 | 12 | + | 35240879 | 22241372 |
| 12iH1 | 12 | + | 25883305 | 16660844 |
| 12iH2 | 12 | + | 32237790 | 20843729 |
| 12iH3 | 12 | + | 73113728 | 44132834 |
Table 3
Genome gene model IDs for in-text gene names.
The Hydra 2.0 genome gene model IDs that correspond to the gene names used in this study. The Hydra 2.0 genome gene models can be found at arusha.nhgri.nih.gov/hydra/download/?dl=n.
| Gene name | Genome gene model ID |
|---|---|
| axin | g14938 |
| bax | g7775 |
| bcl-like-6 | g22655 |
| brachyury1 | g24952 |
| budhead | g24126 |
| caspase3-like | g664 |
| caspase-3c | g31854 |
| cr3l | g32585 |
| creb | g16491 |
| dapk2-like | g14048 |
| dff40 | g11021 |
| dishevelled | g29781 |
| distal-less | g18245 |
| fos | g23720 |
| foxd2-like | g28449 |
| fzd4/9/10 | g27891 |
| gata-3-like | g20911 |
| gremlin-like | g14229 |
| hsp70-like | g16168 |
| jun | g1450 |
| naked cuticle | g30442 |
| nk-2 | g31954 |
| notum | g26902 |
| prdl-a | g15226 |
| p53 | g21693 |
| sFRP | g12274 |
| sp5 | g33422 |
| tcf | g27364 |
| wnt3 | g28064 |
| wnt7 | g29750 |
| wnt9/10c | g33373 |
| wntless | g18842 |
Key resources table
| Reagent type (species) or resource | Designation | Source or reference | Identifiers | Additional information |
|---|---|---|---|---|
| Strain, strain background (Hydra vulgaris) | AEP | Martin et al., 1997; Wittlieb et al., 2006 | ||
| Strain, strain background (Hydra vulgaris) | 105 | Chapman et al., 2010 | ||
| Strain, strain background (Hydra vulgaris) | Basel | Technau and Holstein, 1995 | ||
| Commercial assay or kit | Tagment DNA Enzyme and Buffer Small Kit | Illumina | 20034197 | |
| Commercial assay or kit | Kapa mRNA-seq Hyper kit | Roche | KK8581 | |
| Commercial assay or kit | MinElute PCR Purification Kit | QIAGEN | 28004 | |
| Commercial assay or kit | DNase Set | QIAGEN | 79254 | |
| Commercial assay or kit | RNA Clean and Concentrator kit | Zymogen | R1017 | |
| Chemical compound, drug | iCRT14 | Sigma-Aldrich | SML0203 | |
| Software, algorithm | R | R | RRID:SCR_001905 | |
| Other | Agencourt AMPure XP beads | Beckman Coulter | A63881 | |
| Other | 2X NEBNext master mix | NEB | M0541S | |
| Other | M-MLV RNase H Minus Point Mutant Reverse Transcriptase | Promega | M3682 | |
| Other | SsoAdvanced universal SYBR green master mix | Bio-Rad | 1725271 |
Additional files
-
Supplementary file 1
Full results tables for all pairwise comparisons performed on ATAC-seq data.
Excel workbook containing the results tables generated by edgeR as individual worksheets. Peaks were included in the analysis if they had at least 10 mapped counts per million in at least three samples. The first sheet in the workbook (‘Contrasts’) provides the formulae associated with the names assigned to each comparison in the workbook. The peakset files (‘untreated_consensus_diffbind_labels.bed’ and ‘full_consensus_diffbind_labels.bed’) used to assign the peak ID numbers used in this worksheet are provided in the repositories (Github or Dryad) associated with this study.
- https://cdn.elifesciences.org/articles/60562/elife-60562-supp1-v2.xlsx
-
Supplementary file 2
Full results tables for all pairwise comparisons performed on RNA-seq data.
Excel workbook containing the results tables generated by edgeR as individual worksheets. The first sheet in the workbook (‘Contrasts’) provides the formulae associated with the names assigned to each comparison in the workbook. Genes were included in the analysis if they had at least two mapped counts per million in at least three samples. The first sheet in the worksheet (‘Contrasts’) provides the formulae/descriptions associated with the names given to each comparison in the workbook.
- https://cdn.elifesciences.org/articles/60562/elife-60562-supp2-v2.xlsx
-
Supplementary file 3
Full motif enrichment and accessibility results.
Excel workbook containing the full results tables generated by HOMER and chromVAR. The HOMER results contain transcription factor binding motif (TFBM) enrichment statistics for peaks that show an increase in accessibility from 0 to 3 hr post amputation (hpa) relative to peaks that did not show an increase in accessibility from 0 to 3 hpa. The chromVAR results contain the variability scores for all TFBMs considered in the analysis.
- https://cdn.elifesciences.org/articles/60562/elife-60562-supp3-v2.xlsx
-
Supplementary file 4
Primer sequences.
Excel worksheet containing the sequences of all primers used in this study.
- https://cdn.elifesciences.org/articles/60562/elife-60562-supp4-v2.xlsx
-
Transparent reporting form
- https://cdn.elifesciences.org/articles/60562/elife-60562-transrepform-v2.docx
Download links
A two-part list of links to download the article, or parts of the article, in various formats.
Downloads (link to download the article as PDF)
Open citations (links to open the citations from this article in various online reference manager services)
Cite this article (links to download the citations from this article in formats compatible with various reference manager tools)
Generic injuries are sufficient to induce ectopic Wnt organizers in Hydra
eLife 10:e60562.
https://doi.org/10.7554/eLife.60562


