Single molecule microscopy reveals key physical features of repair foci in living cells
- Institut Curie, PSL University, Sorbonne Université, CNRS, Nuclear Dynamics, France
- Laboratoire de Physique de l’Ecole Normale Supérieure, PSL University, CNRS, Sorbonne Université , Université de Paris, France
- Institut Curie, PSL University, Sorbonne Université, CNRS, Physico Chimie Curie, France
- Cogitamus Laboratory, France
Figures
Figure 1 with 5 supplements

Rad52 diffusion observed at the single molecule level, in the absence of DNA damage.
(A) Design of the experiment. Haploid yeast strain harboring Rad52 endogenously fused to Halo and incubated with fluorogenic JF646 dyes are visualized by Single Particle Tracking (SPT). Individual Rad52-Halo/JF646 are tracked at 20 ms time intervals (50 Hz), movies are 1000 frames long. (B) Typical S/G2 haploid cells harboring Rad52-Halo coupled with JF646 (Rad52-Halo/JF646). From left to right: transmission image; time-projection of a typical SPT acquisition (see Materials and methods); Rad52 detections: each spot represents a single detection of Rad52-Halo/JF646, the color map indicates the number of Rad52 neighbors inside a 50 nm radius disk; Rad52 traces: each line represents the trajectory of a detection, the color map indicates the distance covered in 20 ms. The bar scale represents 1 μm. This typical nucleus exhibits 682 detections and 129 traces. (C) Schematic of SPT experiment: individual molecules are tracked in 2-dimensions. The blue rectangle represents the observable z-section. (D) Distribution of tracks length of Rad52-Halo/JF646 in the absence of DNA damage. The histogram combines 23 S/G2 phase cells representing 964 traces (mean length of 7.5 fames), and 6252 displacements of 20 ms. S/G2 cells were selected based on the presence and the size of a bud on the transmission image. (E) Probability Density Function (PDF) of Rad52-Halo/JF646 molecules of haploid S/G2-phase cells in the absence of DNA damage. The time interval is 20 ms. Red: 2-population fit; dashed purple: slow population; dashed orange: fast population; Black: 1-population fit. (F) Cumulative Density Function (CDF) of Rad52-Halo/JF646 molecules in haploid S/G2-phase cells in the absence of DNA damage. Dashed green line: data; Red: 2-population fit; Black: 1-population fit. The p-values are indicated in parenthesis (see Materials and methods). (G) Probability Density Function (PDF) of Rad52-Halo/JF646 molecules in haploid S/G2-phase cells in the absence of DNA damage, for time-points spaced by 20, 40, 60, 80, 100 and 120 ms. The lines show the 2-population fit performed on each PDF. (H) Diffusion coefficient D (μm2/s) obtained from the fits shown in G for each Δt. The fits (dotted lines) represent the expected fraction calculated from simulations (see Materials and methods). (I) Typical cell harboring Rad52-Halo/JF646. Left: transmission image; right: time-projection of a typical SPT acquisition (1000 frames). (J) Displacement histogram of S/G2 cells (blue) versus G1 cells (red). (K) Probability Density Function (PDF) of Rad52-Halo/JF646 molecules in haploid G1 cells in the absence of DNA damage. Black: 1-population fit; Red: 2-population fit; dashed purple: slow molecule; dashed orange: fast molecules.
Figure 1—figure supplement 1
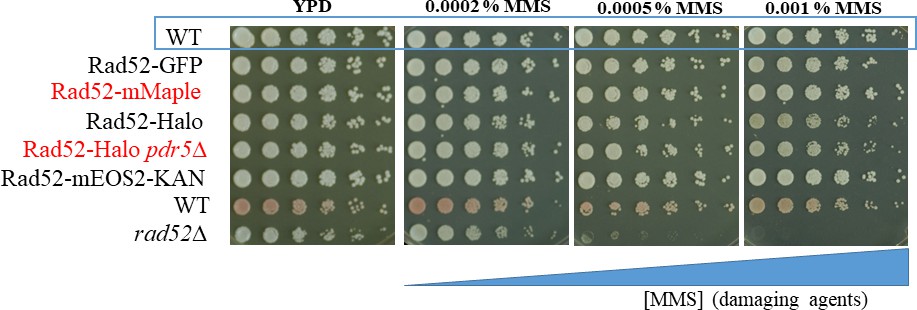
Dilution assay of strains harboring Rad52-mMaple or Rad52-Halo on MMS plates.
The functionality of strains harboring Rad52-mMaple or Rad52-Halo was tested by dilution assays on plates containing methyl methanesulfonate (MMS). The Rad52-GFP, provided by Mickael Lisby (Lisby et al., 2001, n.d.) is used as a reference strain and exhibits similar viability than the Rad52-mMaple used in this study. For Rad52-Halo strains, the viability of the strains has been tested in the absence of JF647 dyes. At the higher MMS concentration, we observed a very mild defect in strains expressing Rad52-Halo. However, most of the experiments performed with Rad52-Halo have been duplicated with a strain expressing Rad52-mMaple. We observed similar diffusive behaviors using the two strains, both in the absence and in the presence of DSB. However, since JF646 are much brighter than mMaple, we obtained longer traces by tracking Rad52-Halo bound to JF646 allowing us to extract more information.
Figure 1—figure supplement 2

Visualization of Rad52 at the single molecule level.
A low concentration of JF646 was used allowing the observation of individual molecules. (A) Consecutive frames from a typical movie: Rad52-Halo/JF646 is visible as a spot in 10 consecutive frames acquired at 50 Hz (20 ms time-intervals). (B) Number of Rad52-Halo/JF646 detections per frame for two typical cells: Blue: number of detections per frame inside a cell in the absence of DNA damage induction; Red: number of detections per frame inside a Rad52 focus in a cell after 2 hr of I-SceI induction.
Figure 1—figure supplement 3

Characterization of JF646 photo-bleaching in budding yeast.
Haploid yeast harboring Rad52-Halo were incubated for 1 hr with 50 nM of fluorogenic JF646 (see Materials and methods) and visualized on a PALM microscope. We then measured the bleaching time of JF646 in 5 cells shown with different colors (insert panel). The average decay (blue curve) was fitted with , where the half-life of JF646 is estimated at τ = 2.1 s. The half-life of JF646 is 2.1 s while the longest trace is 1.3 s. Thus, traces length is not limited by the photo bleaching of the JF646 dyes. The short traces length observed in the absence of DSB are rather due to molecules moving out of focus.
Figure 1—figure supplement 4
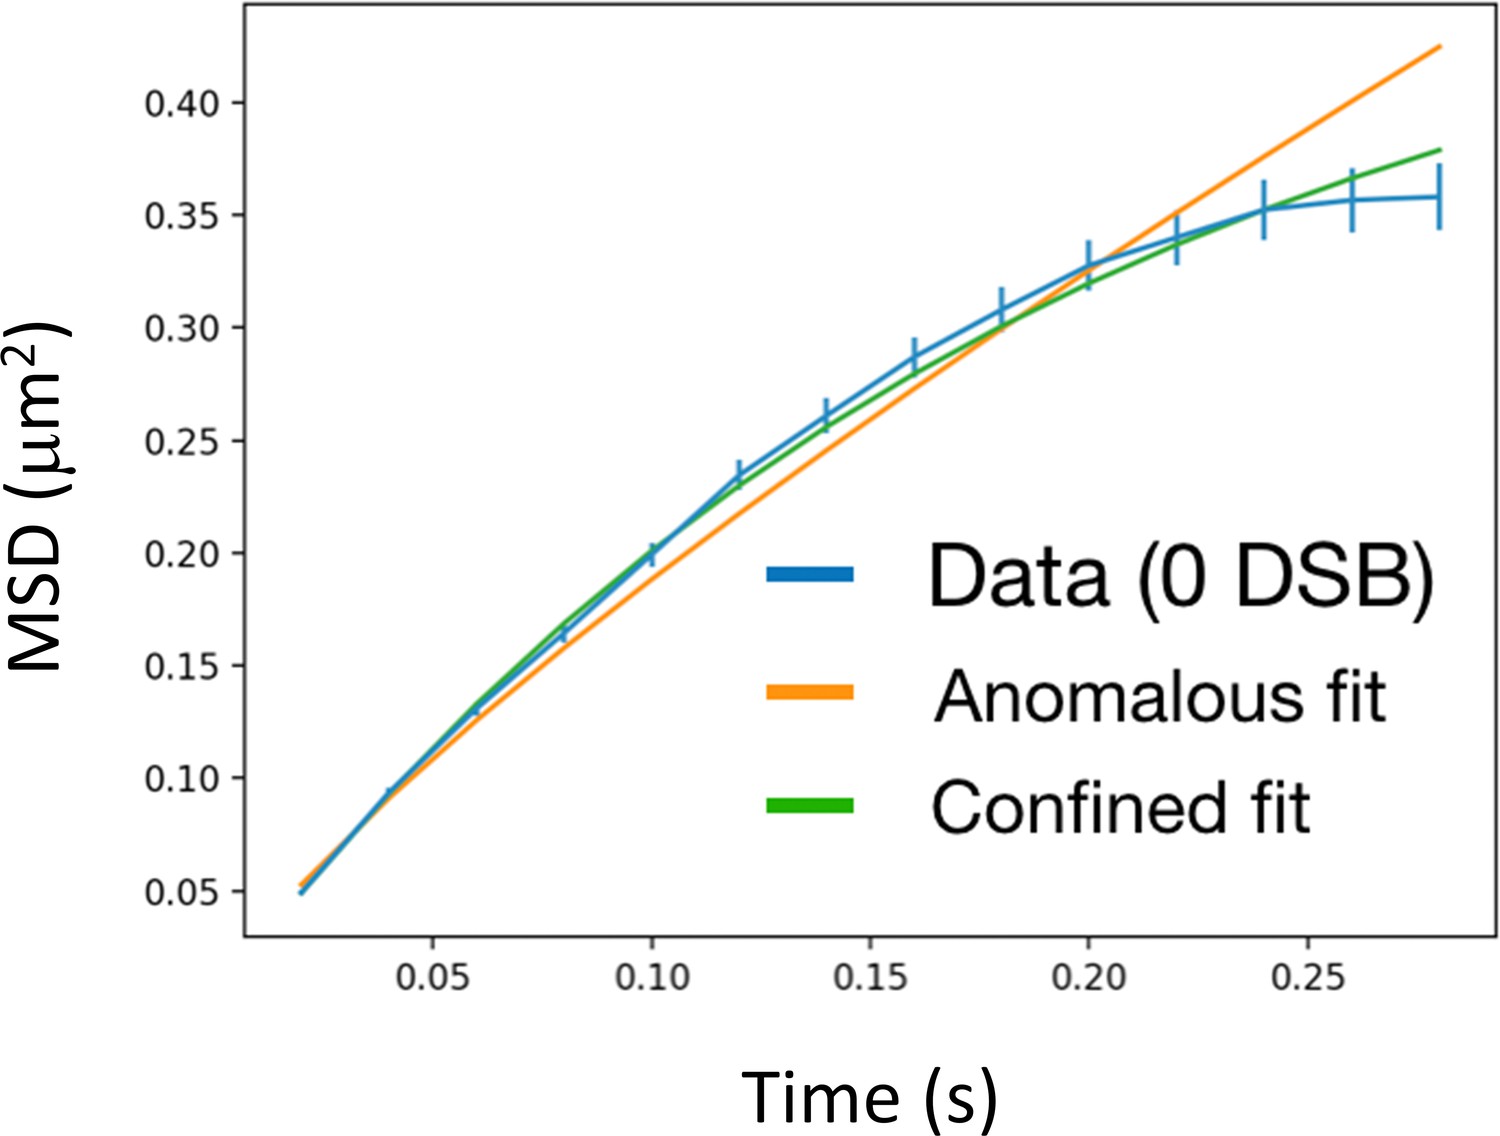
In the absence of DSB, Rad52 explores the whole nucleus.
Blue: MSD of individual Rad52 molecules (Rad52-Halo/JF646) in the absence of DSB; Green: the data are fitted with a confined diffusion; Orange: the data are fitted with an anomalous diffusion. The confined fit is in better agreement with the data (chi-2 / NDF = 47.38/10 for the anomalous fit, chi22/ NDF = 4.15/10 for the confined fit, where NDF is the number of degree of freedom). We obtained a Rad52 confinement radius of 800 nm, close to the radius of haploid yeast nuclei (Rhaploid = 900 nm, as measured in Hozé et al., 2013), indicating that Rad52 explores most of the nucleus in the absence of DSB.
Figure 1—figure supplement 5
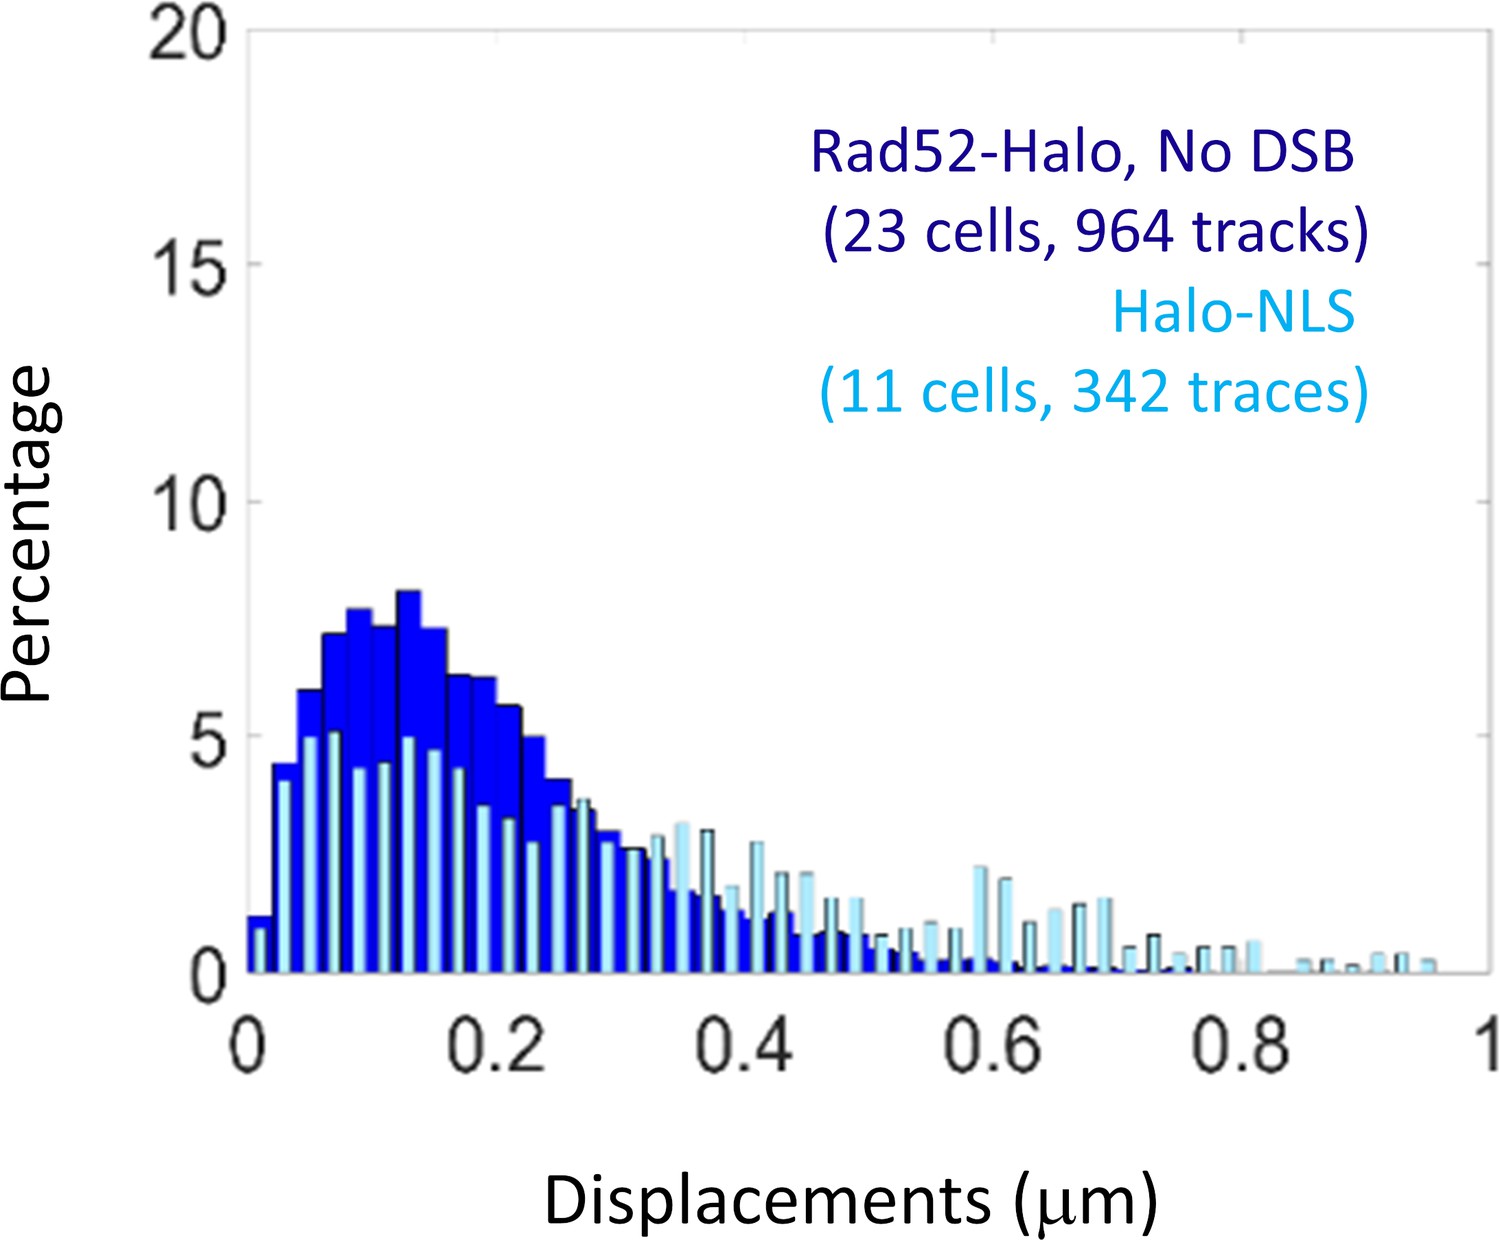
Displacement of free Halo-NLS.
Since JF646 are fluorogenic, they are visible only when bound to HaloTag. To measure the diffusion of free JF646, we thus used a haploid strains expressing NLS-Halo. Cells were grown until OD 0.8 and incubated 1 hr of with 10 nM of JF646. Light blue: Diffusion of free Halo/JF646 in a S/G2 cells harboring Halo-NLS. Dark blue: diffusion of Rad52-Halo in the absence of DSB (same data as Figure 1E). The time interval is 20 ms for both experiments.
Figure 2 with 5 supplements
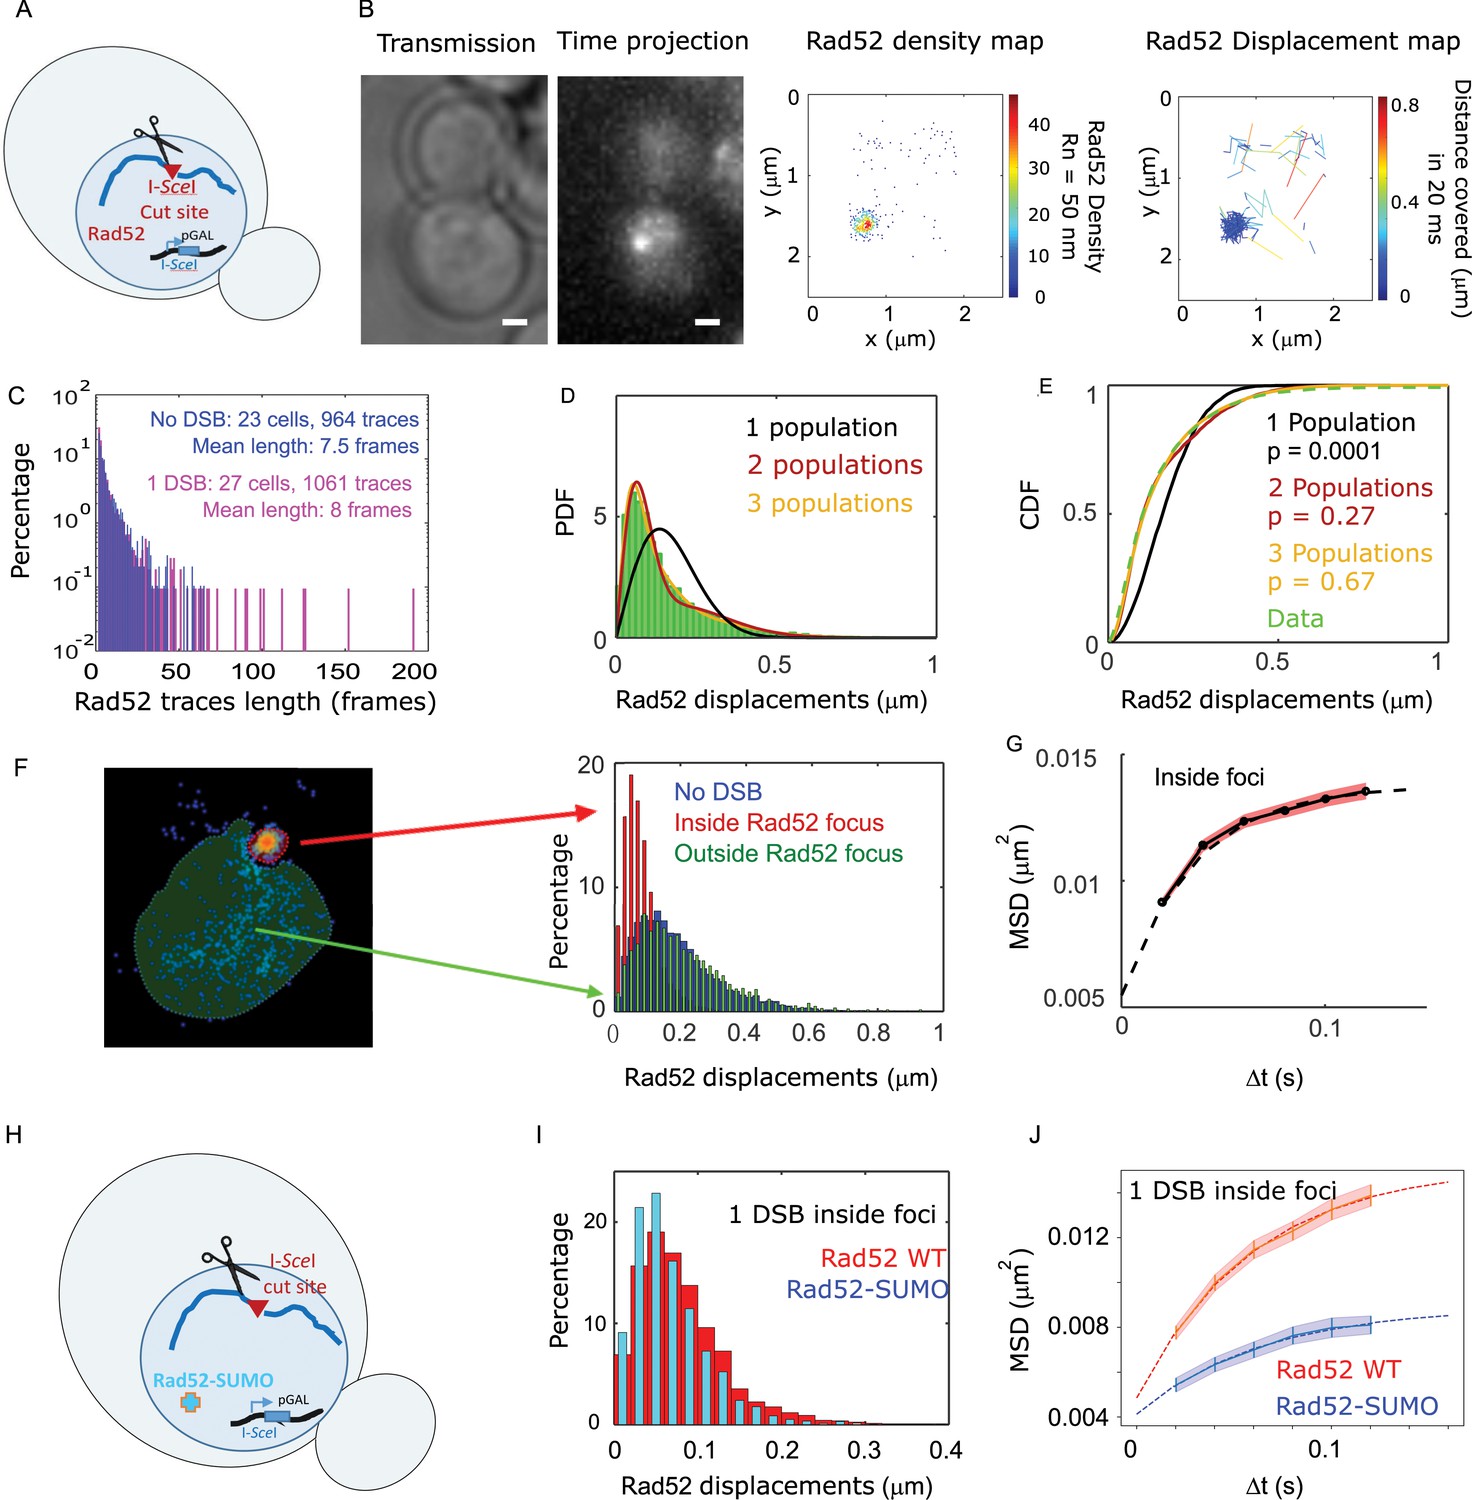
Rad52 diffusion at the single molecule level in the presence of a single I-SceI induced DSB.
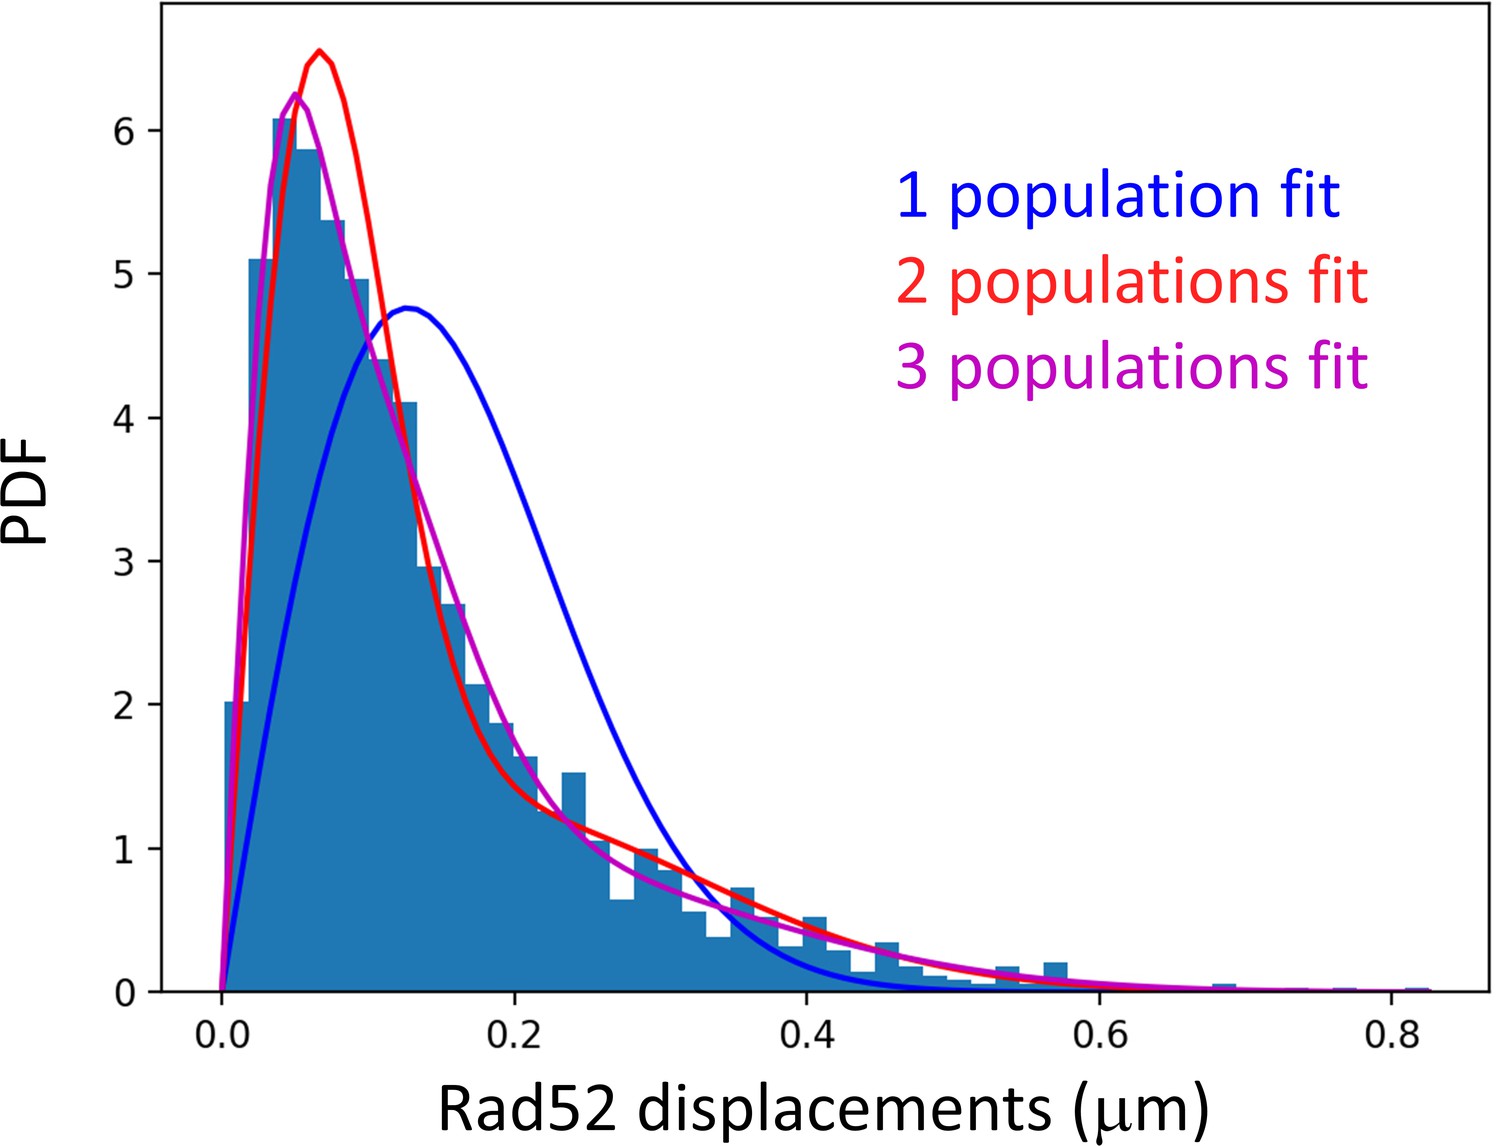
(A) Design of the experiment. We induced a single DSB in haploid cells harboring Rad52 endogenously fused to Halo as well as an I-SceI cut site inducible under galactose promoter. The DSB is induced for 2 hours and fluorgenic JF646 dyes are added to the medium during the last hour of incubation prior visualization by SPT.for 2 hr and fluorogenic JF646 dyes are added to the medium during the last hour of incubation prior visualization by SPT. Individual Rad52-Halo/JF646 are tracked at 20 ms time intervals (50 Hz), during 1000 frames. Only cells harboring a Rad52 focus are analyzed. (B) Typical S/G2-phase haploid cells harboring Rad52-Halo/JF646. From left to right: transmission image; time-projection of a typical SPT acquisition; Rad52 detections: each spot represents a single detection of Rad52-Halo/JF646, the color map indicates the number of Rad52 neighbors inside a 50 nm radius disk; Rad52 traces: each line represents the trajectory of a detection, the color map indicates the distance in μm covered in 20 ms. The bar scale represents 1 μm. This particular nucleus exhibits 682 detections and 129 traces. (C) Distribution of tracks length of Rad52-Halo/JF646 in the presence and the absence of a single DSB. The histogram combines 27 S/G2 phase cells, all of them harboring a Rad52 focus, representing 1061 traces (mean length of 8 fames), and 8495 displacements of 20 ms time-intervals. (D) Probability Density Function (PDF) of Rad52-Halo/JF646 molecules in haploid S/G2-phase cells in the presence of a single DSB. The time interval is 20 ms. Green: Rad52 data (27 cells, 1061 trajectories); Black: 1-population fit; Red: 2-population fit; Yellow: 3-population fit. (E) Cumulative Density Function (CDF) of Rad52-Halo/JF646 molecules in haploid S/G2-phase cells in the presence of single DSB. Dashed green line: data; Black: 1-population fit; Red: 2-population fit; Yellow: 3-poulations fit. The p-values are indicated in parenthesis (see Materials and methods). (F) Left: density map of a typical nucleus following the induction of a single DSB. The nucleus is divided in two zones based on a density threshold: the Rad52 focus (highlighted in red) and the rest of the nucleus (highlighted in blue). Right: displacements histograms of trajectories contained inside foci (red) versus outside foci (green). If a trajectory crosses the focus boundary, it is cut into two parts: the part inside and the part outside of the focus. The blue histogram represents the displacement of Rad52 molecules in the absence of DSB (shown in Figure 1E). (G) Mean Square Displacement (MSD) curve of Rad52/Halo/JF646 molecules inside foci. The dotted line shows a fit of the MSD with a confined model (see Materials and methods). (H) Effect of SUMOylation: we induced a single DSB in haploid cells expressing Rad52 endogenously fused to SUMO and Halo, as well as an I-SceI cut site at LYS2 locus inducible under galactose promoter. The DSB is induced for 2 hr and fluorogenic JF646 dyes are added to the medium during the last hour of incubation prior to visualization by SPT. Individual Rad52-Halo/JF646 are tracked at 20 ms time intervals (50 Hz), during 1000 frames. (I) Displacement histogram of traces inside foci of Rad52 wild type cells versus cells expressing Rad52-SUMO in S/G2 phase cells. A single I-SceI DSB is induced for 2 hr, and only cells harboring a Rad52 focus are analyzed. Red: Rad52 wild type; Blue: Rad52-SUMO. (J) MSD curves of individual Rad52 molecules inside foci (red, same data as Figure 3E) versus individual Rad52-SUMO molecules inside foci (pink). MSD curves are fitted with a confined model (see Materials and methods).
Figure 2—figure supplement 1
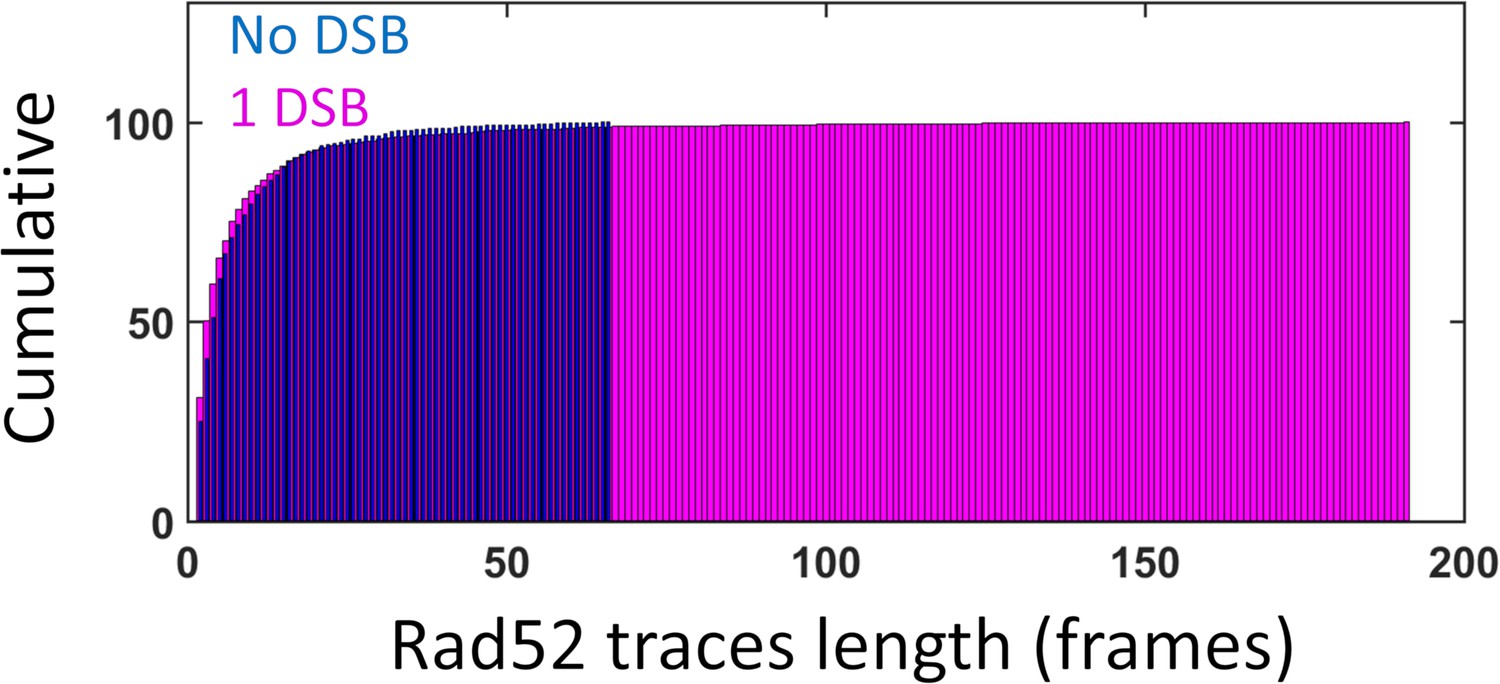
Cumulative distribution of Rad52-Halo/JF646 traces length in the nucleus.
(similar data as Figure 2C). Blue: in the absence of DNA damage; Pink: in the presence of a single DSB.
Figure 2—figure supplement 2
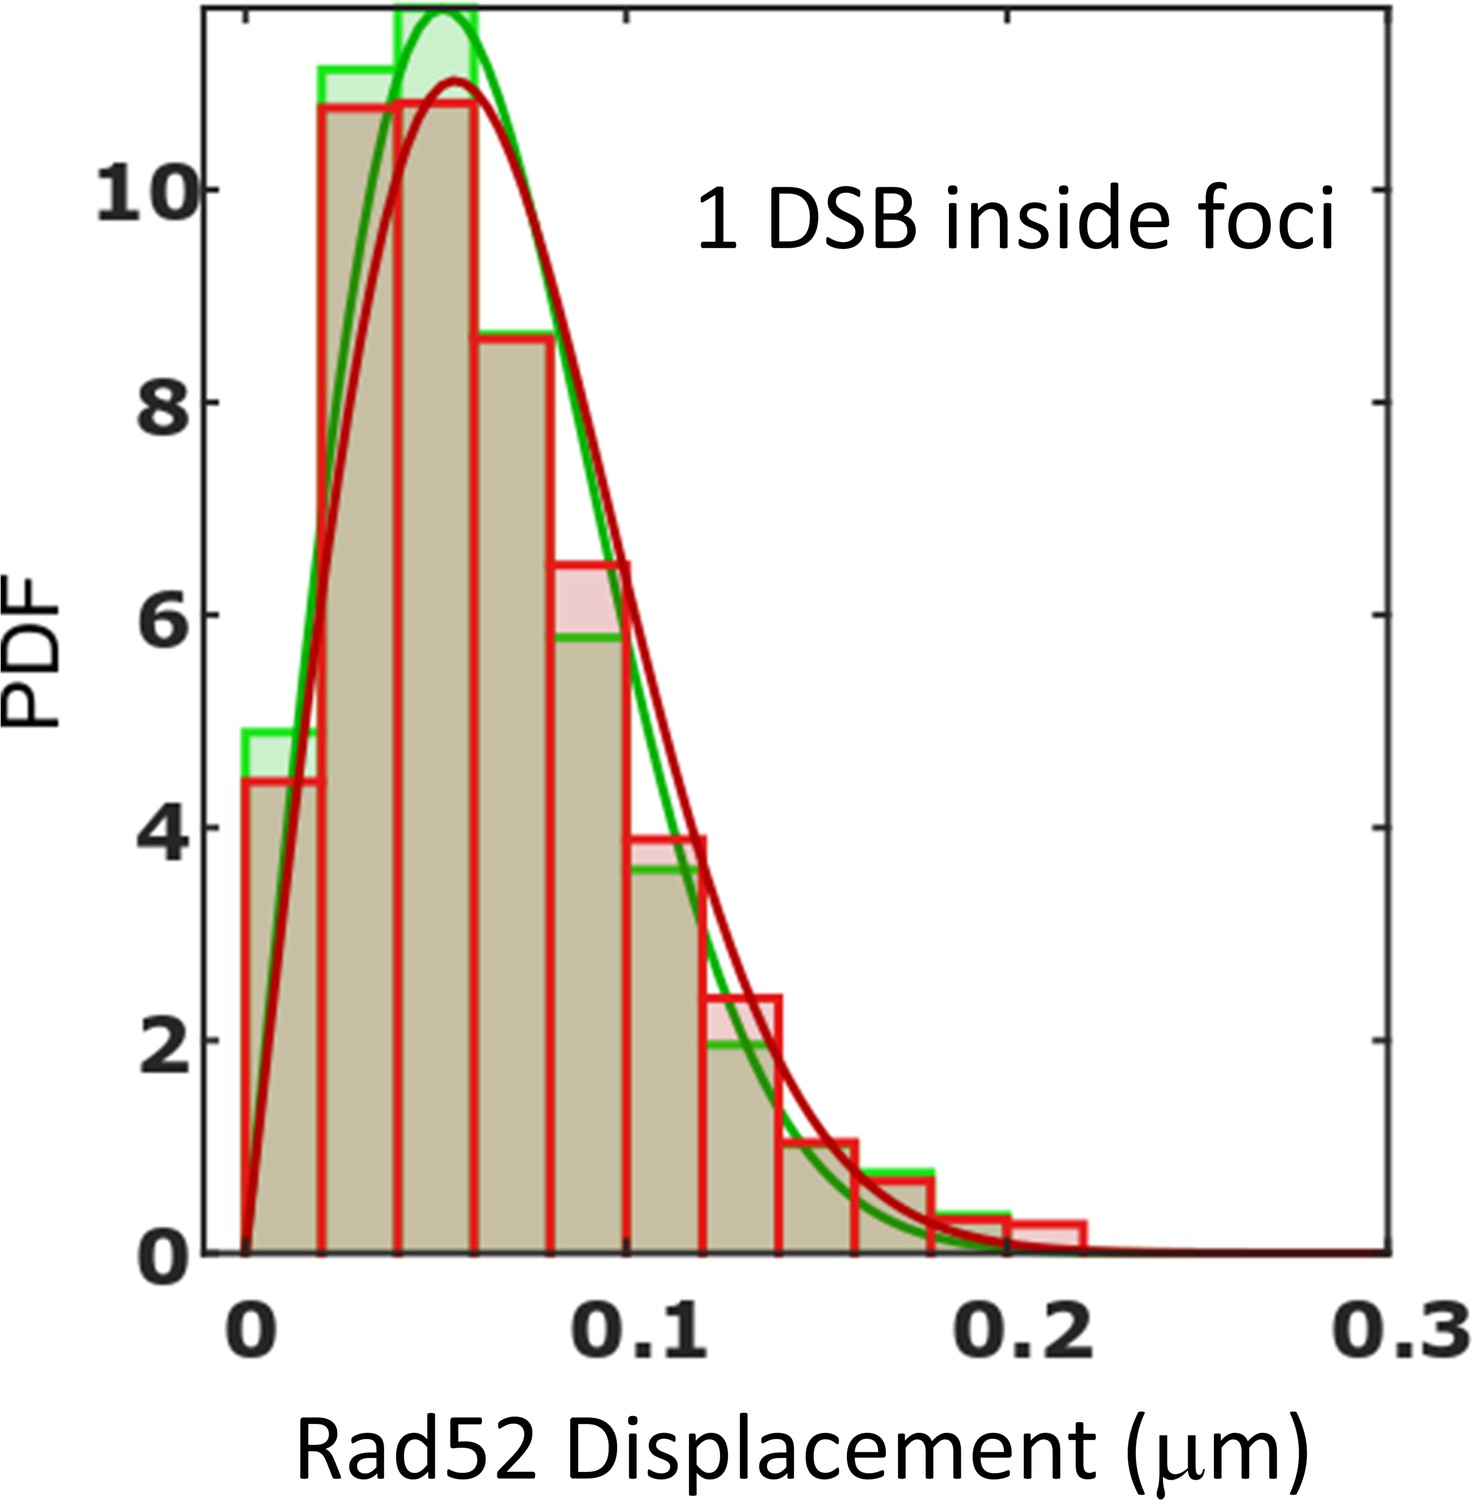
Criteria to determine traces inside repair foci.
We used two methods to select traces inside foci.The first method uses a density threshold of Rad52 detections; since foci are much denser than the rest of the nucleus, it allows us to simply separate traces inside and outside foci (as illustrated in Figure 2F). The second method consists of selecting traces longer than 70 time-points since no trace longer than 70 were found in the absence of DSB. The Probability Density Function (PDF) for traces inside foci is shown for each method. Green: selection of traces based on a density threshold; Red: selection of traces based on their length (see Materials and methods). For both method, plain lines represent a 1-population of the data (p=0.99, t2-sided KS test for both methods). In both cases, we found that data are well represented by a 1-population fit.
Figure 2—figure supplement 3
PDF of Rad52-SUMO after 2 hr of DSB induction Rad52-SUMO is tracked at 20 ms time intervals in cells following 2 hr of DSB induction.
The Probability Density Function is calculated using all the Rad52-SUMO traces inside nuclei harboring a Rad52 focus. Similar to wild type Rad52, following 2 hr of DSB induction, Rad52-SUMO exhibits three diffusive behaviors (p<10−7, p<10−7 and p=0.96, two-sided Kolmogorov-Smirnoff (KS) test for the 1-, 2- and 3-populations fits respectively, see Materials and methods). For the 3-populations fit, we obtained the best fitted values of D1 = 0.036 ± 0.009, D2 = 0.18 ± 0.03 and finally D3 = 1.07 ± 0.08 μm2/s. We recovered similar diffusion coefficient in cells expressing the Rad52-SUMO than in the wild type cells (see Supplementary file 1 also).
Figure 2—figure supplement 4
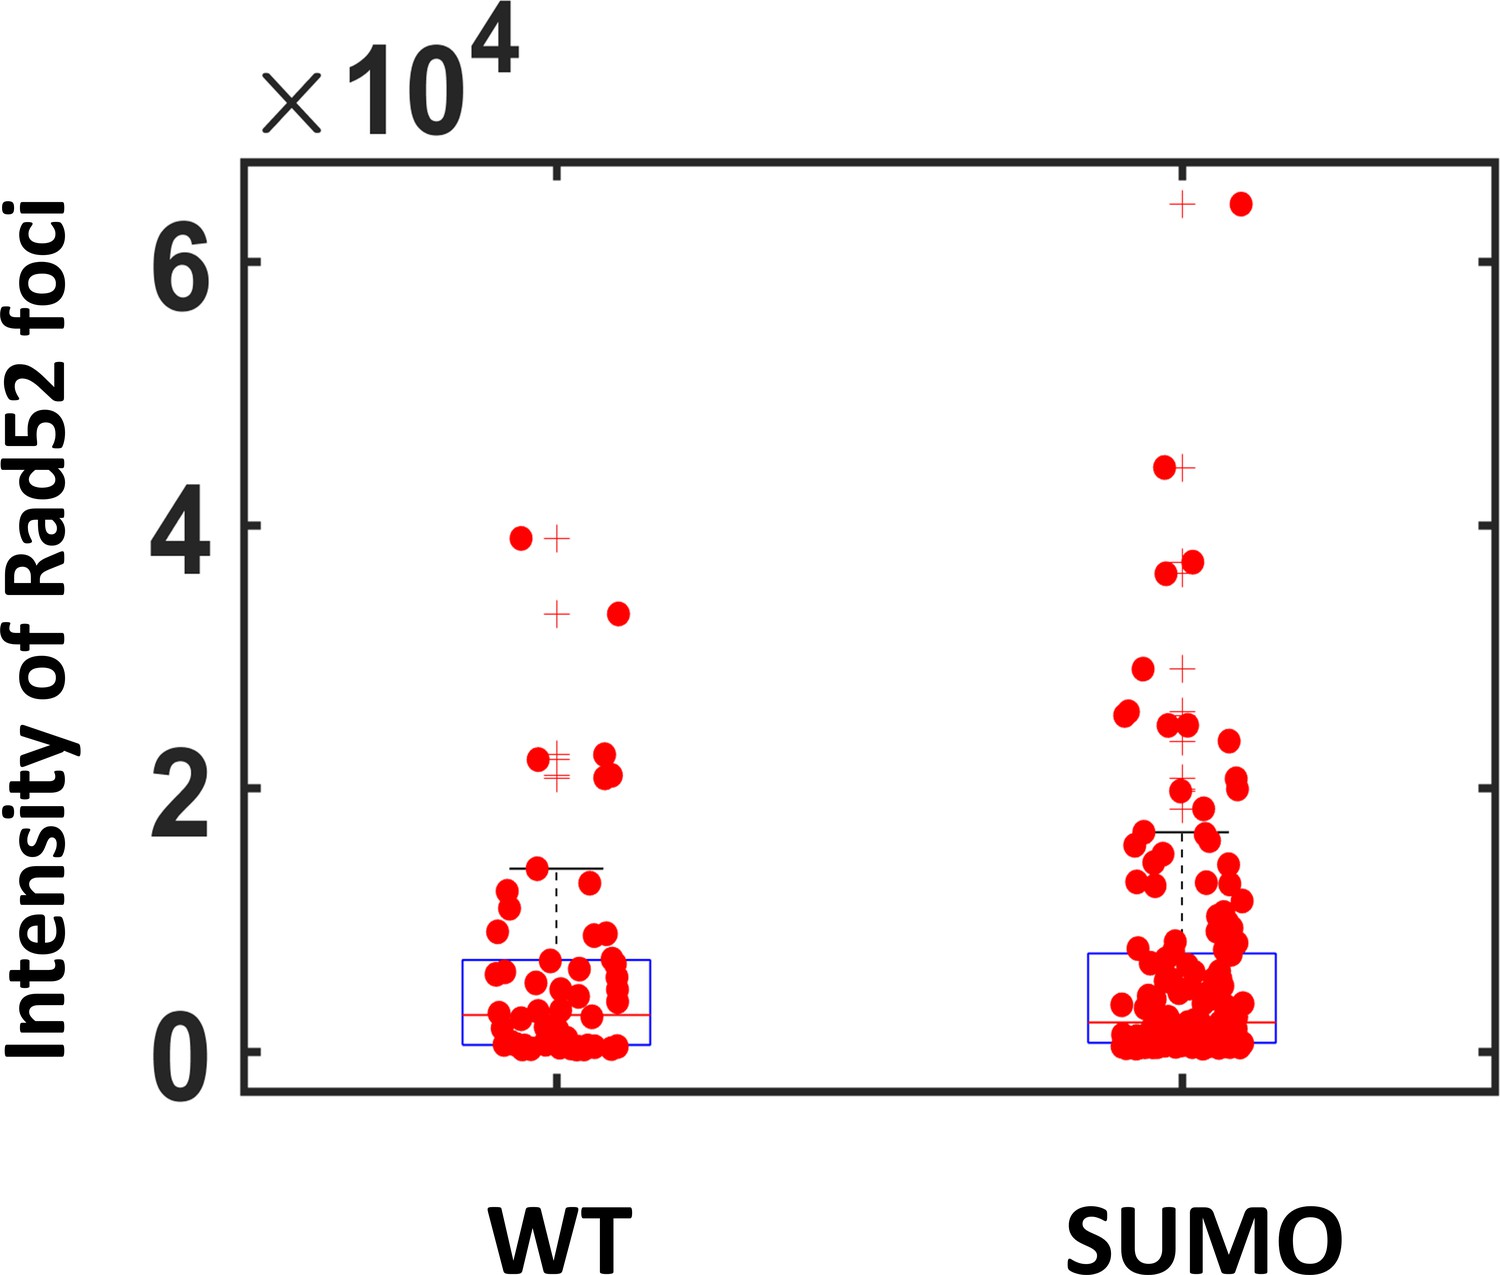
Intensity of Rad52 versus Rad52-Sumo foci To compare the intensity of Rad52 and SUMOylated Rad52 foci, we observed cells expressing Rad52-Halo of Rad52-SUMO-Halo using wide field microscopy.
A single I-SceI DSB was induced for 2 hr; during the last hour of induction, cells were incubated with JF646 dyes at 50 nM, a concentration 10 times higher than the one used for single molecule tracking. Such concentration allows the observation of the entire Rad52 focus as a single spot. Foci intensity is quantified using a home-made software Q-Foci (Guidi et al., 2015). We found that the intensity of wild type and SUMOylated Rad52 foci is not significantly different (p=0.6, Wilcoxon-Mann-Whitney test).
Figure 2—figure supplement 5
Mobility of individual Rad52 molecules in haploid versus diploid yeast To investigate Rad52 mobility in a situation where the DSB can be repaired, we compared the mobility of individual Rad52 molecules in haploid versus diploid cells.
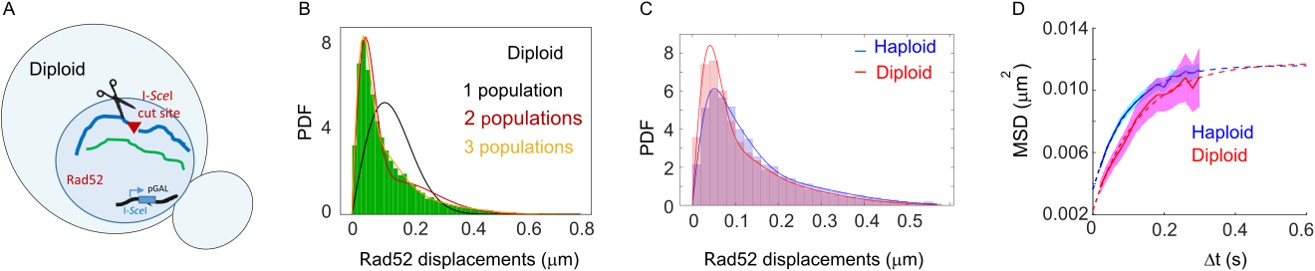
(A) Design of the experiment in diploid cells: we induced a single DSB in diploid cells harboring Rad52 endogenously fused to Halo (both Rad52 alleles are fused to Halo) as well as an I-SceI cut site at one of the 2 LYS2 locus inducible under galactose promoter. The DSB is induced for 2 hr and fluorogenic JF646 dyes are added to the medium during the last hour of incubation prior visualization by SPT. Individual Rad52-Halo/JF646 are tracked at 20 ms time intervals (50 Hz), during 1000 frames. Only S/G2 cells harboring a Rad52 focus are analyzed. (B) Probability Density Function (PDF) of Rad52-Halo/JF646 molecules in diploid S/G2-phase cells in the presence of a single DSB. The time interval is 20 ms. Green: Rad52 data (15 cells, 1082 trajectories); Black: 1-population fit; Red: 2-population fit; Yellow: 3-population fit. (C) Probability Density Function in the nucleus of haploid versus diploid cells harboring a Rad52 focus after 2 hr of DSB induction. Blue: haploid cells; Red: diploid cells. The lines indicate a 3-populations fit of the experimental data (p=0.67 in haploids and p=0.34 in diploids, 2-sided KS test). Rad52 mobility in diploid cells is slightly lower than in haploid (p=0.96, t2-sided KS test, panel C). Difference of mobility between haploid and diploid cells has been also observed in the case of chromatin tracking at URA3 (Miné-Hattab et al., 2017), or could be due the fact that diploid and haploid cells are not at the same stage of HR. (D) Mean Square Displacement (MSD) curve of Rad52/Halo/JF646 molecules inside foci cells after 2 hr of DSB induction. Blue: haploid cells; Red: diploid cells. The dotted line shows a fit of the MSD with a confined model (see Materials and methods).
Figure 3 with 1 supplement

Individual Rad52 molecules are more mobile than the whole focus.
(A) Schematic of the experiment: to shade in light the internal dynamics of Rad52, we compare the mobility of the entire Rad52 foci, shown in light red, with the mobility of individual Rad52 molecules located inside foci, in red. The mobility of the entire Rad52 focus is measured using a strain harboring Rad52-mMaple and a single I-SceI DSB at LYS2 (see Materials and methods). We used high photo-activation illumination to simultaneously activate all Rad52-mMaple and image the entire foci as a single large spot. Rad52 foci were tracked at 20 ms time-intervals in two dimensions. (B) Typical image of a haploid cell harboring a Rad52-mMaple focus after a 2h-induction of a single DSB. Left: transmission image; Middle: typical frame of a movie in which we see the whole focus; Right trajectory of the whole focus after analysis. The bar scale represents 1 μm. (C) Displacements histogram of the entire Rad52 foci (grey), compared with individual Rad52-Halo located inside foci (red, same data shown in Figure 2F in red). Both displacements are measured after 2 hr of galactose induction at 20 ms time intervals in 2-dimensions. F14S/G2 cells harboring a Rad52 focus are analyzed, representing 131 traces (mean length 24 frames), and 3015 translocations of 20 ms time-intervals. (D) PDF of the entire Rad52 foci calculated for 20, 40 and 60 ms time intervals. Plain lines represent a 1-population fit of the PDF. (E) MSD of the entire Rad52 foci (green) versus individual Rad52 molecules located inside foci (red, same data as Figure 2G). The MSD of individual Rad52 molecules inside foci is fitted with a confined model (dotted line) while the MSD of the entire Rad52 focus is fitted using an anomalous model (see Methods).
Figure 3—figure supplement 1

Nature of motion: whole Rad52 focus versus individual Rfa1 and Rad52 molecules inside foci (A): Blue: MSD of the whole Rad52 focus in S/G2 cells (14 cells); Red: fit with a model of anomalous diffusion (see Materials and methods).
(B): Blue: MSD of individual Rfa1-Halo/JF646 molecules inside foci in S/G2 cells (29 cells); Red: fit with a model of anomalous diffusion (see Materials and methods). (C) Blue: MSD of individual Rad52-Halo/JF646 molecules inside foci in S/G2 cells (23 cells); Red: fit with a model of confined diffusion (see Materials and methods). (D), (E) and (F): same data as (A), (B) and (C) represented in log-log scale. The fits of the MSD are performed on the first 700 ms of the curves. Rad52 foci and individual Rfa1 exhibit anomalous motion (panels A and B), whereas individual Rad52 molecules inside foci follow confined motion (panel C). MSD curves are shown in linear scale (Figure A, B and C) and in log-log scale (Figure D, E and F). The anomalous exponents are 0.51 ± 0.05 and 0.56 ± 0.05 for the whole focus and Rfa1 molecules respectively, as predicted by the Rouse model and consistent with chromatin motion previously measured in the literature (Hajjoul et al., 2013; Miné-Hattab et al., 2017, p.). The goodness of fits are provide in Supplementary file 1.
Figure 4 with 1 supplement
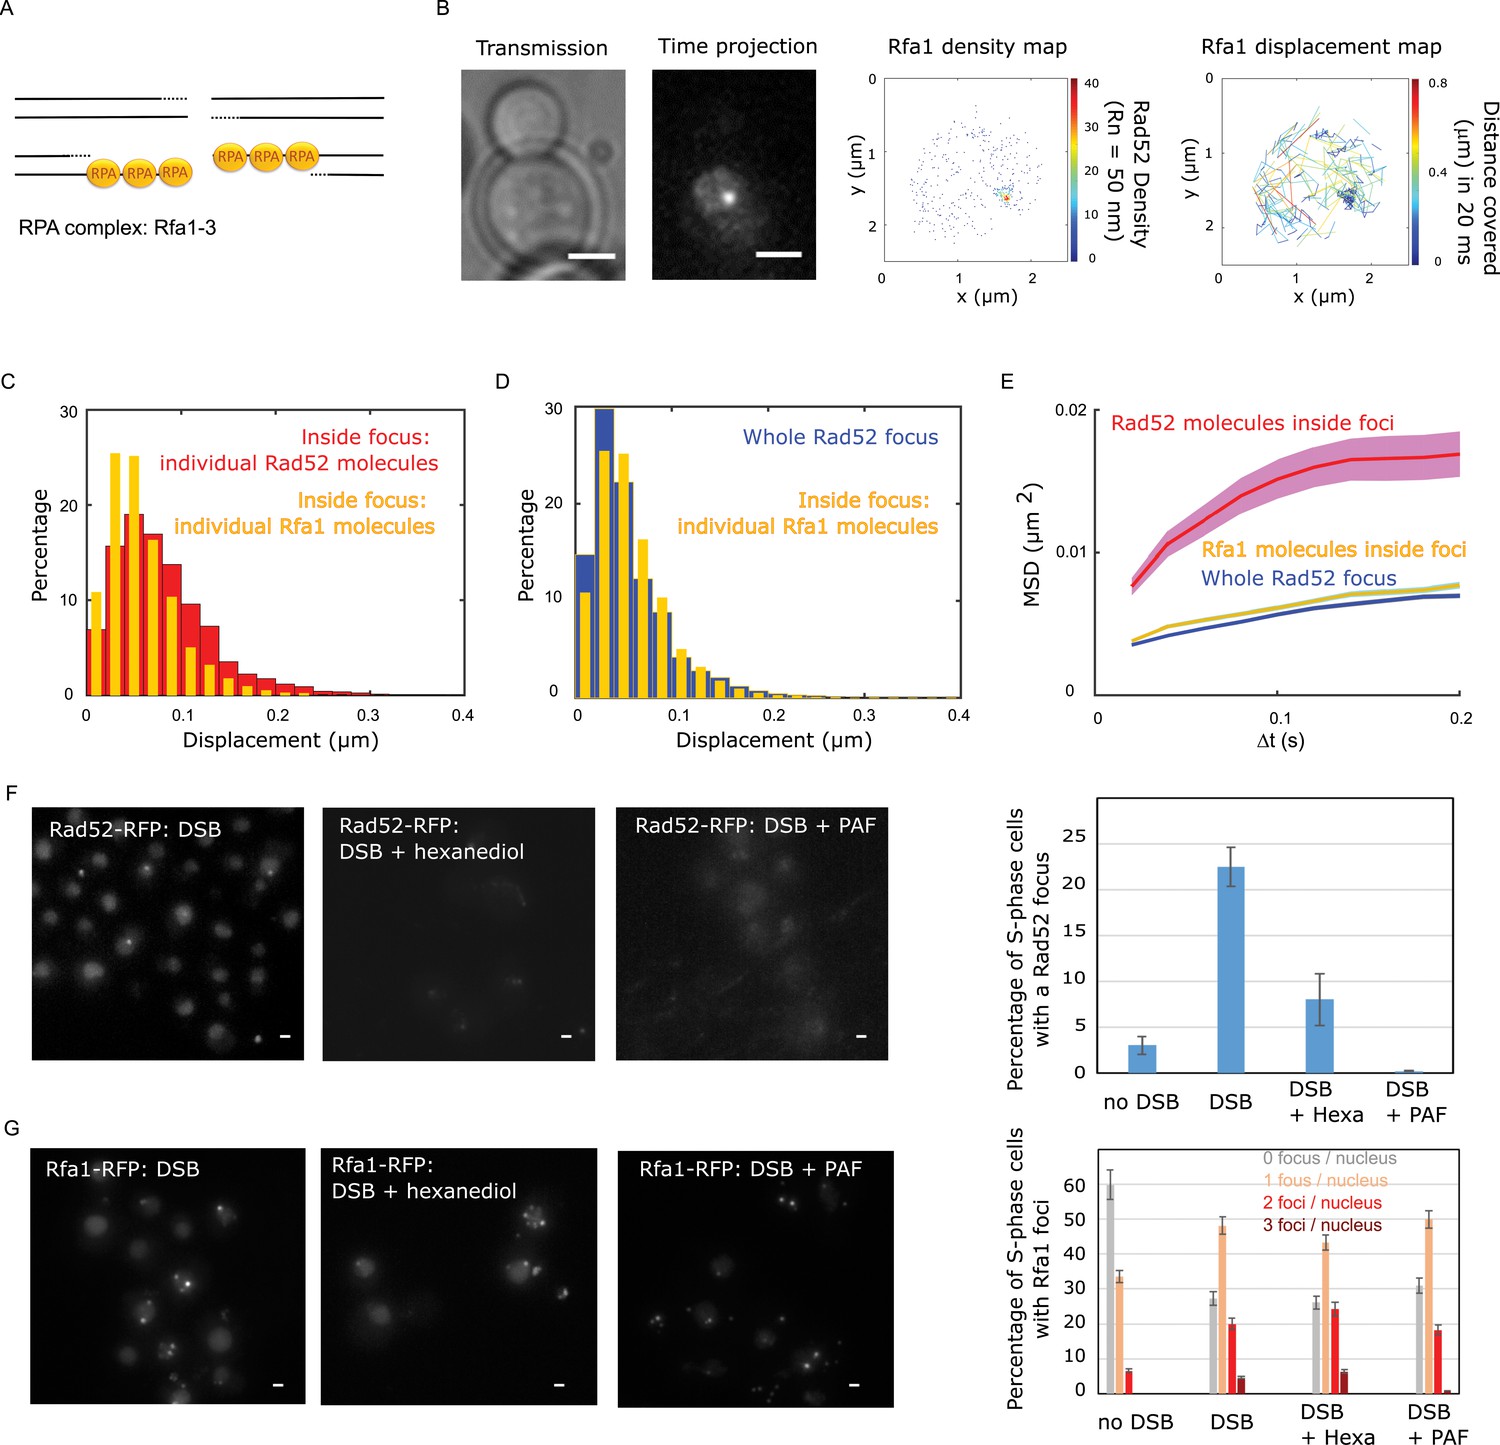
Rad52 and Rfa1 behavior strongly differs inside foci (A) Simplified view of a DSB repaired by HR where RPA is shown.
(B) Typical S/G2-phase haploid cells harboring Rfa1-Halo/JF646 after 2 hr if galactose induction. From left to right: transmission image; Time-projection of the whole movie; Rfa1 density map: each spot represents a single detection of Rfa1-Halo/JF646, the color map indicates the number of Rfa1 neighbors inside a 50 nm radius disk; Rfa1 displacement map: each line represents the trajectory of a detection, the color map indicates the distance in mm covered in 20 ms. The bar scale represents 1 μm. (C) Displacement histograms of individual Rfa1 molecules (yellow) and individual Rad52 molecules (red) inside foci. The time interval is 20 ms. 29 S/G2 cells were analyzed, representing 621 traces (mean length of 12.4 frames) and 7095 displacement of 20 ms time intervals. (D) Displacement histograms of individual Rfa1 molecules inside foci (yellow) and whole Rad52 foci (grey). The time interval is 20 ms. (E) MSD of individual Rfa1 molecules inside foci (yellow), individual Rad52 molecules inside foci (red, same data as Figure 3E) and the whole Rad52 focus (green, same data as Figure 3E). MSDs of Rfa1 molecules and the whole Rad52 focus are fitted with an anomalous model while the MSD of individual Rad52 is fitted with a confined model. (F) Typical haploid cells expressing Rad52-RFP and an I-SceI inducible DSB at LYS2, observed by wide field microscopy. First panel: a DSB is induced for 2 hr; second panel: a DSB is induced for 2 hr including 30 min with 10% hexanediol and 10 μg/ml of digitonin; third panel: a DSB is induced for 2 hr and cells are fixed with fixation with 4% paraformaldehyde or 10 min; fourth panel: quantification of the images presenting the percentage of S/G2 phase cells with a Rad52 focus. 200 cells are analyzed in each condition. The bar scale represents 1 μm. (G) Typical haploid cells expressing Rfa1-RFP and an I-SceI inducible DSB at LYS2, observed by wide field microscopy. Cells are images in the same conditions as in figure (F). Since Rfa1 form several foci per nucleus, the quantification shows the number of foci per nucleus (0bar 3 foci). The bar scale represents 1 μm.
Figure 4—figure supplement 1

Dissolution of P-bodies with 10% hexanediol teatment.
The efficiency of 1.6- hexanediol treatment was tested using a strain expressing Edc3-GFP as a control. GFP-labelled Edc3 cells were grown in four conditions: (i) glucose containing media (no stress), (ii) after 1 hr in glucose-depleted media (stress), (iii) after 1 hr in glucose-depleted media and the addition of 10% hexanediol and 10 μg/ml of digitonin for 30 min (stress + Hexa), and (iv) after 1 hr in glucose-depleted media and 10 min fixation with 4% paraformaldehyde (Stress + PAF). The bar scale represents 1 μm. The right panel shows the quantification of the images: the number of Edc3 foci per cell is shown for each condition. 200 cells were imaged in each condition on an inverted wide field microscope (left panel) and the number of foci per cells was quantified (right panel). P-values (Wilcoxon-Mann-Whitney test) are given below: p No stress / Stress = 4 10−15 ; p Stress / Stress + Hexa = 6 10−19 ; p No stress + Hexa / Stress + Hexa = 0.5 p No stress / Stress + PAF = 0.01; p Stress / Stress + PAF = 2 10−8.
Figure 5 with 1 supplement
Rad52 diffusion coefficient changes when molecules enter and escape repair foci.
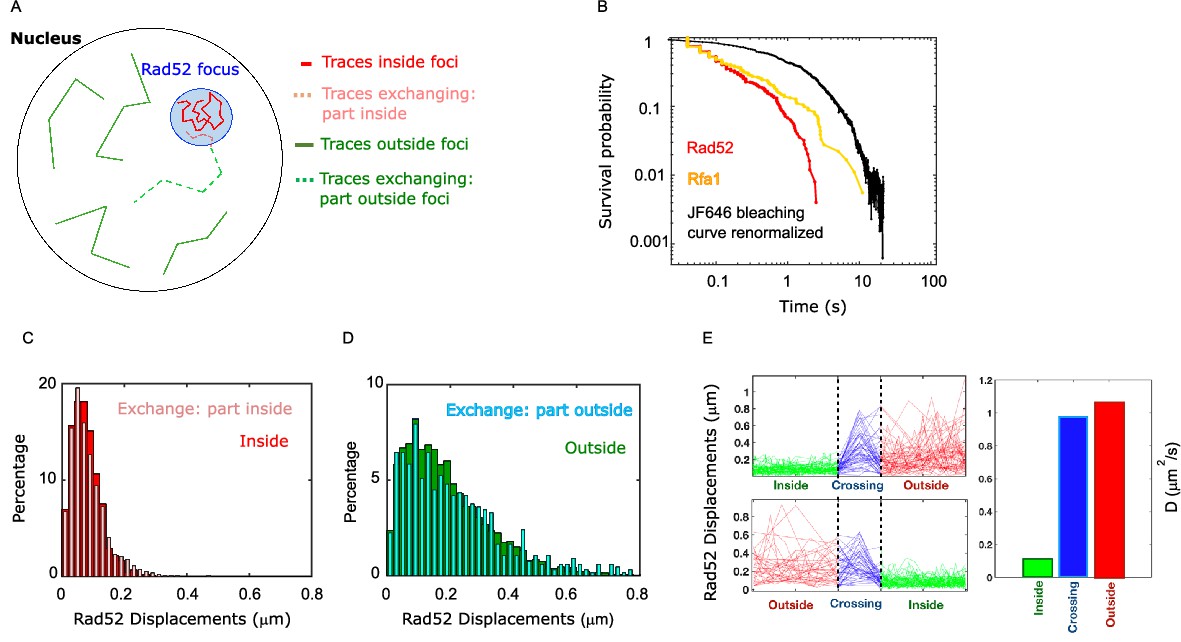
(A) Illustration of the three categories of Rad52 traces observed in response to a single DSB in the nucleus: (i) traces staying inside repair foci (plain red), (ii) traces crossing foci boundaries (dotted lines), with red-dotted lines for the part inside foci and blue-dotted lines for the part outside; (iii) traces staying outside of the foci (plain blue). (B) Survival probability curve of Rad52 molecules inside foci (red), Rfa1 (yellow) and renormalized bleaching curve of the JF646 (black) (see Figure 1—figure supplement 3). (C) Light red: displacement histogram of traces represented as dotted red lines in Figure 4A (travelers, part inside foci). Dark red: displacement histogram of traces represented in plain red in Figure 4A (traces inside foci). (D) Light blue: displacement histogram of traces represented as dotted blue lines in Figure 4A (travelers, part outside foci). Dark blue: displacement histogram of traces represented in plain blue in Figure 4A (traces outside foci). (E) Left: Step size for traces inside the focus (green), crossing (blue), and outside the focus (red). The x-axis is squeezed so that all traces take the same space, in order to visually compare the step sizes. Above: traces starting inside and ending outside. Below: traces starting outside and ending inside the focus. Right: Bar plot showing the estimated diffusion coefficient calculated from all the traces.
Figure 5—figure supplement 1
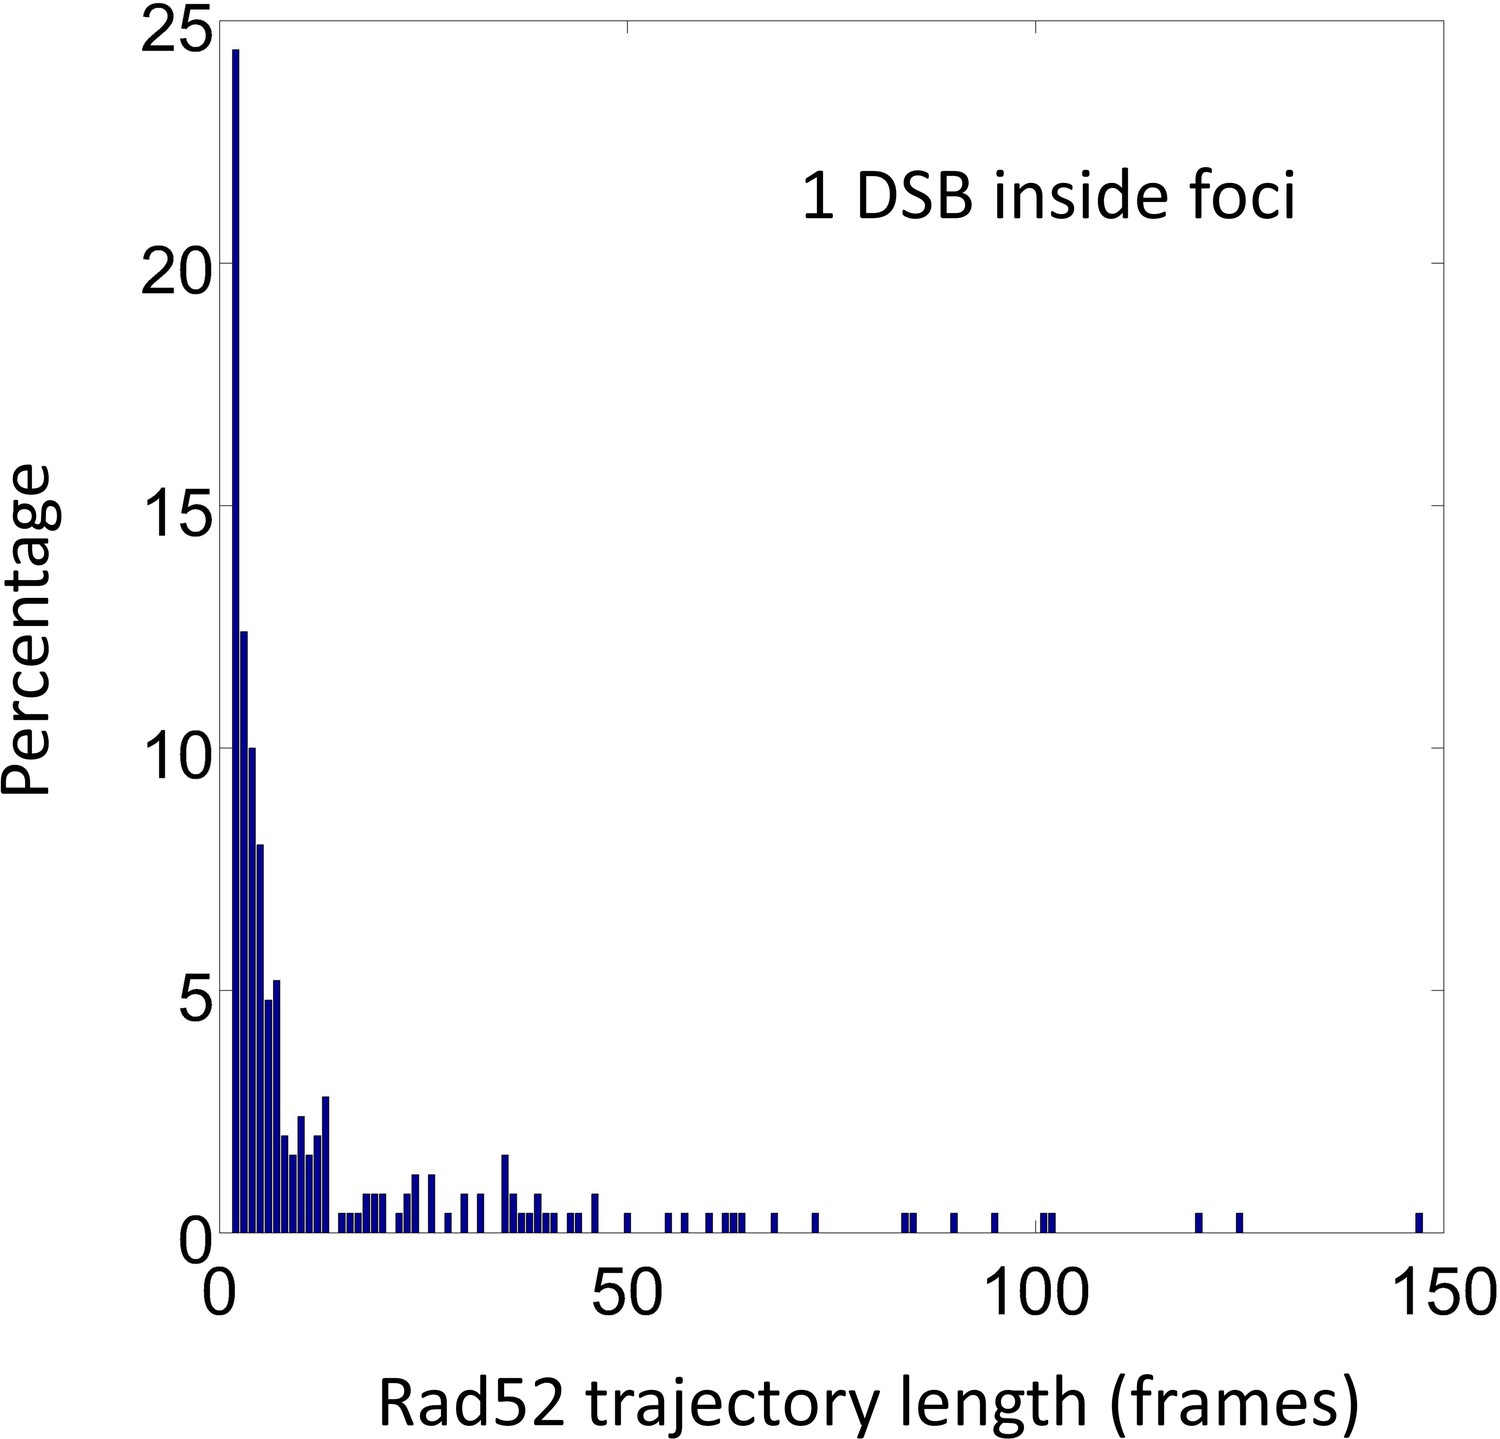
Trace length distribution of Rad52 molecules inside foci in the presence of o1 DSB.
A single I-SceI DSB was induced in exponentially growing cells expressing Rad52-Halo. After 2 hr of DSB induction including 1 hr of incubation with JF647 at 5 nM, we selected S/G2 cells harboring a Rad52 focus and measured Rad52-Halo/JF646 displacements at 20 ms times intervals. The histogram below presents only Rad52 traces inside foci.
Figure 6

Rad52 foci in the presence of multiple DSBs.
(A) Design of the experiment. We induced 2 I-SceI DSBs (at LYS2 and HIS3) in haploid cells harboring Rad52-Halo (see Methods). The DSB is induced for 2 hr and fluorogenic JF646 dyes are added to the medium during the last hour of incubation prior visualization by SPT. Individual Rad52-Halo/JF646 are tracked at 20 ms time intervals (50 Hz), during 1000 frames. Only cells harboring a Rad52 focus are analyzed. (B) Displacement histogram whole Rad52 foci: Blue: after the induction of a single DSB (same data as 3C); Red: after the induction of 2 DSBs. Rad52 foci were tracked at 20 ms time intervals after 2 hr of galactose induction. For the experiments following the induction of 2 DSBs, we examined 14 cells, representing 702 traces (mean length of 9.8 frames) and 6220 displacements of 20 ms time intervals. (C) Top left: Rad52 Focus size measured for 1 DSB-induced foci versus 2 DSBs-induced foci. We performed live PALM on cells harboring Rad52-mMaple strains (see Methods). Bottom left: Estimation of the number of Rad52 molecules inside 1 versus 2 DSBs-induced foci, measured by live PALM. Right: Rad52 Foci density of 1 versus 2 DSBs-induced foci. (D) Illustration of the ‘Cluster’ and the ‘Fusion’ scenarii in the case of multiple DSBs. (E) MSD of 1 versus 2 DSBs-induced foci (red and blue curves respectively). Dotted lines represented a fit of the experimental MSDs, using a model of confined diffusion. (F) Typical example of a Rad52 trajectory represented in blue. The whole focus is shown in the background using a Gaussian blur of each Rad52 detections contained in this focus. Left: 1 DSB-induced focus; right: 2 DSBs-induced focus.
Figure 7
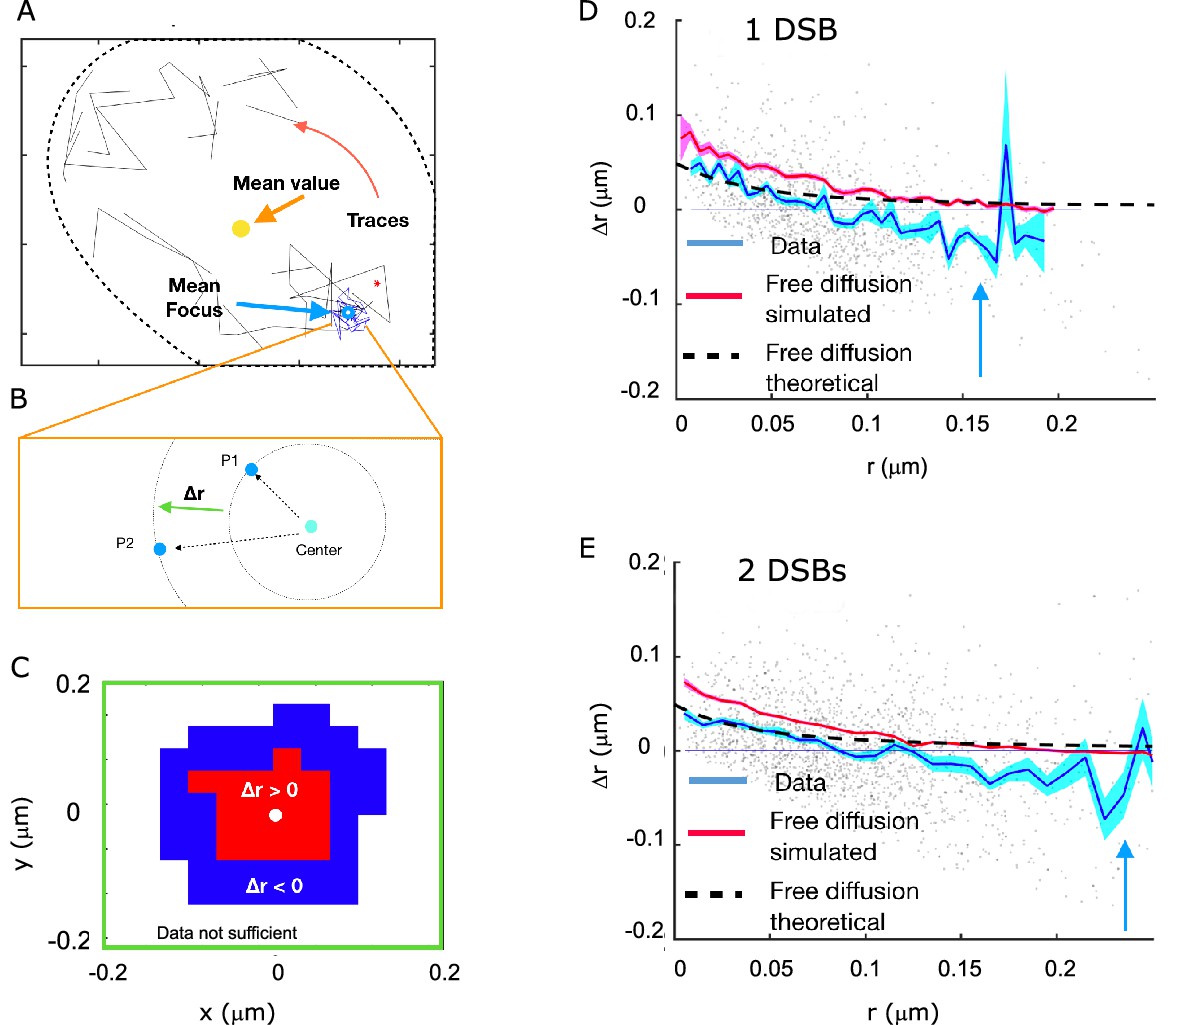
Rad52 shows attractive motion around the focus.
(A) Representative cell, with traces outside the focus (black) and inside the focus (blue). Cell nucleus is estimated from the traces. (B) Schematic showing the definition of the radial displacement Δr, defined by two subsequent data-points. (C) Sign of the average radial displacement as a function of particle position relative to the focus, averaged over all cells. (D) Radial displacement Δr versus r (distance to the center of the focus prior to displacement) over all cells with 1 DSB. Cyan line indicates the mean value. Black line corresponds to the expected movement for free diffusion with diffusion coefficient equal the one inside the focus (assuming the center of focus is exactly known). Red line corresponds to a free diffusion, simulated with same trace length and the same diffusion coefficient as the data traces and the same method for estimating the center of the focus. (E) Same as (D) but for cells with 2 DSBs.
Appendix 1—figure 1
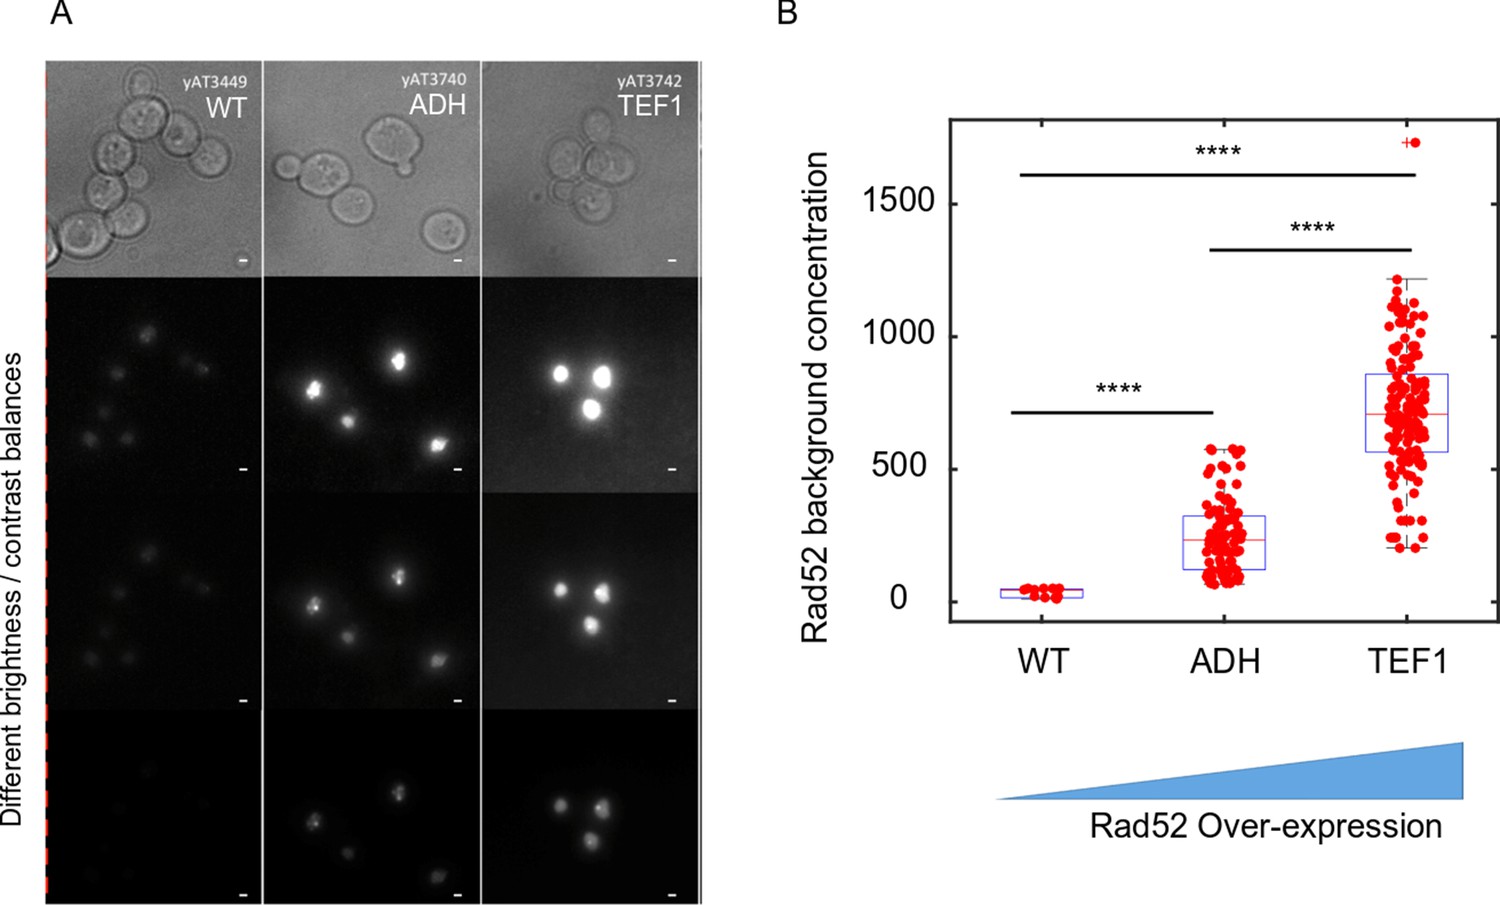
Consequences of increasing the concentration of Rad52 molecules in the cell.
(A) Typical images of Rad52 after the induction a single DSB in wild type cells, and for two levels of Rad52 over-expression. The bar scale represents 1 μm. (B) Effect of Rad52 over-expression on the nucleoplasm concentration. 11, 94 and 141 cells were analyzed for wild type, ADH and TEF1 promoters respectively.
Additional files
-
Supplementary file 1
Overview table of all the results This table provides the quantification of all the experiments performed, including statistical analysis of the results.
- https://cdn.elifesciences.org/articles/60577/elife-60577-supp1-v3.tex
-
Supplementary file 2
Yeast strains used in this study.
This table provides the genotypes of the strains built and used for this study.
- https://cdn.elifesciences.org/articles/60577/elife-60577-supp2-v3.xlsx
-
Supplementary file 3
List of primers used in this study.
- https://cdn.elifesciences.org/articles/60577/elife-60577-supp3-v3.xlsx
-
Transparent reporting form
- https://cdn.elifesciences.org/articles/60577/elife-60577-transrepform-v3.pdf
Download links
A two-part list of links to download the article, or parts of the article, in various formats.
Downloads (link to download the article as PDF)
Open citations (links to open the citations from this article in various online reference manager services)
Cite this article (links to download the citations from this article in formats compatible with various reference manager tools)
Single molecule microscopy reveals key physical features of repair foci in living cells
eLife 10:e60577.
https://doi.org/10.7554/eLife.60577


