Structural basis of TRPC4 regulation by calmodulin and pharmacological agents
- Department of Structural Biochemistry, Max Planck Institute of Molecular Physiology, Germany
- Department of Neurophysiology, Physiological Institute, Julius-Maximilians-Universität Würzburg, Germany
- Goldfinch Bio, United States
Figures
Figure 1
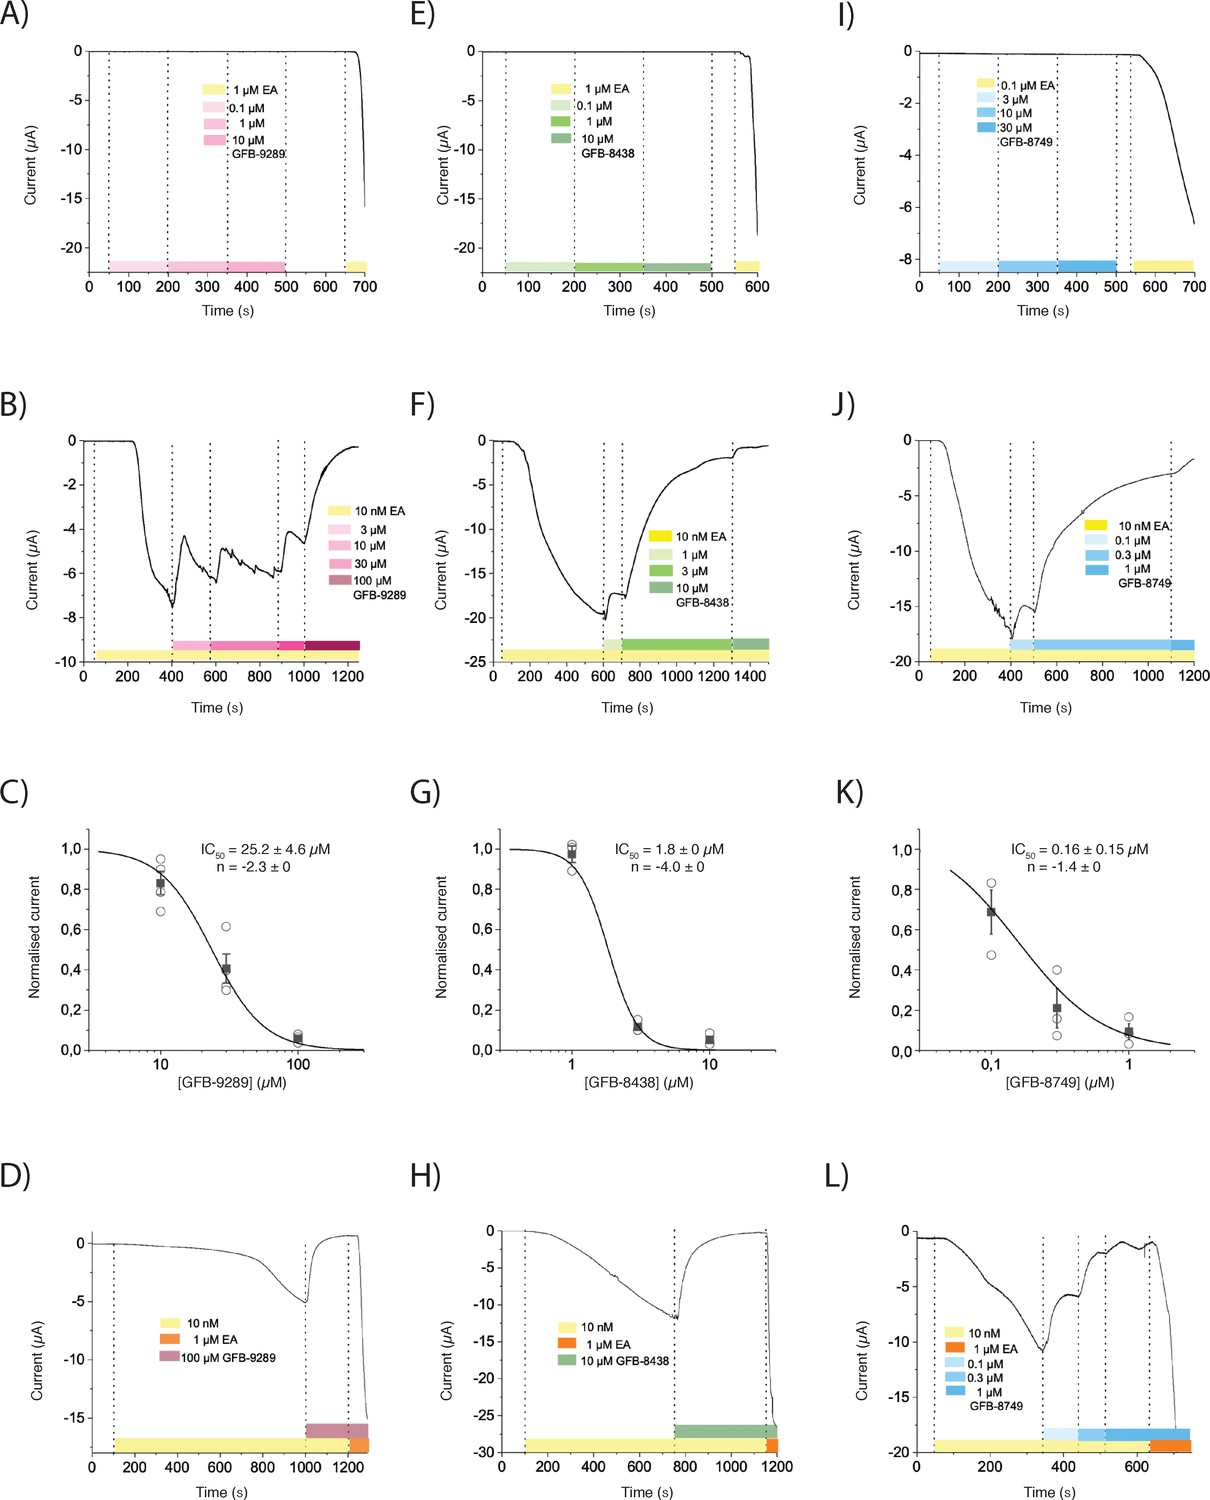
The effect of three pyridazinone-based small molecules on TRPC4 and on (-)-Englerin A (EA)-induced opening of TRPC4.
(A, E and I) TRPC4-expressing Xenopus oocytes were held at −40 mV and perfused with increasing concentrations of GFB-9289 (A), GFB-8438 (E) or GFB-8749 (I) to test the potential activation effect. 0.1 or 1 µM (-)-Englerin A (EA) were given at the end of recording to confirm the functional expression of TRPC4. (B, F and J) After activation of TRPC4 with 10 nM (-)-Englerin A, various concentrations of GFB-9289 (B), GFB-8438 (F) or GFB-8749 (J) were given together with 10 nM (-)-Englerin A to test the inhibitory effect. (C, G and K) Hill equation: y = 1/(1+ (IC50/x) ^ n) was used to fit the dose-inhibition curve, where IC50 is the 50% inhibitory concentration, x is the concentration of the ligand and n is the Hill coefficient. (D, H, and L) Sufficient GFB-9289 (D), GFB-8438 (H) or GFB-8749 (L) were used to fully inhibit 10 nM Englerin A-induced inward current, which can be reactivated by 1 µM Englerin A. Symbols with error bars represent mean ± SEM (n ≥ 3). The colored bars between the dashed lines indicate the concentration of compounds which was kept constant over time.
Figure 2 with 5 supplements

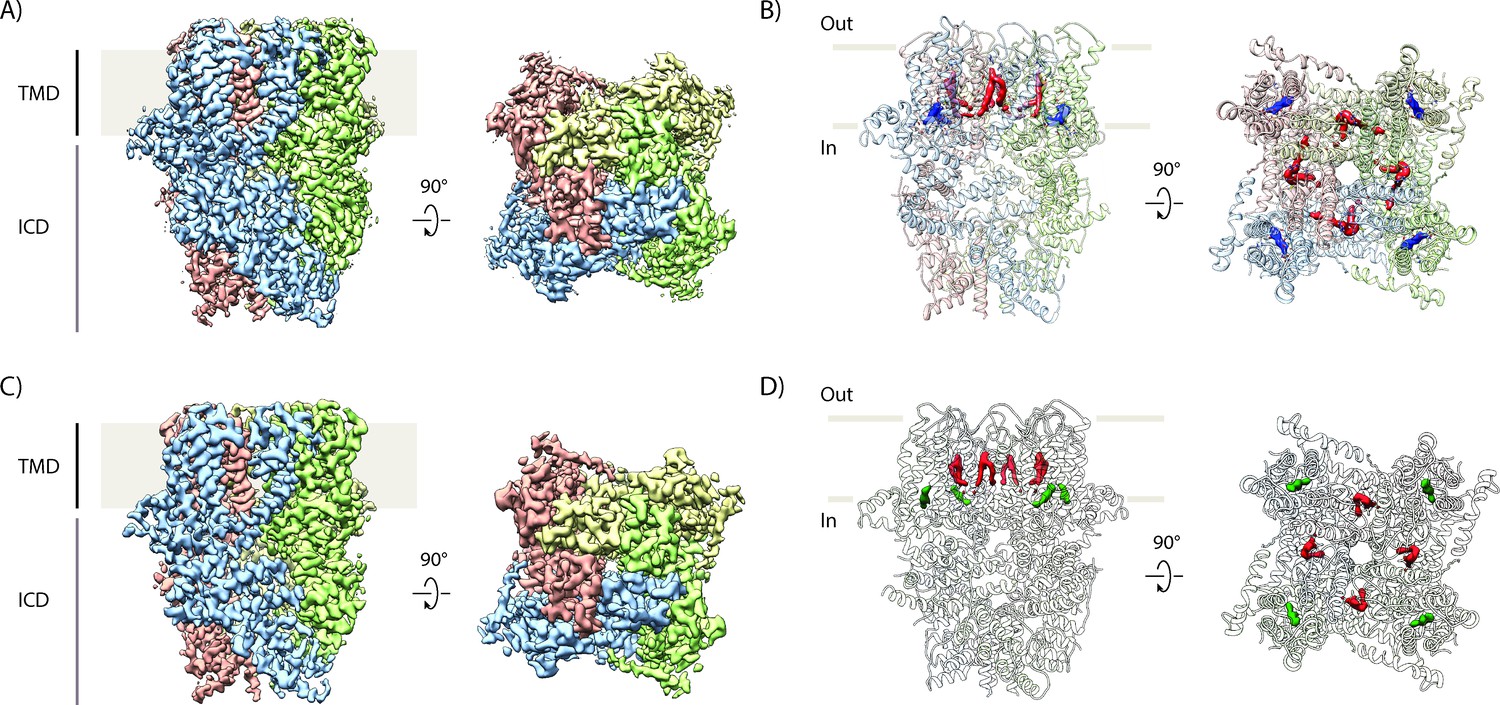
Cryo-EM structure of inhibitor-bound TRPC4 channel.
(A) Side and top view of the cryo-EM map of GFB-8438 inhibitor-bound TRPC4, with each subunit colored differently. Positions of the transmembrane domain (TMD) and intracellular cytosolic domain (ICD) are indicated. (B) Side and top view of the structure of GFB-8438 inhibitor-bound TRPC4, with each subunit colored differently. (C) Location of non-protein densities relative to the atomic model of TRPC4, which is shown in transparent ribbon representation in the side- and top view. Densities corresponding to lipids are depicted in red, GFB-8438 density is shown in purple. (D) Close-up of the ligand-binding pocket, showing the density corresponding to the inhibitor GFB-8438(transparent) with the ligand structure modelled inside. GFB-8438 is enclosed by the four helices S1 to S4, constituting the VSL domain. A rotated view of the ligand-binding pocket is shown in the left panel with important and interacting residues highlighted. GFB-8438 is shown in purple. In the right panel the chemical structure of the TRPC4 inhibitor GFB-8438 is shown, with important and interacting residues of TRPC4 highlighted. Non-carbon atoms are colored according to element, with halogens in green, nitrogen in blue and oxygen in red. (E) and (F) Same in (D) but for inhibitor GFB-9289 and GFB-8749 bound structures of TRPC4 respectively.
Figure 2—figure supplement 1
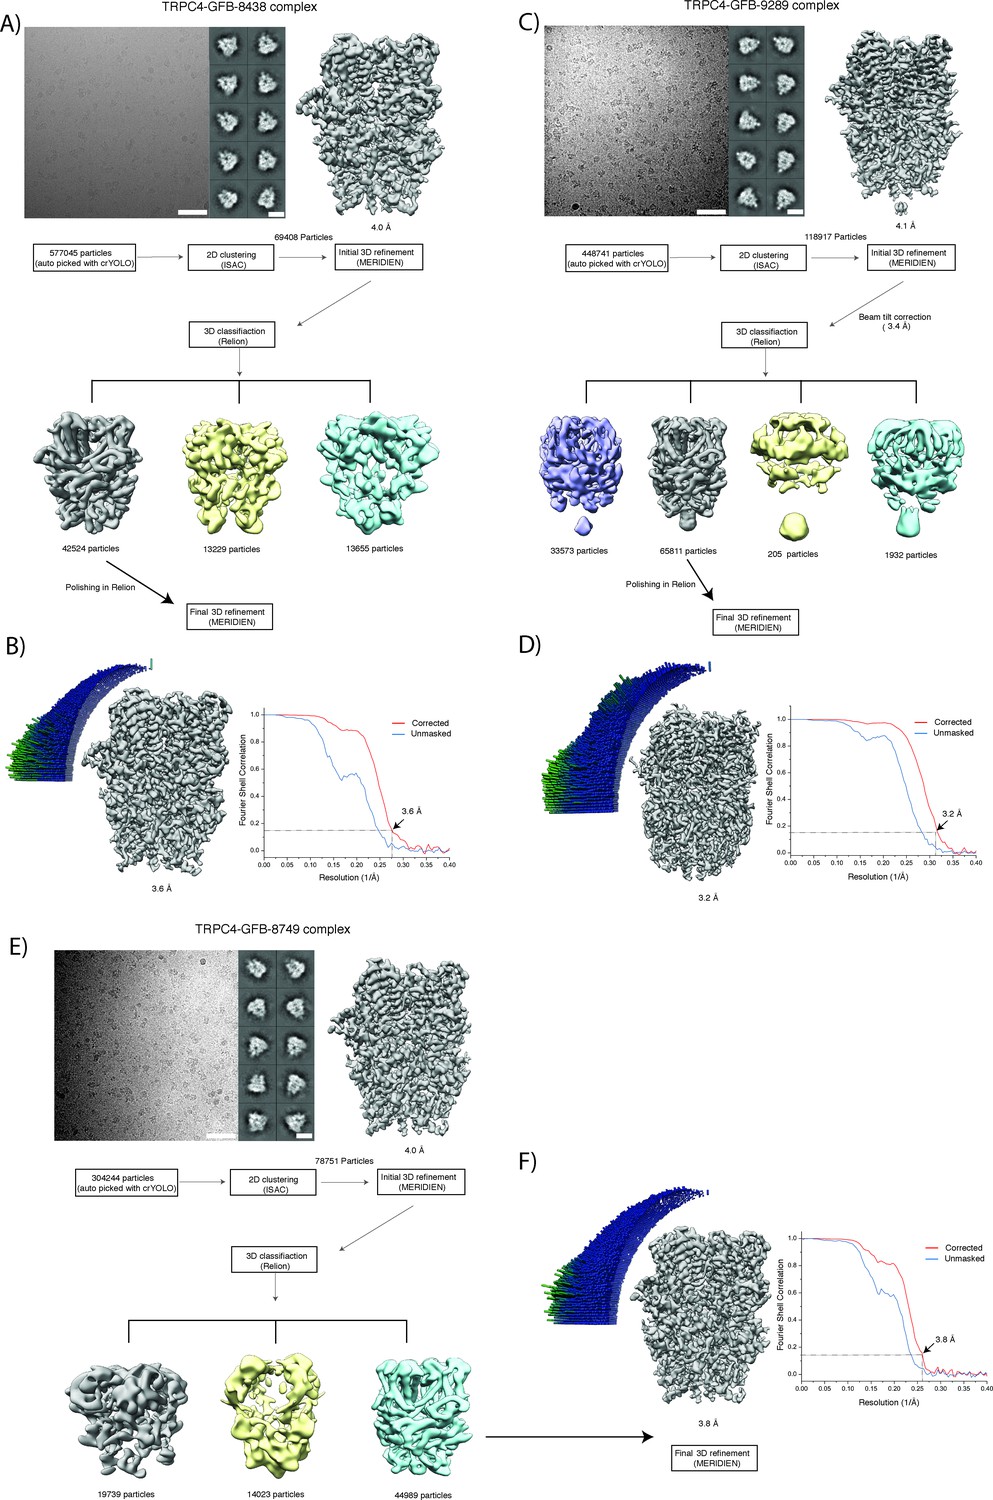
Cryo-EM image processing workflow for TRPC4 in complex with the inhibitor.
(A) The top panel shows a representative digital micrograph area and selected 2-D class averages of inhibitor GFB-8438 bound TRPC4. Scale bars, 50 nm and 10 nm, respectively. The initial refinement density and subsequent densities obtained after 3D classification are shown next to the 2-D class averages and in the bottom panel, respectively. (B) Angular distribution of particles used in the final refinement and Fourier shell correlation curves (FSC) between the two independently refined maps. The dotted lines indicate the 0.143 FSC criterion used for average resolution estimation. (C, D) Same as in (A) and (B), respectively, but for the inhibitor GFB 9289-TRPC4 complex. (E, F) Similar to (A) and (B), respectively representing inhibitor GFB-8749-TRPC4 complex.
Figure 2—figure supplement 2
Cryo-EM map of TRPC4 in complex with the inhibitor GFB-9289 and GFB-8749.
(A) Side and top view of the cryo-EM map of GFB-9289 inhibitor-bound TRPC4, with each subunit colored differently. Positions of the transmembrane domain (TMD) and intracellular cytosolic domain (ICD) are indicated. (B) Location of non-protein densities relative to the atomic model of TRPC4, which is shown in transparent ribbon representation in the side- and top view. Densities corresponding to lipids are depicted in red, GFB-9289 density is shown in blue. (C) Same as in (A), but for the cryo-EM map of GFB-8749 inhibitor-bound TRPC4. (D) Same as in (B), except the density for GFB-8749 is shown in green.
Figure 2—figure supplement 3
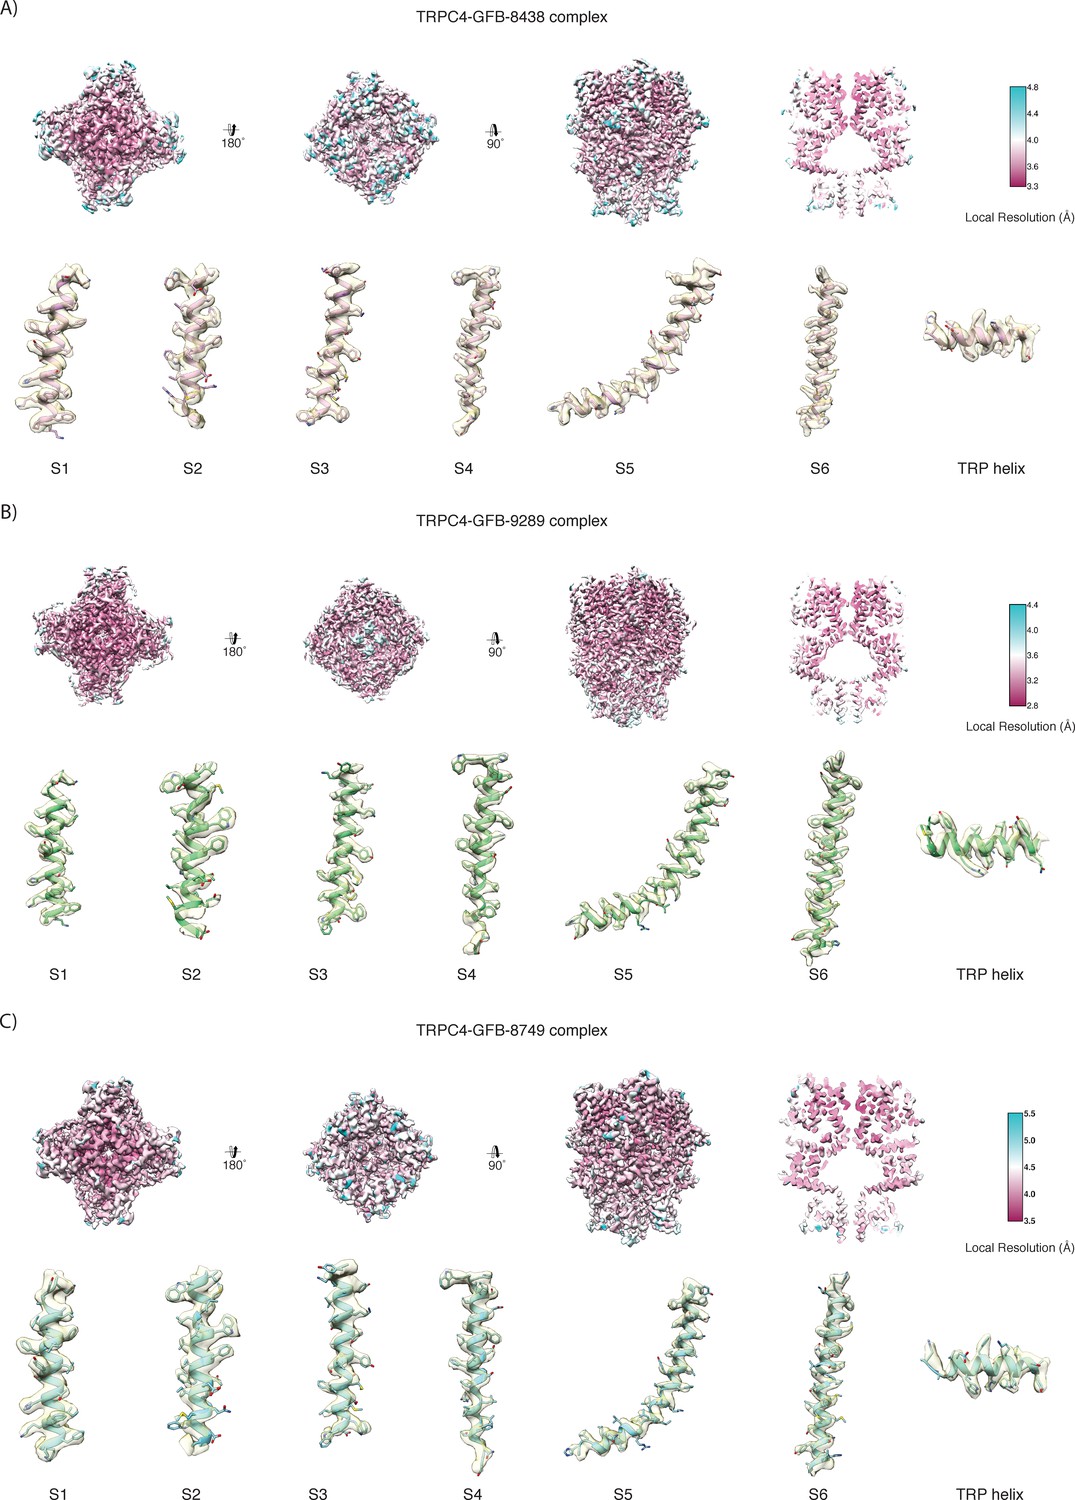
Local resolution of the TRPC4-ligand complex maps.
Maps of GFB-8438, GFB-9289 and GFB-8749-bound TRPC4, respectively, colored according to the local resolution. Representative regions of the density with the fitted atomic model are shown below the local resolution maps.
Figure 2—figure supplement 4
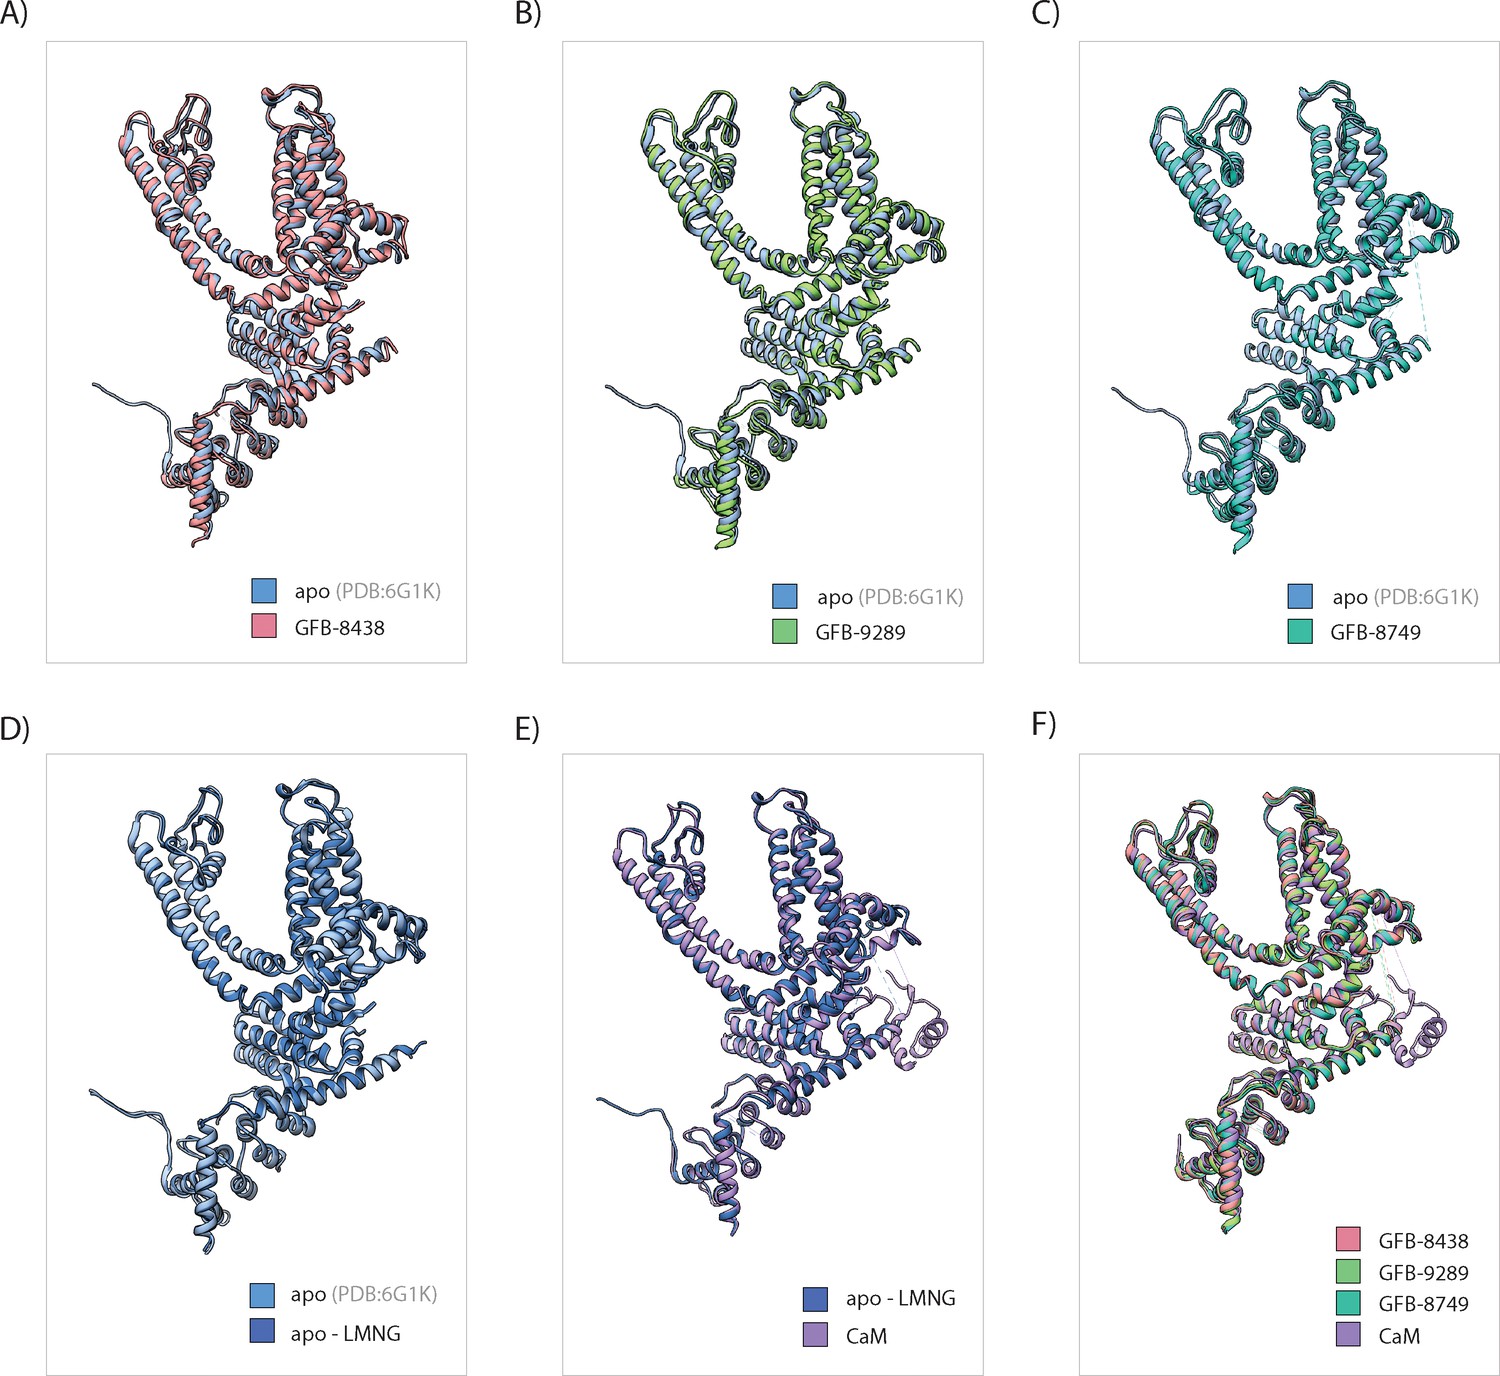
Comparison between different TRPC4 structures.
(A) Structural alignment of a protomer of the inhibitor GFB-8438 bound TRPC4 with that of TRPC4 in its apo state. The protomer of the TRPC4 apo structure is shown in cartoon representation and colored in light blue while the protomer of the inhibitor bound TRPC4 structure is colored in light red. (B) Same as in (A) for the inhibitor GFB-9289 bound TRPC4. The protomer TRPC4 structure is shown in light green. (C) Similar to (A), but for inhibitor GFB-8749 bound TRPC4 structure colored in cyan. (D) Alignment of the structures of TRPC4 solubilized in amphipols or in the detergent LMNG. The protomer of apo-LMNG structure is shown in dark blue. (E) Alignment of the TRPC4-CaM complex structure with the TRPC4 apo-LMNG structure. The TRPC4-CaM complex is also solubilized in LMNG. The protomer of the TRPC4-CaM structure is shown in purple. (F) Alignment of the TRPC4-inhibitors and TRPC4-CaM structures. Note: The C-terminal helix in the apo structure (PDB ID: 6GIK) has been corrected for domain swapping (See Method section and Figure 5—figure supplement 3B for details).
Figure 2—figure supplement 5
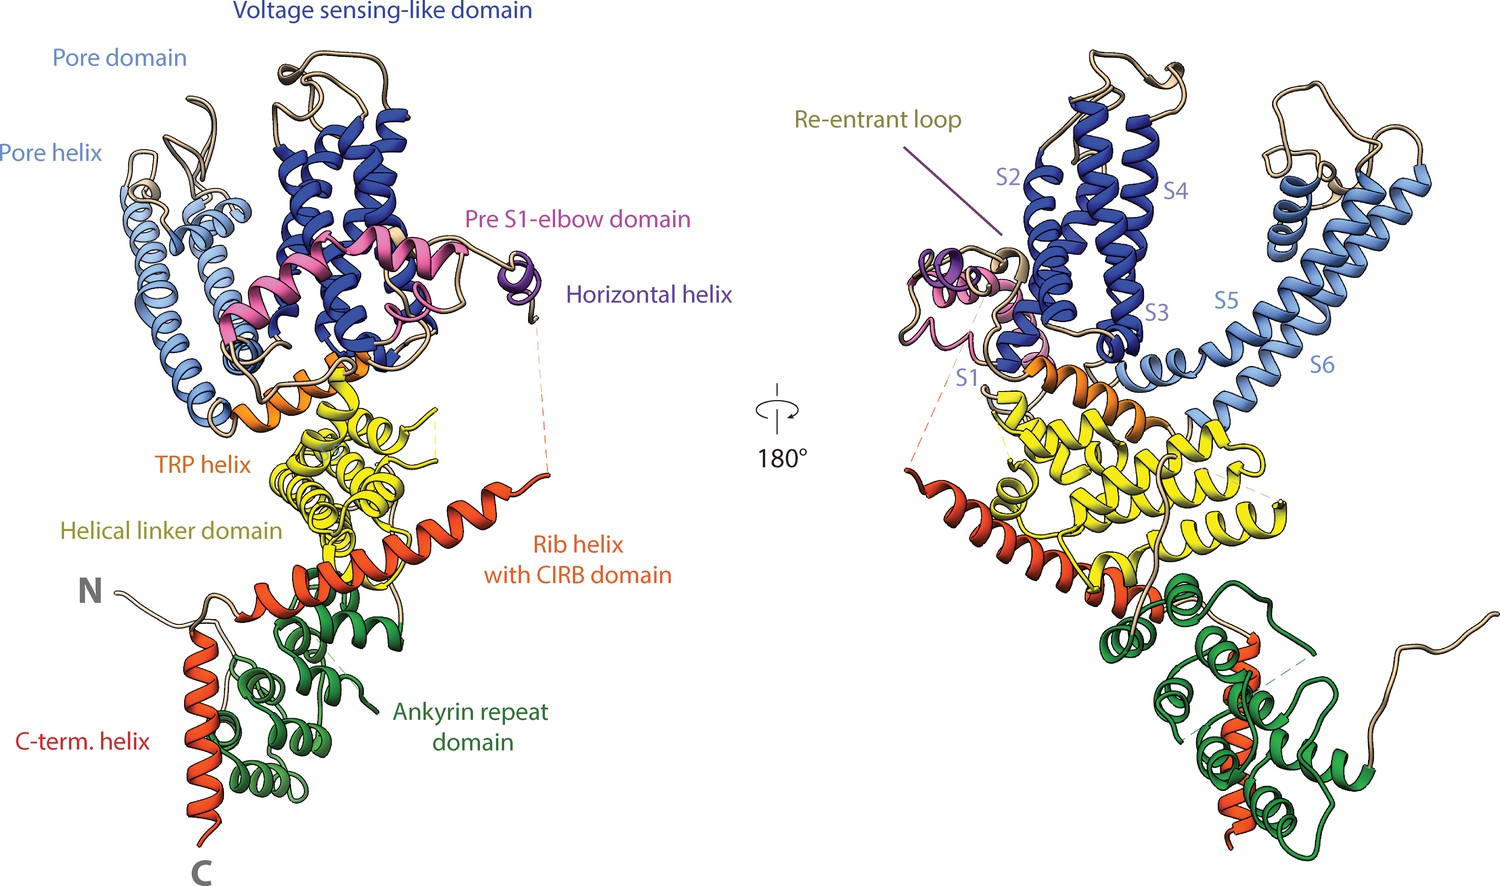
Domain architecture of zebrafish TRPC4 channel.
Cartoon representation of a TRPC4 protomer. Each domain is shown in a different color and labeled accordingly.
Figure 3 with 1 supplement

Comparison of the ligand-binding pocket in TRPC4.
(A) Close-up of ligand-binding pocket in the apo TRPC4 structure, which is enclosed by the four helices S1 to S4 of the voltage sensing-like domain. (B) Superposition of inhibitor-bound (red) and apo (blue) structure of TRPC4. A close-up of the ligand-binding pocket is shown, with important and interacting residues highlighted. The inhibitor GFB-8438 is depicted in red, positions of the surrounding helices S1 to S4 are indicated. (C) and (D) Same as in (B) for the inhibitor GFB-9289 and GFB-8749 -bound TRPC4 structures respectively. The structures of GFB-9289 and GFB-8749 are depicted in green and cyan respectively. In all the inhibitor-bound structures, several residues move away from the center of the pocket to create space for accommodating the respective ligand. (E) Position of the inhibitor AM-1473 within the VSL domain binding pocket of TRPC6 is shown. The surrounding helices S1-S3 are indicated for orientation. (F) Superposition of GFB-8438-bound TRPC4 (red) and AM-1473-bound TRPC6 (purple) channels. The location of the GFB-8438 inhibitor within the VSL domain is shown. In contrast to AM-1473, which is located in the lower part of the binding pocket (see E), GFB-8438 additionally interacts with the upper region of the pocket. The depicted residues in this region contribute to the selectivity of GFB-8438 for TRP4/5 channels. (G) Comparison of small-molecule modulators of the TRP channel family that target the ligand-binding pocket enclosed by the helices of the VSL domain (VSLD). Small molecules are depicted as space-filled spheres with inhibitors shown in red. Residues interacting with the ligand are shown in stick representation. Pore helices are colored in blue, the TRP helix in orange.
Figure 3—figure supplement 1
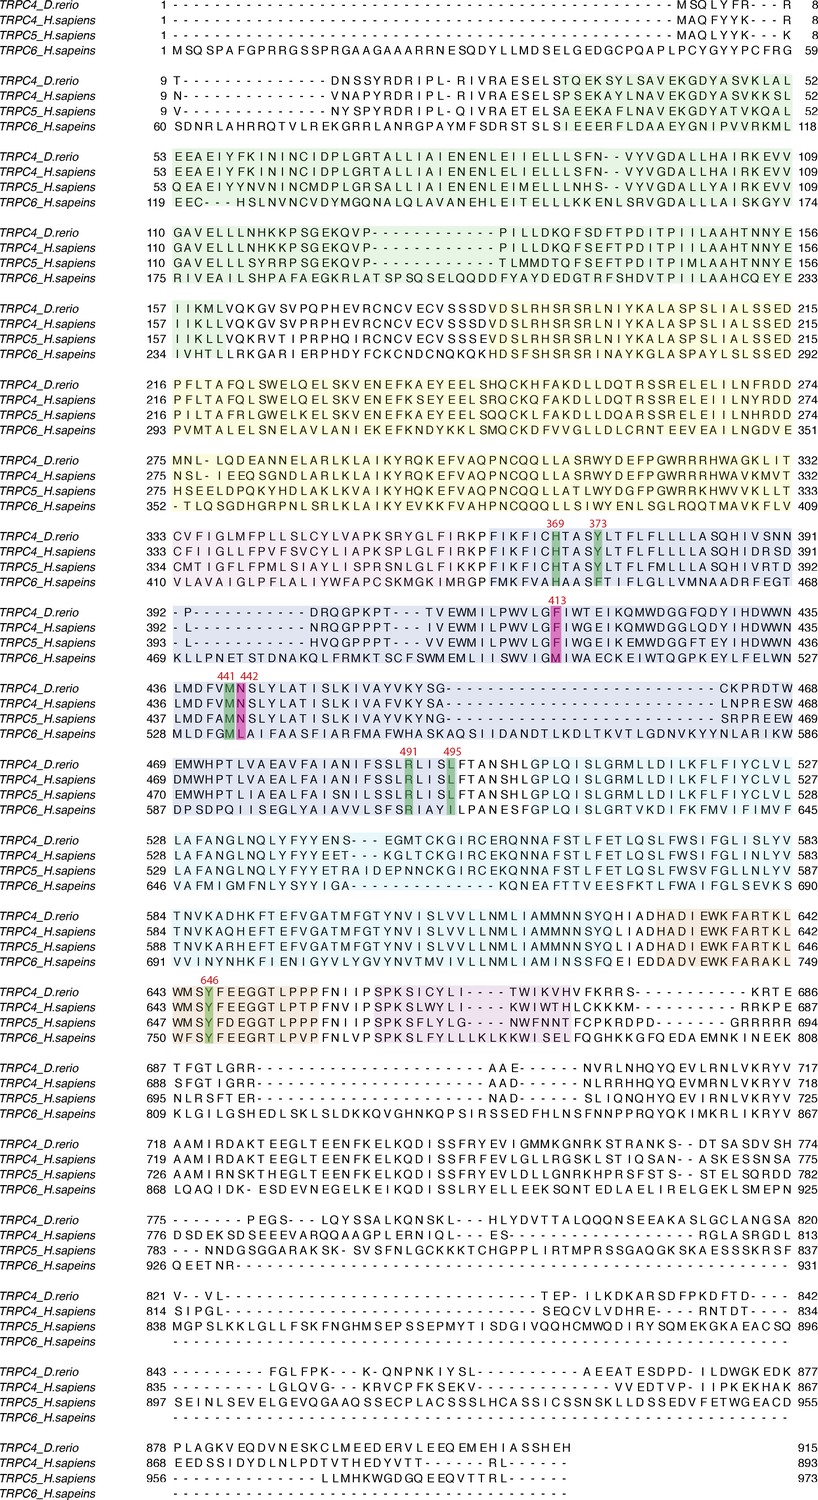
Sequence alignment of zebrafish TRPC4, human TRPC4, TRPC5, and TRPC6.
The highlighted and marked residues denote the conserved residues in TRPC4 and TRPC5 interacting with the inhibitor GFB-8438. The residues highlighted in pink color shows the critical difference between TRPC4/5 and TRPC6 for the inhibitor binding site.
Figure 4 with 2 supplements
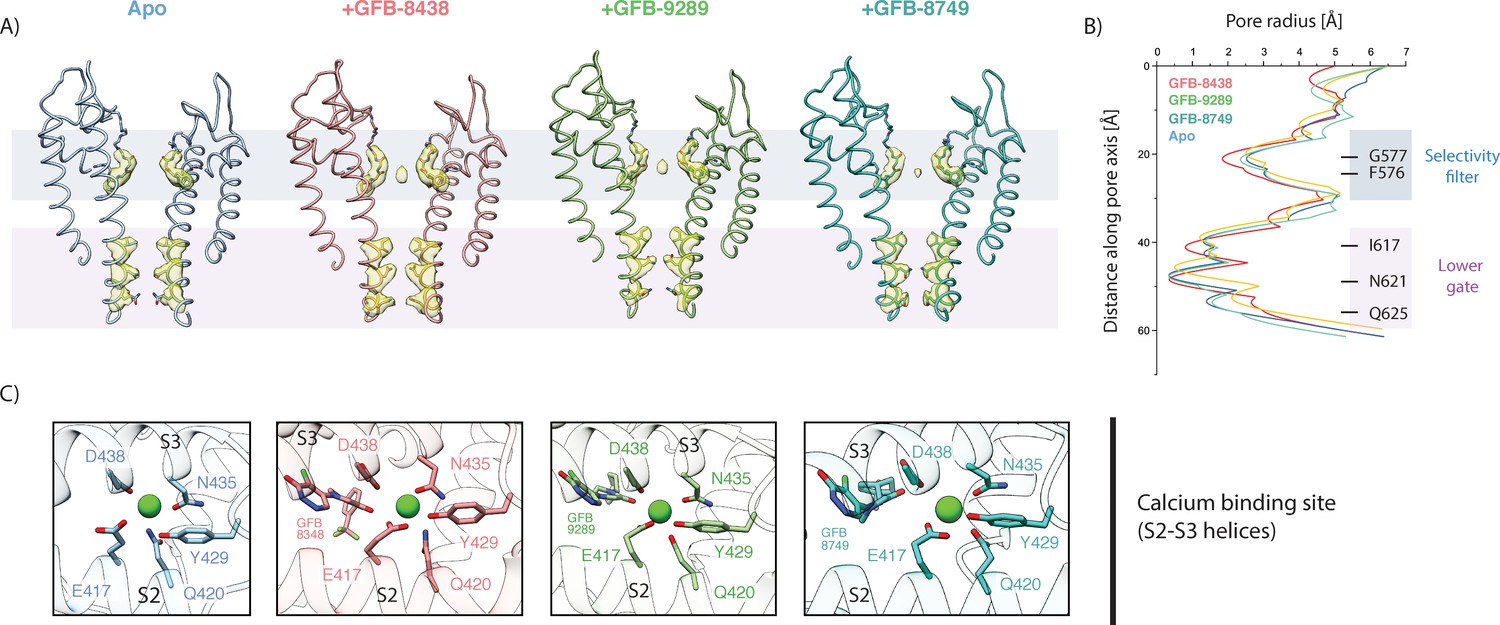
Comparison of the ion conduction pore and Ca2+-binding site.
(A) Side view of the pore-forming region of TRPC4 in the apo- (blue), GFB-8438 (red) GFB-9289 (green) and GFB-8749 (cyan-blue) inhibitor-bound structures. Only the two opposing subunits of the tetrameric channel are shown as ribbon representation for clarity. The density at comparable thresholds corresponding to the selectivity filter (light blue) and the lower gate (pink) is shown. A central density is observed in all maps, except the apo structure. (B) The calculated pore-radii corresponding to the four TRPC structures in (A) are depicted. The color code is also identical to (A). The positions of important residues, constituting the selectivity filter and the lower gate, are indicated on the right. (C) Close-up of the Ca2+-binding site in the four TRPC4 structures, located in direct vicinity to the ligand binding pocket of the VSL domain. Position of ligands and coordinating residues are highlighted. Color code of TRPC4 structures is as in (A).
Figure 4—figure supplement 1
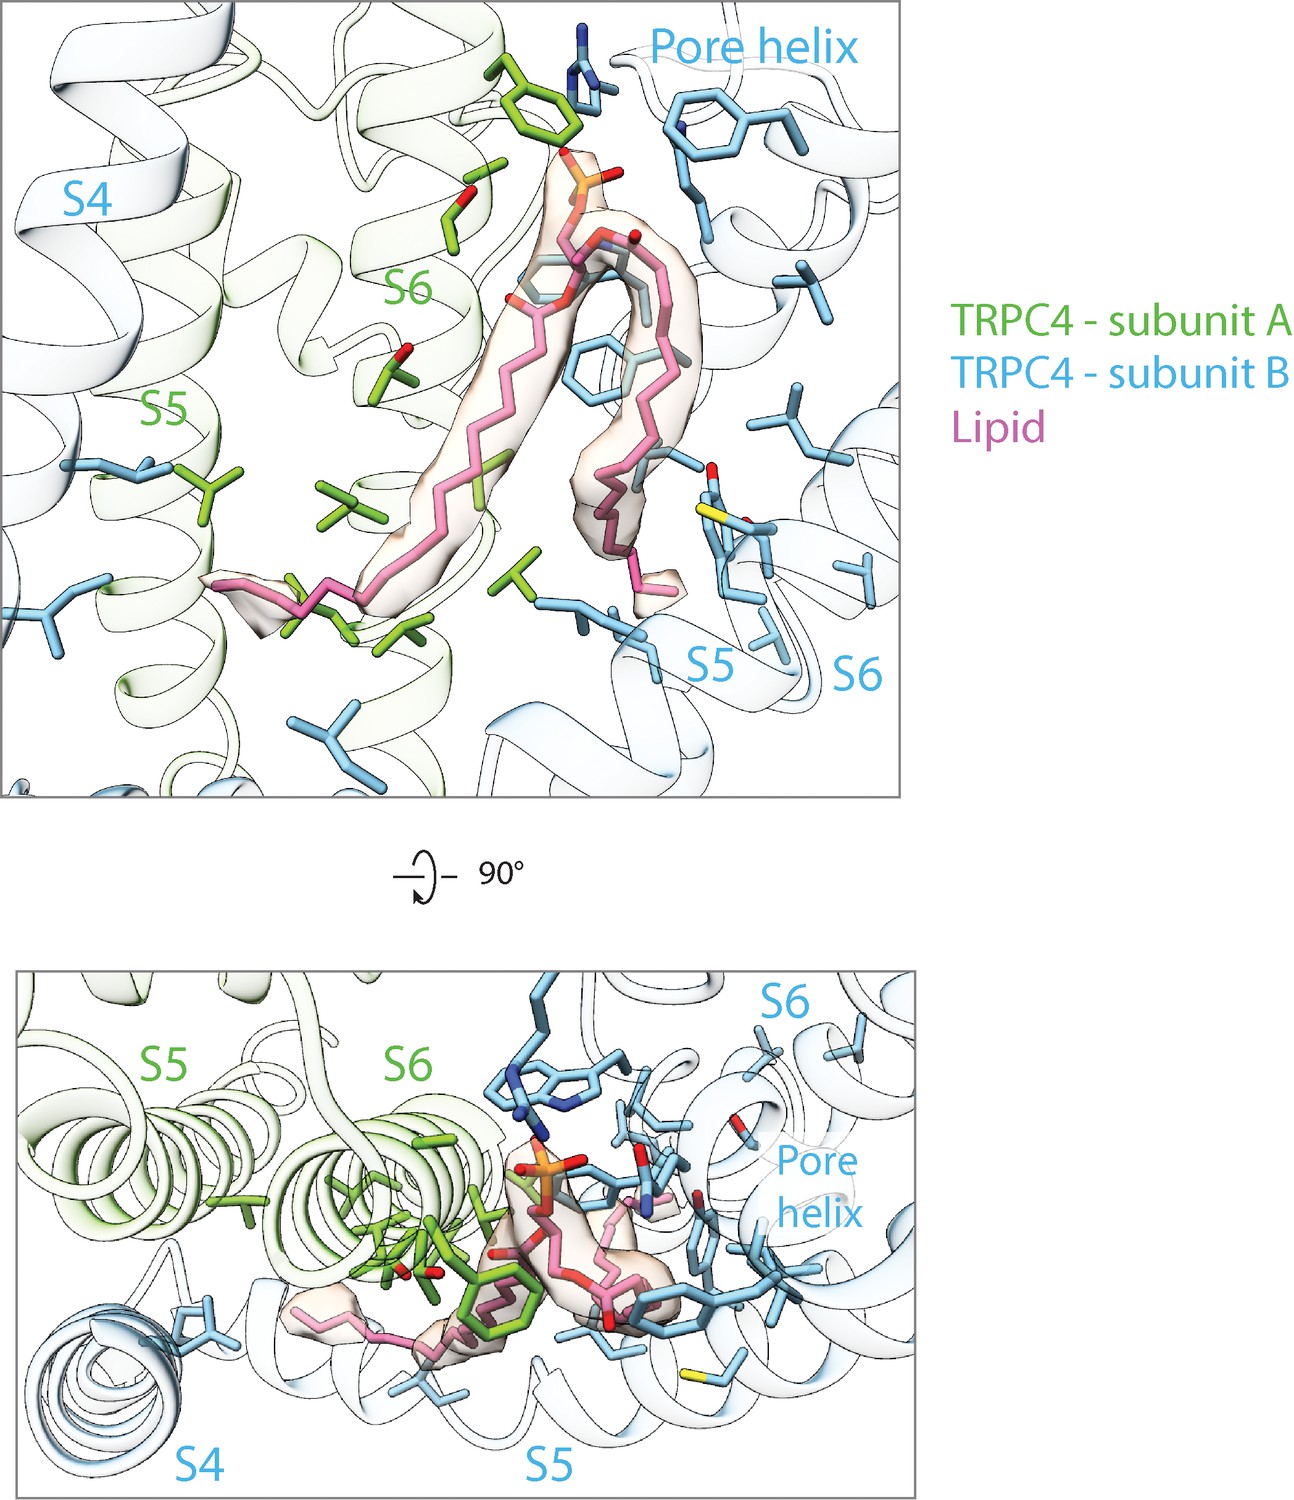
Different views of the lipid binding pocket at the interface between two subunits.
Phosphatidic acid (pink) that binds at the interface between two subunits near the pore region is shown in stick representation along with the corresponding density. The interacting residues from the S4, S5 and S6 helices are also shown in stick representation. The protein residues from different protomers are colored differently. The helices are shown in cartoon representation with high transparency.
Figure 4—figure supplement 2
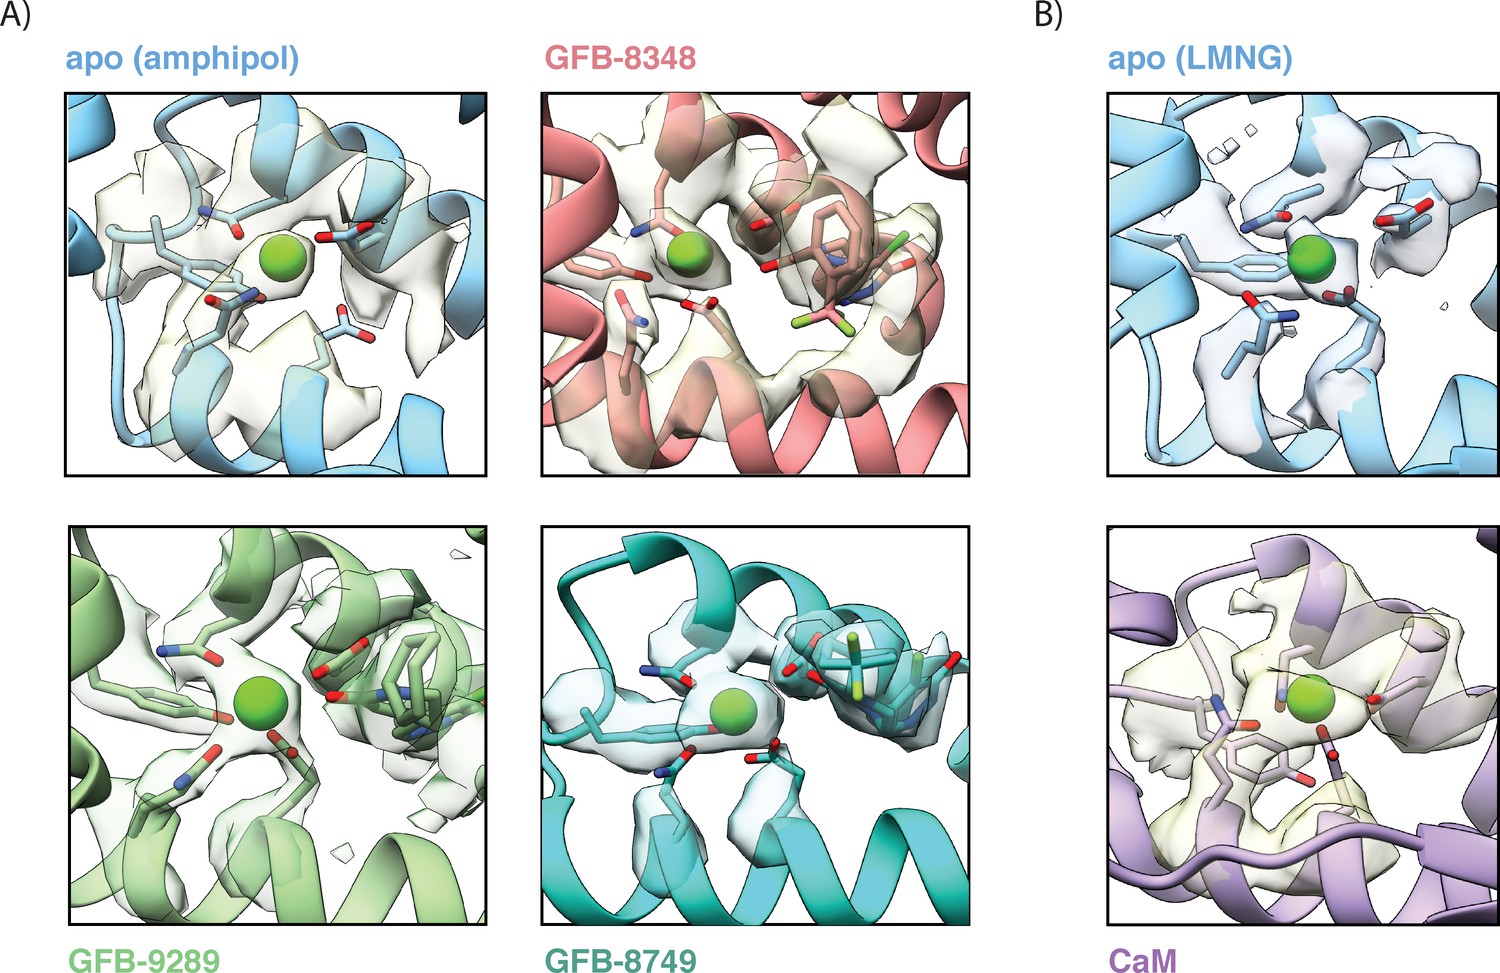
Ca2+-binding site in the VSL domain of apo and ligand-bound TRPC4.
(A) Close-up view of the Ca2+-binding site in apo and ligand-bound TRPC4 determined in amphipols. The coordinating residues in the Ca2+ ion binding site and the modelled Ca2+ ion are shown in stick and sphere representation along with their densities. The oxygen atom of the ligand molecules is situated close to the bound Ca2+-ion (refer) Figure 4C (B) Close-up view of the Ca2+-binding site in apo and TRPC4-CaM complex determined in presence of lauryl maltose neopentyl glycol (LMNG). The external addition of Ca2+ ion during the TRPC4-CaM complex preparation reflects its strong density. The different structural forms shown in (A) and (B) are color coded and named accordingly.
Figure 5 with 6 supplements
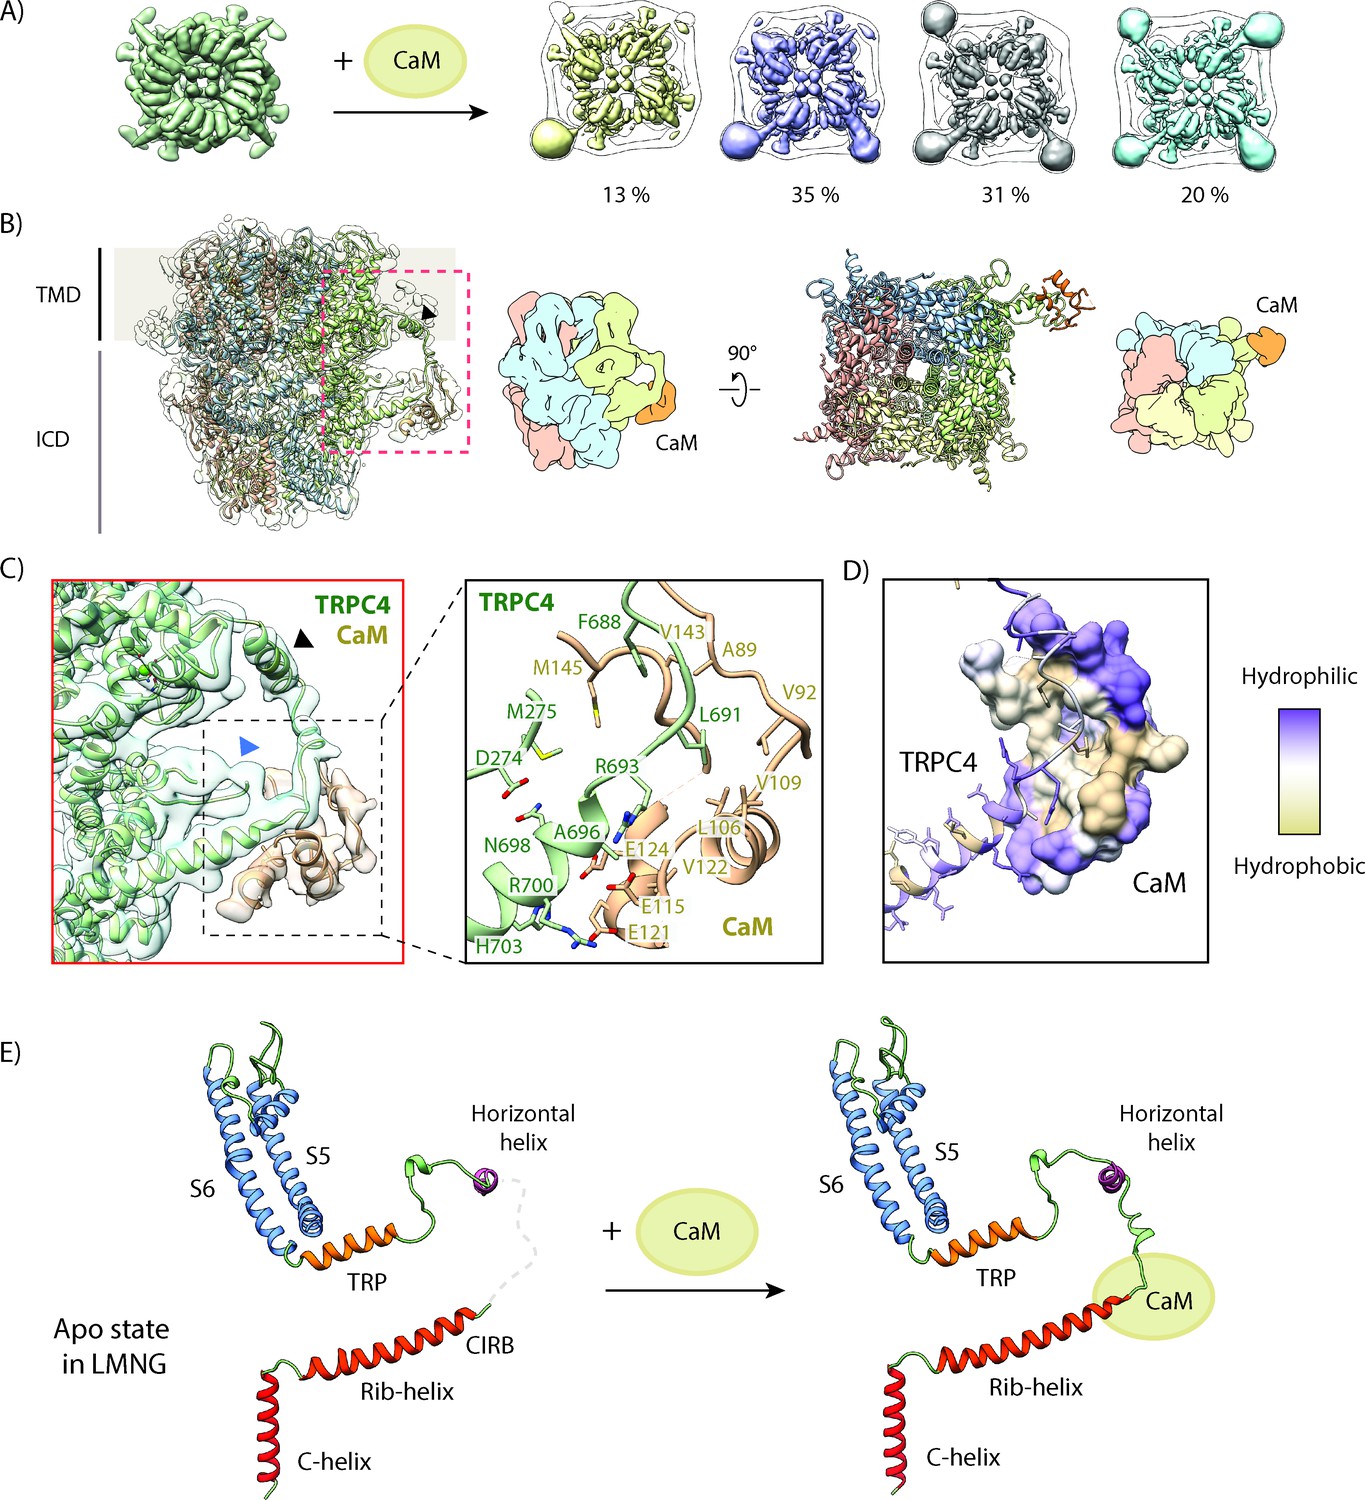
Structural basis for inhibition of TRPC4 by calmodulin.
(A) One to four CaM molecules are bound to the CIRB binding sites of the tetrameric TRPC4 channel. 13% of particles are decorated with one (yellow), 35% with two (lilac), 31% with three (grey) and 20% with four CaM molecules (turquoise). (B) Side view of the CaM-bound TRPC4 density map (transparent) with the corresponding atomic model fitted inside, in which each protomer is colored differently. Position of the horizontal helix is indicated by black arrowhead. The bottom view of the atomic model is shown in the right panel. A schematic representation for both views is provided next to the atomic models. CaM is colored in orange. (C) Close-up of the indicated region in (B), showing the CaM binding region (left panel). CaM is colored in orange, TRPC4 in green. Positions of the horizontal helix and loop region 273–277 are indicated by black and blue arrowhead, respectively. Important and the predicted interacting residues of TRPC4 and CaM based on our model are highlighted in the right panel. (D) TRPC4 (cartoon representation) and CaM (surface representation) are colored according to hydrophobicity. There is a central hydrophobic cavity in CaM that is surrounded by hydrophilic residues in its periphery. The complementary binding region of TRPC matches this profile. (E) The C-terminal helix (red), the rib-helix (red-orange), the horizontal helix (purple), the TRP helix (orange) and the pore-forming helices (blue) of a single TRPC4 promoter are shown before (left panel) and after CaM binding (right panel). CaM binding stabilizes the previously disordered region connecting the rib-helix and horizontal/TRP-helix. LMNG – lauryl maltose neopentyl glycol.
Figure 5—figure supplement 1
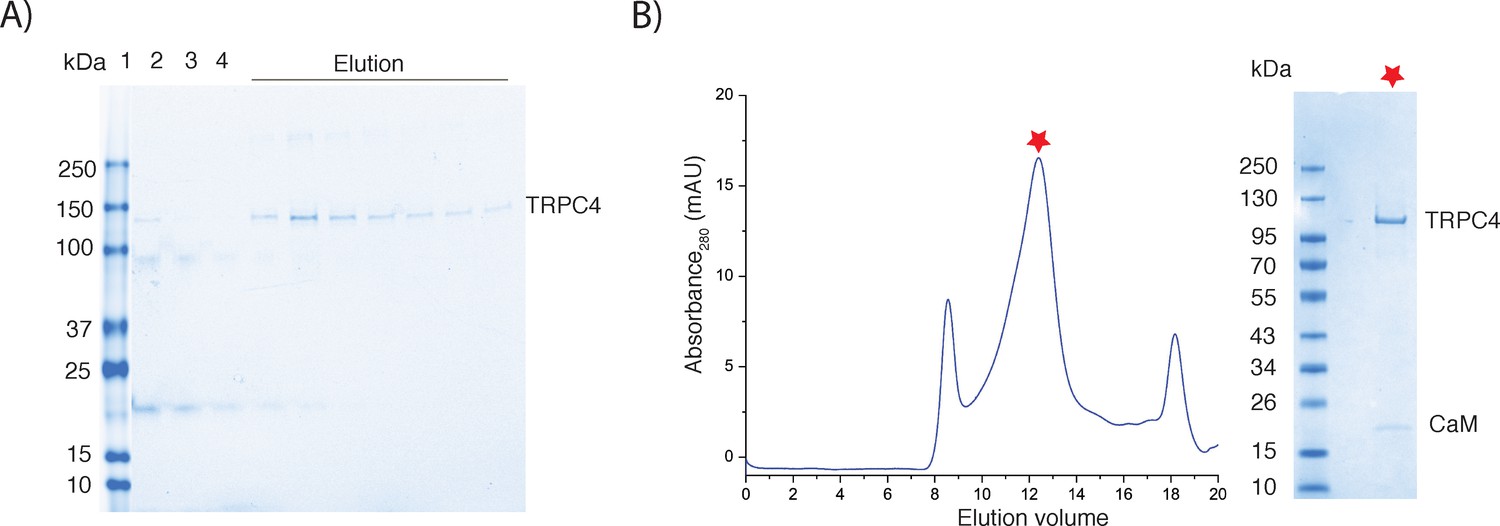
Analysis of CaM binding to TRPC4 by biochemical methods.
(A) SDS gel electrophoresis analysis of the TRPC4 pull down experiment performed with a CaM Sepharose column. Lane 1 - protein size marker, lane 2 - TRPC4 input, lane 3 - flow through, lane 4 - wash, remaining lanes - elution fractions. (B) Gel filtration analysis of the TRPC4-CaM complex. The peak fraction containing the TRPC4-CaM complex is indicated by a star were further analyzed by SDS gel electrophoresis (right panel).
Figure 5—figure supplement 2
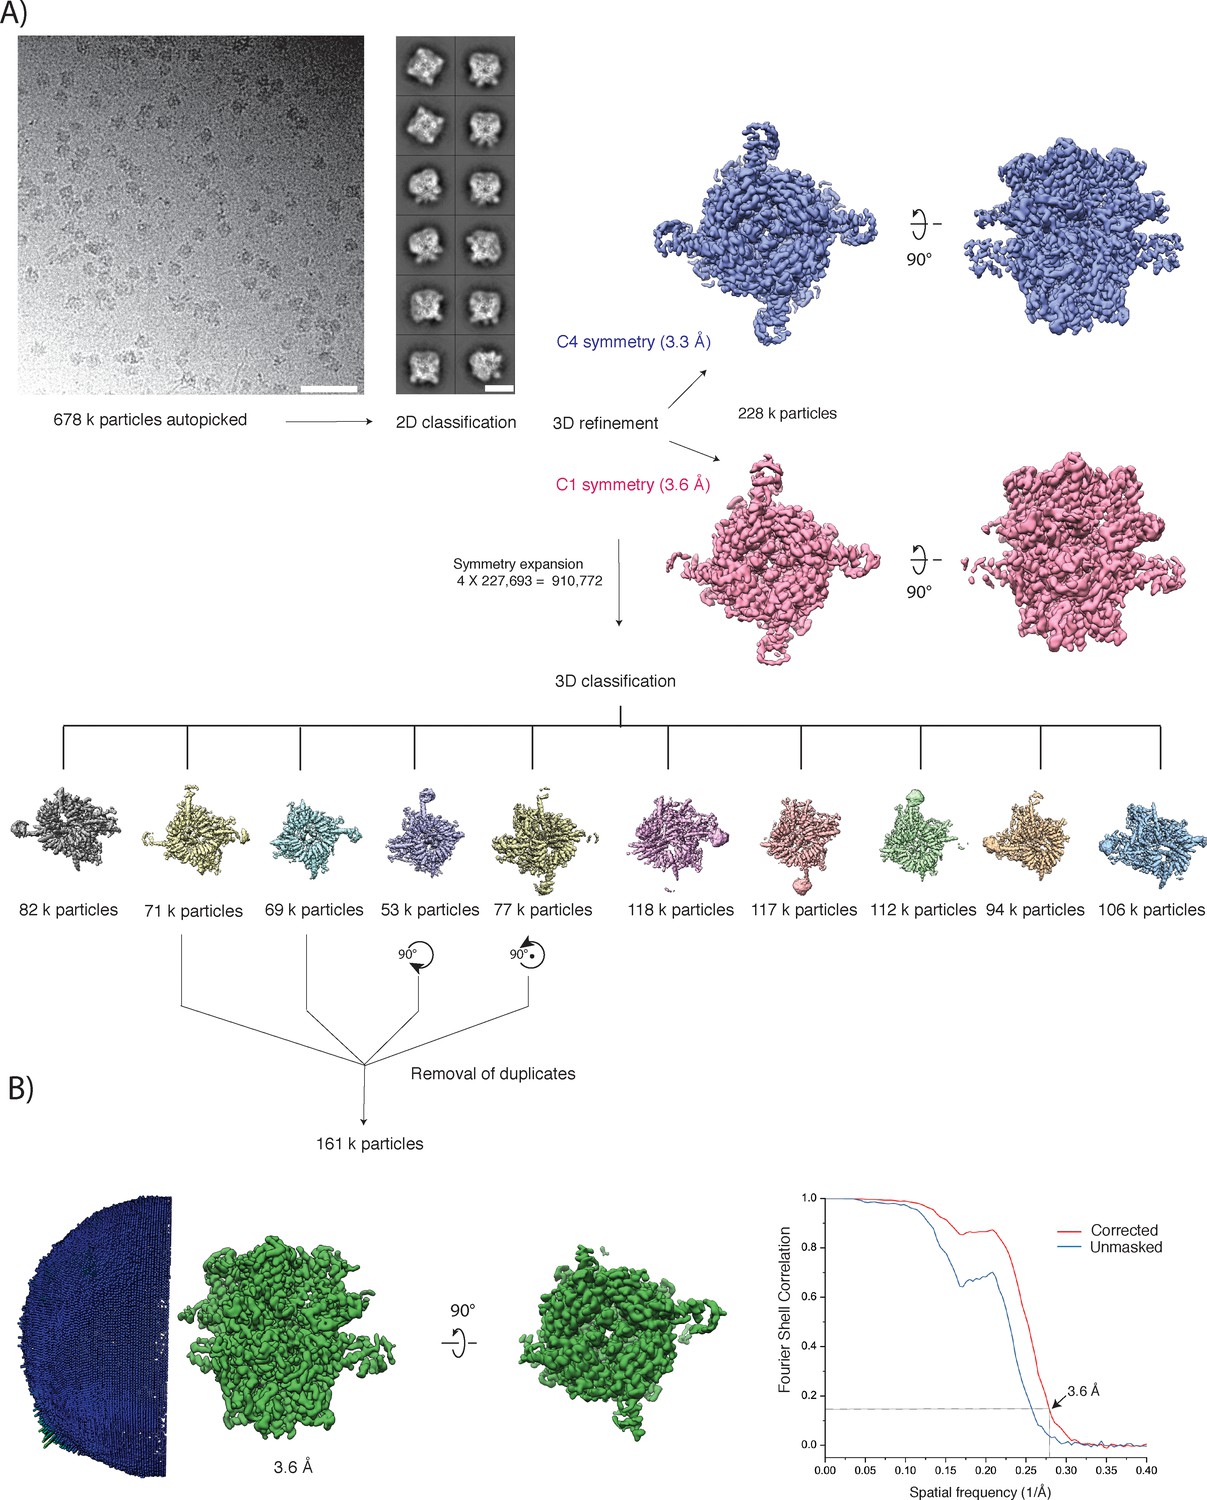
Cryo-EM image processing of the TRPC4- CaM complex.
(A) The top left panels show a representative digital micrograph area and selected class averages of the TRPC4-CaM complex. Scale bars, 50 nm and 10 nm, respectively. The initial refinement densities obtained without symmetry (red) and with C4 symmetry (blue) are shown in the top right panel. The middle panel shows densities of different subclasses obtained with 3-D classification after symmetry expansion. Four subclasses were selected, rotated as indicated and used for the final refinement after removal of duplicates. (B) Angular distribution of particles used in the final refinement and Fourier shell correlation curves (FSC) between the two independently refined maps. The dotted lines indicate the 0.143 FSC criterion used for average resolution estimation.
Figure 5—figure supplement 3
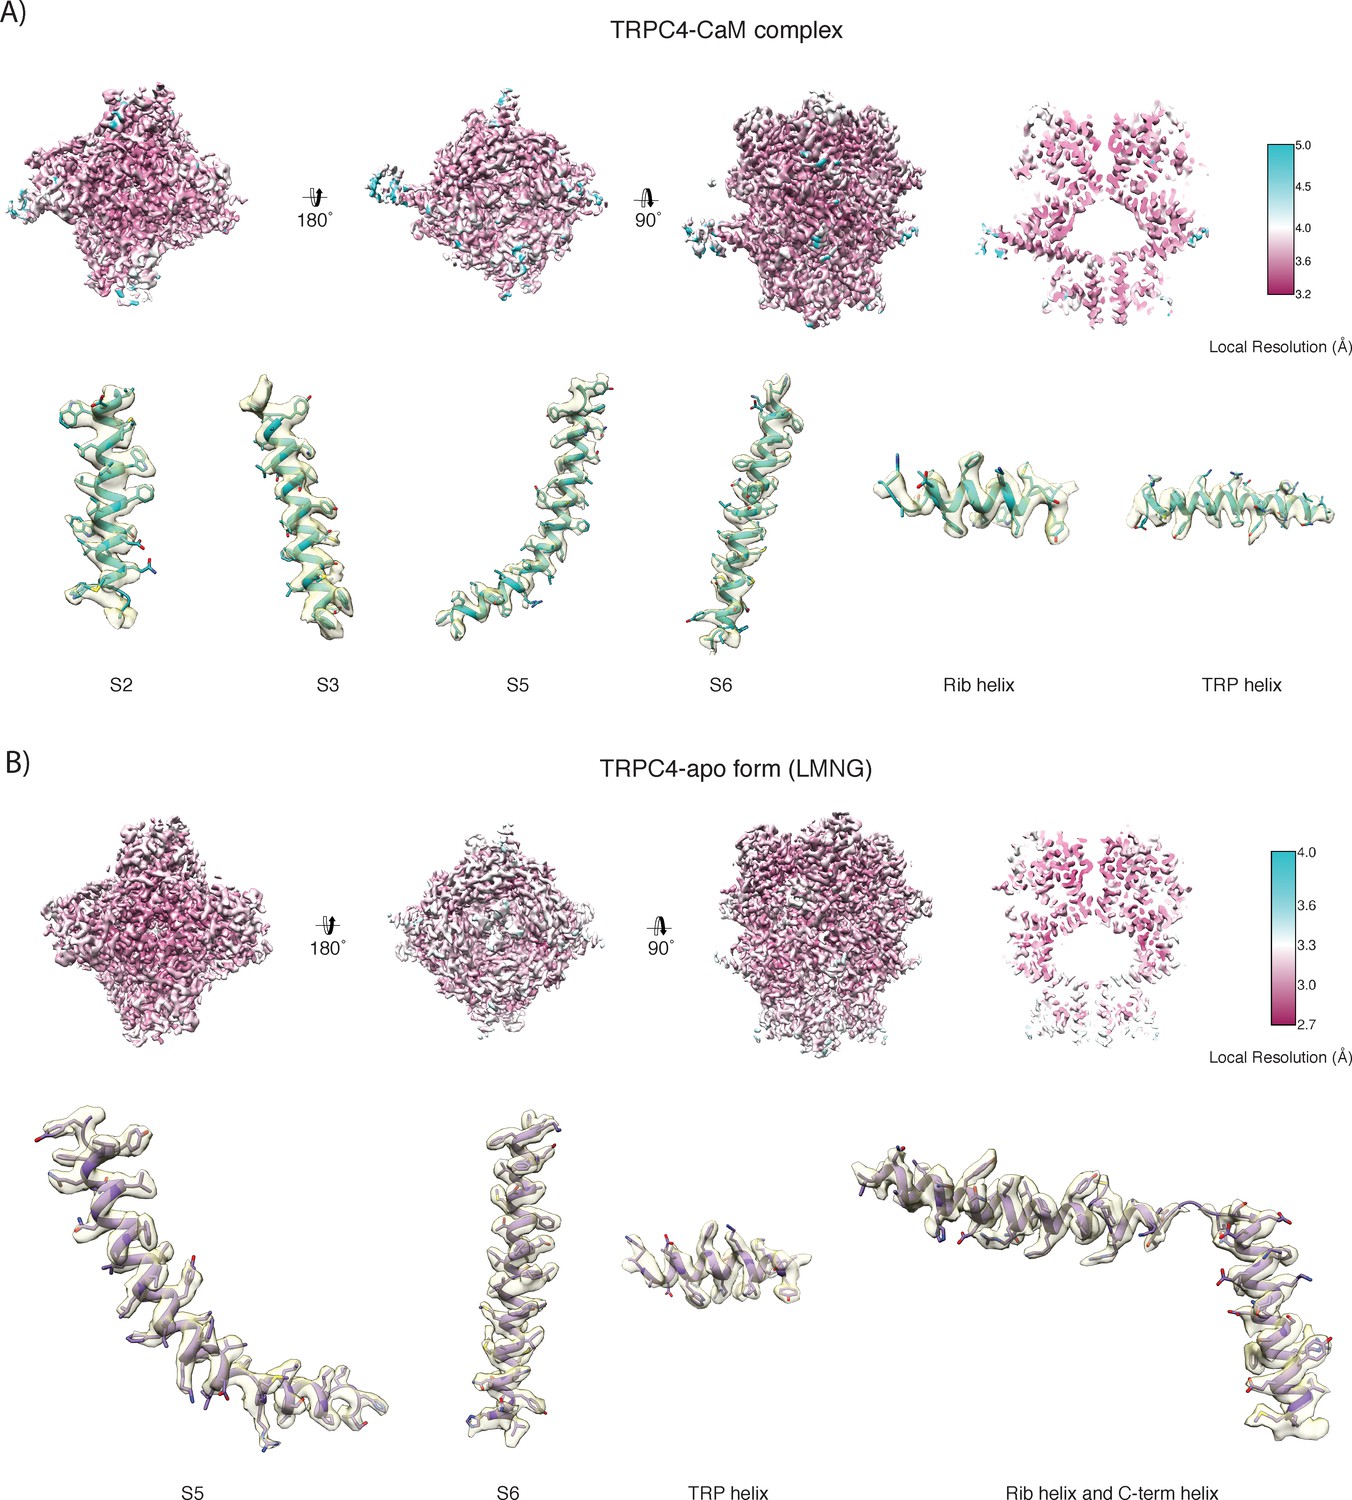
Local resolution maps of TRPC4-apo (LMNG) and TRPC4-CaM.
(A, B) Maps of TRPC4-CaM and TRPC4-apo (LMNG), respectively, colored according to the local resolution. Representative regions of the density with the fitted atomic model are shown below the local resolution maps.
Figure 5—figure supplement 4
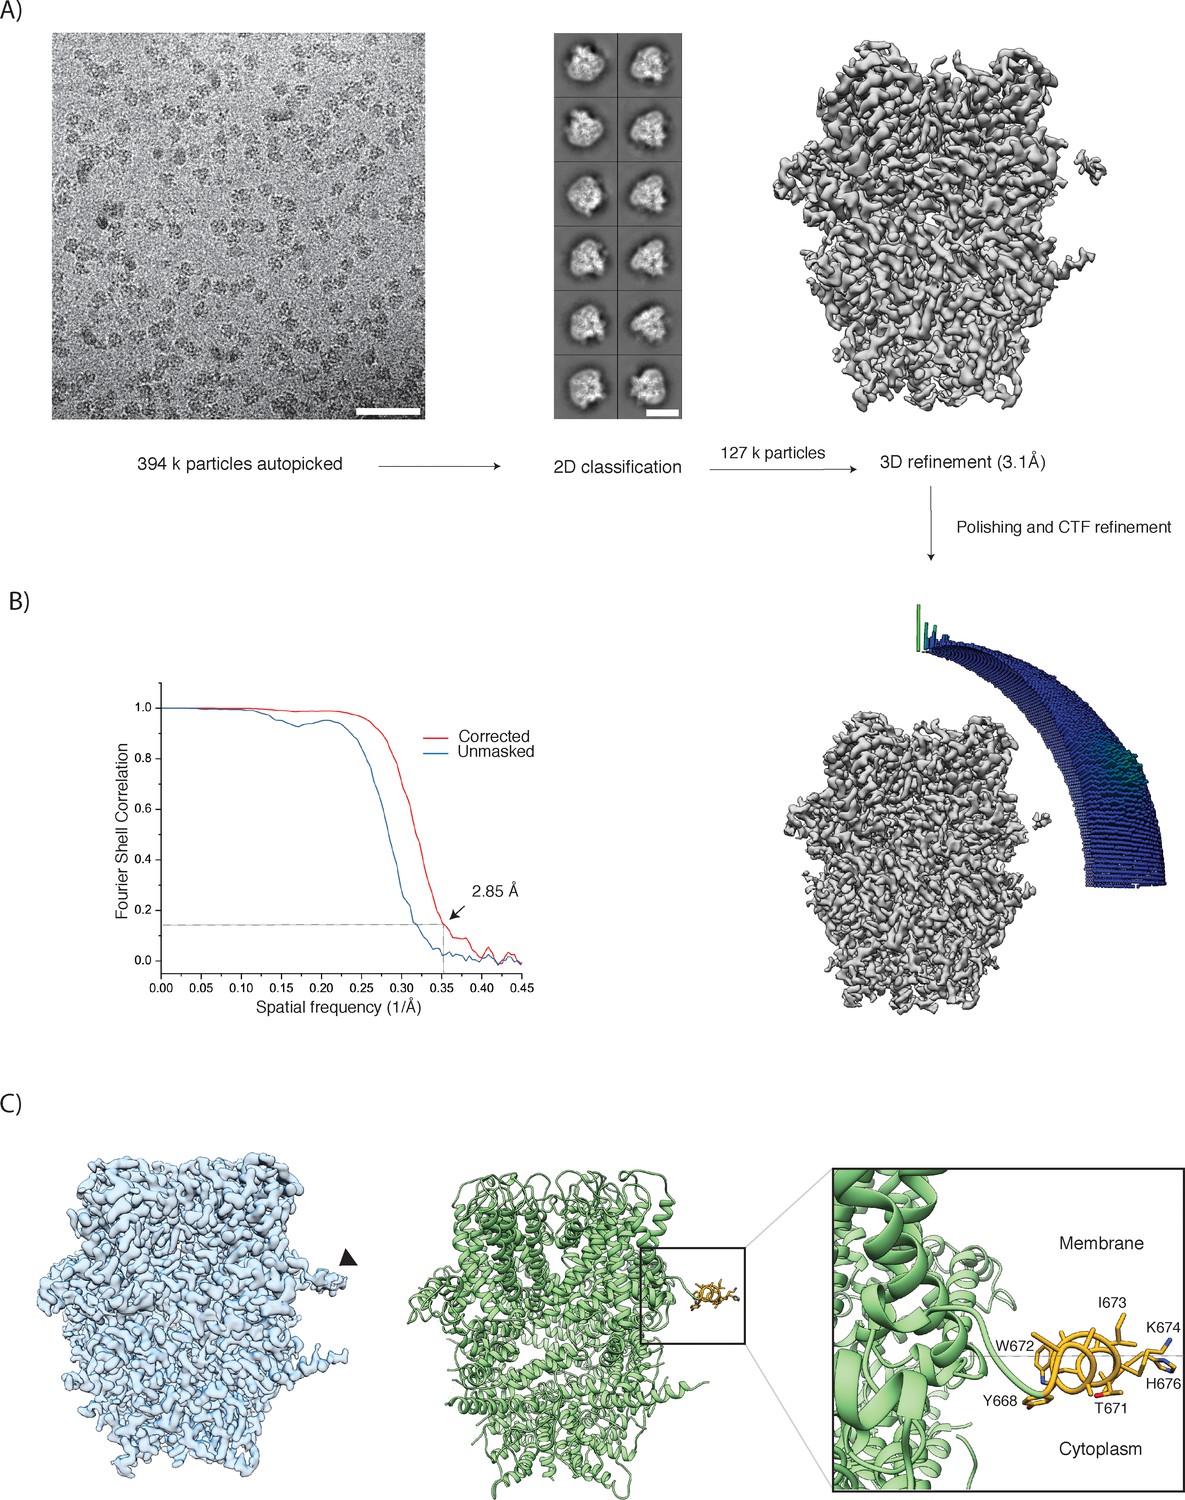
Cryo-EM image processing and structure determination of TRPC4 solubilized in LMNG.
(A) The top left panels show a representative micrograph and class averages of TRPC4 solubilized in LMNG. Scale bars, 50 nm and 10 nm, respectively. The density resulting from the initial 3D refinement is shown in the top right panel. (B) Angular distribution of particles used in the final refinement and Fourier shell correlation curves (FSC) between the two independently refined maps. The dotted lines indicate the 0.143 FSC criterion used for average resolution estimation. (C) The final map, filtered using LAFTER, shows a clear density corresponding to a horizontal helix (indicated with an arrowhead) (left panel). The corresponding structure in cartoon representation with the residues of the horizontal helix shown in golden yellow (middle panel). Zoom-in view of the horizontal helix (right panel).
Figure 5—figure supplement 5
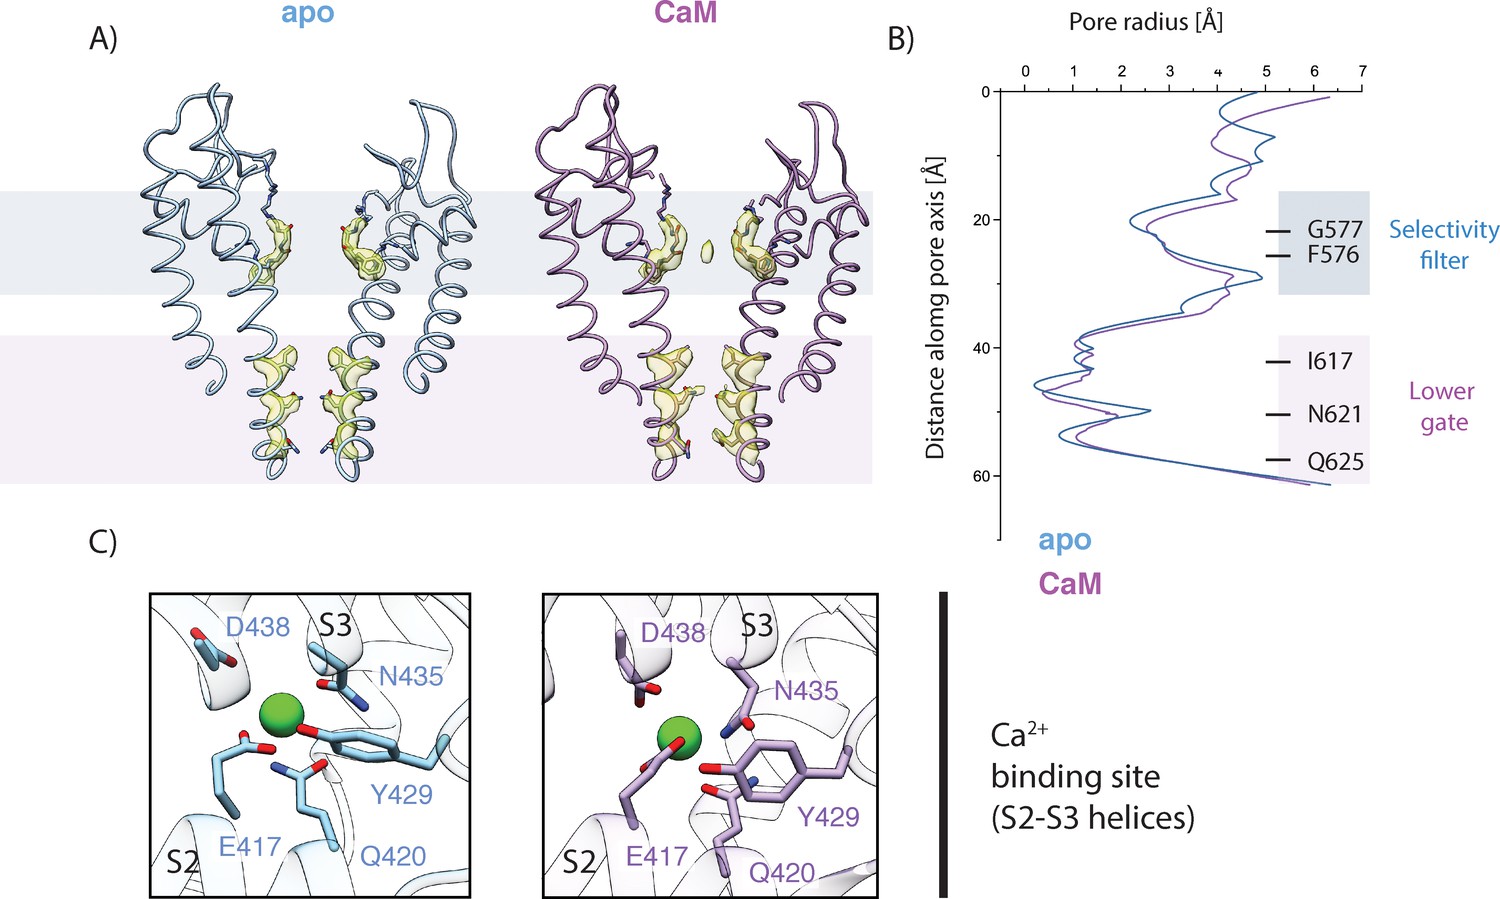
Comparison of the ion conduction pore and Ca2+-binding site.
(A) Side view of the pore-forming region of TRPC4 in the apo (LMNG)- (blue), and CaM-bound (purple) structures. Only the two opposing subunits of the tetrameric channel are shown as ribbon representation for clarity. The density at comparable thresholds corresponding to the selectivity filter (light blue) and the lower gate (pink) is shown. Note, only in the TRPC4-CaM complex structure an additional density occupies the center of the selectivity filter. (B) The calculated pore radii corresponding to the structures in (A) are depicted. The color code is identical to (A). The positions of important residues, constituting the selectivity filter and the lower gate, are indicated on the right. (C) Close-up view of the Ca2+-binding site in the VSL domain of TRPC4-apo (LMNG) (left) and TRPC4-CaM (right). Ca2+ ion is shown as green sphere and interacting residues are highlighted. Color code of TRPC4 structures is as in (A).
Figure 5—figure supplement 6
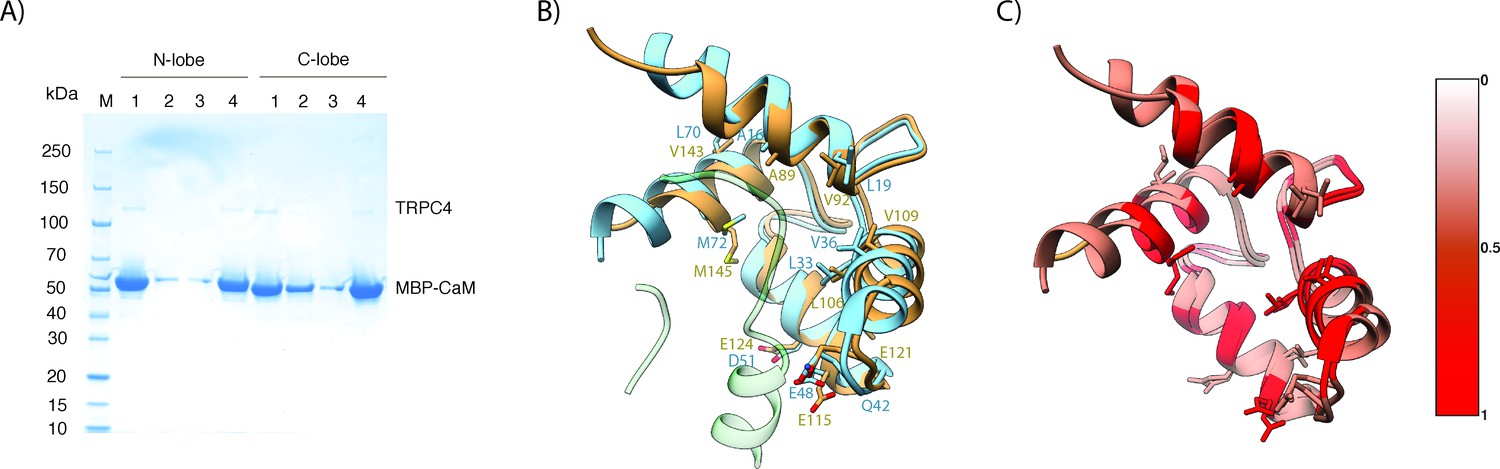
Biochemical and structural analysis of CaM N- and C-lobe binding to TRPC4.
(A) SDS gel electrophoresis analysis of TRPC4 binding to MBP-fused N- and C-lobes of CaM after a pull-down assay using amylose resin. Lane M - protein size marker, lane 1 - TRPC4 input, lane 2 - flow through, lane 3 - wash and lane 4 - elution fractions of corresponding N- and C-lobes of CaM. (B) Superposition of the N- (light blue) and C-lobe (wheat) of CaM-bound to TRPC4 (light green). The CaM residues predicted to interact with TRPC4 are shown in stick representation with the labels colored according to the lobe. (C). Superposition of the N- and C-lobe of CaM-bound to TRPC4. The CaM residues predicted to interact with TRPC4 are colored based on the sequence conservation.
Figure 6
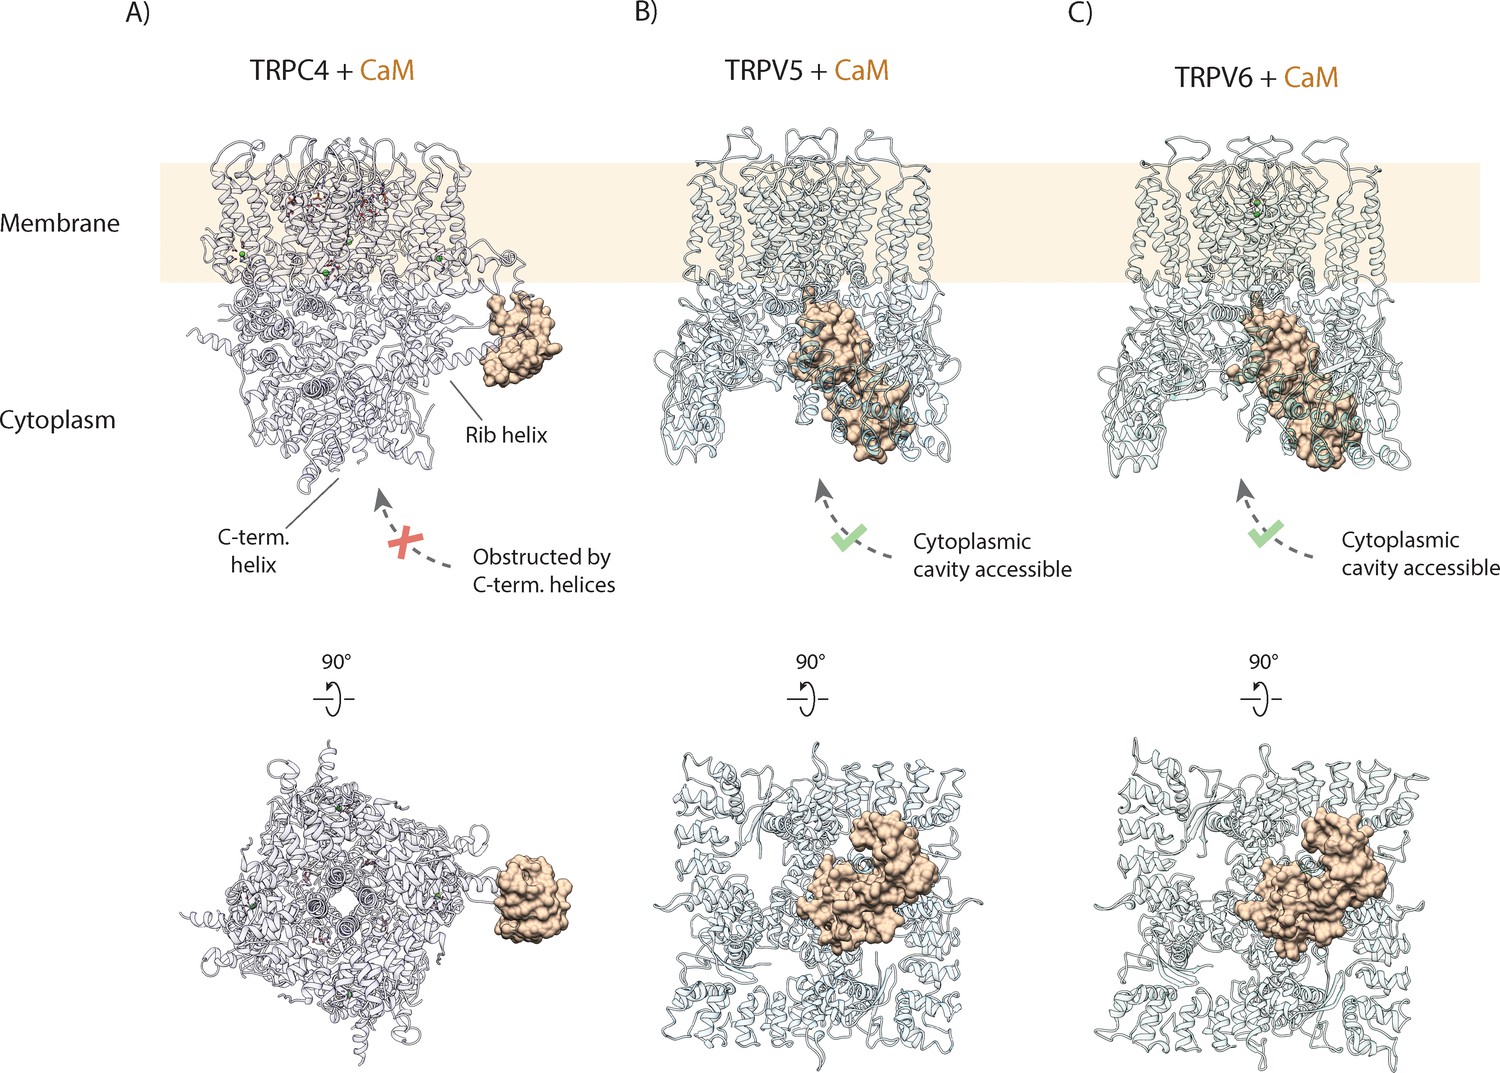
Comparison of CaM binding in TRPC and TRPV channels.
(A) Calmodulin (CaM) interacts with the rib helix of TRPC4. Side (upper panel) and bottom (lower panel) view of the CaM-bound TRPC4 is shown, with TRPC4 structure in cartoon representation with moderate transparency and CaM in space filling sphere representation. Only a single lobe of the double-lobed CaM molecule is resolved in the structure. This indicates that the second lobe is rather flexible. Up to four binding sites are accessible for CaM (only one binding event is shown here for clarity). (B) Same as in (A) for TRPV5. The two-lobed CaM binds into the central cytoplasmic cavity of TRPV5. While four potential binding sites are available in TRPV5, only a single CaM molecule can bind due to steric hindrance. Unlike TRPC4, in which the C-terminal helices block the access to the cytoplasmic cavity, CaM can enter into the internal cavity of TRPV5 from the cytoplasm. (C) Same as in (A) for TRPV6. Similar to TRPV5, only a single CaM molecule binds to a region within the cytoplasmic cavity of TRPV6, indicating that this binding mode is conserved among TRPV channels.
Figure 7
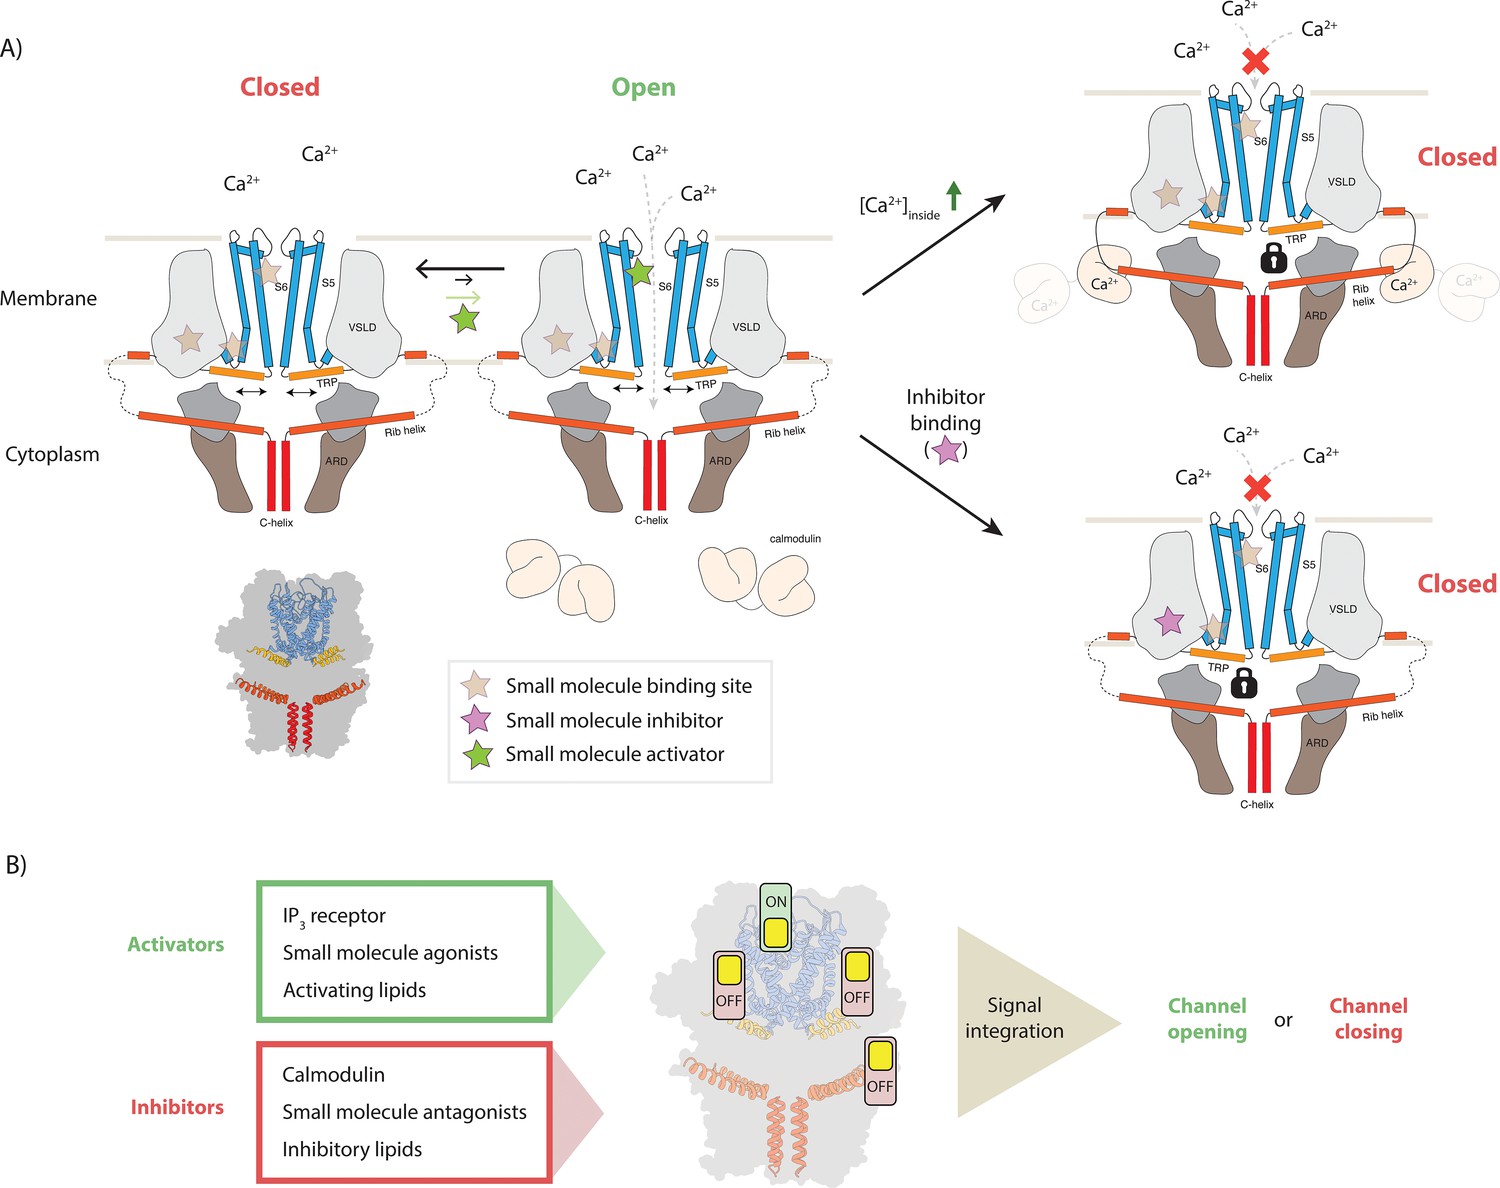
Model for TRPC4 modulation.
(A) Canonical TRP channels can transiently open to allow the passage of Ca2+ ions into the interior compartment (left panel). Several mechanisms modulate the activity of the channel: binding of small molecule activators to one of the ligand binding pockets favors the opening event and thereby increases the overall channel activity. In the gating process, the TRP helix (orange) plays a central role as it has a direct connection to the pore-forming helices (blue), constituting the ion-conducting pore. Binding of small molecule inhibitors and the inhibitory protein CaM can restrict the mobility of the TRP helix, thus locking the channel in the closed state (bottom and top panels on the right, respectively). In the latter case, high intracellular Ca2+ concentrations cause the Ca2+-sensing protein CaM to bind to the CIRB region of the protruding rib-helix (red). This binding event stabilizes a previously disordered region that directly connects to the TRP helix. (B) Individual or simultaneous binding of activators and/or inhibitors modulate the channel gating. Interestingly, modulation sites, i.e. ligand pockets or structural features to which certain compounds or regulatory proteins bind, can accommodate both activators and inhibitors. Thus, these regions can be considered as activity switches. Binding of activators results in an ‘ON’ position, whereas inhibitor binding causes an ‘OFF’ state. In the case that multiple modulators bind simultaneously, all signals are integrated to determine whether the channel opens or remains closed.
Tables
Key resources table
| Reagent type (species) or resource | Designation | Source or reference | Identifiers | Additional information |
|---|---|---|---|---|
| Cell line (HEK293 GnTI-) | HEK293 GnTI- | ATCC | RRID:CVCL_A785 | CRL-3022 |
| Cell line (HEK293T) | HEK293T | ATCC | RRID:CVCL_LF41 | |
| Cell line (Sf9) | Sf9 | Oxford Expression Technologies Ltd (UK) | RRID:CVCL_0549 | Cat.No.600100 |
| Gene (Danio rerio) | TRPC4DR | GenScript NCBI Reference sequence: NM_001289881 | ||
| Recombinant DNA reagent | pCDNA3.1+TRPC4ZF | Vinayagam et al., 2018 PMID:29717981 | ||
| Recombinant DNA reagent | pEG BacMam | Eric Gouaux Lab PMID:25299155 | ||
| Recombinant DNA reagent | pEG BacMam +TRPC4 ZF (See methods section for details) | Vinayagam et al., 2018 PMID:29717981 | ||
| Recombinant DNA reagent | pGEMHE 22 | Promega | P2151 | pGEMHE 22 is a derivative of pGEM3z |
| Chemical compound, drug | (-)-Englerin A | Carl Roth | Cat.No.6492.1 | |
| Software, algorithm | SPHIRE software package | Moriya et al., 2017 PMID:28570515 | ||
| Software, algorithm | crYOLO | Wagner et al., 2019 PMID:31240256 | ||
| Software, algorithm | Origin 2020 pro | OriginLab Corporation | ||
| Software, algorithm | TranSPHIRE | Stabrin et al., 2020 doi:https://doi.org/10.1101/2020.06.16.155275 | ||
| Software, algorithm | Chimera | Pettersen et al., 2004 PMID:15264254 |
Table 1
Plunging and imaging conditions used for cryo-EM analysis of TRPC4 bound with ligands.
| 1.1 Plunging conditions | ||||||
|---|---|---|---|---|---|---|
| Sample | Grid type | Volume | Concentration | Blotting time | Blotting force | |
| TRPC4-8438 | C-Flat 2/1 | 3 µl | 0.3 mg/ml | 3 s | −10 | |
| TRPC4-9289 | C-Flat 1.2/1.3 | 3 µl | 0.35 mg/ml | 3 s | 0 | |
| TRPC4-8749 | C-Flat 1.2/1.3 | 3 ul | 0.35 mg/ml | 3s | 0 | |
| TRPC4-cam | QF 2/1 | 3 µl | 0.3 mg/ml | 3 s | 0 | |
| TRPC4-apo(LMNG) | C-Flat 1.2/1.3 | 3 µl | 0.4 mg/ml | 3 s | −3 | |
| 1.2 Imaging Conditions | ||||||
| Microscopy | TRPC4-apo | TRPC4-CaM | GFB-9289 | GFB-8438 | GFB-8749 | |
| Microscope | Titan Krios (X-FEG, Cs-corrected) | Titan Krios (X-FEG, Cs 2.7 mm) | ||||
| Voltage [kV] | 300 | 300 | ||||
| Defocus range [µm] | 0.65 to 3.02 | 0.38 to 3.48 | 0.68 to 3.64 | 0.35 to 3.52 | 0.86 to 3.82 | |
| Camera | K2 counting | K2 counting | K3 Super res. | K3 Super res. | K3 Super res. | |
| Pixel size [Å] | 0.85 | 0.85 | 0.455 /0.91a | 0.455/0.91a. | 0.455 /0.91a | |
| Total electron dose [e/Å2] | 88.7 | 88.2 | 65.45 | 66.58 | 72 | |
| Exposure time [s] | 10 | 10 | 3 | 3 | 3 | |
| Frames per movie | 50 | 80 | 60 | 60 | 60 | |
| Number of images | 2755 | 6937 | 2369 | 4444 | 1260 | |
| (3079) | (7972) | (2970) | (4676) | (1290) | ||
Table 2
Refinement and model validation statistics.
| Refinement statistics | |||||
|---|---|---|---|---|---|
| TRPC4-apo | TRPC4-CaM | GFB- 9289 | GFB-8438 | GFB-8749 | |
| Number of particles | |||||
| used in refinement | 126873 | 160829 | 65811 | 42524 | 44989 |
| Final resolution [Å] | 2.8 | 3.6 | 3.2 | 3.6 | 3.8 |
| Map sharpening factor [Å2] | -57.97 | -72.37 | -100 | -61.35 | -120 |
| Electron dose particles final refinement [e-/Å2] | Polished particles | Polished particles | Polished particles | Polished particles | 72 |
| Model geometry and validation statistics | |||||
| Atomic model composition | |||||
| Non-hydrogen atoms | 22,124 | 21,650 | 21,152 | 21,080 | 21,056 |
| Refinement (Phenix) | |||||
| RMSD bond | 0.008 | 0.011 | 0.008 | 0.007 | 0.011 |
| RMSD angle | 0.738 | 0.983 | 0.645 | 0.771 | 0.736 |
| Model-to-map fit, CC mask | 0.84 | 0.86 | 0.85 | 0.86 | 0.83 |
| Validation Ramachandran plot (%) | |||||
| Outliers | 0.0 | 0.04 | 0.0 | 0.0 | 0.0 |
| Allowed | 7.44 | 9.91 | 7.15 | 5.72 | 7.9 |
| favored | 92.56 | 90.05 | 92.85 | 94.28 | 91.94 |
| Rotamer outliers (%) | 0.51 | 0.09 | 8.99 | 0.35 | 0.18 |
| Molprobity score | 1.82 | 2.29 | 2.38 | 1.84 | 1.99 |
| EMRinger score | 3.04 | 1.61 | 2.67 | 2.28 | 2.75 |
Additional files
-
Supplementary file 1
Supplementary method for the synthesis of GFB-8749.
- https://cdn.elifesciences.org/articles/60603/elife-60603-supp1-v2.docx
-
Transparent reporting form
- https://cdn.elifesciences.org/articles/60603/elife-60603-transrepform-v2.docx
Download links
A two-part list of links to download the article, or parts of the article, in various formats.
Downloads (link to download the article as PDF)
Open citations (links to open the citations from this article in various online reference manager services)
Cite this article (links to download the citations from this article in formats compatible with various reference manager tools)
Structural basis of TRPC4 regulation by calmodulin and pharmacological agents
eLife 9:e60603.
https://doi.org/10.7554/eLife.60603


