BipA exerts temperature-dependent translational control of biofilm-associated colony morphology in Vibrio cholerae
- The laboratory for Molecular Infection Medicine Sweden (MIMS), Department of Molecular Biology, Umeå University, Sweden
- Howard Hughes Medical Institute, Brigham and Women's Hospital Division of Infectious Diseases and Harvard Medical School Department of Microbiology and Immunobiology, United States
- Genomics Core Facility, European Molecular Biology Laboratory (EMBL), Germany
- Department of Microbiology, The Ohio State University, United States
- Center for RNA Biology, The Ohio State University, United States
Figures
Figure 1
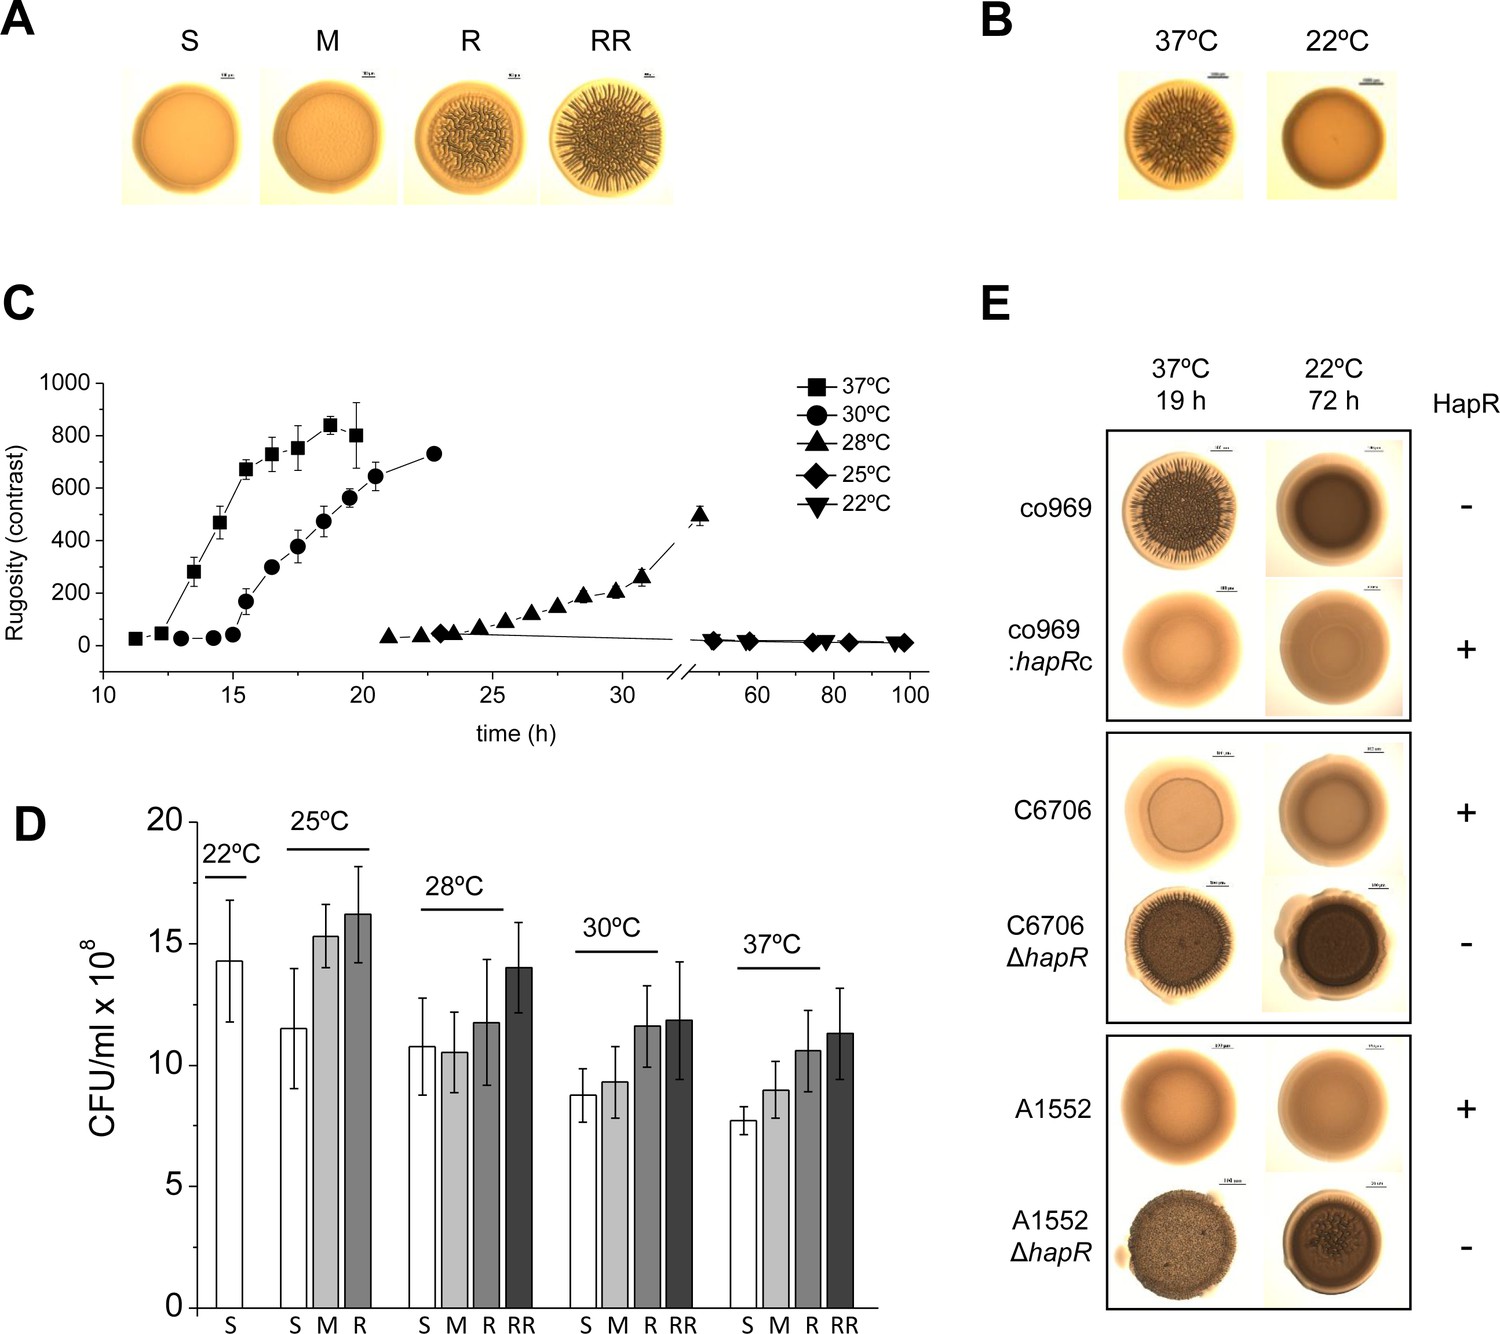
Development of Vibrio cholerae co969 colony rugosity is temperature- and HapR-dependent.
(A) Representative images of different V. cholerae co969 colony rugosities at 37°C: S (smooth), M (transition between smooth and rugose), R (rugose), and RR (very rugose). (B) Representative V. cholerae co969 colony morphologies at 37°C and 22°C, after incubation during 14 and 24 hr, respectively. (C) Development of V. cholerae co969 colony rugosity over time at different temperatures. Rugosity is represented as contrast calculated using ImageJ software (see Materials and methods section). Colonies grown at 22°C remained smooth despite the incubation time. (D) Colony-forming units (CFUs) of collected colonies grown at different temperatures and different rugosity stages: S (smooth), M (transition between smooth and rugose), R (rugose), and RR (very rugose). Values are the average of at least three independent experiments with at least three biological replicates each. Error bars, standard deviation. For 22°C, values are from smooth colonies after 48 hr incubation. (E) Colony morphology at 37°C and 22°C of co969, co969:hapRc (co969 strain carrying the active variant of hapR from C6706, hapRc), and C6706 and A1552 and their respective ΔhapR-mutant derivatives. The incubation times at different temperatures were previously optimized to result in colonies with a comparable number of CFU per colony.
Figure 2 with 1 supplement
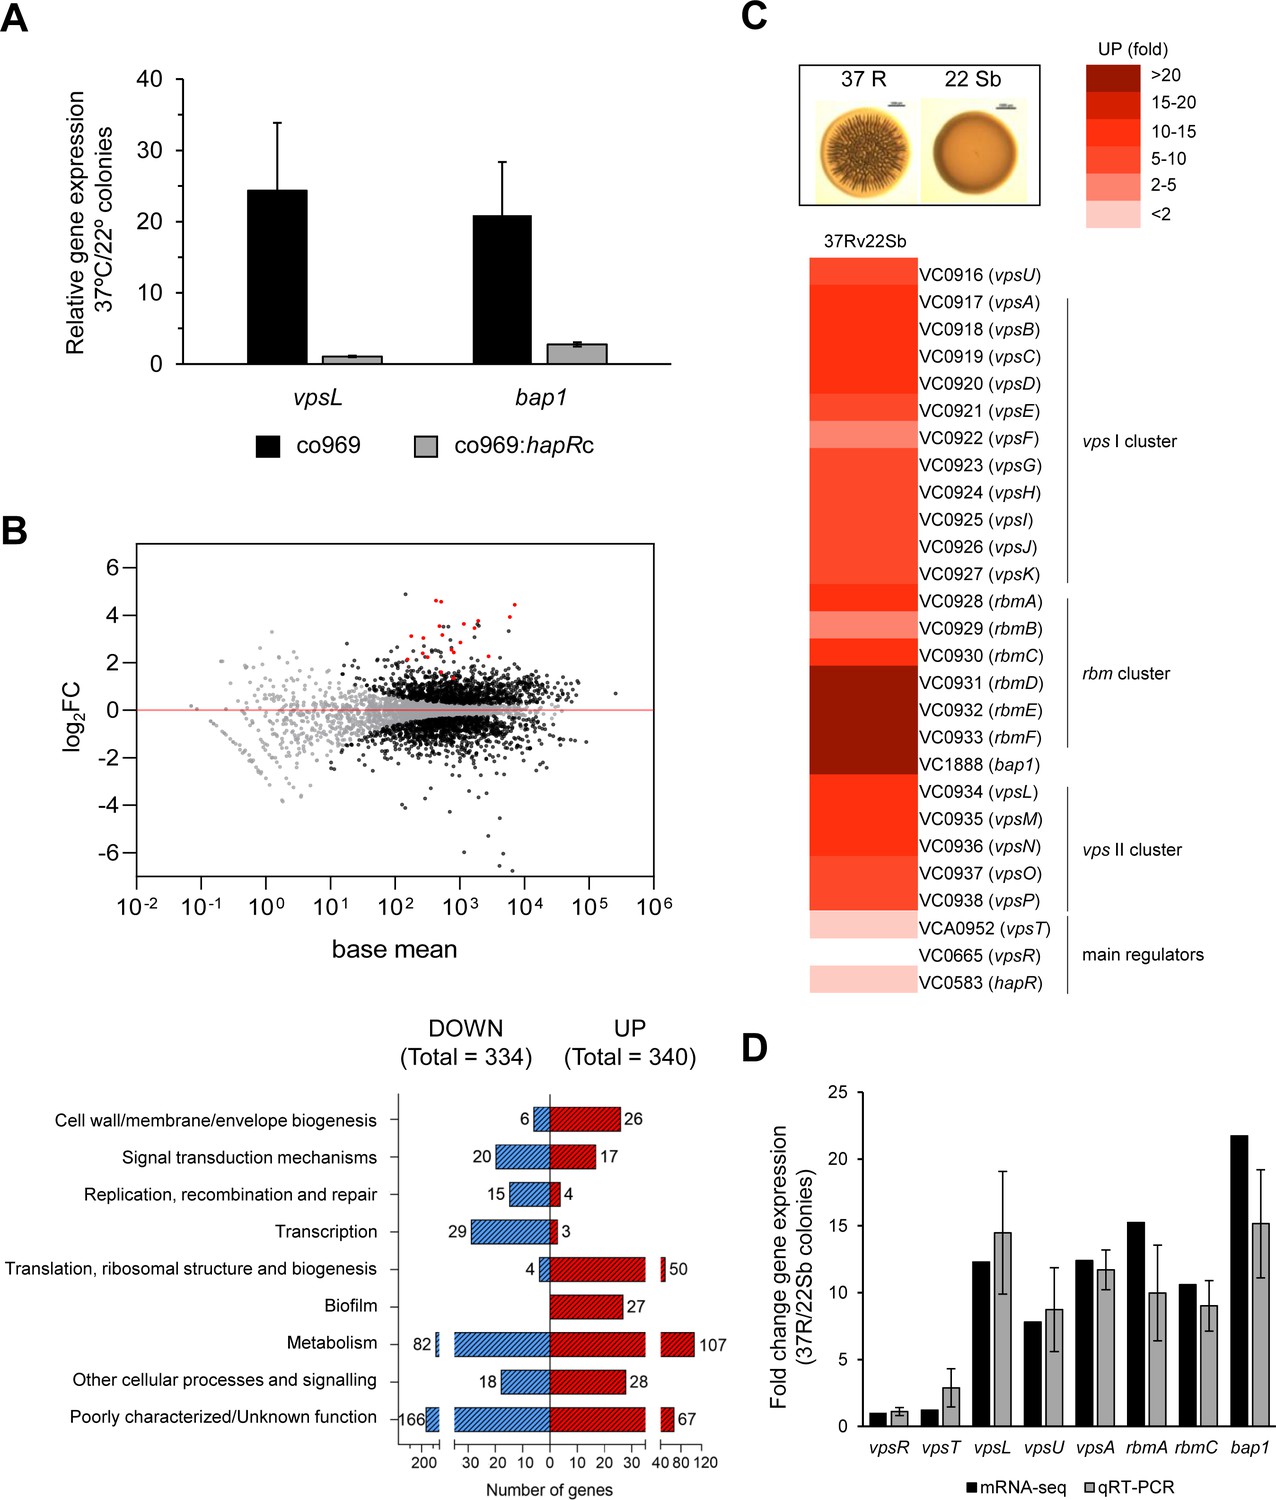
Biofilm structural components, but not regulators, are transcriptionally upregulated in rugose colonies grown at higher temperatures.
Comparison of relative gene expression between Vibrio cholerae co969 colonies incubated at 37°C (rugose, 37R) and 22°C (smooth, 22 Sb) by mRNA-seq. Colonies had a similar number of colony-forming units per colony, as described under experimental procedures. (A) Relative expression of vpsL and bap1 between colonies grown at 37°C vs. 22°C for co969 and co969:hapRc strains, determined by quantitative real-time polymerase chain reaction (qRT-PCR). Results are the average of three biological replicates, each replicate containing eight colonies. Error bars, standard deviation. Expression of hfq was used as a control. (B) Upper panel: MA-plot representing the log2FC against mean expression for differentially expressed genes between 37R vs. 22 Sb colonies. Black dots, significantly differentially expressed genes; gray dots, not significantly differentially expressed genes; red dots, genes encoding biofilm structural components (vpsI and vpsII clusters, rbmA, rbmC, and bap1). Lower panel: number of differentially expressed genes (up- and downregulated) between 37R vs. 22 Sb colonies, grouped by Clusters of Orthologous Groups of proteins (COGs) categories. (C) Heat map showing the differential relative expression (fold change) between 37R and 22 Sb of genes belonging to the vpsI, vpsII, and rbm clusters and bap1, encoding the Vibrio polysaccharide (VPS) and biofilm matrix proteins (RbmA, RbmC, and Bap1), respectively, and main biofilm regulators VpsT, VpsR, and HapR. (D) Validation of differential gene expression obtained by mRNA-seq by qRT-PCR. The graph represents a comparison of the relative gene expression in both the mRNA-seq analysis and qRT-PCR experiments of biofilm activators (vpsR and vpsT), genes encoding VPS (vpsL, vpsA, and vpsU) and matrix proteins (rbmA, rbmC, and bap1) between 37R and 22 Sb colonies. Values are the average of three independent qRT-PCR experiments containing three biological replicates each, each replicate containing eight colonies pooled together and three technical triplicates of each biological replicate. Error bars, standard deviation. Expression of gyrA was used as a control.
Figure 2—figure supplement 1
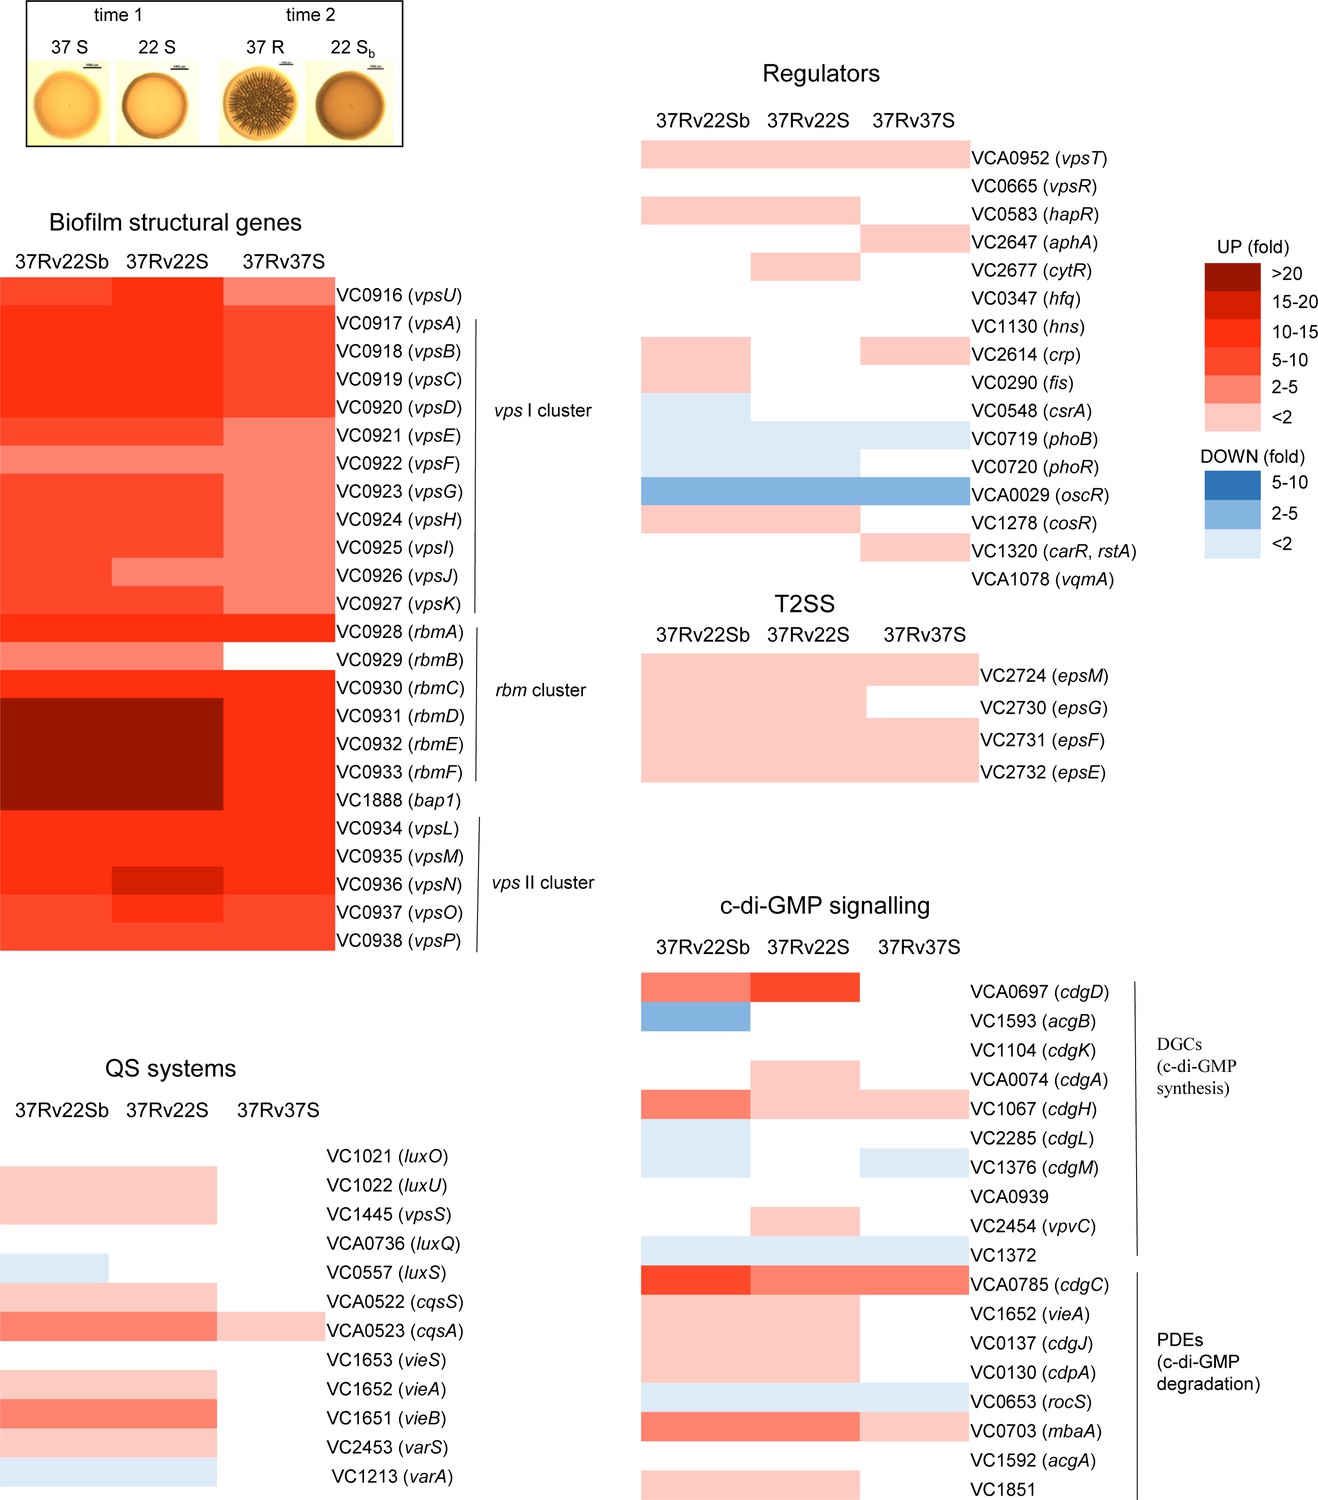
Differential expression of biofilm-related genes between colonies grown at 37°C and 22°C, and collected at two different time points, by mRNA-seq.
Smooth 37°C (37S) and 22°C (22S) colonies collected at time point 1 had the same number of colony-forming units (CFUs) per colony, while rugose 37°C (37R) and smooth 22°C (22 Sb) colonies collected at time point 2 had the same number of CFUs per colony. The heat maps show the differential relative expression (fold change) of biofilm-related genes between 37R vs. 22 Sb, 37R vs. 22S, and 37R vs. 37S colonies.
Figure 3
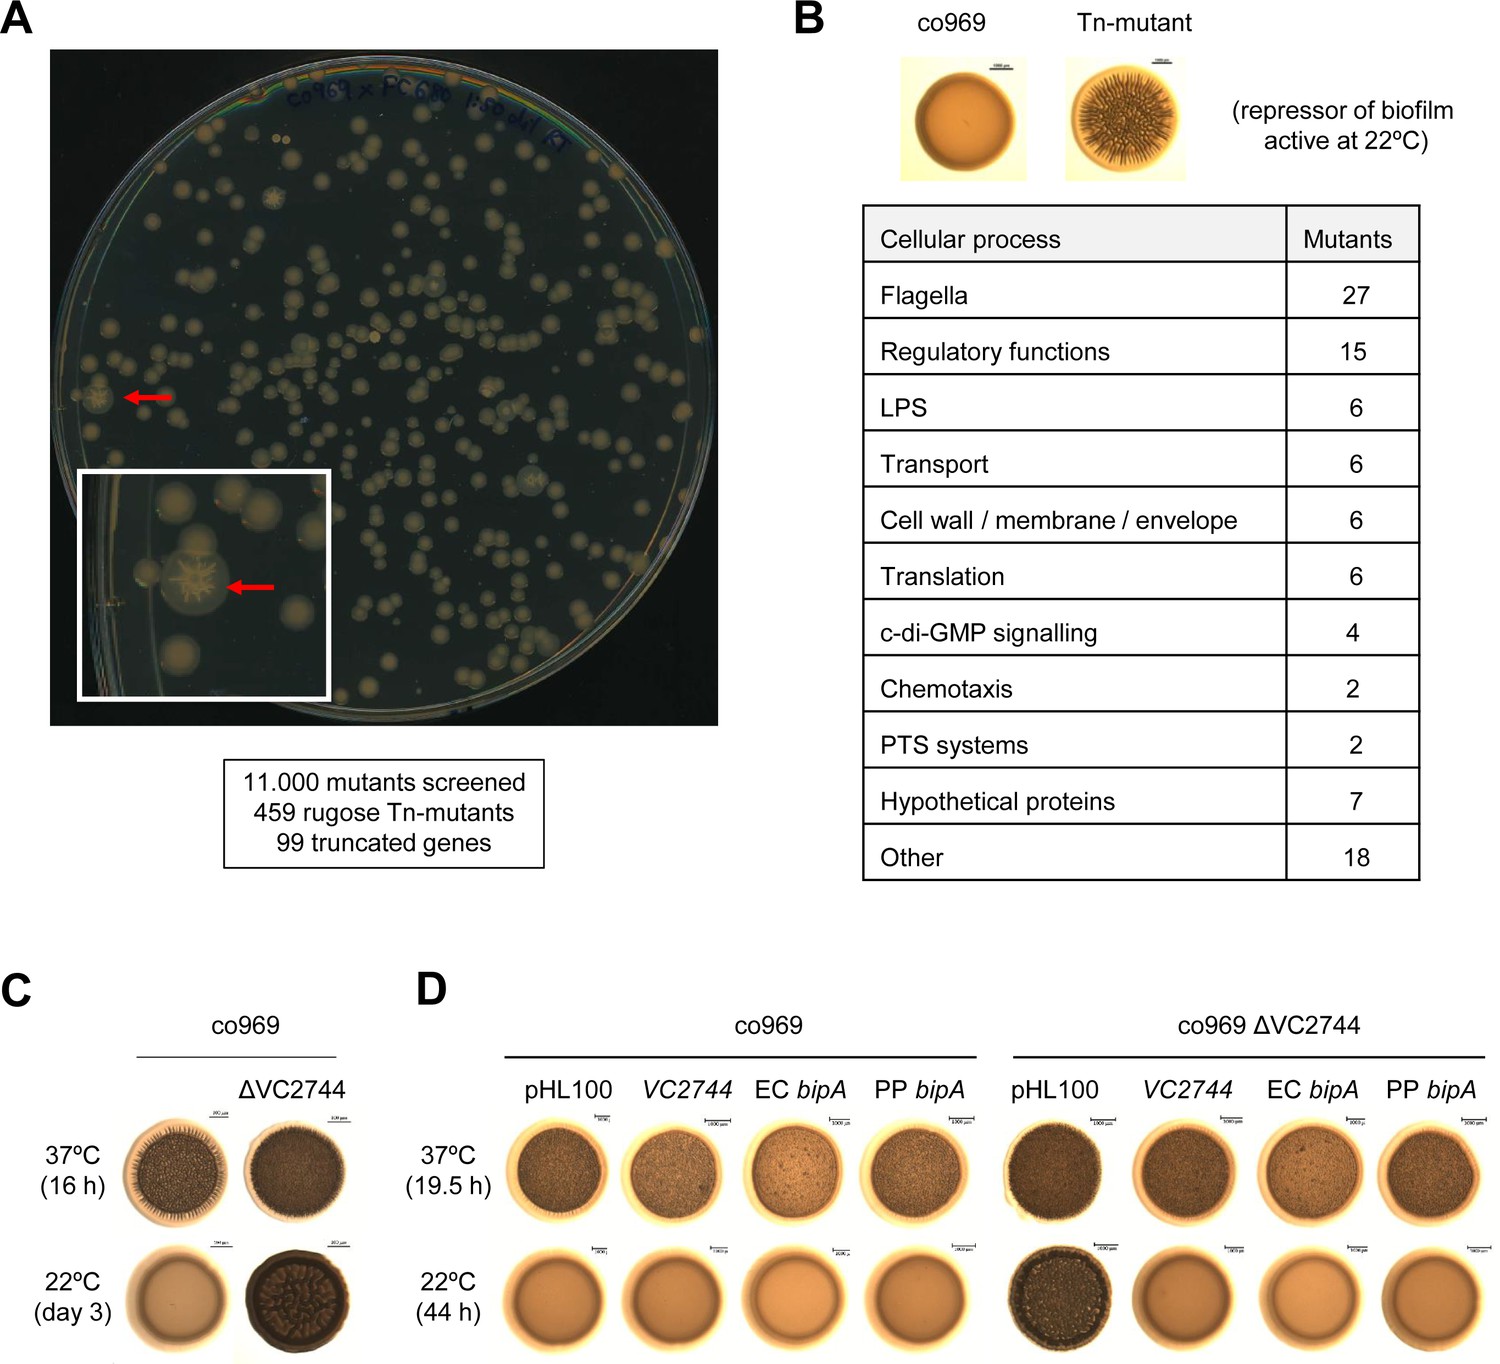
Transposon mutagenesis identifies VC2744 as a regulator of Vibrio cholerae colony morphology at 22°C.
(A) Representative image of an agar plate used for the selection of V. cholerae co969 transposon mutants with a rugose colony phenotype (pointed with red arrows) at 22°C. The number of screened transposon mutants, rugose colonies selected, and final number of genes with insertions leading to truncations is indicated below. (B) Table of transposon screen hits sorted by functional annotation. (C and D). Effect of VC2744 on co969 colony morphology. (C) Deletion of VC2744 in co969 results in a rugose colony phenotype at 22°C. (D) Colony morphology at 37°C and 22°C of co969 and co969 ΔVC2744 carrying either pHL100-bipA, for overexpression of V. cholerae co969 VC2744 from the isopropyl-β-d-thiogalactosidase-inducible Plac promoter, pHL100-ECbipA; or pHL100-PPbipA, for overexpression of the bipA variants of Escherichia coli MG1655 K-12 or Pseudomonas putida KT2440, respectively, or the empty plasmid (pHL100). Overexpression of the different BipA variants restored the smooth colony phenotype at 22°C, while it only resulted in slightly decreased rugosity at 37°C.
Figure 4
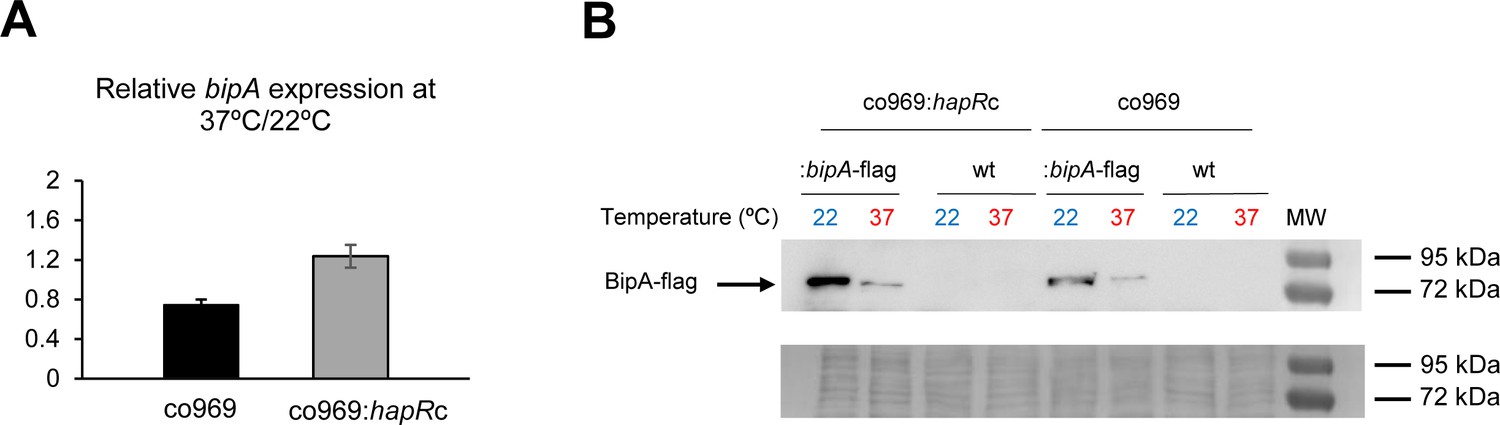
BipA protein levels are elevated at 22°C.
(A) Relative bipA transcript levels in Vibrio cholerae co969:bipA-flag or co969:hapRc:bipA-flag strains, carrying a chromosomal bipA-flag fusion, between rugose colonies grown at 37°C (37R) and smooth colonies grown at 22°C (22 Sb), determined by quantitative real-time polymerase chain reaction. Data are the average of three biological replicates, each containing eight colonies pooled together. Error bars, standard deviation. (B) Representative Western blot showing BipA-flag (68.18 KDa) protein levels of co969:bipA-flag or co969:hapRc:bipA-flag rugose colonies grown at 37°C (37R) and smooth colonies grown at 22°C (22 Sb). BipA-flag bands migrated close to the 72 KDa band of the protein ladder. co969 and co969:hapRc strains were used as negative controls. The Coomassie staining of the membrane, used as a loading control, is shown.
Figure 5
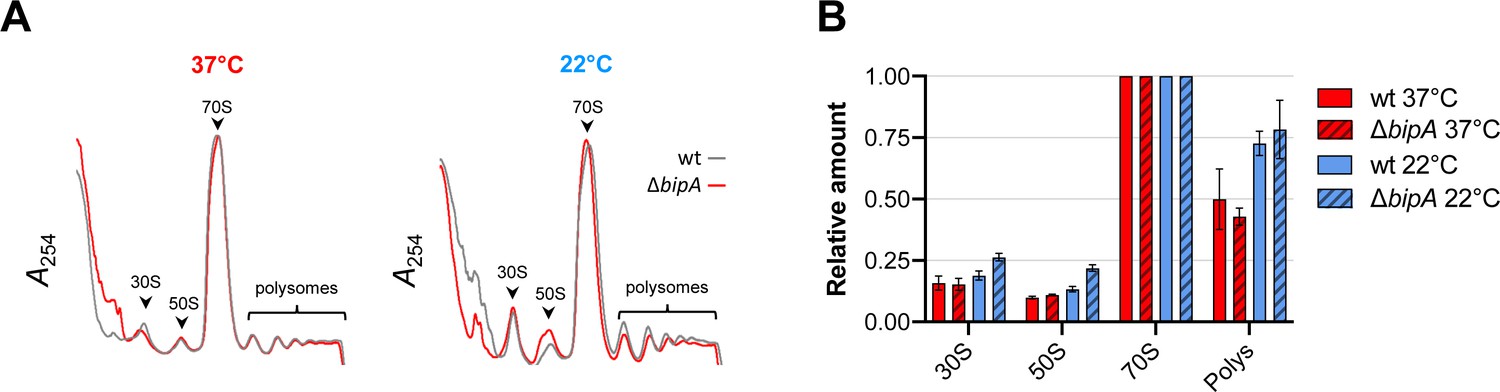
Ribosome assembly analyses in the wild-type and the bipA mutant.
(A) Representative traces of sucrose gradient sedimentation experiments, involving cells grown at 37°C or 22°C, as indicated. Absorbance at 254 nm (A254) is shown from the top to the bottom of the gradient (left to right), and peaks corresponding to 30S, 50S, 70S, and polysomes (multiple ribosomes per mRNA) are indicated. (B) Levels of 30S particles (30S), 50S particles (50S), and polysomes (Polys), normalized with respect to 70S monosomes (70S), from various cells as indicated.
Figure 6 with 1 supplement
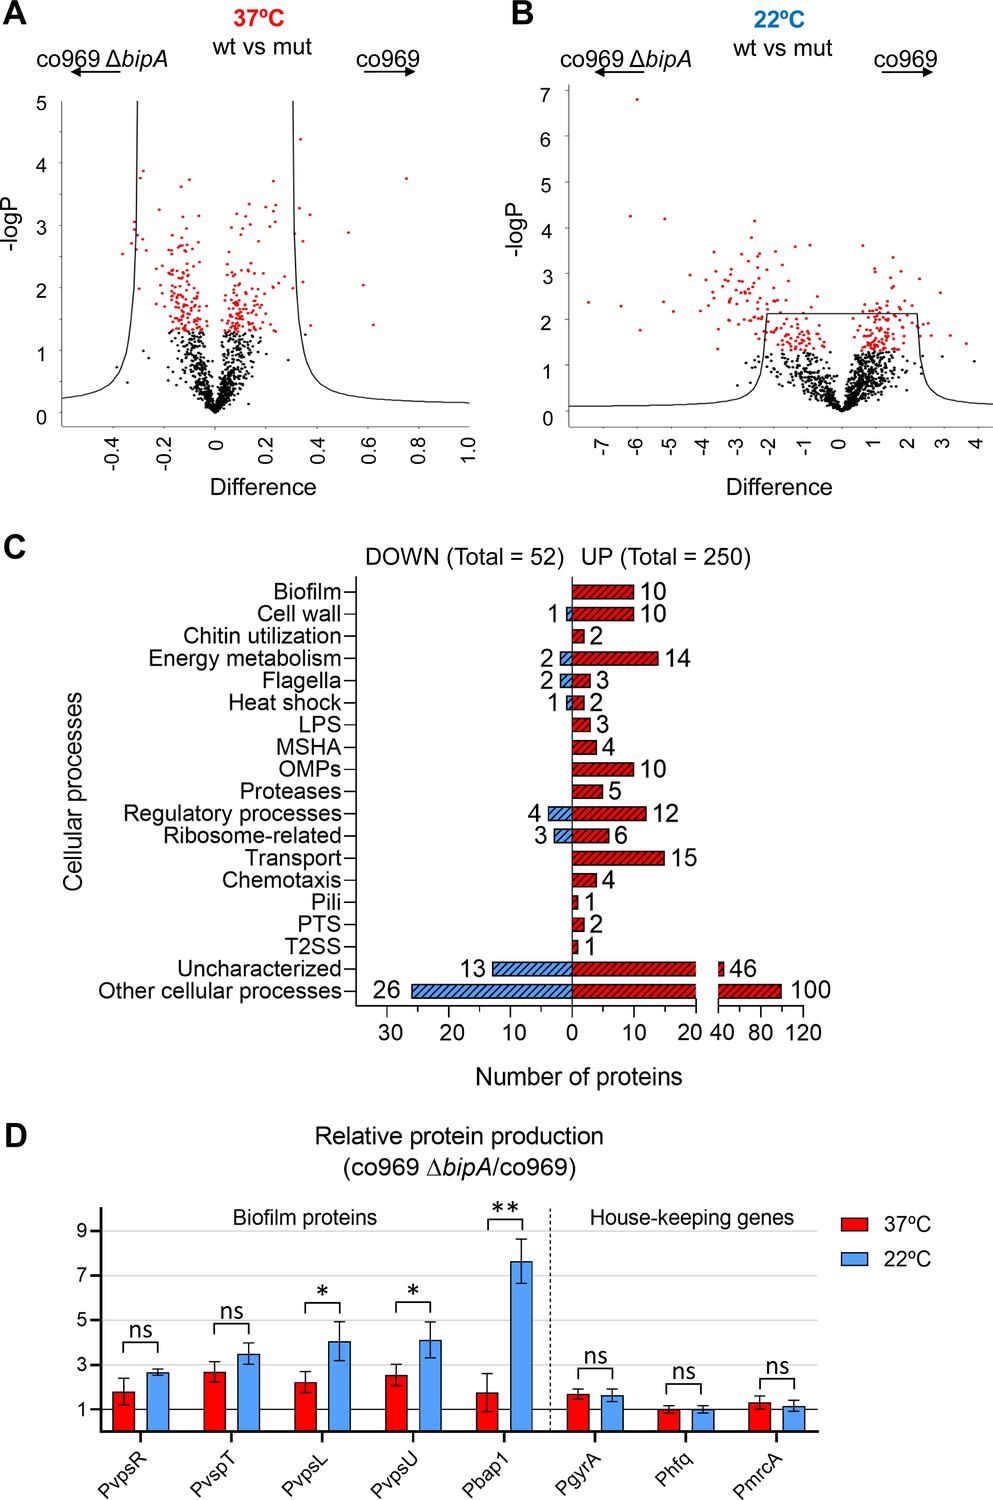
Global proteomic analysis of Vibrio .
cholerae co969 wild-type (WT) vs. ΔbipA colonies grown at 37°C and 22°C. (A and B) Volcano plots representing the log t-test p-value against the t-test difference for a comparison of protein levels between co969 WT vs. ΔbipA colonies grown at either 37°C (A) or 22°C (B). Black dots represent proteins belonging to the pool of non-differentially produced proteins between the WT and the ΔbipA strain; red dots represent proteins that are significantly different between both strains at the given condition. Higher numbers of t-test difference and log t-test p-value indicate more differentially produced proteins. (C) Differentially produced proteins between co969 WT vs. ΔbipA colonies at 22°C grouped by function. (D) Relative translation of biofilm-related and control proteins between co969 ΔbipA and co969 strains, as measured by translational lacZ fusions in colonies grown at 37°C (red) or at 22°C (blue). Relative Miller activity in β-galactosidase assays was calculated from the average of two independent experiments containing three biological replicates each, each replicate containing four colonies. Error bars, standard deviation. t-test: *p<0.05; **p<0.01; ns: not significant.
Figure 6—figure supplement 1
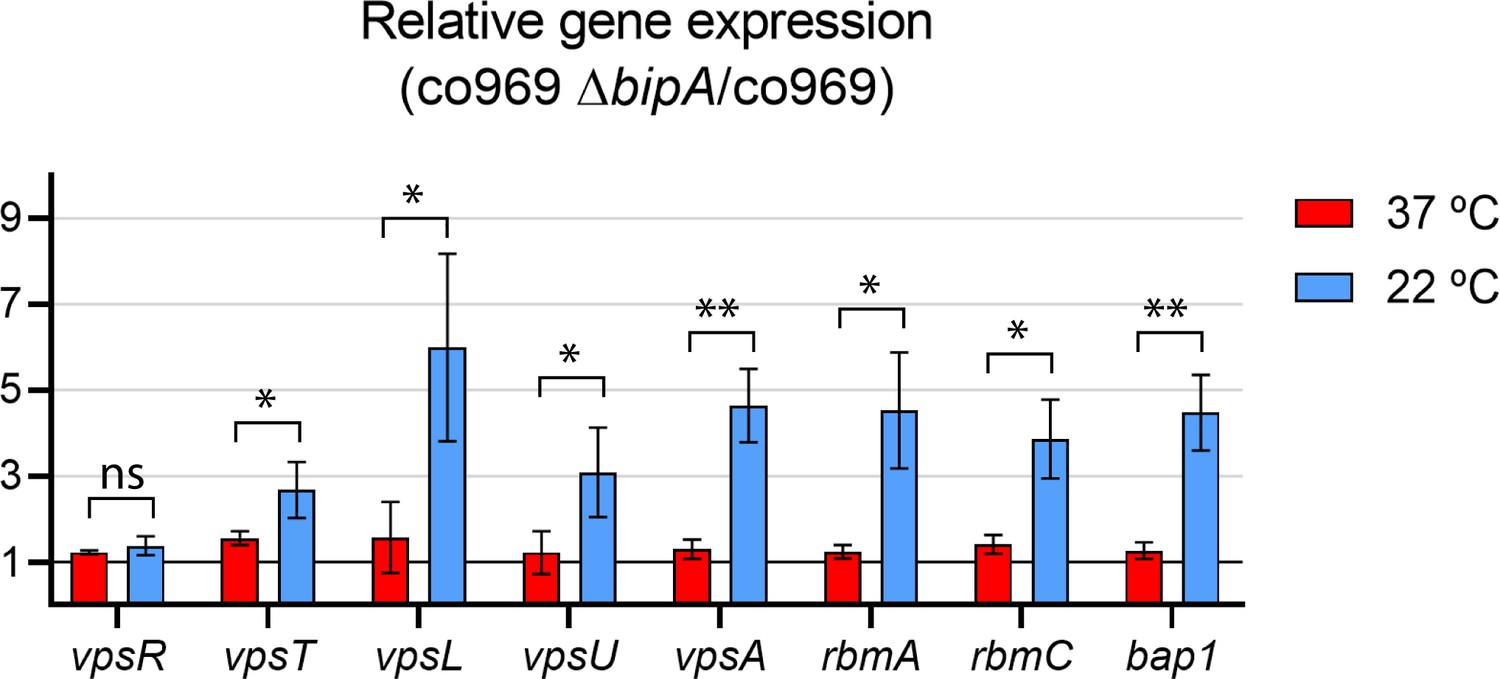
Effect of BipA on expression of biofilm-related genes.
Relative expression between co969 ΔbipA and co969 strains of genes encoding the transcriptional regulators (vpsR and vpsT), exopolysaccharide (vpsL, vpsU, vpsA), and the biofilm matrix proteins (rbmA, rbmC, bap1) in rugose colonies grown at 37°C (red) or smooth colonies grown at 22°C (blue), determined by quantitative real-time polymerase chain reaction. t-test: *p<0.05; **p<0.01; ns: not significant.
Figure 7
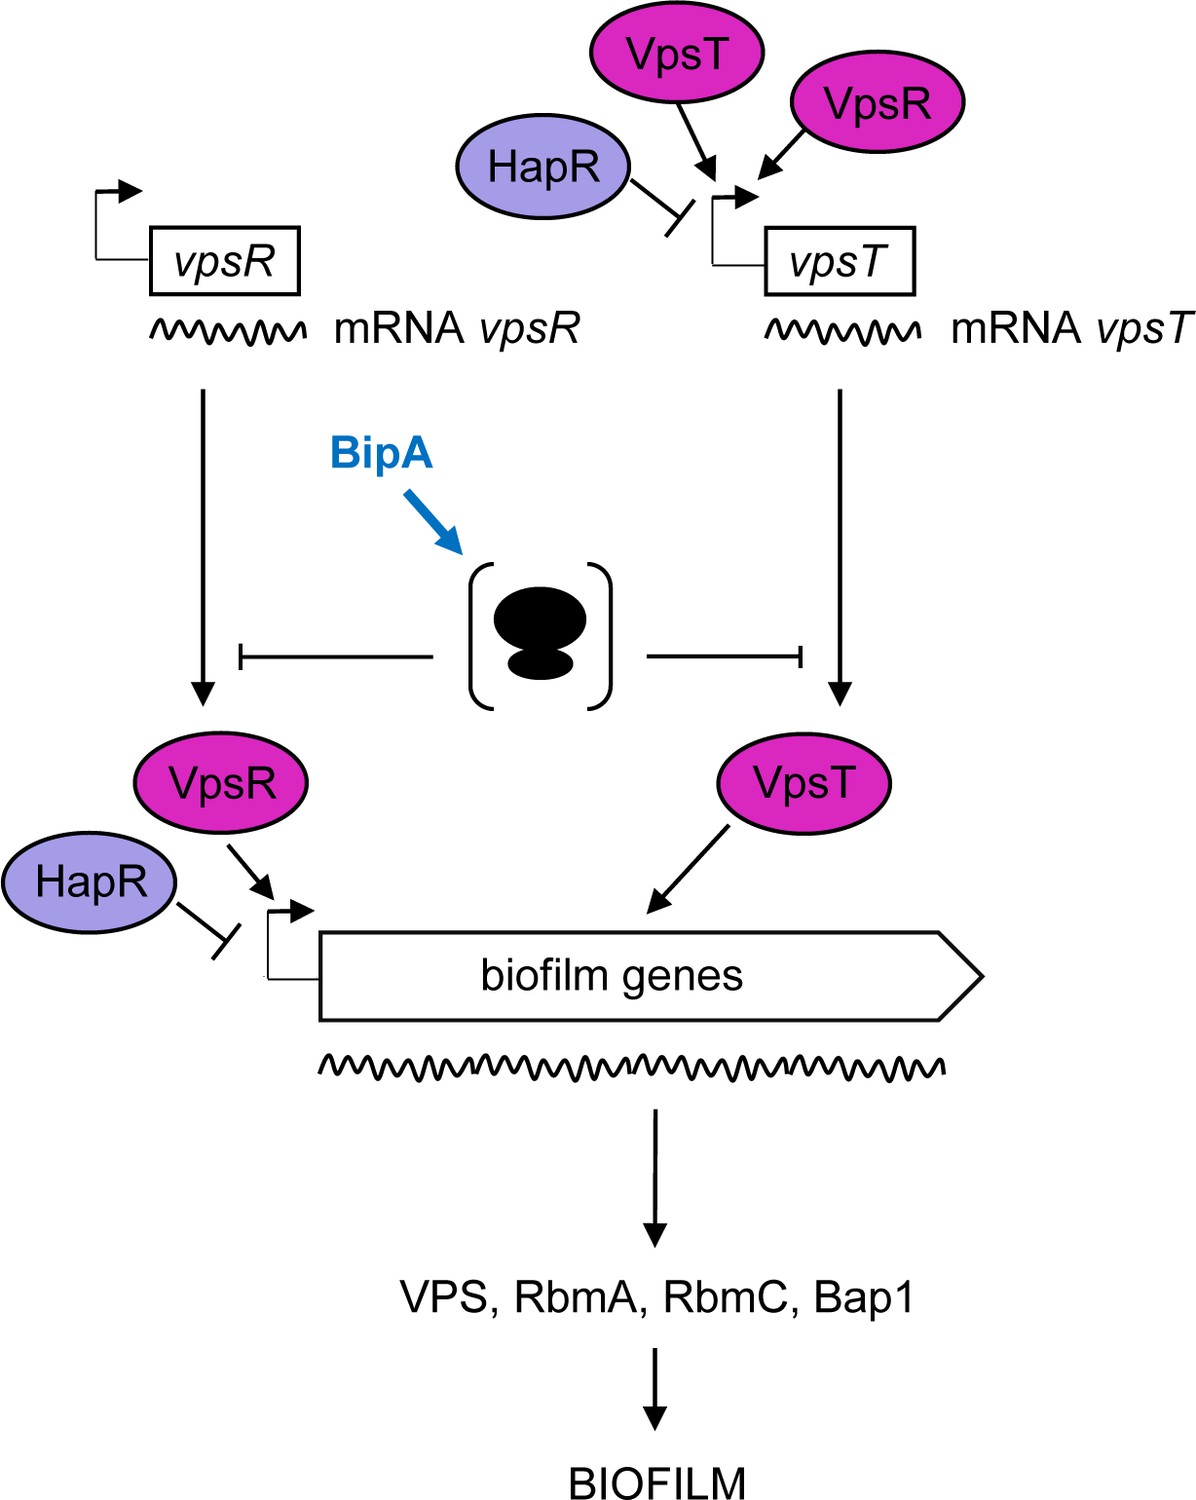
Proposed model for BipA within the Vibrio cholerae biofilm regulatory cascade.
Schematic showing the proposed model for the interplay between the main biofilm transcriptional regulators, VpsR, VpsT, and HapR, and the translational repressor, BipA. In HapR− strains, transcription of vpsR and vpsT and the biofilm genes (vpsI and vpsII clusters encoding the Vibrio polysaccharide [VPS], and rbmA, rmbC, and bap1 encoding the matrix proteins) leads to biofilm formation at 37°C but not at 22°C, where high levels of BipA inhibit translation of the mRNAs of the biofilm activators and/or structural genes. In HapR+ strains, transcription of both the biofilm activators and the biofilm genes is negatively regulated by HapR, and no biofilm is produced (i.e. a smooth colony forms). At 22°C, BipA constitutes an additional layer of control by ensuring that, even if residual levels of biofilm-associated transcripts are produced, their translation would be inhibited.
Author response image 1
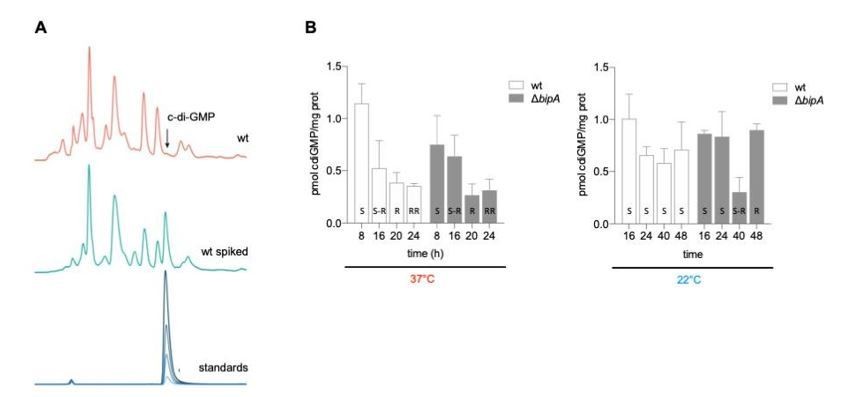
c-di-GMP quantification in V. cholerae WT and ΔbipA mutant at different temperatures.
A) Representative HPLC chromatograms of V. cholerae soluble nucleotide profiles. The peak corresponding to c-di-GMP peak is marked with an arrow and elutes with similar retention time as the commercial c-di-GMP standard used as control. B) Relative amount of c-di-GMP normalized to total protein content in V. cholerae co969 and ΔbipA mutant colonies incubated at 37°C and 22°C at different timepoints.
Author response image 2
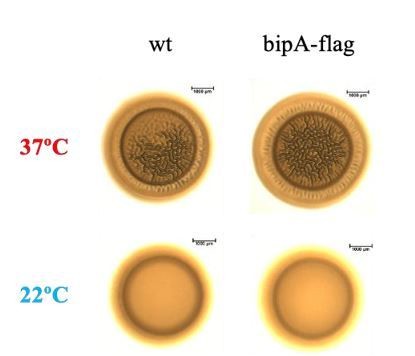
Colony morphology of BipA-FLAG derivative.
Additional files
-
Supplementary file 1
Supplementary figures 1–6.
- https://cdn.elifesciences.org/articles/60607/elife-60607-supp1-v1.docx
-
Supplementary file 2
Supplementary tables 1-3: strains, plasmids and primers used in this study.
- https://cdn.elifesciences.org/articles/60607/elife-60607-supp2-v1.docx
-
Supplementary file 3
RNA-seq.
- https://cdn.elifesciences.org/articles/60607/elife-60607-supp3-v1.xlsx
-
Supplementary file 4
RNA-seq – biofilm-related genes.
- https://cdn.elifesciences.org/articles/60607/elife-60607-supp4-v1.xlsx
-
Supplementary file 5
Transposon mutagenesis Vc co969 rugose colonies at 22°C.
- https://cdn.elifesciences.org/articles/60607/elife-60607-supp5-v1.xlsx
-
Supplementary file 6
Transposon mutagenesis Vc C6706 rugose colonies at 37°C.
- https://cdn.elifesciences.org/articles/60607/elife-60607-supp6-v1.xlsx
-
Supplementary file 7
Transposon mutagenesis Vc co969 smooth colonies at 37°C.
- https://cdn.elifesciences.org/articles/60607/elife-60607-supp7-v1.xlsx
-
Supplementary file 8
Proteomic raw data and analysis.
- https://cdn.elifesciences.org/articles/60607/elife-60607-supp8-v1.xlsx
-
Transparent reporting form
- https://cdn.elifesciences.org/articles/60607/elife-60607-transrepform-v1.docx
Download links
A two-part list of links to download the article, or parts of the article, in various formats.
Downloads (link to download the article as PDF)
Open citations (links to open the citations from this article in various online reference manager services)
Cite this article (links to download the citations from this article in formats compatible with various reference manager tools)
BipA exerts temperature-dependent translational control of biofilm-associated colony morphology in Vibrio cholerae
eLife 10:e60607.
https://doi.org/10.7554/eLife.60607


