PARP1 inhibitors trigger innate immunity via PARP1 trapping-induced DNA damage response
- Department of Biochemistry, University of Texas Southwestern Medical Center, United States
Figures
Figure 1 with 2 supplements
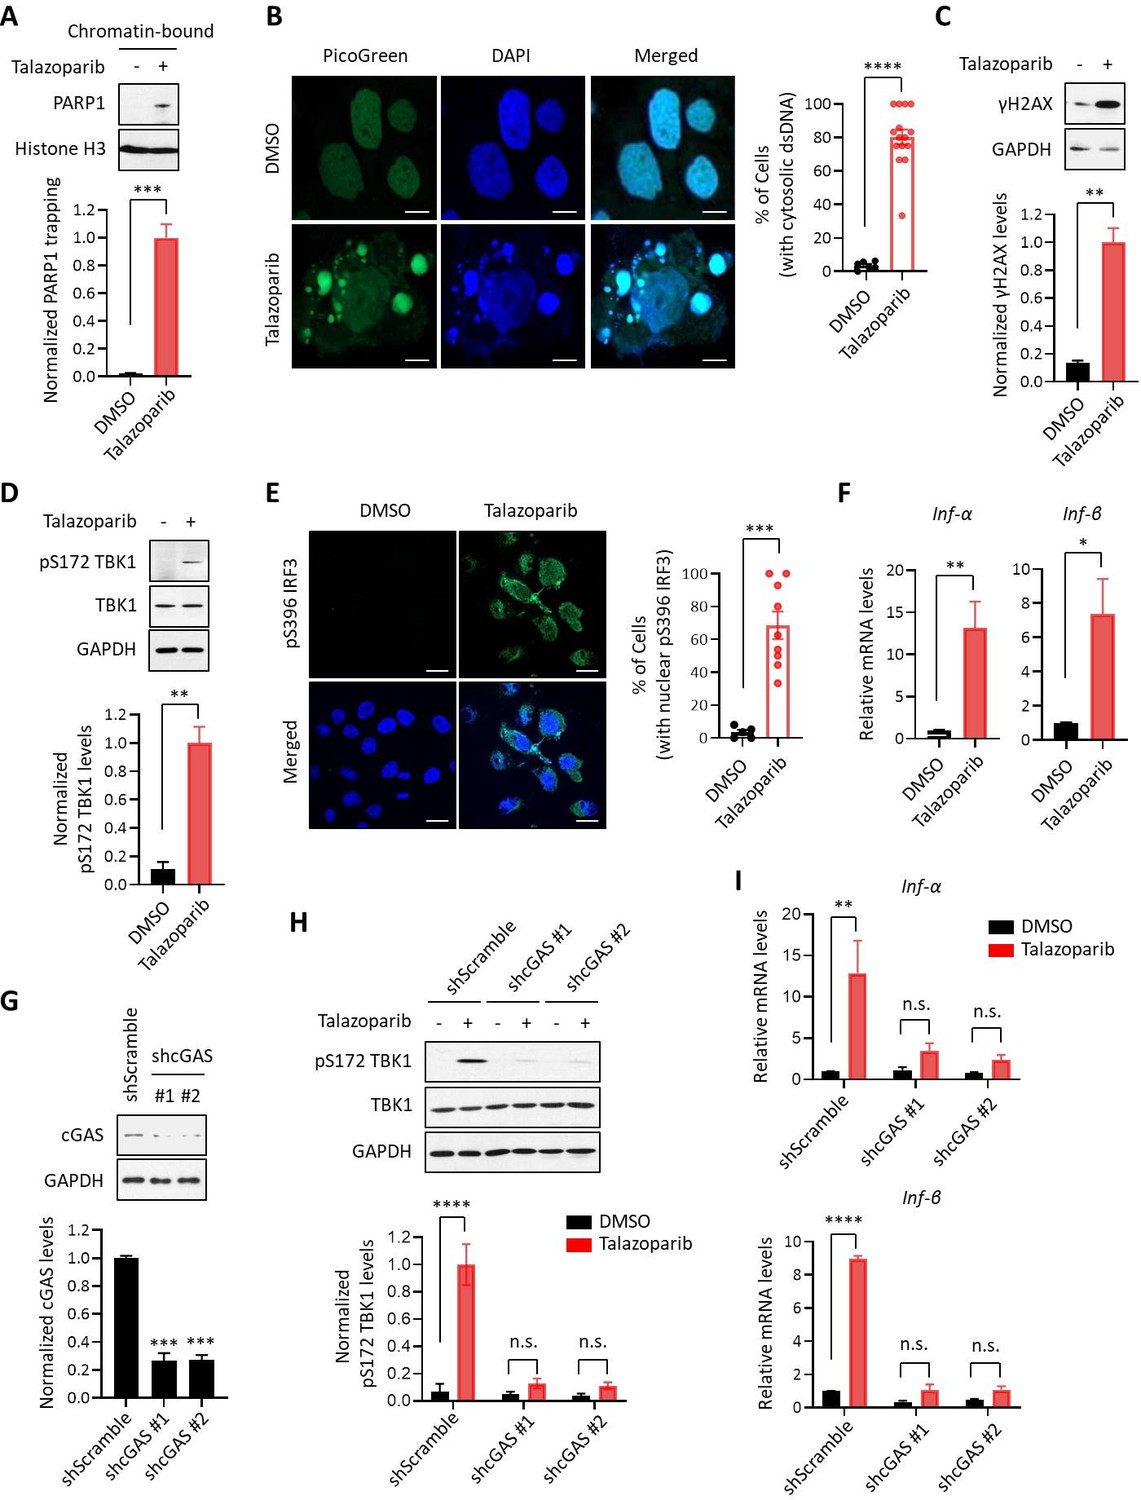
PARPi induces the innate immune response via the cGAS-STING pathway.
(A) The level of trapped PARP1 in HeLa cells treated with or without Talazoparib (10 µM for 72 hr). Top, chromatin-bound fractions were isolated and were probed using the indicated antibodies. Histone H3 was used as the loading control. Bottom, the graph shows the quantification of the level of PARP1 trapping. Values were presented as means ± SD from three biological replicates. Significance was determined with unpaired Student’s t-test. ***p < 0.001. (B) Staining of cytosolic dsDNA in HeLa cells treated with or without Talazoparib (10 µM for 72 hr). Left, representative image of PicoGreen (green) staining. DAPI (blue) was used to visualize the nucleus. Scale bars represent 10 μm. Right, the graph shows the quantification of the number of cells with cytosolic dsDNA. Values were presented as means ± SEM from three biological replicates (n = 3 fields,≥100 cells counted per condition). Significance was determined with unpaired Student’s t-test. ****p < 0.0001. (C) The extent of DNA damage in HeLa cells treated with or without Talazoparib (10 µM for 72 hr). Top, whole cell lysates were probed using the indicated antibodies. Bottom, the graph shows the quantification of γH2AX levels. Values were presented as means ± SD from three biological replicates. Significance was determined with unpaired Student’s t-test. **p < 0.01. (D) The level of pS172 TBK1 in HeLa cells treated with or without Talazoparib (10 µM for 72 hr). Top, whole cell lysates were probed using the indicated antibodies. Bottom, the graph shows the quantification of pS172 TBK1 levels. Values were presented as means ± SD from three biological replicates. Significance was determined with unpaired Student’s t-test. **p < 0.01. (E) The level of pS396 IRF3 in HeLa cells treated with or without Talazoparib (10 µM for 72 hr). Left, representative image of pS396 IRF3 levels (green). DAPI (blue) was used to visualize the nucleus. Scale bars represent 20 μm. Right, the graph shows the quantification of the number of cells stained positive for pS396 IRF3 in nucleus. Values were presented as means ± SEM from three biological replicates (n = 3 fields,≥100 cells counted per condition). Significance was determined with unpaired Student’s t-test. ***p < 0.001. (F) RT-qPCR of type I interferons levels in HeLa cells treated with or without Talazoparib (10 µM for 72 hr). Values of Inf-α and Inf-β were presented as means ± SEM from three biological replicates. Significance was determined with unpaired Student’s t-test. *p < 0.05, **p < 0.01. (G) Knock-down of cGAS. HeLa cells expressing the control shRNA (shScramble) or shcGAS (shcGAS #1 or #2) were probed using the indicated antibodies. Right, the graph shows the ratio of cGAS depletion. Values were presented as means ± SD from three biological replicates. Significance was determined with one-way ANOVA. ***p < 0.001. (H) Depletion of cGAS abolishes PARPi-induced activation of innate immune signaling. HeLa cells expressing shRNA against control (shScramble) or cGAS (shcGAS #1 or #2) were treated with or without Talazoparib (10 µM for 72 hr). The cells were lysed and were immunoblotted using the indicated antibodies. Values were presented as means ± SD from three biological replicates. Significance was determined with two-way ANOVA. ****p < 0.0001, n.s., not significant. (I) RT-qPCR analyses of type I interferons. HeLa cells expressing shRNA against control (shScramble) or cGAS (shcGAS #1 or #2) were treated with or without Talazoparib (10 µM for 72 hr). Values of Inf-α and Inf-β mRNA levels were presented as means ± SEM from three biological replicates. Significance was determined with unpaired Student’s t-test. ****p < 0.0001, n.s., not significant.
Figure 1—figure supplement 1
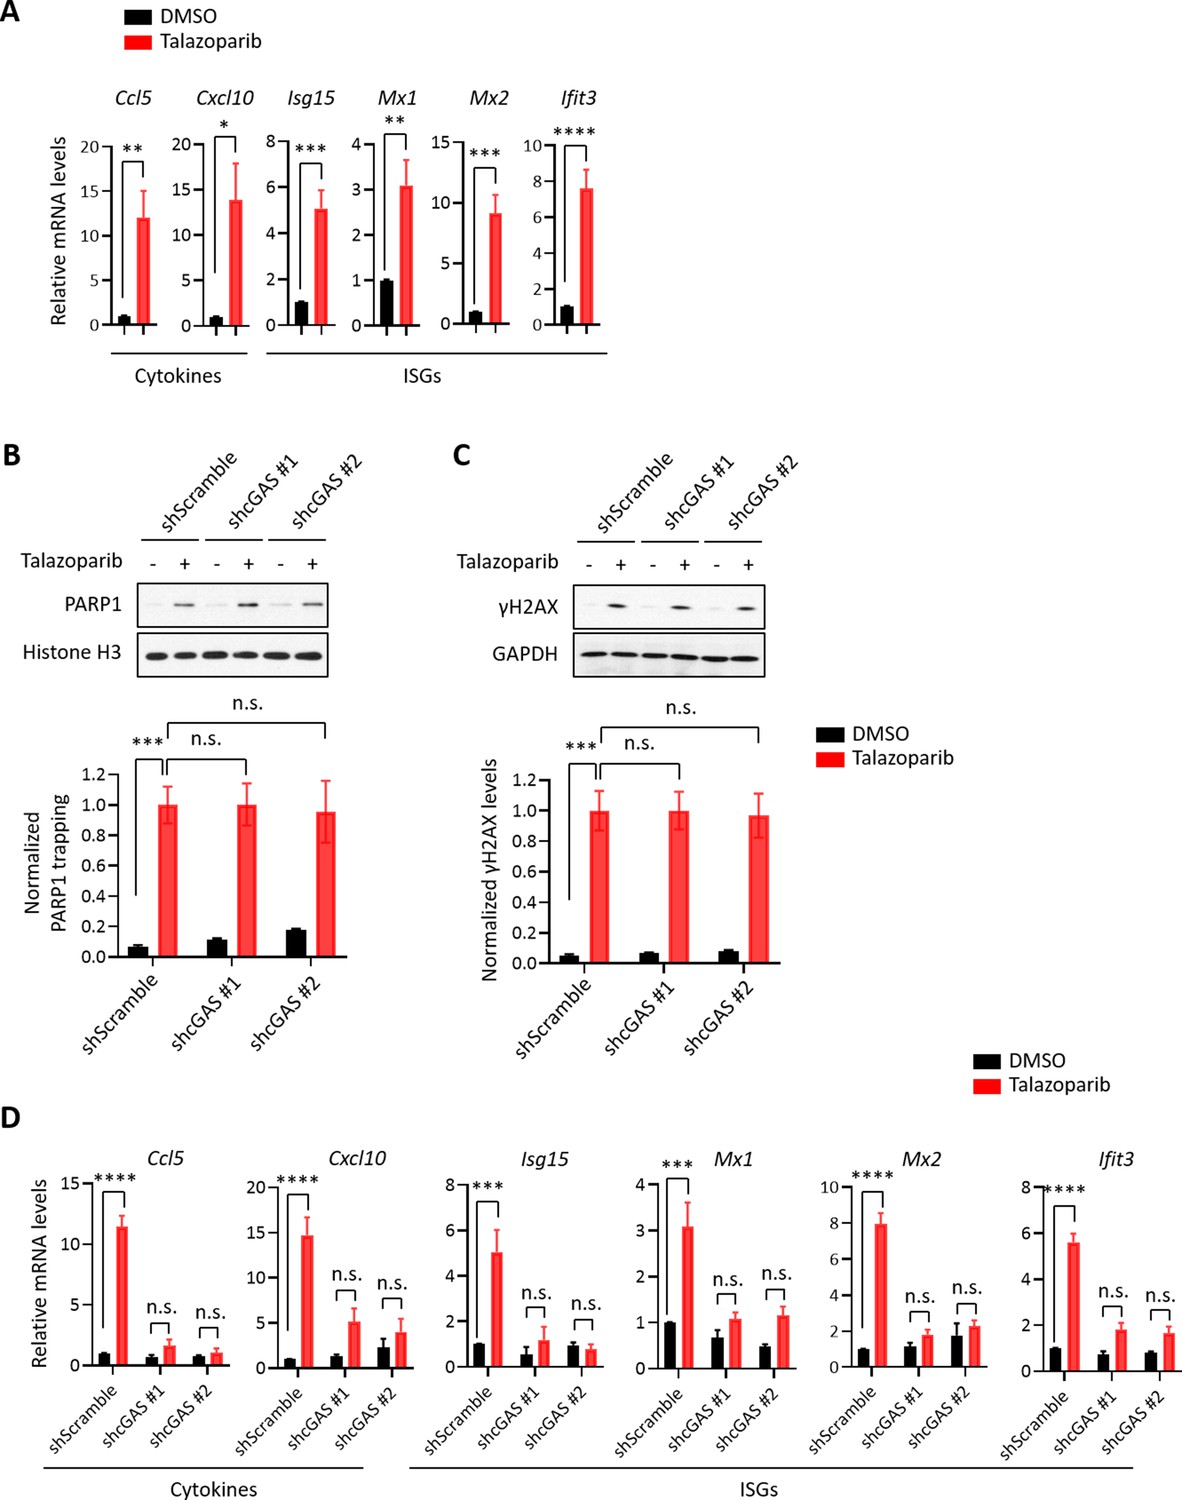
Proteomic profiling of PARPi-induced innate immune response (Part 1).
(A) RT-qPCR analyses of cGAS-STING target gene expression in HeLa cells treated with or without Talazoparib (10 µM for 72 hr). Values of cytokines and ISGs mRNA levels were presented as means ± SEM from three biological replicates. Significance was determined with unpaired Student’s t-test. *p < 0.05, **p < 0.01, ***p < 0.001, ****p < 0.0001. (B) The levels of trapped PARP1 in HeLa cells expressing shRNA against control (shScramble) or cGAS (shcGAS #1 or #2) that were treated with or without Talazoparib (10 µM for 72 hr). Top, chromatin-bound fractions were isolated and were probed using the indicated antibodies. Histone H3 was used as the loading control. Bottom, the graph shows the quantification of the levels of PARP1 trapping. Values were presented as means ± SD from three biological replicates. Significance was determined with two-way ANOVA. ***p < 0.001, n.s., not significant. (C) The extent of DNA damage in HeLa cells expressing shRNA against control (shScramble) or cGAS (shcGAS #1 or #2) that were treated with or without Talazoparib (10 µM for 72 hr). Top, whole cell lysates were probed using the indicated antibodies. Bottom, the graph shows the quantification of γH2AX levels. Values were presented as means ± SD from three biological replicates. Significance was determined with two-way ANOVA. ***p < 0.001, n.s., not significant. (D) RT-qPCR analyses of cGAS-STING target gene expression in HeLa cells expressing shRNA against control (shScramble) or cGAS (shcGAS #1 or #2) that were treated with or without Talazoparib (10 µM for 72 hr). Values of cytokines and ISGs mRNA levels were presented as means ± SEM from three biological replicates. Significance was determined with two-way ANOVA. ***p < 0.001, ****p < 0.0001, n.s., not significant.
Figure 1—figure supplement 2
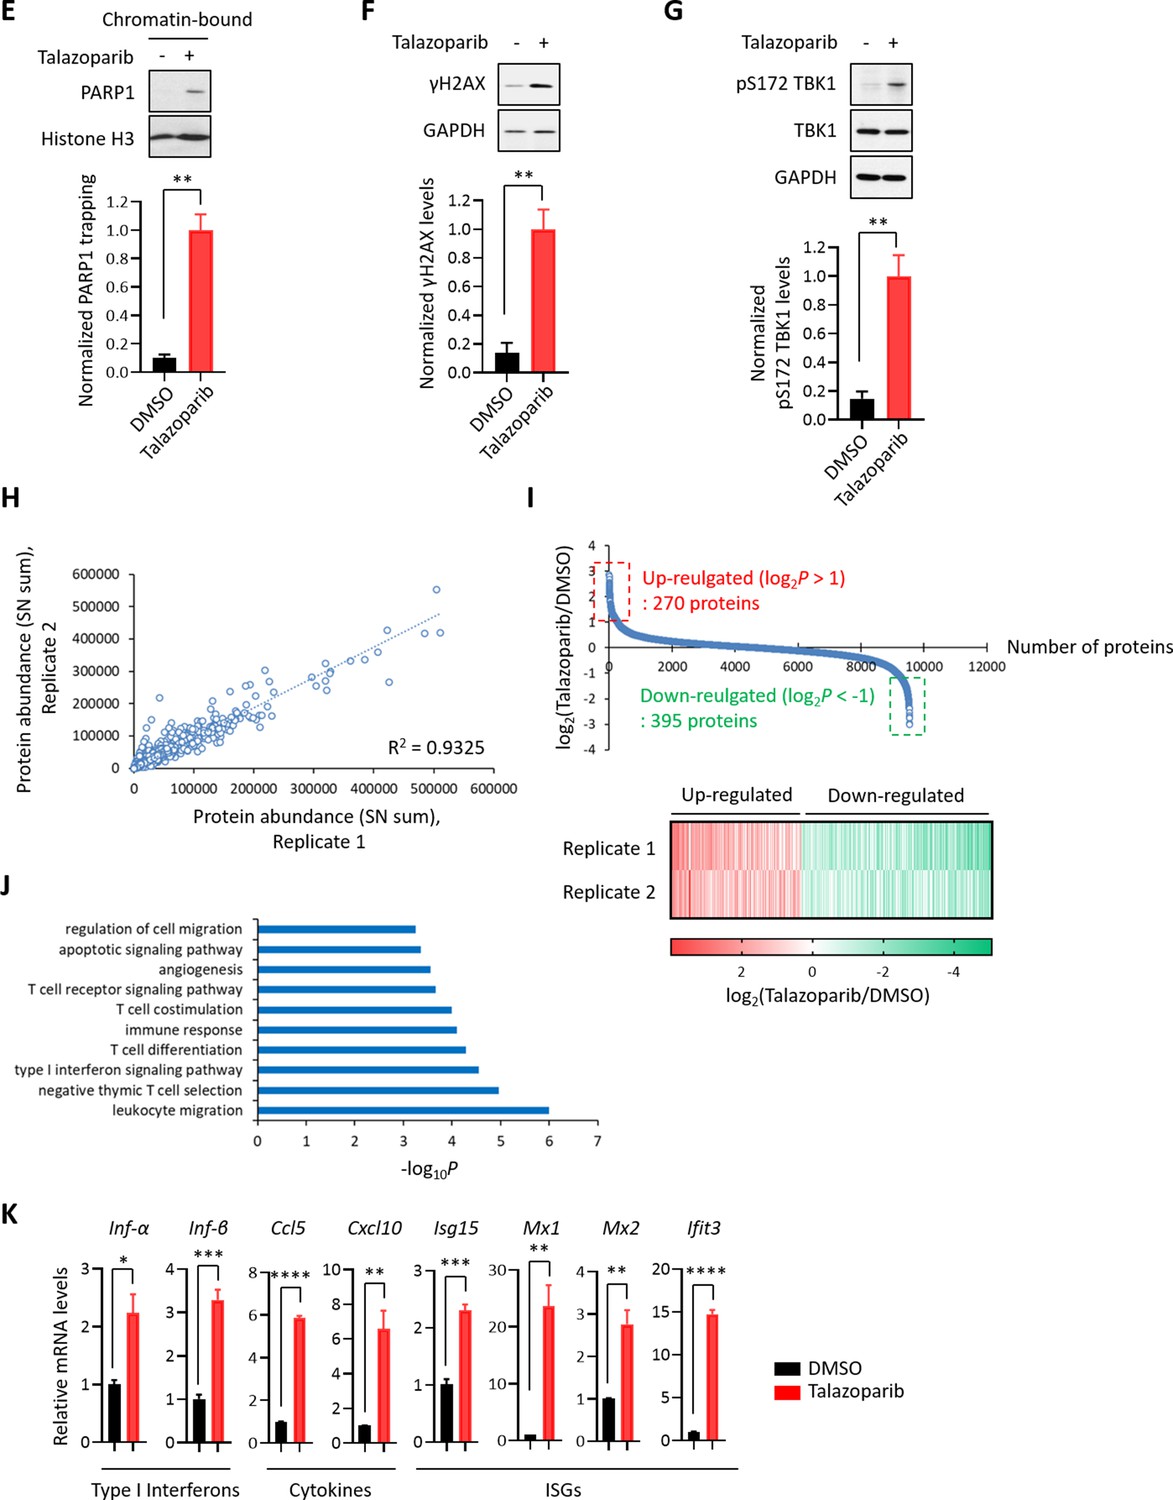
Proteomic profiling of PARPi-induced innate immune response (Part 2).
(E) The levels of trapped PARP1 in MHH-ES-1 cells treated with or without Talazoparib (1 µM for 24 hr). Top, chromatin-bound fractions were isolated and were probed using the indicated antibodies. Histone H3 was used as the loading control. Bottom, the graph shows the quantification of the level of PARP1 trapping. Values were presented as means ± SD from three biological replicates. Significance was determined with unpaired Student’s t-test. **p < 0.01. (F) The extent of DNA damage in MHH-ES-1 cells treated with or without Talazoparib (1 µM for 24 hr). Top, whole cell lysates were probed using the indicated antibodies. Bottom, the graph shows the quantification of γH2AX levels. Values were presented as means ± SD from three biological replicates. Significance was determined with unpaired Student’s t-test. **p < 0.01. (G) The level of pS172 TBK1 in MHH-ES-1 cells treated with or without Talazoparib (1 µM for 24 hr). Top, whole cell lysates were probed using the indicated antibodies. Bottom, the graph shows the quantification of pS172 TBK1 levels. Values were presented as means ± SD from three biological replicates. Significance was determined with unpaired Student’s t-test. **p < 0.01. (H) Reproducibility of the TMT experiments. The signal-to-noise (SN) values of the corresponding TMT channels for each protein was extracted from the two biological replicate experiments. (I) Quantification of protein expression in MHH-ES-1 cells treated with Talazoparib 1 µM for 24 hr (Supplementary file 1). Top, the graph shows the log2 value of total protein expression in Talazoparib-treated vs. DMSO control. Bottom, the heatmap shows quantification reproducibility of the up- and down-regulated protein. Red: up-regulated proteins; Green: down-regulated proteins. (J) GO analysis of the up-regulated proteins as shown in (I). The list shows the top 10 enriched biological processes of the up-regulated proteins. (K) RT-qPCR analyses of the cGAS-STING target gene expression in MHH-ES-1 cells treated with or without Talazoparib (1 µM for 24 hr). Values of type I interferons, cytokines, and ISGs mRNA levels were presented as means ± SEM from three biological replicates. Significance was determined with unpaired Student’s t-test. *p < 0.05, **p < 0.01, ***p < 0.001, ****p < 0.0001.
Figure 2 with 1 supplement
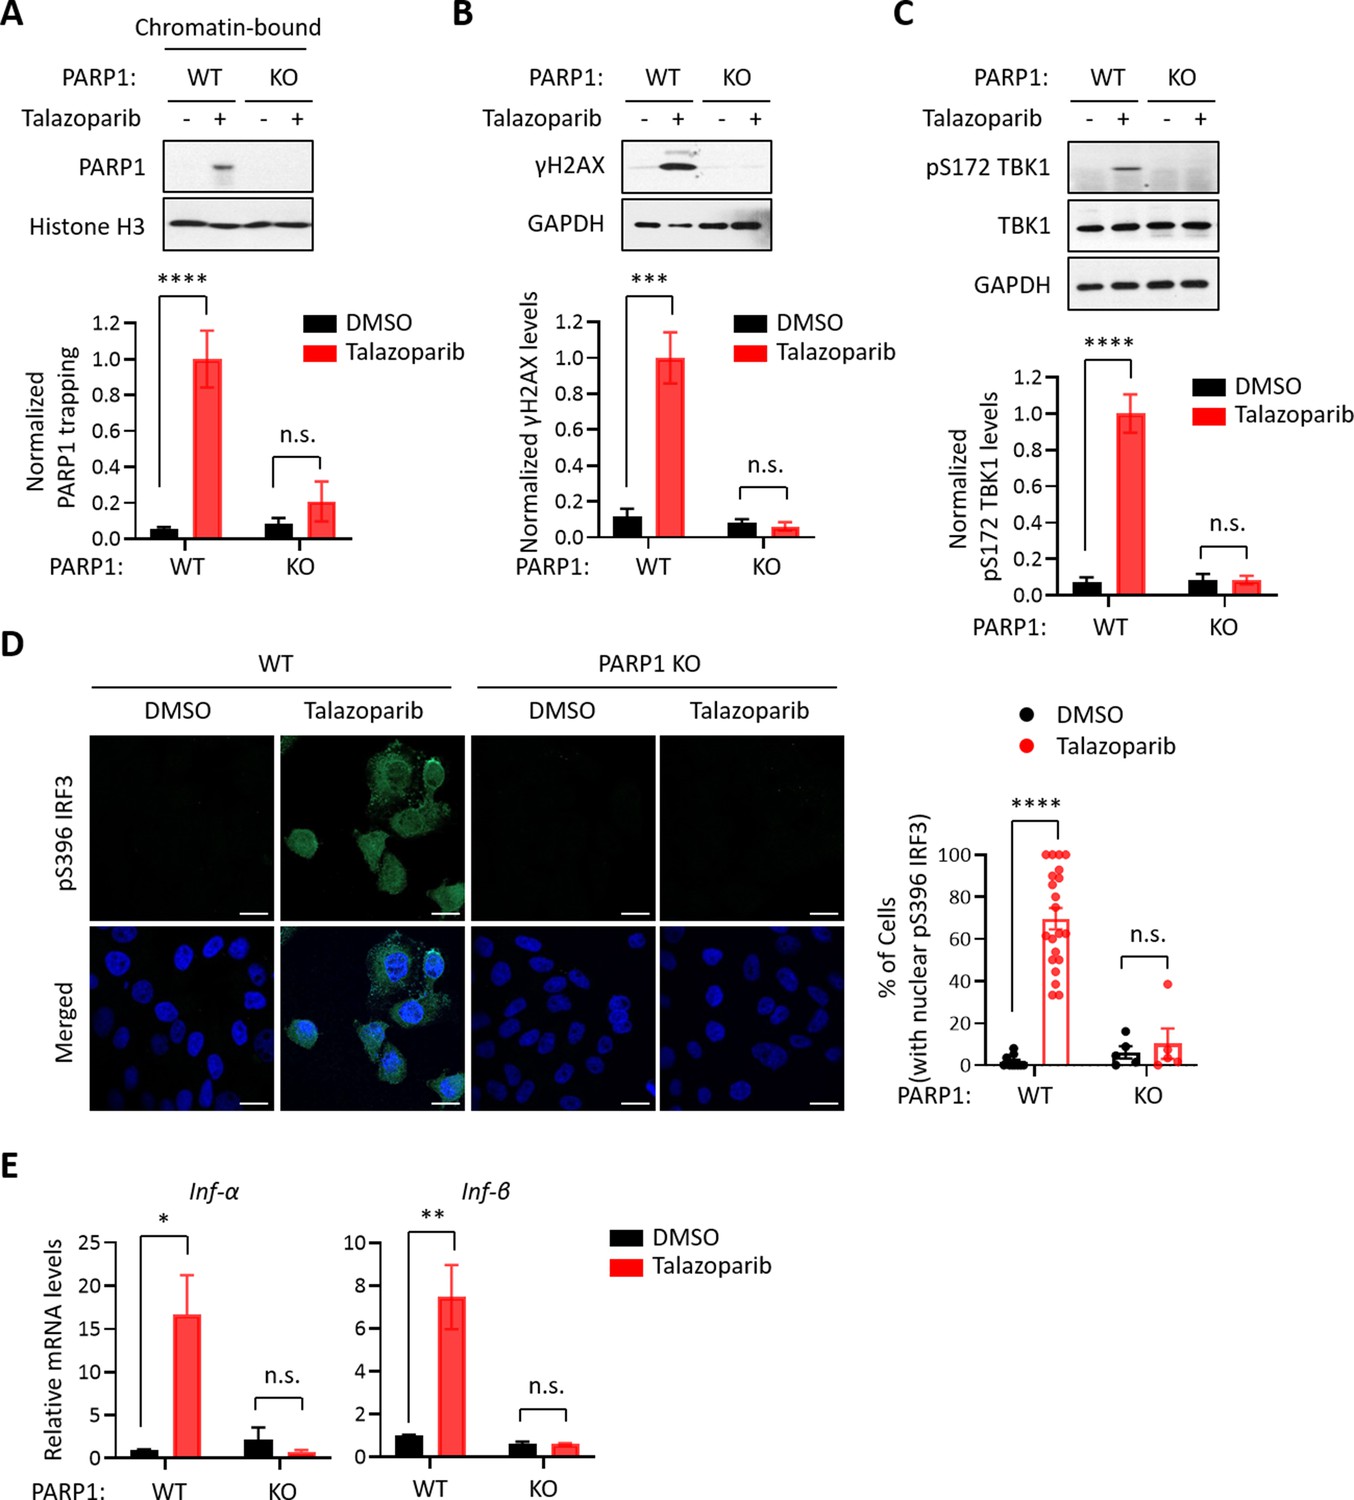
The PARP1 protein is required for PARPi-induced innate immune signaling.
(A) PARPi-induced PARP1 trapping in wild-type (WT) and PARP1 knockout (KO) HeLa cells. Cell were also treated with or without Talazoparib (10 µM for 72 hr). Top, chromatin-bound fractions were isolated and were probed using the indicated antibodies. Histone H3 was used as the loading control. Bottom, the graph shows the quantification of the level of PARP1 trapping. Values were presented as means ± SD from three biological replicates. Significance was determined with two-way ANOVA. ****p < 0.001, n.s., not significant. (B) DDR in WT and PARP1 KO HeLa cells treated with or without Talazoparib (10 µM for 72 hr). Top, whole cell lysates were probed using the indicated antibodies. Bottom, the graph shows the quantification of γH2AX levels. Values were presented as means ± SD from three biological replicates. Significance was determined with two-way ANOVA. ***p < 0.001, n.s., not significant. (C) The level of pS172 TBK1 in WT and PARP1 KO HeLa cells treated with or without Talazoparib (10 µM for 72 hr). Top, whole cell lysates were probed using the indicated antibodies. Bottom, the graph shows the quantification of pS172 TBK1 levels. Values were presented as means ± SD from three biological replicates. Significance was determined with two-way ANOVA. ****p < 0.0001, n.s., not significant. (D) Staining of pS396 IRF3 levels in WT and PARP1 KO HeLa cells treated with or without Talazoparib (10 µM for 72 hr). Left, a representative image of pS396 IRF3 levels (green). DAPI (blue) was used to visualize the nucleus. Right, the graph shows the quantification of the number of cells stained positive for pS396 IRF3 in the nucleus. Values were presented as means ± SEM from three biological replicates. Significance was determined with two-way ANOVA. ****p < 0.0001, n.s., not significant. (E) RT-qPCR analyses of type I interferons in WT and PARP1 KO HeLa cells treated with or without Talazoparib (10 µM for 72 hr). Values of Inf-α and Inf-β mRNA levels were presented as means ± SEM from three biological replicates. Significance was determined with two-way ANOVA. *p < 0.05, **p < 0.01, n.s., not significant.
Figure 2—figure supplement 1
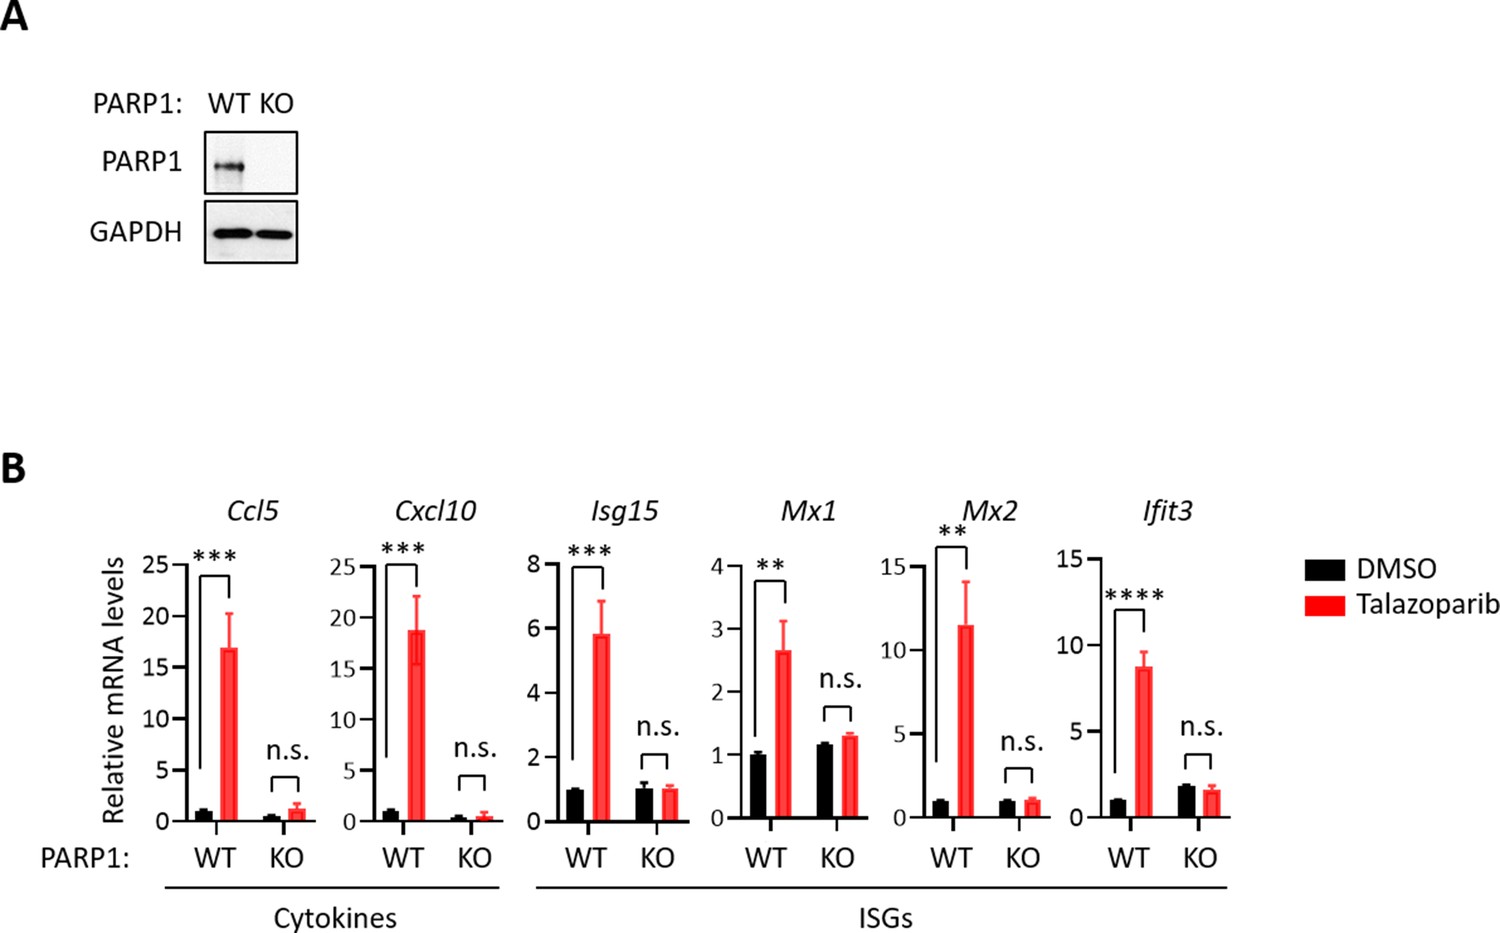
The PARP1 protein is required for PARPi-induced innate immune response.
(A) The level of PARP1 in WT and PARP1 KO HeLa cells. Whole cell lysates were probed using the indicated antibodies. GAPDH used as the loading control. (B) RT-qPCR analyses of cGAS-STING target gene expression in WT and PARP1 KO HeLa cells that were treated with or without Talazoparib (10 µM for 72 hr). Values of cytokines and ISGs mRNA levels were presented as means ± SEM from three biological replicates. Significance was determined with two-way ANOVA. **p < 0.01, ***p < 0.001, ****p < 0.001, n.s., not significant.
Figure 3 with 1 supplement
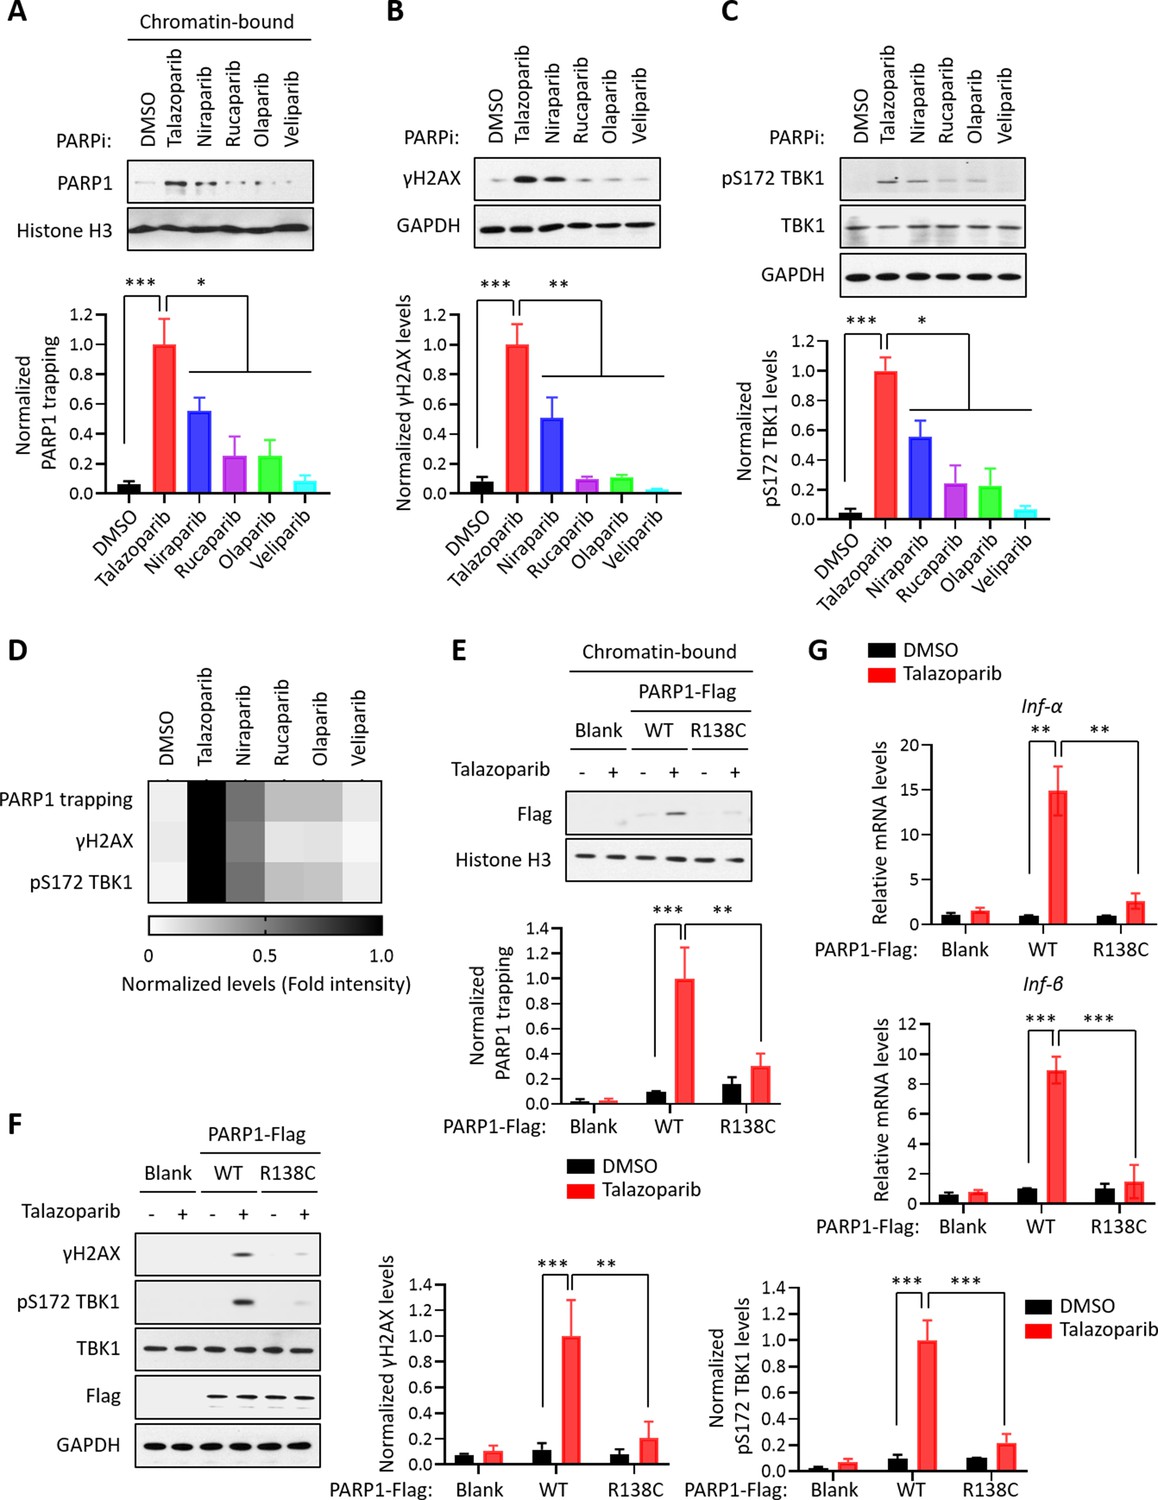
PARP1 trapping is the major contributor of PARPi-induced innate immune signaling.
(A) The level of trapped PARP1 in HeLa cells treated with or without the indicated PARPi (10 µM for 72 hr). Top, chromatin-bound fractions were isolated and were probed using the indicated antibodies. Histone H3 was used as the loading control. Bottom, the graph shows the quantification of the level of PARP1 trapping. Values were presented as means ± SD from three biological replicates. Significance was determined with one-way ANOVA. *p < 0.05, ***p < 0.001. (B) The extent of DNA damage in HeLa cells treated with or without the indicated PARPi (10 µM for 72 hr). Top, whole cell lysates were probed using the indicated antibodies. Bottom, the graph shows the quantification of γH2AX levels. Values were presented as means ± SD from three biological replicates. Significance was determined with one-way ANOVA. **p < 0.01, ***p < 0.001. (C) The level of pS172 TBK1 in HeLa cells treated with or without the indicated PARPi (10 µM for 72 hr). Top, whole cell lysates were probed using the indicated antibodies. Bottom, the graph shows the quantification of pS172 TBK1 levels. Values were presented as means ± SD from three biological replicates. Significance was determined with one-way ANOVA. *p < 0.05, ***p < 0.001. (D) Heatmap of PARP1 trapping, DNA damage, and pS172 TBK1 levels for each PARPi. The normalized levels of PARP1 trapping (A), γH2AX (B), and pS172 TBK1 (C) are shown. (E) PARPi does not induce the trapping of a PARP1 mutant with defective DNA binding. Top, HeLa PARP1 KO cells expressing WT PARP1 or R138C mutant PARP1 (R138C) were treated with or without Talazoparib (10 µM for 72 hr). Chromatin-bound fractions were isolated and were probed using the indicated antibodies. Histone H3 was used as the loading control. Bottom, the graph shows the quantification of the levels of PARP1 trapping. Values were presented as means ± SD from three biological replicates. Significance was determined with two-way ANOVA. **p < 0.01, ***p < 0.001. (F) The extent of DNA damage in HeLa PARP1 KO cells expressing WT PARP1 or R138C PARP1 that were treated with or without Talazoparib (10 µM for 72 hr). Left, whole cell lysates were probed using the indicated antibodies. Right, the graph shows the quantification of γH2AX and pS172 TBK1 levels. Values were presented as means ± SD from three biological replicates. Significance was determined with two-way ANOVA. **p < 0.01, ***p < 0.001. (G) RT-qPCR analyses of type I interferons in HeLa PARP1 KO cells expressing WT or R138C PARP1 that were treated with or without Talazoparib (10 µM for 72 hr). Values of Inf-α and Inf-β mRNA levels were presented as means ± SEM from three biological replicates. Significance was determined with two-way ANOVA. **p < 0.01, ***p < 0.001.
Figure 3—figure supplement 1
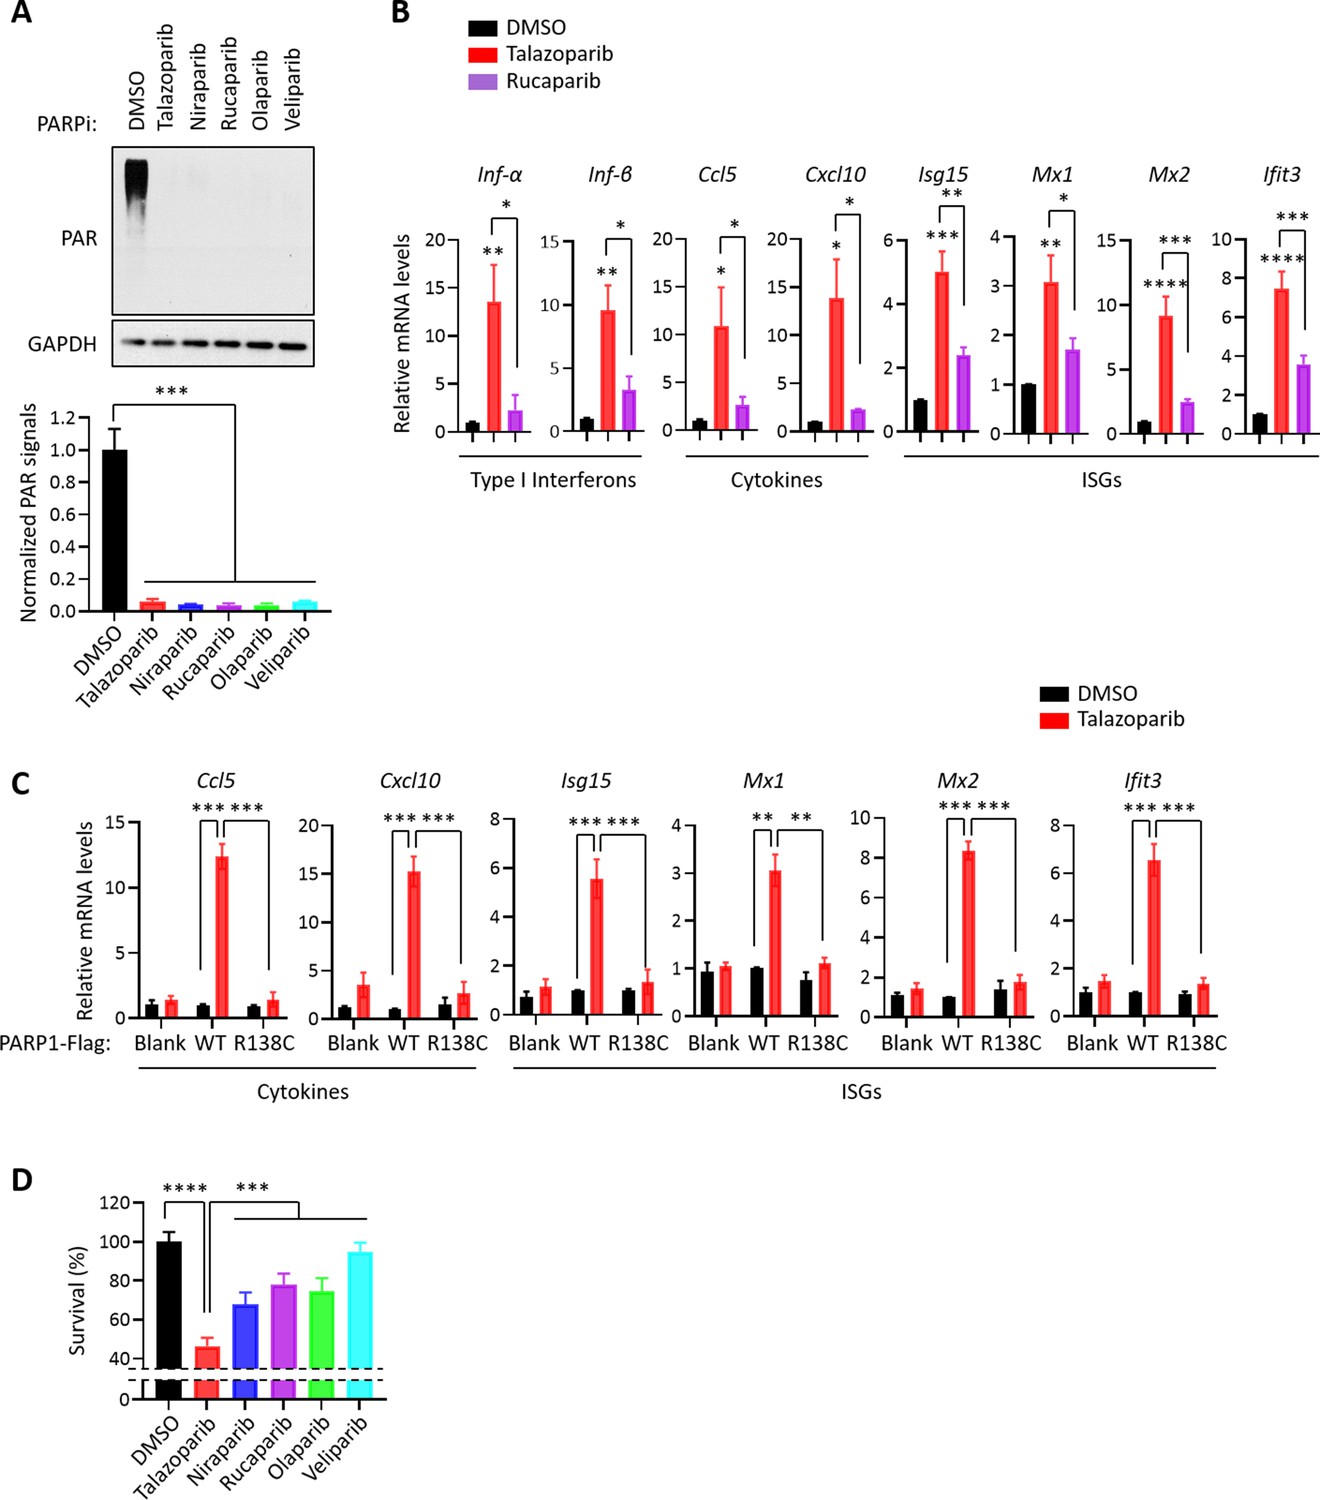
PARP1 trapping is required for PARPi-induced cytotoxicity and innate immune response.
(A) The levels of PAR signals in HeLa cells treated with the indicated PARPi (10 µM for 72 hr). Top, whole cell lysates were probed using the indicated antibodies. Bottom, the graph shows the quantification of PAR levels. GAPDH was used as the loading control. Values were presented as means ± SD from three biological replicates. Significance was determined with one-way ANOVA. ***p < 0.001. (B) RT-qPCR analyses of cGAS-STING target gene expression in HeLa cells treated with Talazoparib or Rucaparib (10 µM for 72 hr). Values of type I interferons, cytokines, and ISGs mRNA levels were presented as means ± SEM from three biological replicates. Significance was determined with one-way ANOVA. *p < 0.05, **p < 0.01, ***p < 0.001, ****p < 0.0001. (C) RT-qPCR analyses of cGAS-STING target gene expression in HeLa PARP1 KO cells expressing PARP1 WT or R138C that were treated with or without Talazoparib (10 µM for 72 hr). Values of cytokines and ISGs mRNA levels were presented as means ± SEM from three biological replicates. Significance was determined with one-way ANOVA. **p < 0.01, ***p < 0.001. (D) Cell death analyses. MHH-ES-1 cells were treated with the PARP inhibitors as indicated (1 µM for 24 hr). Cell viability was measured by CellTiter-Glo assays. Cell survival is presented as means ± SEM from three biological replicates. Significance was determined with one-way ANOVA. ***p < 0.001, ****p < 0.0001.
Figure 4 with 1 supplement
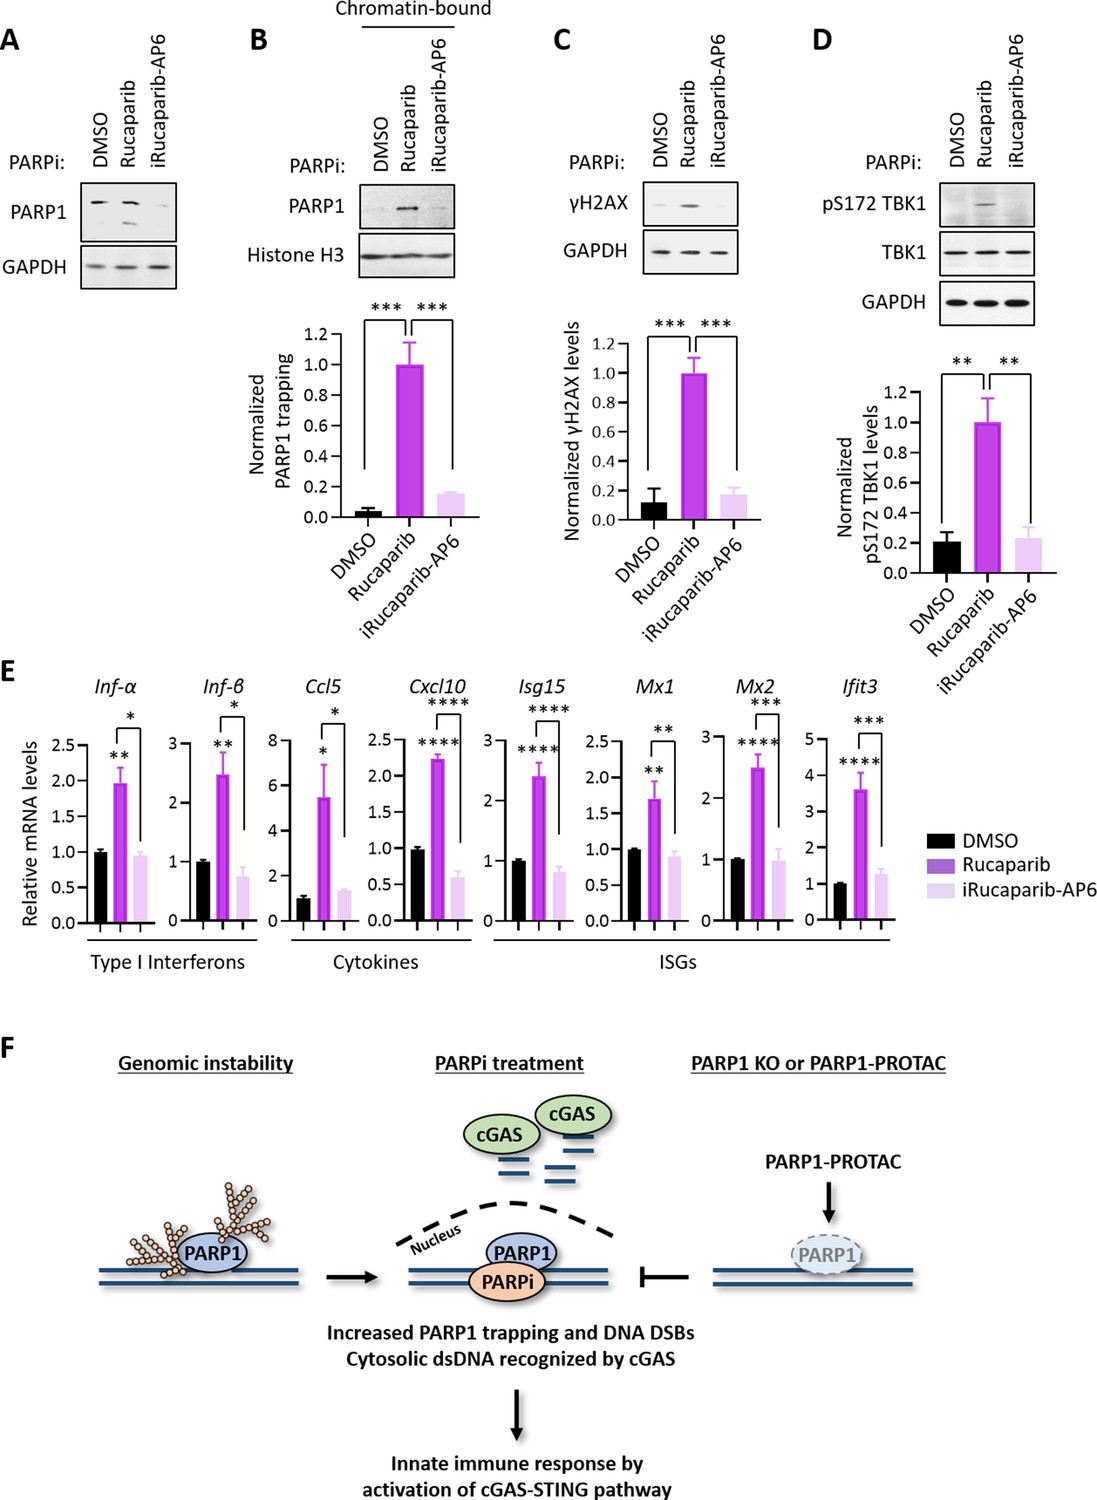
PARP1 degraders abolish PARP1-trapping induced innate immune signaling.
(A) The level of PARP1 in HeLa cells treated with either Rucaparib or iRucaparib-AP6 (10 µM for 72 hr). Whole cell lysates were probed using the indicated antibodies. GAPDH was used as the loading control. (B) The level of trapped PARP1 in HeLa cells treated with either Rucaparib or iRucaparib-AP6 (10 µM for 72 hr). Top, chromatin-bound fractions were isolated and were probed using the indicated antibodies. Histone H3 was used as the loading control. Bottom, the graph shows the quantification of the level of PARP1 trapping. Values were presented as means ± SD from three biological replicates. Significance was determined with one-way ANOVA. ***p < 0.001. (C) The extent of DNA damage in HeLa cells treated with either Rucaparib or iRucaparib-AP6 (10 µM for 72 hr). Top, whole cell lysates were probed using the indicated antibodies. Bottom, the graph shows the quantification of γH2AX levels. Values were presented as means ± SD from three biological replicates. Significance was determined with one-way ANOVA. ***p < 0.001. (D) The level of pS172 TBK1 in HeLa cells treated with either Rucaparib or iRucaparib-AP6 (10 µM for 72 hr). Top, whole cell lysates were probed using the indicated antibodies. Bottom, the graph shows the quantification of pS172 TBK1 levels. Values were presented as means ± SD from three biological replicates. Significance was determined with one-way ANOVA. **p < 0.01. (E) RT-qPCR analyses of the cGAS-STING target gene expression in HeLa cells treated with either Rucaparib or iRucaparib-AP6 (10 µM for 72 hr). Values of type I interferons, cytokines, and ISGs mRNA levels were presented as means ± SEM from three biological replicates. Significance was determined with one-way ANOVA. *p < 0.05, **p < 0.01, ***p < 0.001, ****p < 0.0001. (F) The model of the activation of innate immune response via PARPi-induced PARP1 trapping.
Figure 4—figure supplement 1
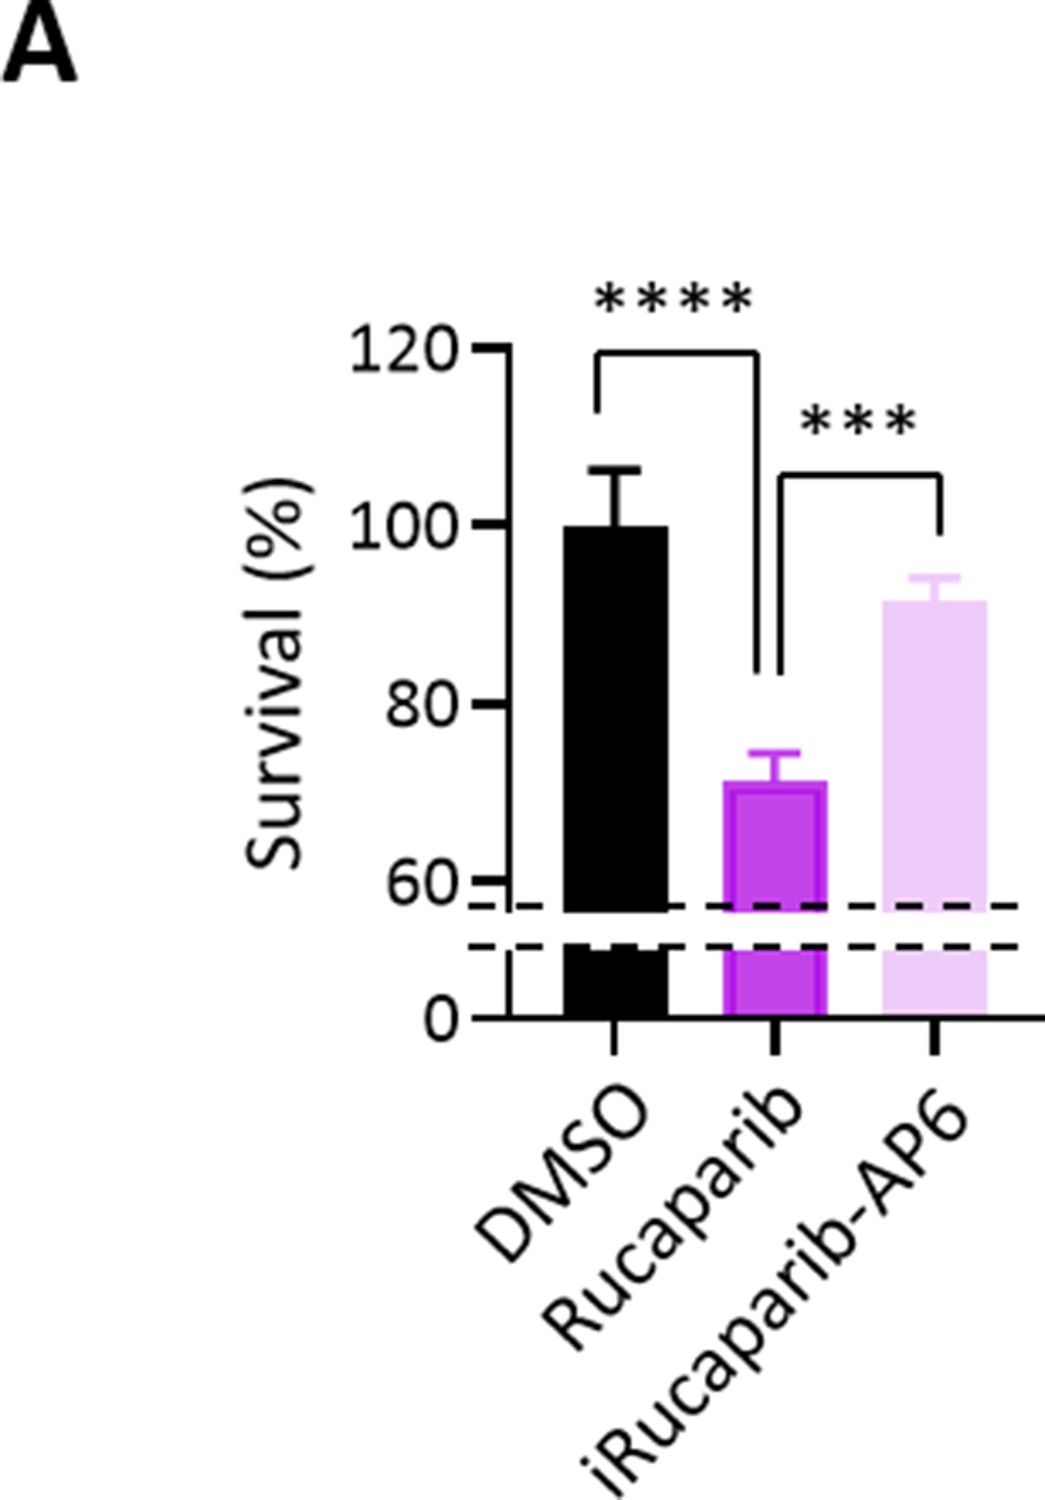
PARP1 degraders prevent PARP1 trapping-induced cytotoxicity.
(A) Cell death analyses. MHH-ES-1 cells were treated with Rucaparib or iRucaparib-AP6 as indicated (1 µM for 24 hr). Cell viability was measured by CellTiter-Glo assays. Cell survival is presented as means ± SEM from three biological replicates. Significance was determined with one-way ANOVA. ***p < 0.001, ****p < 0.0001.
Tables
Key resources table
| Reagent type (species) or resource | Designation | Source or reference | Identifiers | Additional information |
|---|---|---|---|---|
| Antibody | Anti-PAR (Mouse monoclonal) | Trevigen | Cat# 4335-MC-100, RRID:AB_2572318 | IB (1:3000) |
| Antibody | Anti-PARP1 (Rabbit polyclonal) | Cell Signaling Technology | Cat# 9542, RRID:AB_2160739 | IB (1:1000) |
| Antibody | Anti-γH2AX (Rabbit monoclonal) | Cell Signaling Technology | Cat# 9718, RRID:AB_2118009 | IB (1:3000) |
| Antibody | Anti-Histone H3 (Rabbit monoclonal) | Cell Signaling Technology | Cat# 4499, RRID:AB_10544537 | IB (1:3000) |
| Antibody | Anti-GAPDH (Mouse monoclonal) | Santa Cruz Biotechnology | Cat# sc-32233, RRID:AB_627679 | IB (1:5000) |
| Antibody | Anti-Phospho-TBK1/NAK (pS172 TBK1) (Rabbit monoclonal) | Cell Signaling Technology | Cat# 5483, RRID:AB_10693472 | IB (1:1000) |
| Antibody | Anti-TBK1/NAK (Rabbit monoclonal) | Cell Signaling Technology | Cat# 3504, RRID:AB_2255663 | IB (1:1000) |
| Antibody | Anti-Flag (Rabbit polyclonal) | MilliporeSigma | Cat# F7425, RRID:AB_439687 | IB (1:1000) |
| Antibody | Anti-cGAS (Rabbit monoclonal) | Cell Signaling Technology | Cat# 15102, RRID:AB_2732795 | IB (1:1000) |
| Antibody | Anti-Phospho-IRF-3 (pS396 IRF3) (Rabbit monoclonal) | Cell Signaling Technology | Cat# 4947, RRID:AB_823547 | IF (1:1000) |
| Antibody | Alexa Fluor 488-conjugated goat anti-rabbit IgG (Goat polyclonal) | Thermo Fisher Scientific | Cat# A32731, RRID:AB_2633280 | IF (1:1000) |
| Antibody | Goat Anti-Mouse IgG Antibody, HRP conjugate, Species Adsorbed (Goat polyclonal) | MilliporeSigma | Cat# AP181P, RRID:AB_11214094 | IB (1:3000) |
| Antibody | ECL Rabbit IgG, HRP-linked fragment (Donkey polyclonal) | GE Healthcare life sciences | Cat# NA9340, RRID:AB_772191 | IB (1:3000) |
| Chemical compound, drug | Talazoparib | Selleck | Cat# S7048 | PARP1 inhibitor |
| Chemical compound, drug | Niraparib | Selleck | Cat# S2741 | PARP1 inhibitor |
| Chemical compound, drug | Rucaparib | Selleck | Cat# S1098 | PARP1 inhibitor |
| Chemical compound, drug | Olaparib | Selleck | Cat# S1060 | PARP1 inhibitor |
| Chemical compound, drug | Veliparib | Selleck | Cat# S1004 | PARP1 inhibitor |
| Chemical compound, drug | iRucaparib-AP6 | Our laboratory | N/A | PARP1 degrader |
| Chemical compound, drug | Polybrene (Hexadimethrine bromide) | MilliporeSigma | Cat# H9268; CAS 28728-55-4 | |
| Chemical compound, drug | Puromycin | MilliporeSigma | Cat# P7255; CAS 58-58-2 | |
| Cell line (human) | HeLa | ATCC | Cat# CCL-2, RRID:CVCL_0030 | |
| Cell line (human) | HeLa PARP1 KO | In this study | N/A | PARP1 deficient HeLa |
| Cell line (human) | MHH-ES-1 | DSMZ | Cat# ACC 167, RRID:CVCL_1411 | |
| Cell line (human) | HeLa | ATCC | Cat# CCL-2 | |
| Recombinant DNA reagent | pCMV-hPARP1-3xFlag-WT | Addgene | Cat# 11157 | In pCMV; tagged with 3XFlag on its N-terminus |
| Recombinant DNA reagent | pCMV-hPARP1-3xFlag-R138C | In this study | Modified by R138C mutation | In pCMV; tagged with 3XFlag on its N-terminus |
| Strain, strain background (Escherichia coli) | DH5alpha | Thermo Fisher Scientific | Cat# 18258012 | Competent cells |
| Strain, strain background (Escherichia coli) | Stbl3 Competent E. coli | Thermo Fisher Scientific | Cat# C737303 | Competent cells |
| Commercial assay or kit | Quant-iT PicoGreen dsDNA Reagent | Thermo Fisher Scientific | Cat# P7581 | |
| Commercial assay or kit | Subcellular Protein Fractionation Kit for Cultured Cells | Thermo Fisher Scientific | Cat# 78840 | |
| Commercial assay or kit | RNeasy Mini Kit | QIAGEN | Cat# 74104 | |
| Commercial assay or kit | QIAprep Spin Miniprep Kit | QIAGEN | Cat# 27106 | |
| Commercial assay or kit | e-Myco PLUS Mycoplasma PCR Detection Kit | BOCA SCIENTIFIC | Cat# 25237 | |
| Commercial assay or kit | TMT6plex Mass Tag Labeling Kits | Thermo Fisher Scientific | Cat# 90110 | |
| Commercial assay or kit | CellTiter-Glo Luminescent Cell Viability Assay | Promega | Cat# G7571 | |
| Software, algorithm | ImageJ 1.49 v | NIH | https://imagej.net/ImageJ2 | |
| Software, algorithm | DAVID Bioinformatics Resources v6.8 | DAVID | https://david.ncifcrf.gov/ | |
| Software, algorithm | PRISM v8.2.0 | GraphPad | https://www.graphpad.com/scientific-software/prism/ | |
| Software, algorithm | human protein sequences (Uniprot) | UniProt | https://www.uniprot.org/UniProt database (2019_07,560,537 sequences;taxonomy, Homo sapiens, 20,431 ) | |
| Software, algorithm | human IPI protein database v3.60 | EMBL-EBI | ftp://ftp.ebi.ac.uk/pub/databases/IPI | |
| Software, algorithm | The Sequest algorithm v28 | Cell. 2010 Dec 3;143(7):1174–89 | N/A | |
| Others | DAPI | MilliporeSigma | Cat# D9542 | |
| Others | Dimethyl sulfoxide (DMSO) | Thermo Fisher Scientific | Cat# BP231-1; CAS 67-68-5 | |
| Others | Lipofectamine 2000 | Thermo Fisher Scientific | Cat# 11668500 | |
| Others | Dulbecco’s Modified Eagle’s Medium (DMEM) | MilliporeSigma | Cat# D5796 | |
| Others | RPMI1640 | MilliporeSigma | Cat# R8758 | |
| Others | Fetal Bovine Serum (FBS) | MilliporeSigma | Cat# 12303C | |
| Others | Lysyl Endopeptidase (Lys-C) | Wako | Cat# 129–02541; CAS 123175-82-6 | |
| Others | Gen5 | BioTek | N/A | |
| Others | BCA reagents | Thermo Fisher Scientific | Cat# 23224/23228 | |
| Others | 0.45 μm filter | Thermo Fisher Scientific | Cat# 05-713-387 | |
| Others | Synergy HT Multi-Detection Microplate Reader. | BioTek | N/A | |
| Others | SuperScript III Reverse Transcriptase | Thermo Fisher Scientific | Cat# 18080044 | |
| Others | CFX384 Touch Real-Time PCR Detection System | Bio-Rad | Cat# 1855484 | |
| Others | Applied Biosystems Power SYBR Green PCR Master Mix | Thermo Fisher Scientific | Cat# 43-676-59 | |
| Others | Oasis HLB solid-phase extraction (SPE) cartridges | Waters | Cat# 186000383 | |
| Others | 3M Empore C18 Extraction Disk | Thermo Fisher Scientific | Cat# 14-386-2 | |
| Others | ZORBAX 300Extend-C18 HPLC column | Agilent | Cat# 761775–902 | |
| Others | Q Exactive Hybrid Quadrupole-Orbitrap Mass Spectrometer | Thermo Fisher Scientific | Cat# IQLAAEGAAPFALGMAZR | |
| Others | PicoFrit nanospray columns | New Objective | PF360-75-15-N-5 |
Additional files
-
Supplementary file 1
Raw and analyzed TMT-MS data in MHH-ES-1 following Talazoparib treatment (1 µM for 24 hr).
- https://cdn.elifesciences.org/articles/60637/elife-60637-supp1-v2.xlsx
-
Supplementary file 2
GO analysis of up-regulated proteins from Supplementary file 1.
- https://cdn.elifesciences.org/articles/60637/elife-60637-supp2-v2.xlsx
-
Supplementary file 3
Oligo sequence in this study.
- https://cdn.elifesciences.org/articles/60637/elife-60637-supp3-v2.xlsx
-
Transparent reporting form
- https://cdn.elifesciences.org/articles/60637/elife-60637-transrepform-v2.docx
Download links
A two-part list of links to download the article, or parts of the article, in various formats.
Downloads (link to download the article as PDF)
Open citations (links to open the citations from this article in various online reference manager services)
Cite this article (links to download the citations from this article in formats compatible with various reference manager tools)
PARP1 inhibitors trigger innate immunity via PARP1 trapping-induced DNA damage response
eLife 9:e60637.
https://doi.org/10.7554/eLife.60637


