Regulation of shoot meristem shape by photoperiodic signaling and phytohormones during floral induction of Arabidopsis
- Max Planck Institute for Plant Breeding Research, Germany
- Department of Biological Sciences, Tokyo Metropolitan University, Japan
- School of Agriculture and Food, University of Melbourne, Australia
Figures
Figure 1 with 2 supplements
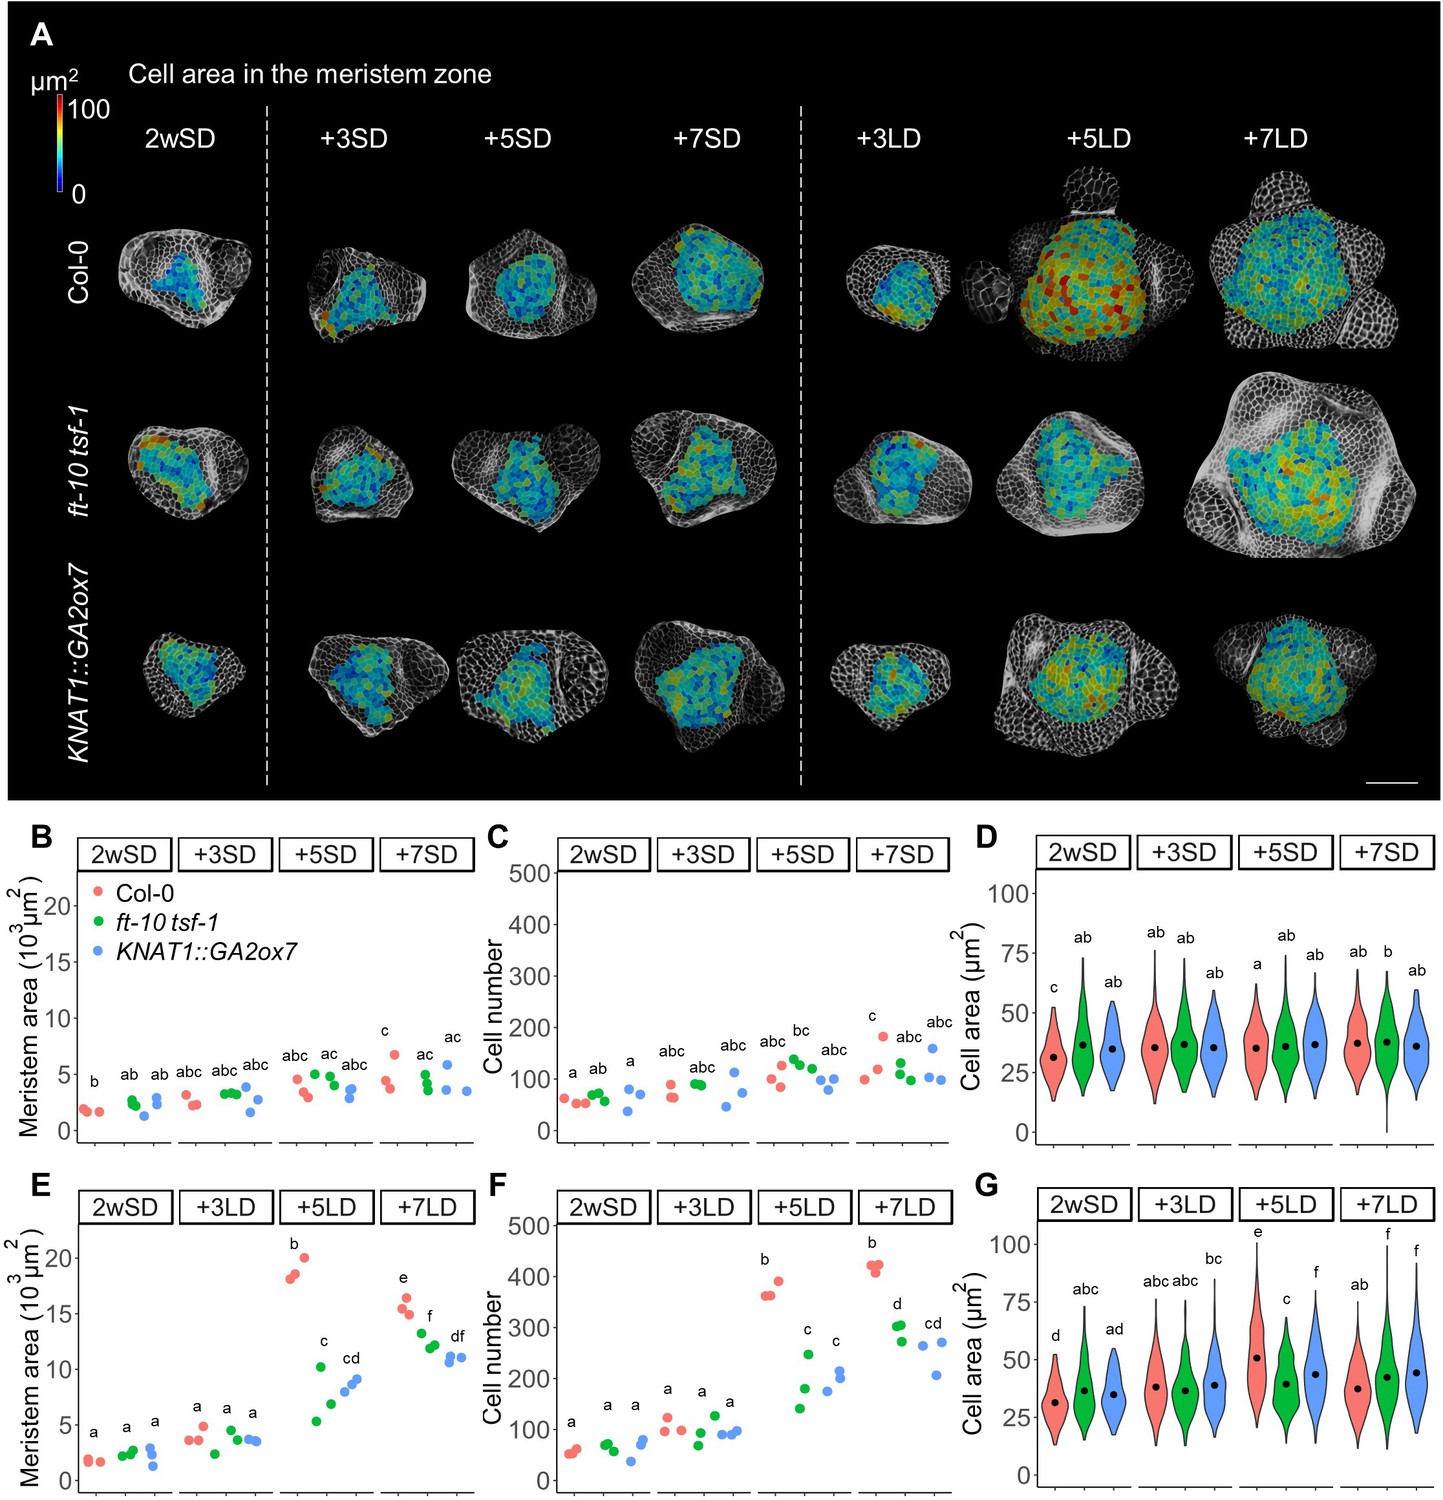
The number and size of the cells in the meristem increase during floral transition.
(A) Heat-map quantification of cell area in the meristem region of Col-0, ft-10 tsf-1, and KNAT1::GA2ox7 grown for 2 weeks in non-inductive short days (SDs) (2wSD) and observed for an additional 3SDs (+3SD), 5SDs (+5SD), or 7SDs (+7SD), or transferred to inductive long days (LDs) for 3LDs (+3LD), 5LDs (+5LD), or 7LDs (+7LD). Scale bars, 50 µm. (B–G) Quantification of the meristem area (B and E), the cell number (C and F), and the cell area in the meristem region (D and G) in Col-0, ft-10 tsf-1, and KNAT1::GA2ox7 grown for 2 weeks in non-inductive SDs (2wSD) and observed for +3SD, +5SD, or +7SD (B–D) or transferred to +3LD, +5LD, or +7LD (E–G). Letters a–f in panels B–G show significant differences between conditions and genotypes (p<0.05, using ANOVA followed by Tukey's pairwise multiple comparisons), n = 3 apices.
-
Figure 1—source data 1
Original data of meristem area and cell number of each genotype for Figure 1A–C,E, and F and Figure 1—figure supplement 1.
- https://cdn.elifesciences.org/articles/60661/elife-60661-fig1-data1-v2.xlsx
-
Figure 1—source data 2
Original data of cell size of each genotype for Figure 1A,D, and G and Figure 1—figure supplement 2.
- https://cdn.elifesciences.org/articles/60661/elife-60661-fig1-data2-v2.xlsx
Figure 1—figure supplement 1

Doming of the shoot apical meristem (SAM) is observed specifically at floral transition.
(A) Side views of the SAM of Col-0, ft-10 tsf-1, and KNAT1::GA2ox7 grown for 2 weeks under non-inductive short days (SDs) (2wSD) and under the same conditions for an additional 3SDs (+3SD), 5SDs (+5SD), or 7SDs (+7SD) (lower panel) or transferred to inductive long day (LD) conditions for 3LDs (+3LD), 5LDs (+5LD), or 7LDs (+7LD) (upper panel). The signal of the cell wall in L1 (Renaissance) was projected onto the surface of the meristem. Scale bars, 50 µm. (B and C) Quantification of the distance between primordia in Col0, ft-10 tsf-1, and KNAT1::GA2ox7 grown for 2 weeks under non-inductive SDs (2wSD) and observed in the same conditions for +3SD, +5SD, or +7SD (B) or transferred to +3LD, +5LD, or +7LD (C). Letters a–d show significant differences between conditions and genotypes (p<0.05, using ANOVA followed by pairwise multiple comparison using Tukey’s Honest Significant Difference [HSD] test), n = 3 apices.
Figure 1—figure supplement 2
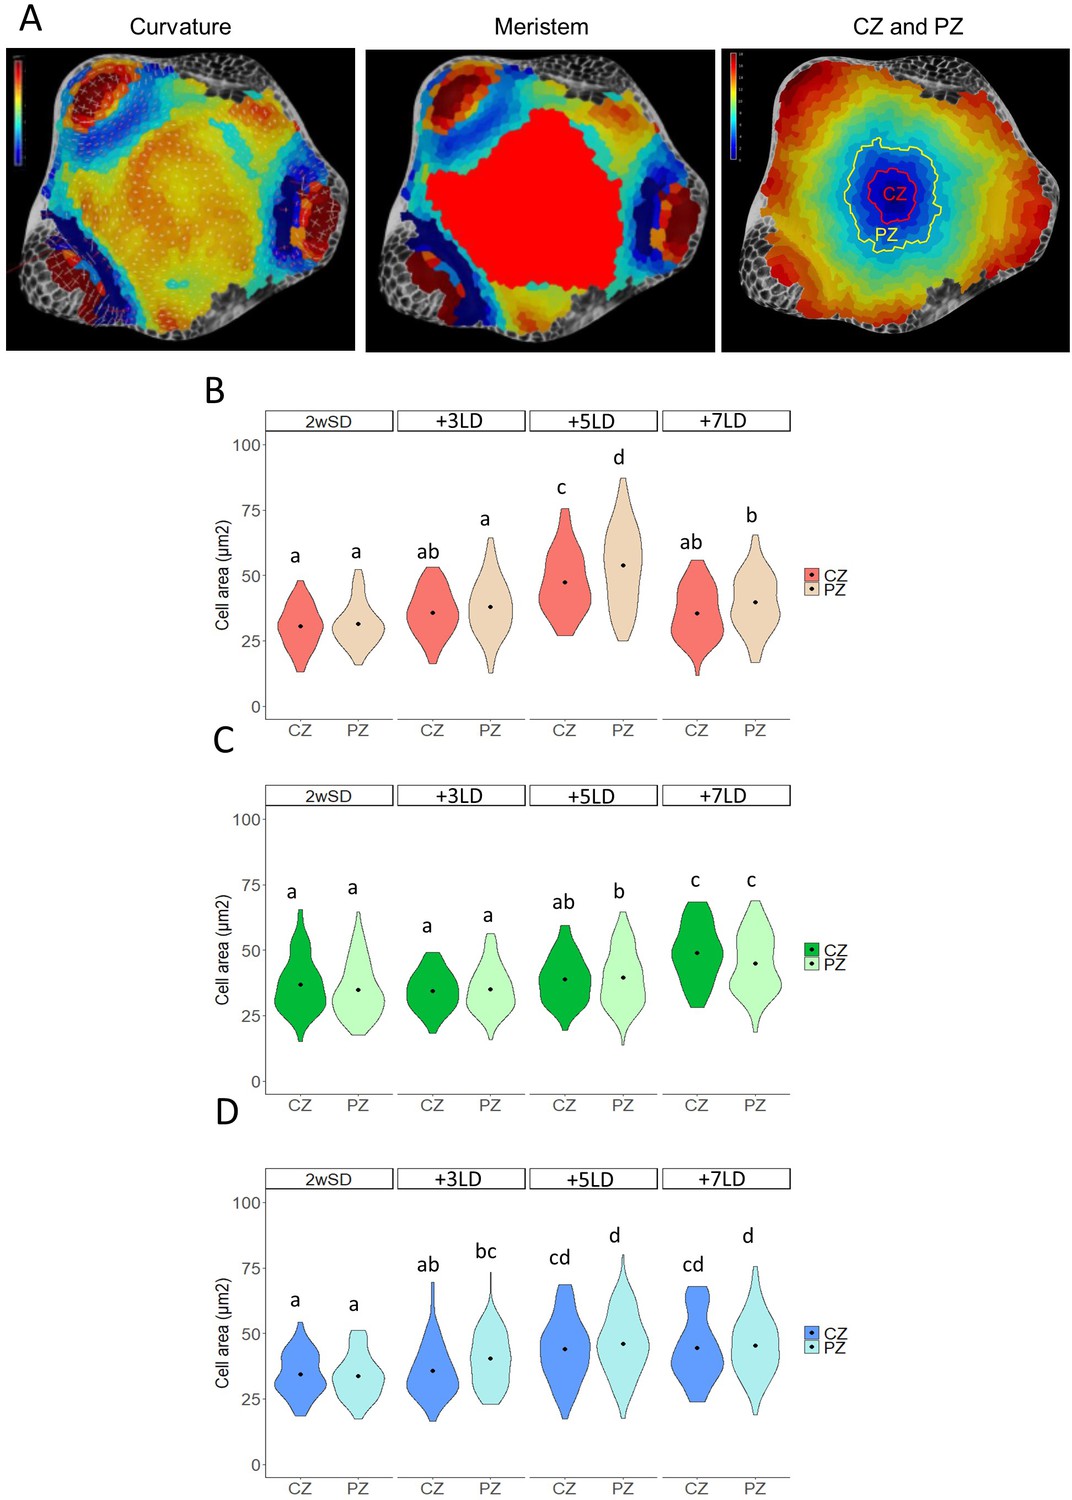
Larger increase in cell area in the PZ than in the CZ at floral transition.
(A) Distinction of the areas at the shoot apex. From the curvature map (left panel), the area surrounded by boundary (negative Gaussian curvature; light blue) is defined as meristem (middle panel). The inner and outer rings are selected by the distance from the central cell in the meristem (right panel), as zero to two and three to five cells from the central cell. (B–D) Quantification of cell area in the central zone (CZ; cell 0–2 from the central cell) and the adjacent peripheral zone (PZ; cell 3–5 from the central cell) in Col-0 (B), ft-10 tsf-1 (C), and KNAT1::GA2ox7 (D) grown for 2 weeks under non-inductive short days (SDs) (2wSD) and transferred to inductive long days (LDs) for 3LDs (+3LD), 5LDs (+5LD), or 7LDs (+7LD). Letters a–d show significant differences between conditions (p<0.05, using ANOVA followed by pairwise multiple comparison using Tukey’s Honest Significant Difference [HSD] test), n = 3 apices.
Figure 2 with 3 supplements
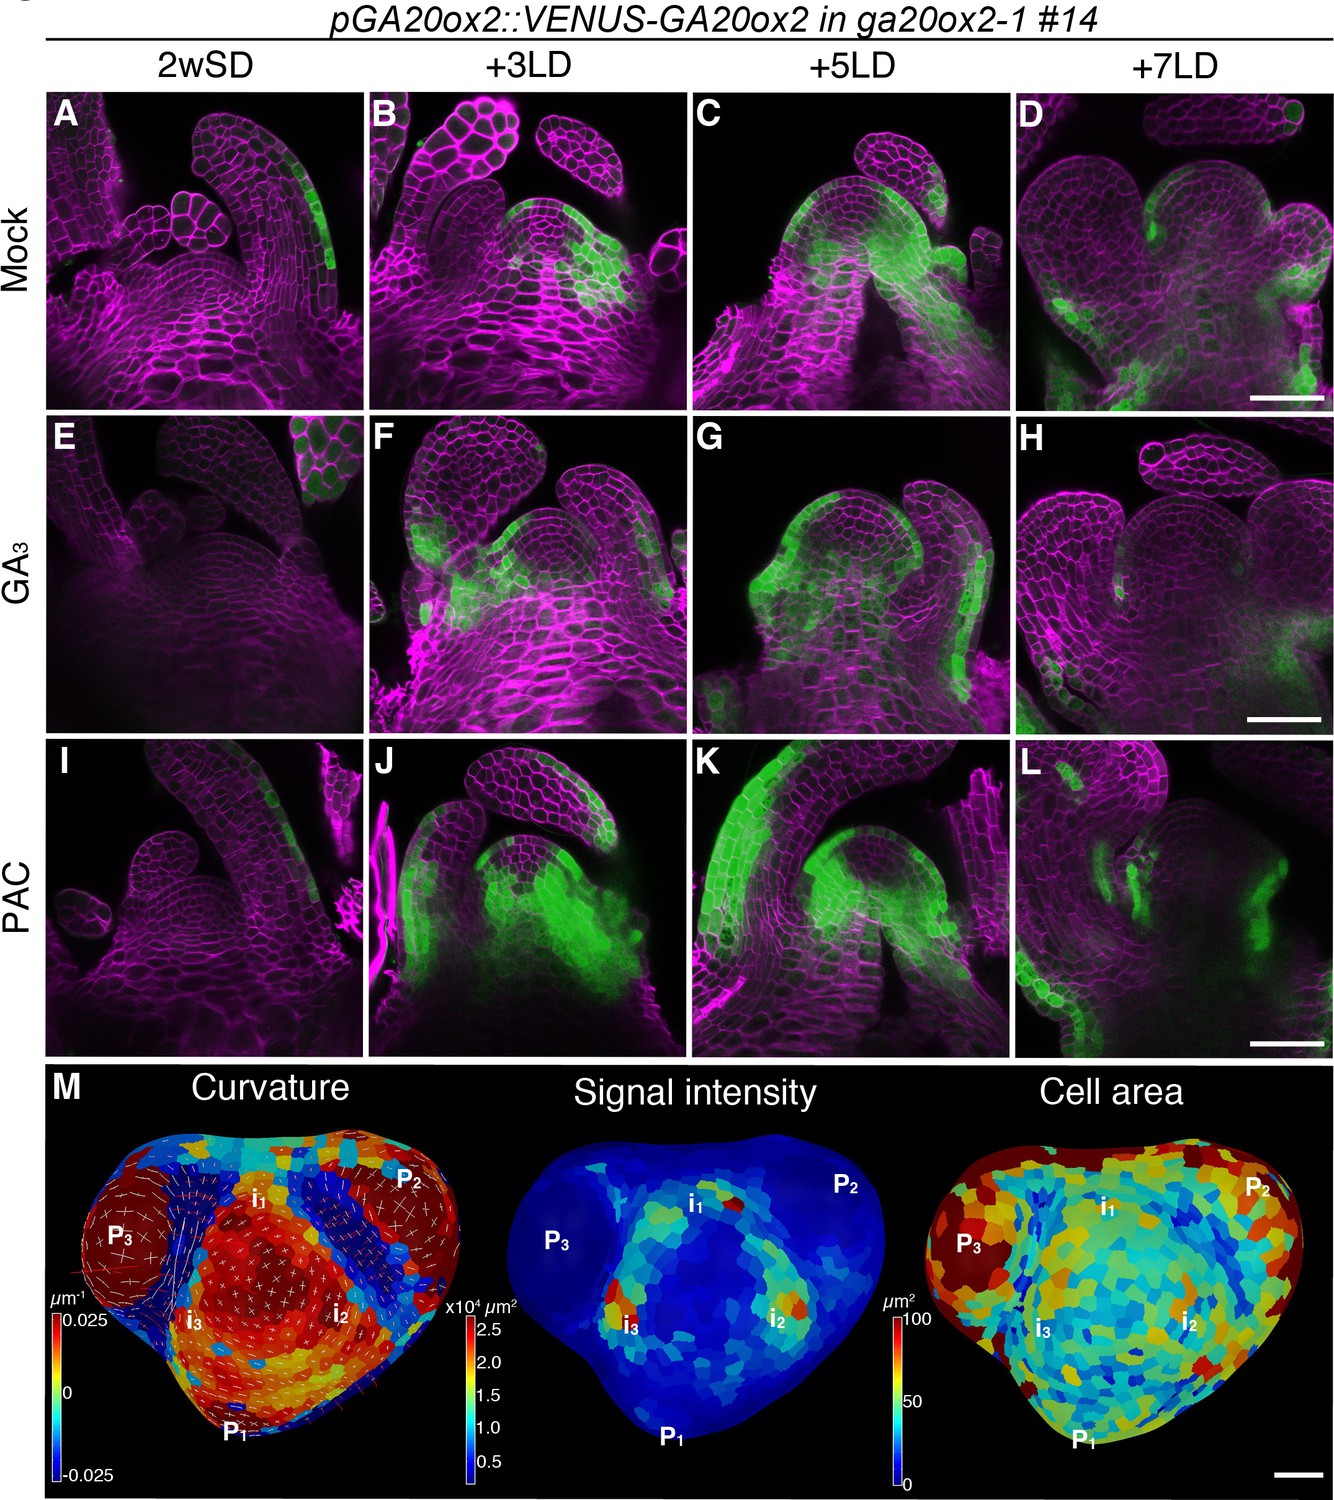
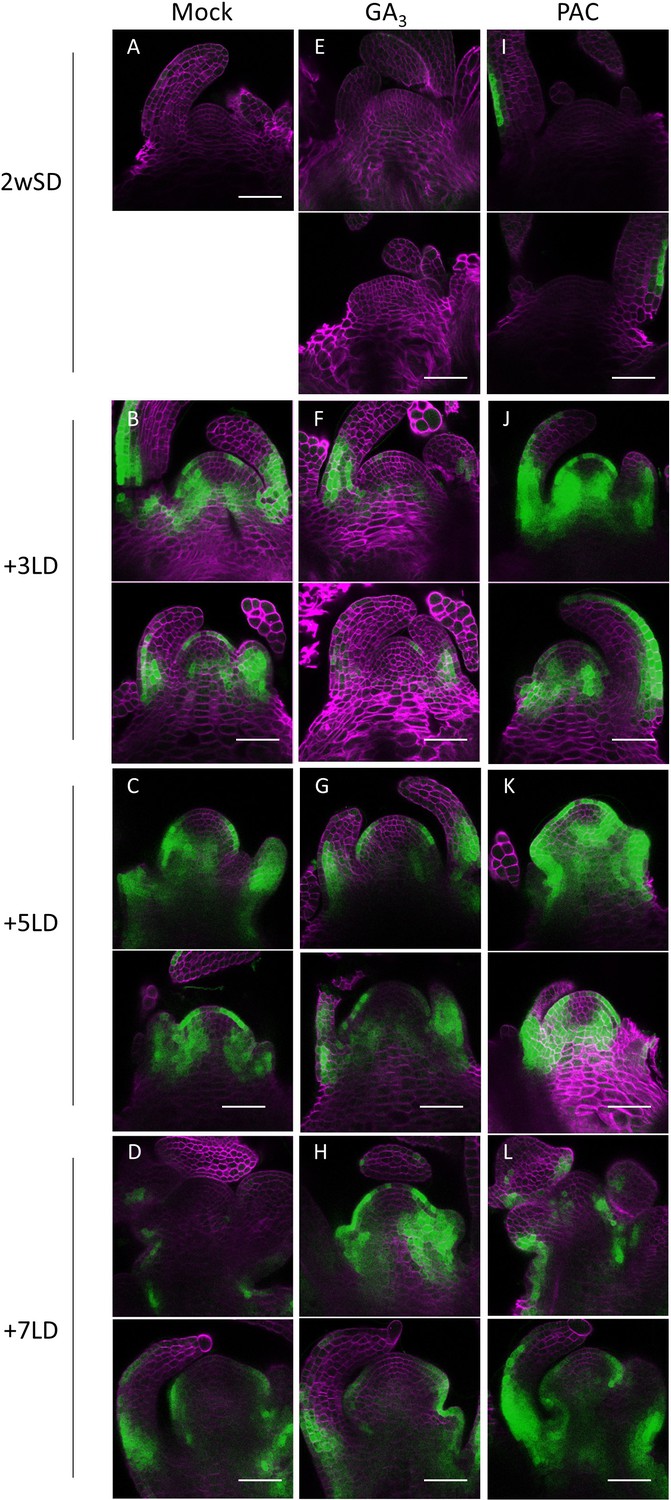
The expression pattern of GA20ox2 in the shoot apical meristem during floral transition.
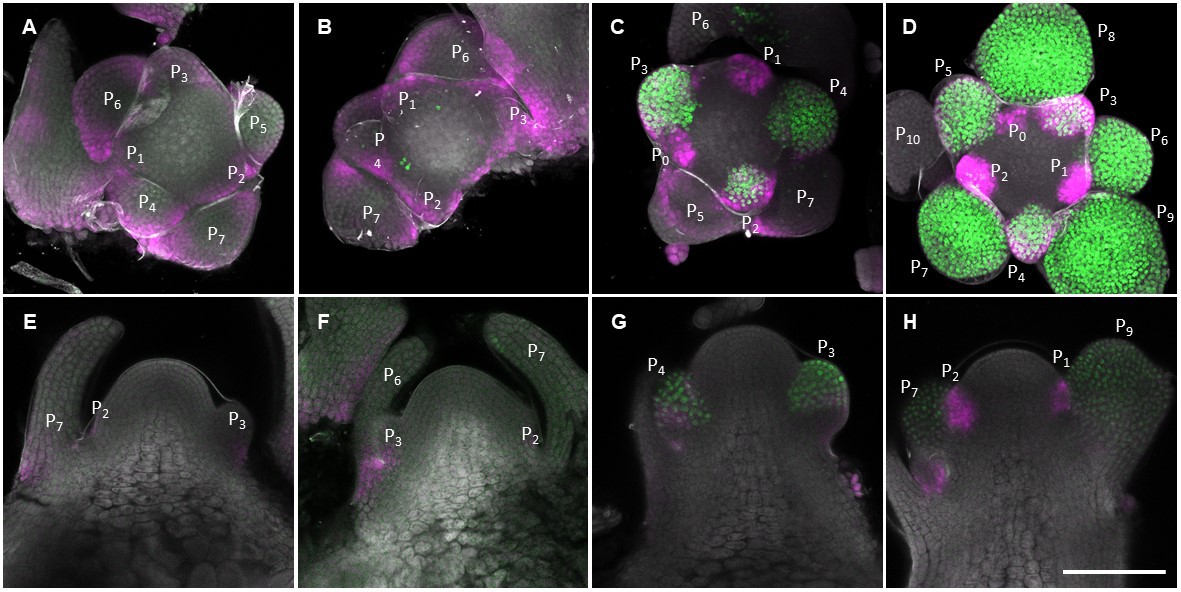
(A–L) Confocal imaging of longitudinal sections of a meristem expressing pGA20ox2::VENUS-GA20ox2 (ga20ox2–1 background line #14; green). The plants were germinated and grown on growth medium in short days (SDs) for 2 weeks (A, E, and I), then transferred to long days (LDs) for 3LDs (B, F, and J), 5LDs (C, G, and K), or 7LDs (D, H, and L). Samples were treated either with mock (A–D; ethanol), 100 µM GA3 (E–H), or 10 µM PAC (I–L) for 24 hr prior to harvesting. The cell walls were stained with Renaissance 2200 (magenta). (M) Segmented surface projection of pGA20ox2::VENUS-GA20ox2 #14 grown for 2 weeks in SDs and 3LDs (2wSD3LDs). Gaussian curvature (left panel), VENUS signal intensity (middle panel), and cell area (right panel) were extracted. The positions of future primordia (in) were predicted from those of existing primordia (Pn). Scale bars, 50 µm (A–L), 20 µm (M).
Figure 2—figure supplement 1
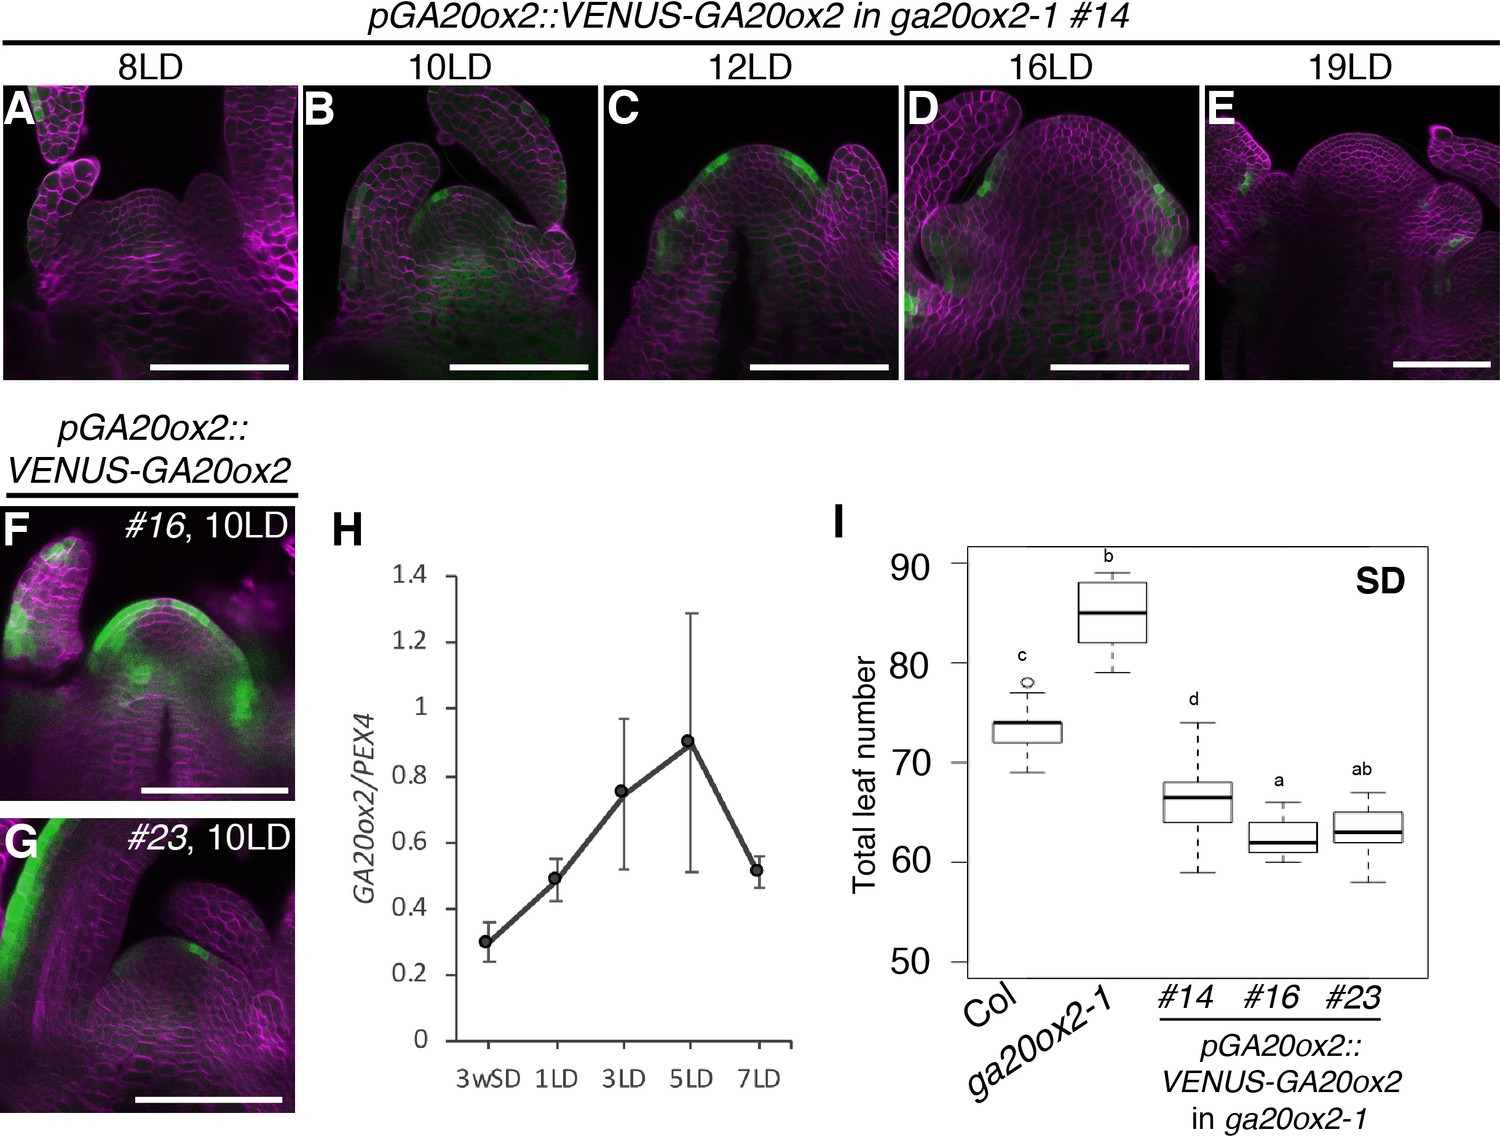
Expression pattern of GA20ox2 during floral transition.
(A–E) Expression of pGA20ox2::VENUS-GA20ox2 (ga20ox2–1 background line #14; green) at the shoot apex. The plants were germinated and grown on soil under long days (LDs) for 8 (A), 10 (B), 12 (C), 16 (D), or 19 (E) days. (F and G) Expression of VENUS at the shoot apices of independent transformants of pGA20ox2::VENUS-GA20ox2. VENUS signal was detected in the abaxial region of leaf primordia and peripheral zone of the meristem in all three lines tested. The plants were germinated and grown on soil under LDs for 10 days. Cell walls were stained with Renaissance 2200 (magenta). Scale bars, 100 µm. (H) Temporal expression pattern of GA20ox2 mRNA. Apices of wild-type plants grown for 3 weeks in short days (SDs) (3wSD) and then transferred to LDs (1, 3, 5, or 7 LD) were examined. The means ± SD for four biological replicates are indicated. (I) Complementation of ga20ox2–1 late-flowering phenotype by transgenes. Total leaf number under SDs was scored for Col-0 and ga20ox2–1, and for three independent transgenic lines for pGA20ox2::GA20ox2 VENUS and pGA20ox2::VENUS-GA20ox2. (n ≥ 10; letters a–d indicate significant differences calculated with ANOVA, Tukey’s Honest Significant Difference [HSD] test p<0.001).
Figure 2—figure supplement 2
The expression pattern of GA20ox2 in the shoot apical meristem during floral transition.
Additional replicates for Figure 2. Longitudinal confocal sections of a meristem expressing pGA20ox2::VENUS-GA20ox2 (ga20ox2–1 background line #14; green). The plants were germinated and grown on growth medium in short days (SDs) for 2 weeks (A, E, and I), then transferred to long days (LDs) for 3LDs (+3LD; B, F, and J), 5LDs (+5LD; C, G, and K), or 7LDs (+7LD; D, H, and L). Samples were treated either with mock (A–D; ethanol), 100 µM GA3 (E–H), or 10 µM PAC (I–L) for 24 hr prior to harvesting. The cell walls were stained with Renaissance 2200 (magenta).
Figure 2—figure supplement 3
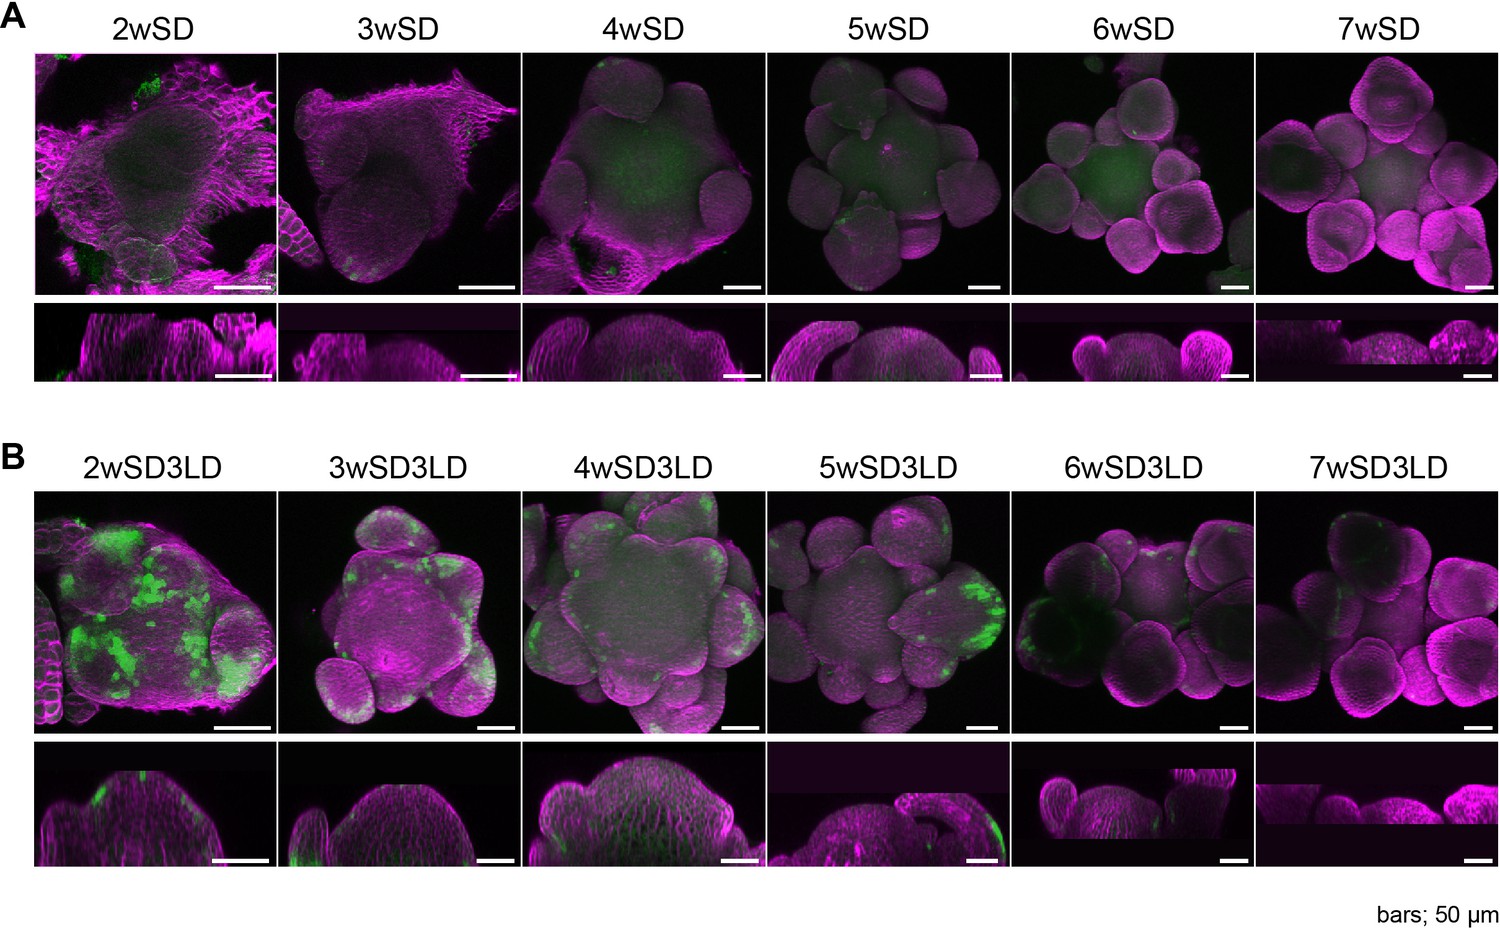
Expression pattern of GA20ox2 under short days.
(A) Maximum intensity projection images of pGA20ox2::VENUS-GA20ox2 line #14 meristem grown under continuous short days (SDs). VENUS signal (green, top panel), Renaissance staining (magenta, middle panel), and merged image (bottom panel) are indicated. VENUS signal was detected only at the abaxial of leaf primordia (arrowhead, bottom panel). (B) Maximum intensity projection images of pGA20ox2::VENUS-GA20ox2 line #14 meristem 3 days after transfer to long days (LDs) following each SD time point. The VENUS signal was enhanced in the leaf primordia at all time points. The VENUS signal was also detected at the PZ of meristem (arrows) at 2wSD3LD and 3wSD3LD. Scale bar, 100 µm.
Figure 3
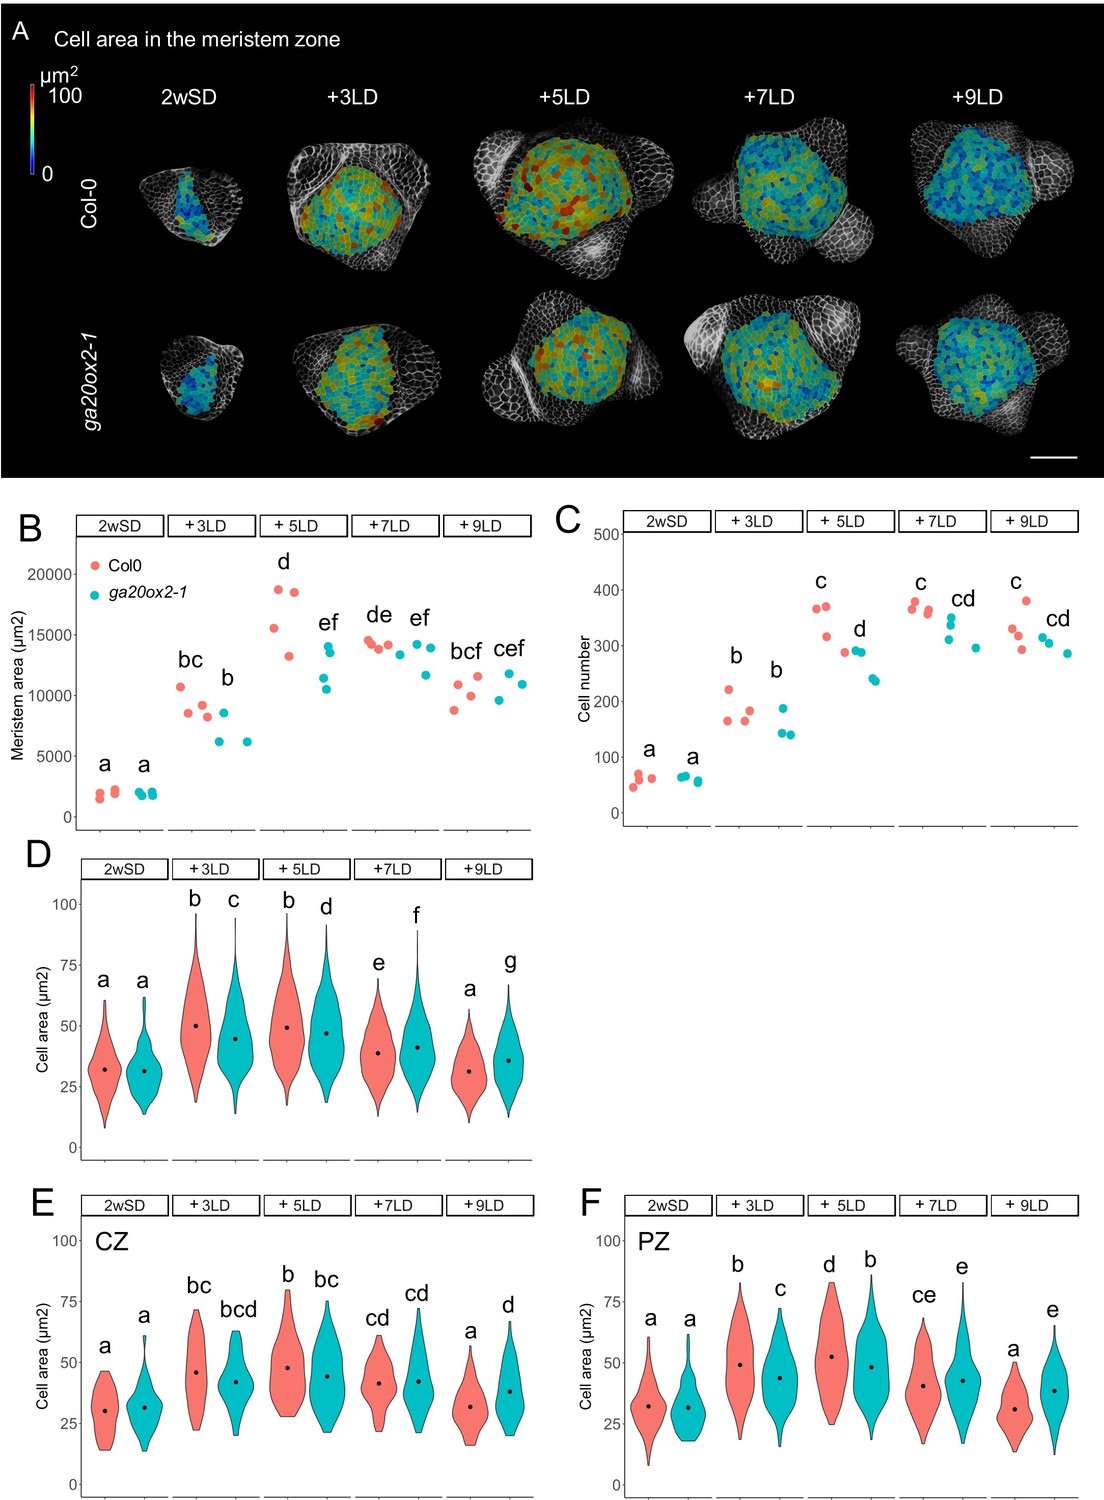
GA20ox2 contributes to meristem size at floral transition.
(A) Heat-map quantification of cell area in the meristem region of Col-0, and ga20ox2–1 grown for 2 weeks in non-inductive short days (SDs) (2wSD) and transferred to inductive long days (LDs) for 3LDs (+3LD), 5LDs (+5LD), 7LDs (+7LD), or 9LDs (+9LD). Scale bars, 50 µm. (B–F) Quantification of the meristem area (B), the cell number (C), and the cell area in the meristem region (D–F) in Col-0, and ga20ox2–1 grown for 2 weeks in non-inductive SDs (2wSD) and transferred to inductive LDs for 3LDs (+3LD), 5LDs (+5LD), 7LDs (+7LD), or 9LDs (+9LD). Letters a–g in panels B–F show significant differences between conditions and genotypes (p<0.05, using ANOVA followed by Tukey's pairwise multiple comparisons), n = 3–4 apices.
-
Figure 3—source data 1
Original data of meristem area and cell number of each genotype for Figure 3A–C and Figure 4—figure supplement 6B and C.
- https://cdn.elifesciences.org/articles/60661/elife-60661-fig3-data1-v2.xlsx
-
Figure 3—source data 2
Original data of meristem area and cell number of each genotype for Figure 3D–F and Figure 4—figure supplement 6D–F.
- https://cdn.elifesciences.org/articles/60661/elife-60661-fig3-data2-v2.xlsx
Figure 4 with 6 supplements

The expression pattern of GA2ox4 in the shoot apical meristem during floral transition.
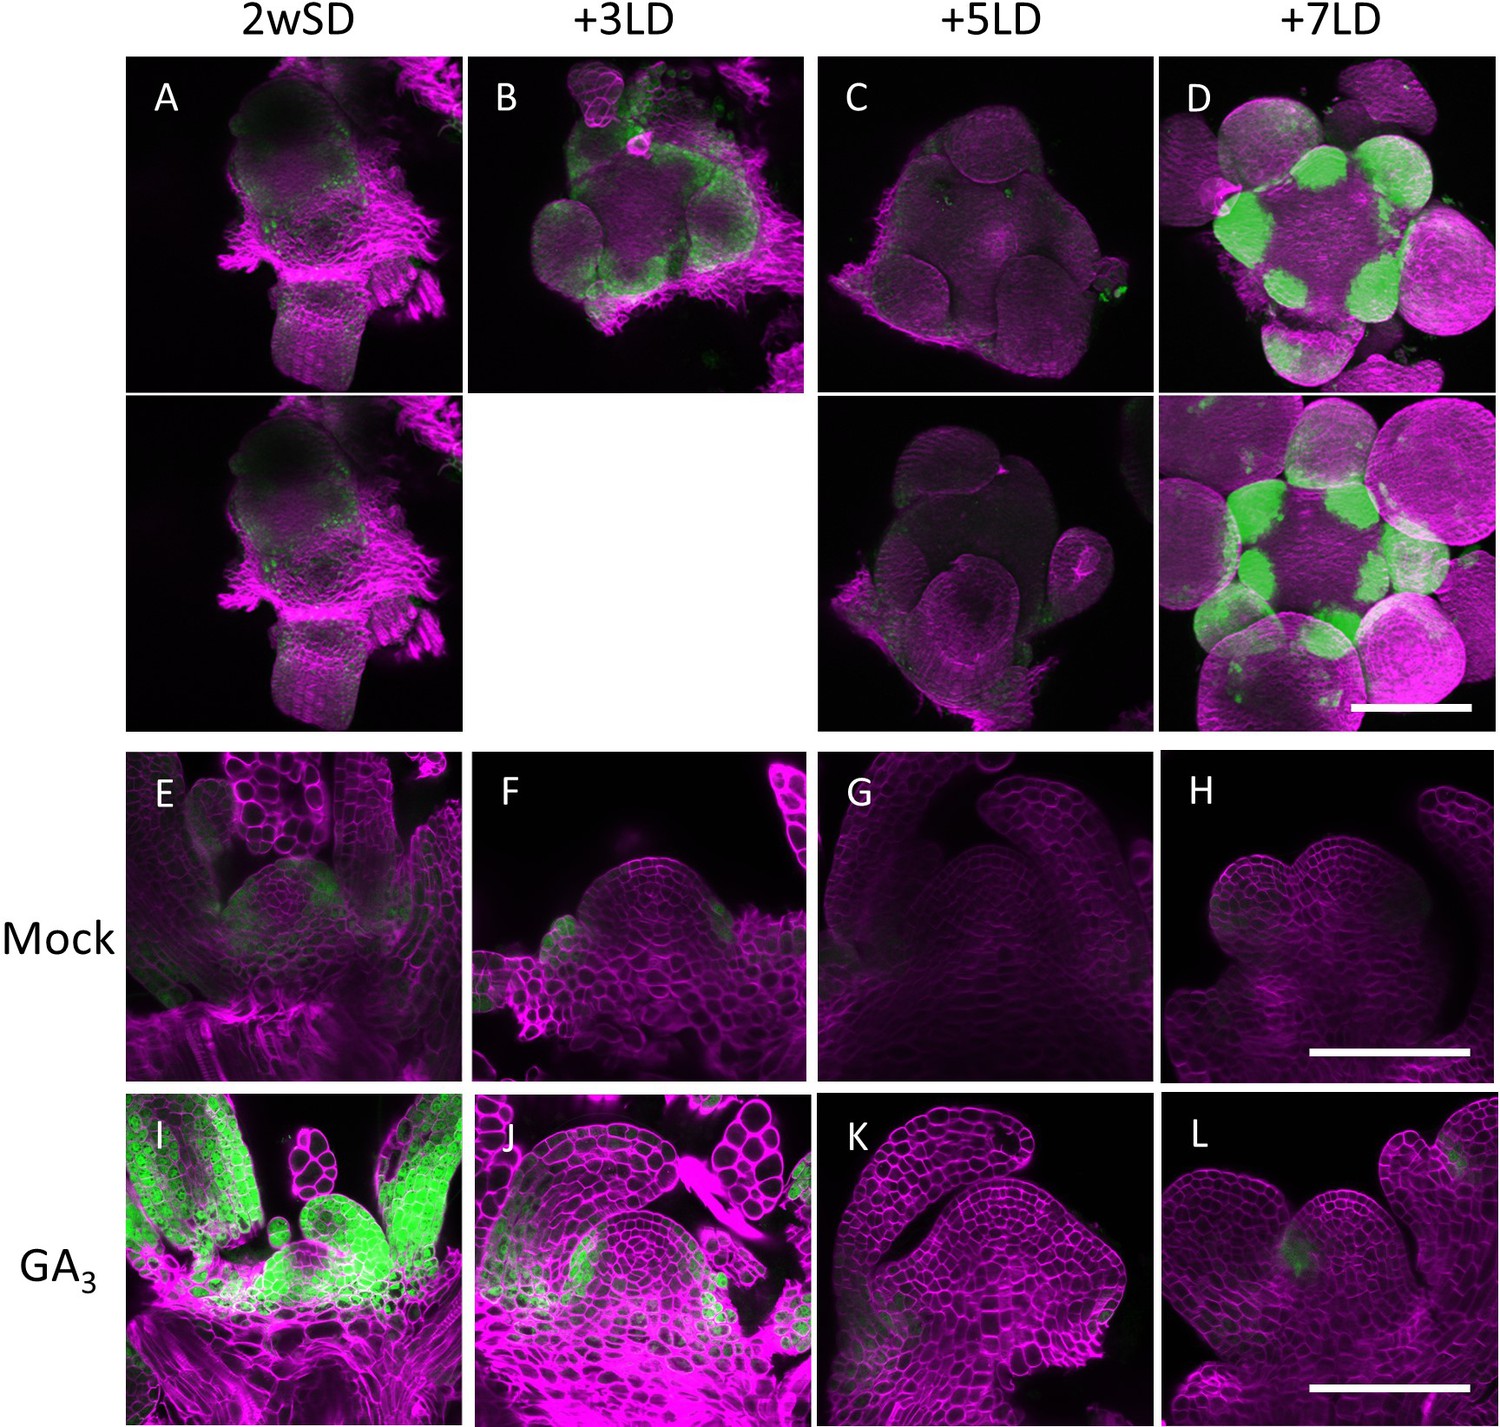
(A–D) Maximum intensity projection images of the meristems in GA2ox4::VENUS-GA2ox4 ga2ox4–3 line #8 (green), grown for 2 weeks in short days (SDs) (A) and then transferred to long days (LDs) for 3 (B), 5 (C), or 7 (D) days. (E–L) Longitudinal confocal images of GA2ox4::VENUS-GA2ox4 ga2ox4–3 line #2 (green) treated without (E–H) or with (I–L) 100 µM GA3 for 24 hr prior to harvesting. The plants were germinated and grown on growth medium for 2 weeks in SDs (E and I), and then transferred to LDs for 3 (F and J), 5 (G and K), or 7 (H and L) days. Cell walls were stained with Renaissance 2200 (magenta). Scale bars, 100 µm.
Figure 4—figure supplement 1

Contribution of C19-GA2oxs to flowering time.
(A) Phenotype of loss-of-function mutants for gibberellin (GA) metabolism enzyme genes grown under long days (LDs) for 31 days. (B–D) Leaf number at flowering of wild-type Col-0 (WT), ga2ox4–1, ga2ox4–3, ga2ox2–1 ga2ox4–1 ga2ox6–2 (ga2ox2 ga2ox4 ga2ox6), ga2ox1–1 ga2ox2–1 ga2ox3–1 ga2ox4–1 ga2ox6–2 (ga2ox quintuple), ga2ox7–2 ga2ox8 (ga2ox7 ga2ox8), and ga20ox2–1 (ga20ox2) grown under LDs. The number of rosette leaves (C), cauline leaves (D), and their sum (B) were counted. (E–S) Expression of GA2ox2, GA2ox4, and GA2ox6 at the shoot apices. Temporal expression pattern of GA2ox2 (E), GA2ox4 (J), and GA2ox6 (O) mRNA in wild-type apices grown for 3 weeks in short days (SDs) (3wSD) and then transferred to LDs (1, 3, 5, and 7 LD). Longitudinal confocal images of GA2ox2::VENUS-GA2ox2 in Col-0 (F–I), GA2ox4::VENUS-GA2ox4 in GA2ox4–3 (K–N), and GA2ox6::VENUS-GA2ox6 in Col-0 (P–S). Plants were germinated under LDs and harvested at ZT8 at 8 (F, K, P), 11 (G, L, Q), 14 (H, M, R), and 17 (I, N, S) days. (n ≥ 15; in panels B–D letters a–d indicate significant differences calculated with ANOVA, Tukey’s Honest Significant Difference [HSD] test p<0.001). Scale bars, 100 µm.
Figure 4—figure supplement 2
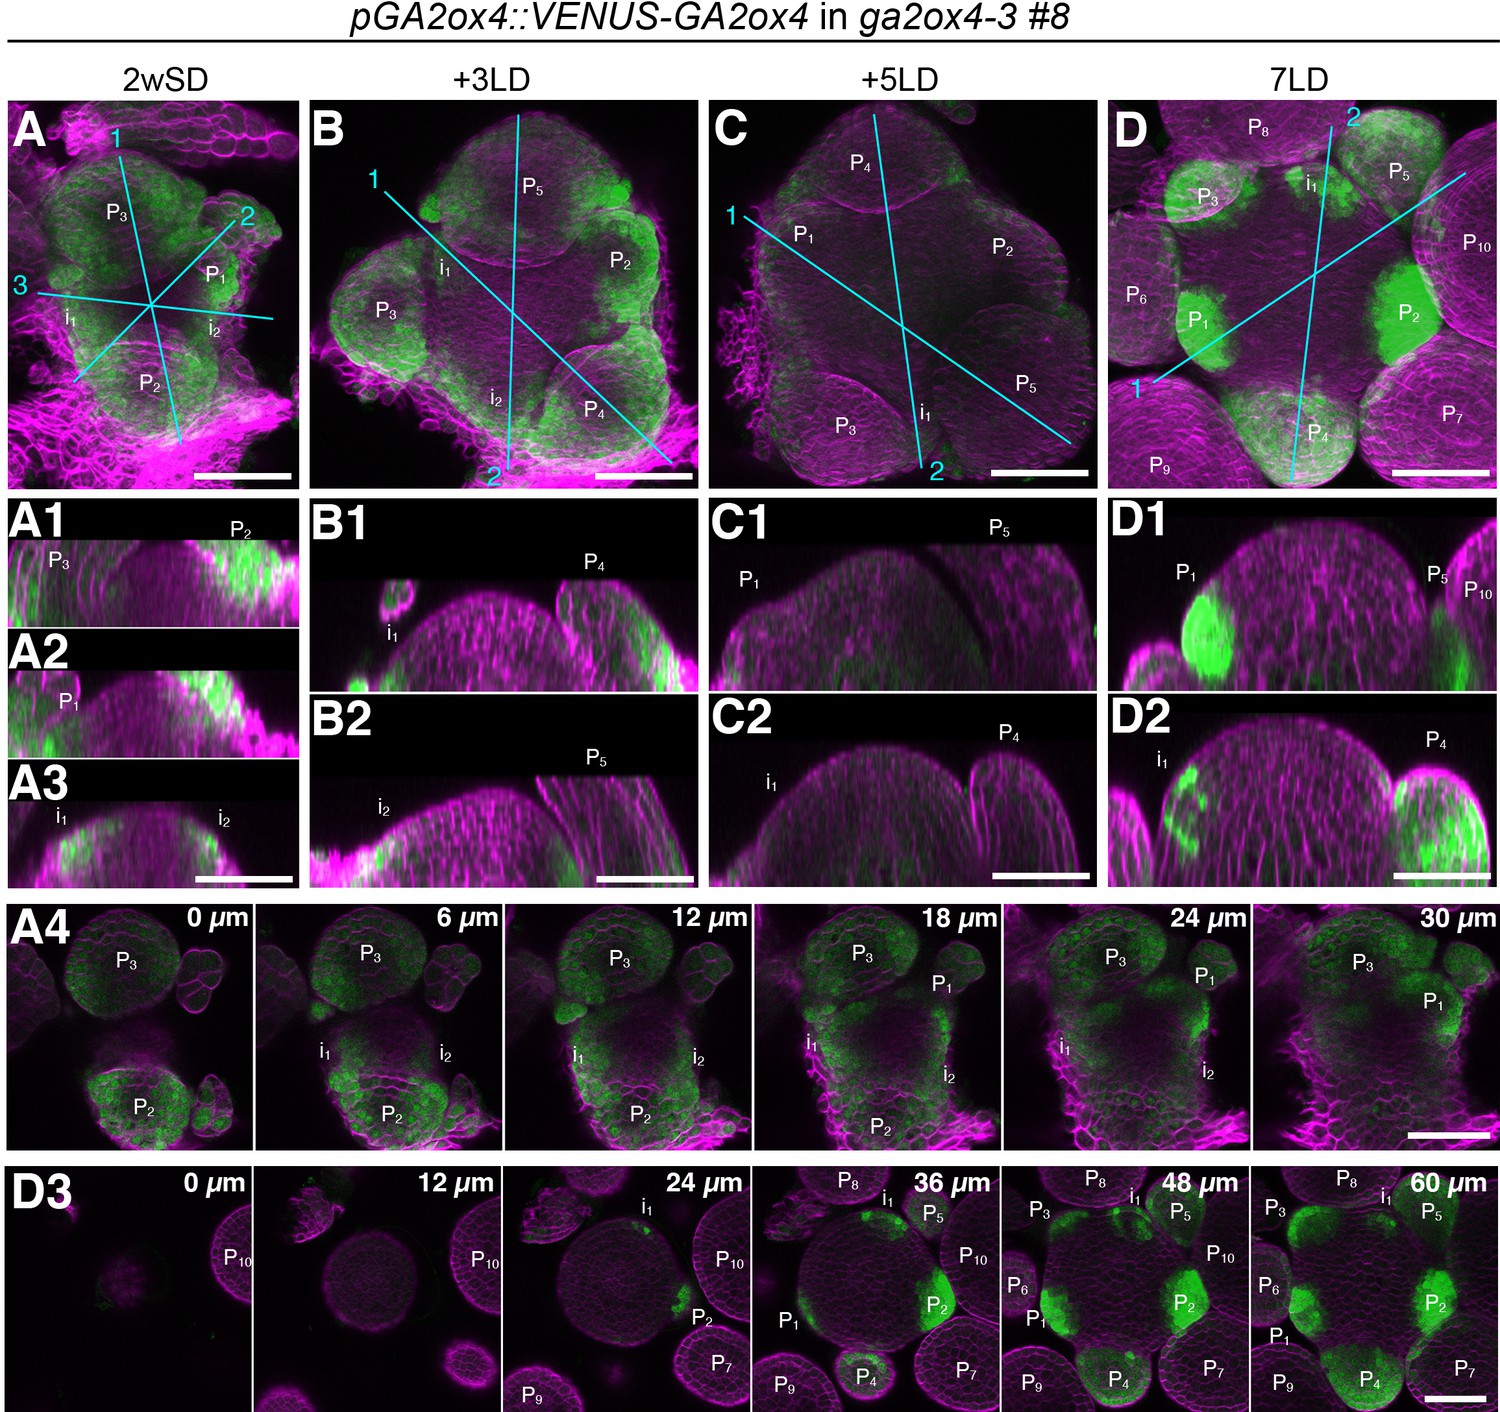
Expression pattern of VENUS-GA2ox4 during floral transition.
(A–D) Maximum intensity projection images of pGA2ox4::VENUS-GA2ox4 #8 meristem grown for 2 weeks in short days (SDs) (A), and transferred to long days (LDs) for 3 (B), 5 (C), or 7 (D) days. (A1–A3) Reslices of A with respective lines. (B1 and B2) Reslices of B with respective lines. (C1 and C2) Reslices of C with respective lines. (D1 and D2) Reslices of D with respective lines. (A4) Serial sections of A with 6 µm steps. (D3) Serial sections of D with 12 µm steps. The VENUS signal is detected in incipient primordia of 2wSD and 2wSD7LD plants. Cell walls were stained with Renaissance 2200 (magenta). Scale bars, 50 µm.
Figure 4—figure supplement 3
The expression pattern of GA2ox4 in the shoot apical meristem during floral transition.
(A–D) Additional replicates for Figure 4. Maximum intensity projection of the GA2ox4::VENUS-GA2ox4 ga2ox4–3 meristems line #8 (green), grown for 2 weeks in short days (SDs) (A) and then transferred to long days (LDs) for 3 (B), 5 (C), or 7 (D) days. (E–L) Longitudinal confocal images of GA2ox4::VENUS-GA2ox4 ga2ox4–3 line #2 (green) treated without (E–H) or with (I–L) 100 µM GA3 for 24 hr prior to harvesting. The plants were germinated and grown on growth medium for 2 weeks in SDs (E and I), and then transferred to LDs for 3 (F and J), 5 (G and K), or 7 (H and L) days. Cell walls were stained with Renaissance 2200 (magenta). Scale bars, 100 µm.
Figure 4—figure supplement 4
Expression pattern of VENUS-GA2ox4 in independent transformants.
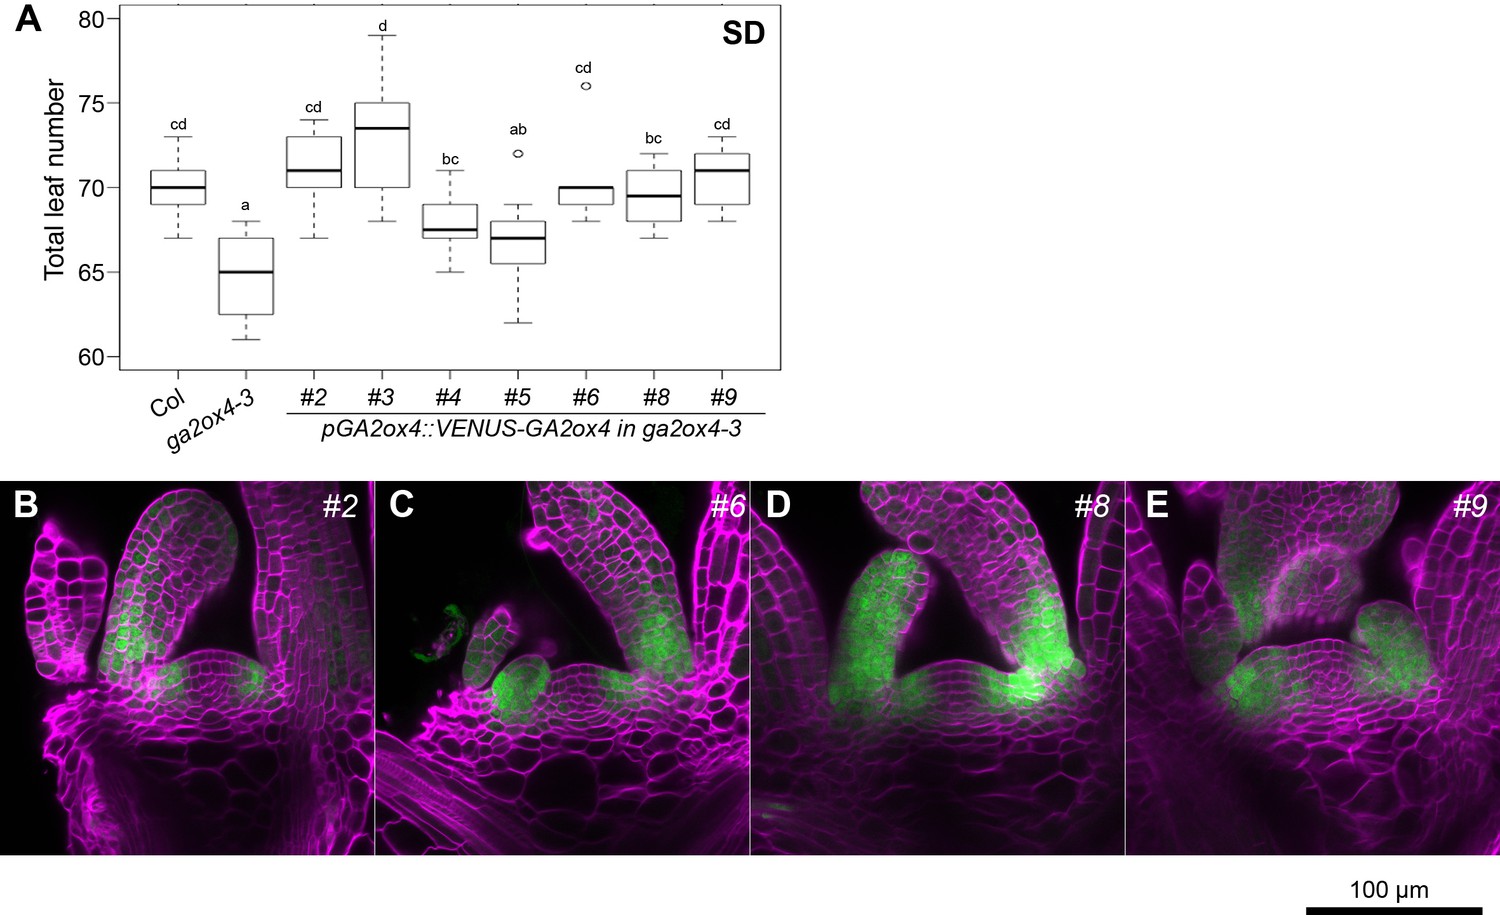
(A) Complementation of the ga2ox4–2 early-flowering phenotype by pGA2ox4::VENUS-GA2ox4 transgenes. Total leaf number under short days (SDs) was scored for Col-0, ga2ox4–3 and seven independent transformants of pGA2ox4::VENUS-GA2ox4. n ≥ 11; letters a–d indicate significant differences calculated with ANOVA, Tukey’s Honest Significant Difference (HSD) test p<0.001. (B–E) Expression pattern of pGA2ox4::VENUS-GA2ox4 (green) in independent transformants. Plants were germinated on soil and grown for 2 weeks in SDs. Cell walls were stained with Renaissance (magenta). Scale bar, 100 µm.
Figure 4—figure supplement 5
Expression pattern of GA2ox4 under continuous short days.
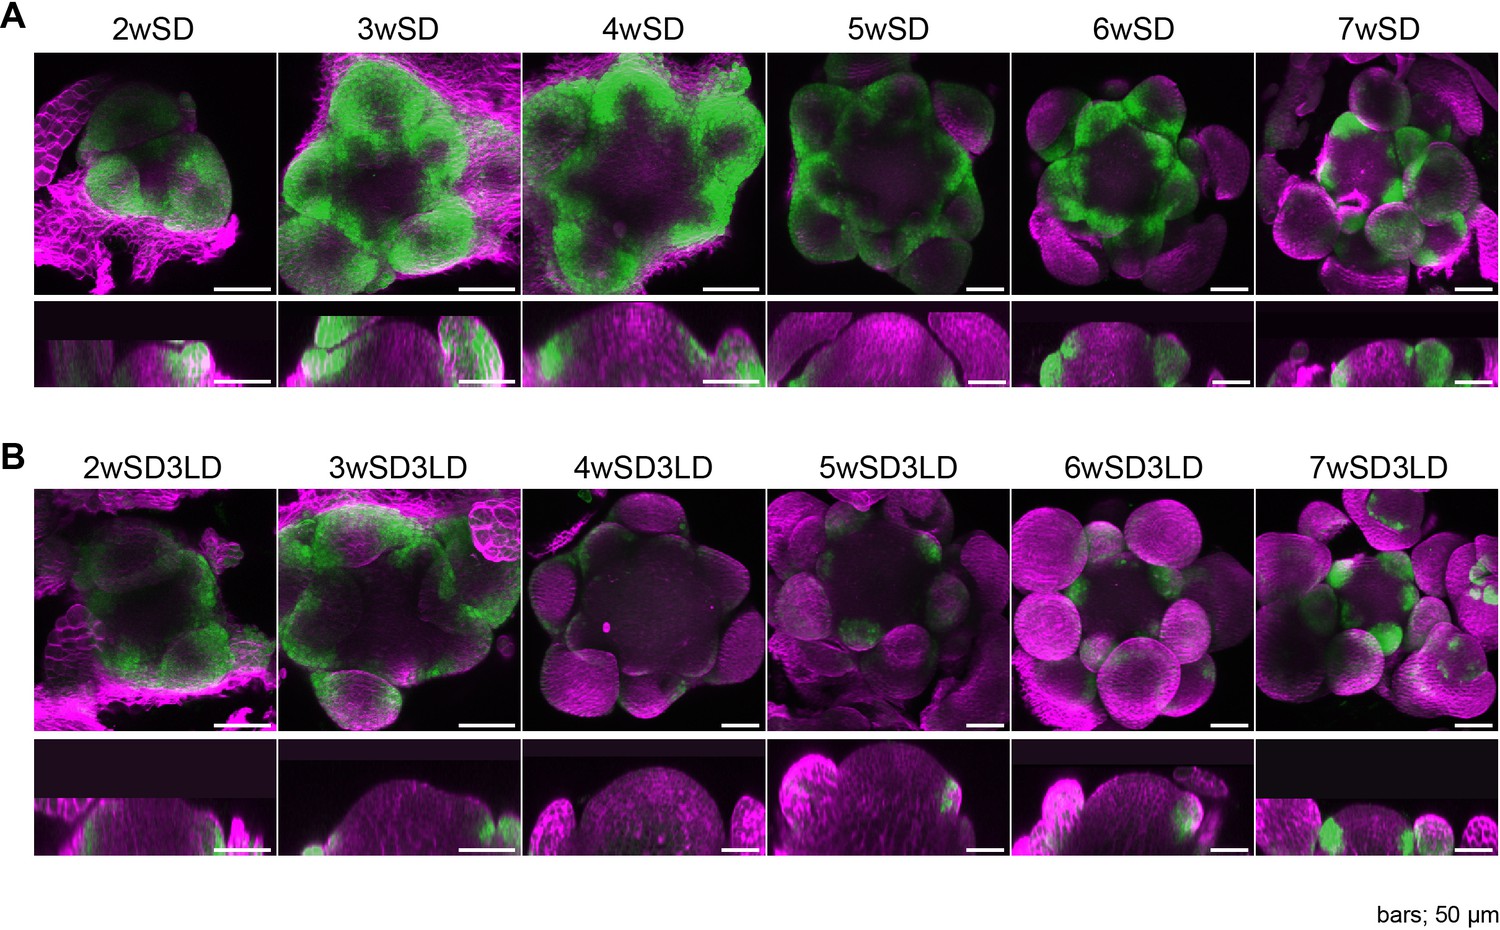
(A) Maximum intensity projection images of pGA2ox4::VENUS-GA2ox4 line #8 meristem grown under continuous short days (SDs). VENUS signal (green, top panel), Renaissance staining (magenta, middle panel), and merged image (bottom panel) are indicated. (B) Maximum intensity projection images of pGA2ox4::VENUS-GA2ox4 line #8 meristem 3 days after transfer to long days following each SD time point. Scale bar, 100 µm.
Figure 4—figure supplement 6

The number and size of cells in the meristem in ga2ox4.
(A) Heat-map quantification of cell area in the meristem region of Col-0, and ga2ox4–3 grown for 2 weeks in non-inductive short days (SDs) (2wSD) and transferred to inductive long days (LDs) for 3LDs (+3LD), 5LDs (+5LD), 7LDs (+7LD), or 9LDs (+9LD). Scale bar, 20 µm. (B–G) Quantification of the meristem area (B), the cell number (C), and the cell area in the meristem region (D–F) in Col-0, and ga2ox4–3 grown for 2 weeks in non-inductive SDs (2wSD) and transferred to inductive LDs for 3LDs (+3LD), 5LDs (+5LD), 7LDs (+7LD), or 9LDs (+9LD). Cell areas in the inner (E, zero to two cells from the center) and outer (F, three to five cells from the center) meristem region were analyzed separately. Letters a–f in panels B–F show significant differences between conditions and genotypes (p<0.05, using ANOVA followed by Tukey's pairwise multiple comparisons), n = 3–4 apices.
Figure 5
Spatial expression patterns of AP1 and GA2ox4 during floral transition.
(A–H) Expression of AP1::AP1-GFP (green) and GA2ox4::VENUS-GA2ox4 #8 (Magenta) grown under long days for 14 (A, B, E, and F) and 18 (C, D, G, and H) days. Maximum intensity projections (A–D) and longitudinal sections are shown. Scale bar, 100 µm.
Figure 6 with 1 supplement
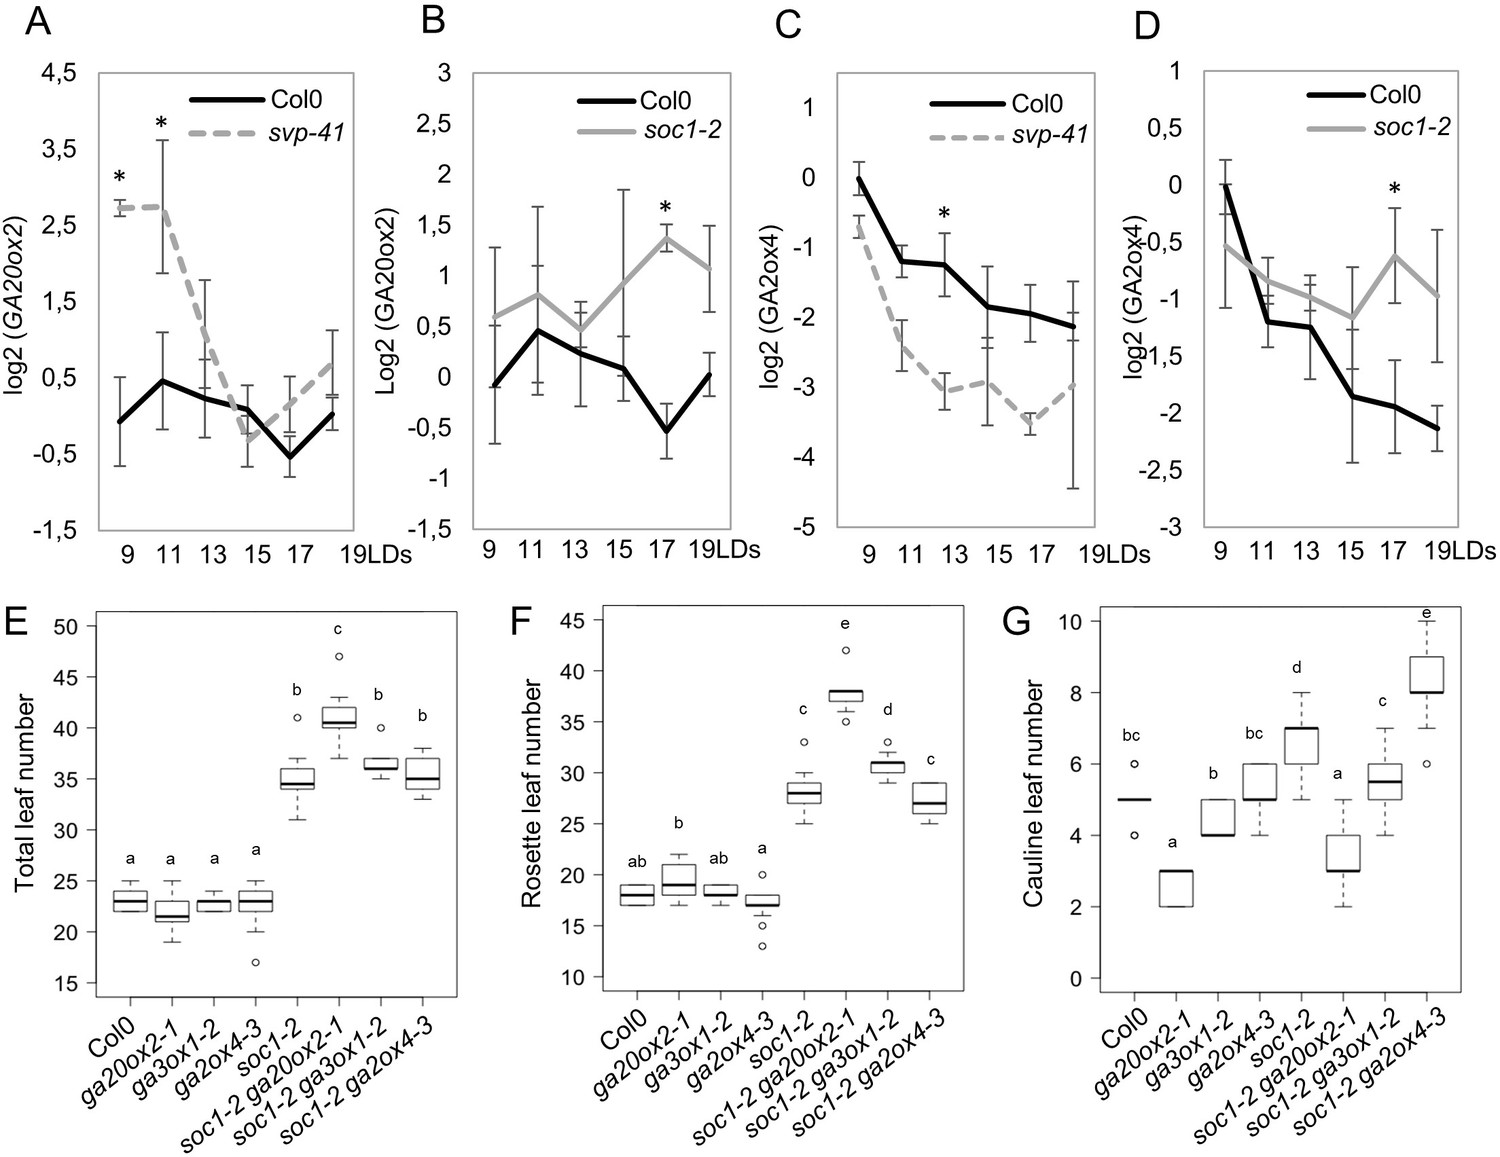
Regulation of GA20ox2 and GA2ox4 by SOC1 and SHORT VEGETATIVE PHASE (SVP).
(A and B) Temporal expression pattern of GA20ox2 mRNA in apices of wild type (A and B), svp-41 (A), and soc1-2 (B). (C and D) Temporal expression pattern of GA2ox4 mRNA in apices of wild type (C and D), svp-41 (C), and soc1-2 (D). All samples were harvested 8 hr after dawn. Asterisks show significant differences between conditions in the comparisons indicated (p<0.05, using ANOVA followed by Tukey's pairwise multiple comparisons). (E–G) Genetic interaction tests between mutants of GA metabolism genes and soc1. The number of total leaves (E), rosette leaves (F), and cauline leaves (G) were scored for wild type (Col-0), ga20ox2–1, ga3ox1–2, ga2ox4–3, soc1-2, soc1-2 ga20ox2–1, soc1-2 ga3ox1–2, and soc1-2 ga2ox4–3 (n ≥ 13; a–e indicate significant differences calculated with ANOVA, Tukey’s Honest Significant Difference (HSD) test; p<0.001).
-
Figure 6—source data 1
Original RT-qPCR data of different genotypes for Figure 6A–D and Figure 6—figure supplement 1.
- https://cdn.elifesciences.org/articles/60661/elife-60661-fig6-data1-v2.xlsx
-
Figure 6—source data 2
Original data of leaf number of different genotypes for Figure 6E–G.
- https://cdn.elifesciences.org/articles/60661/elife-60661-fig6-data2-v2.xlsx
Figure 6—figure supplement 1
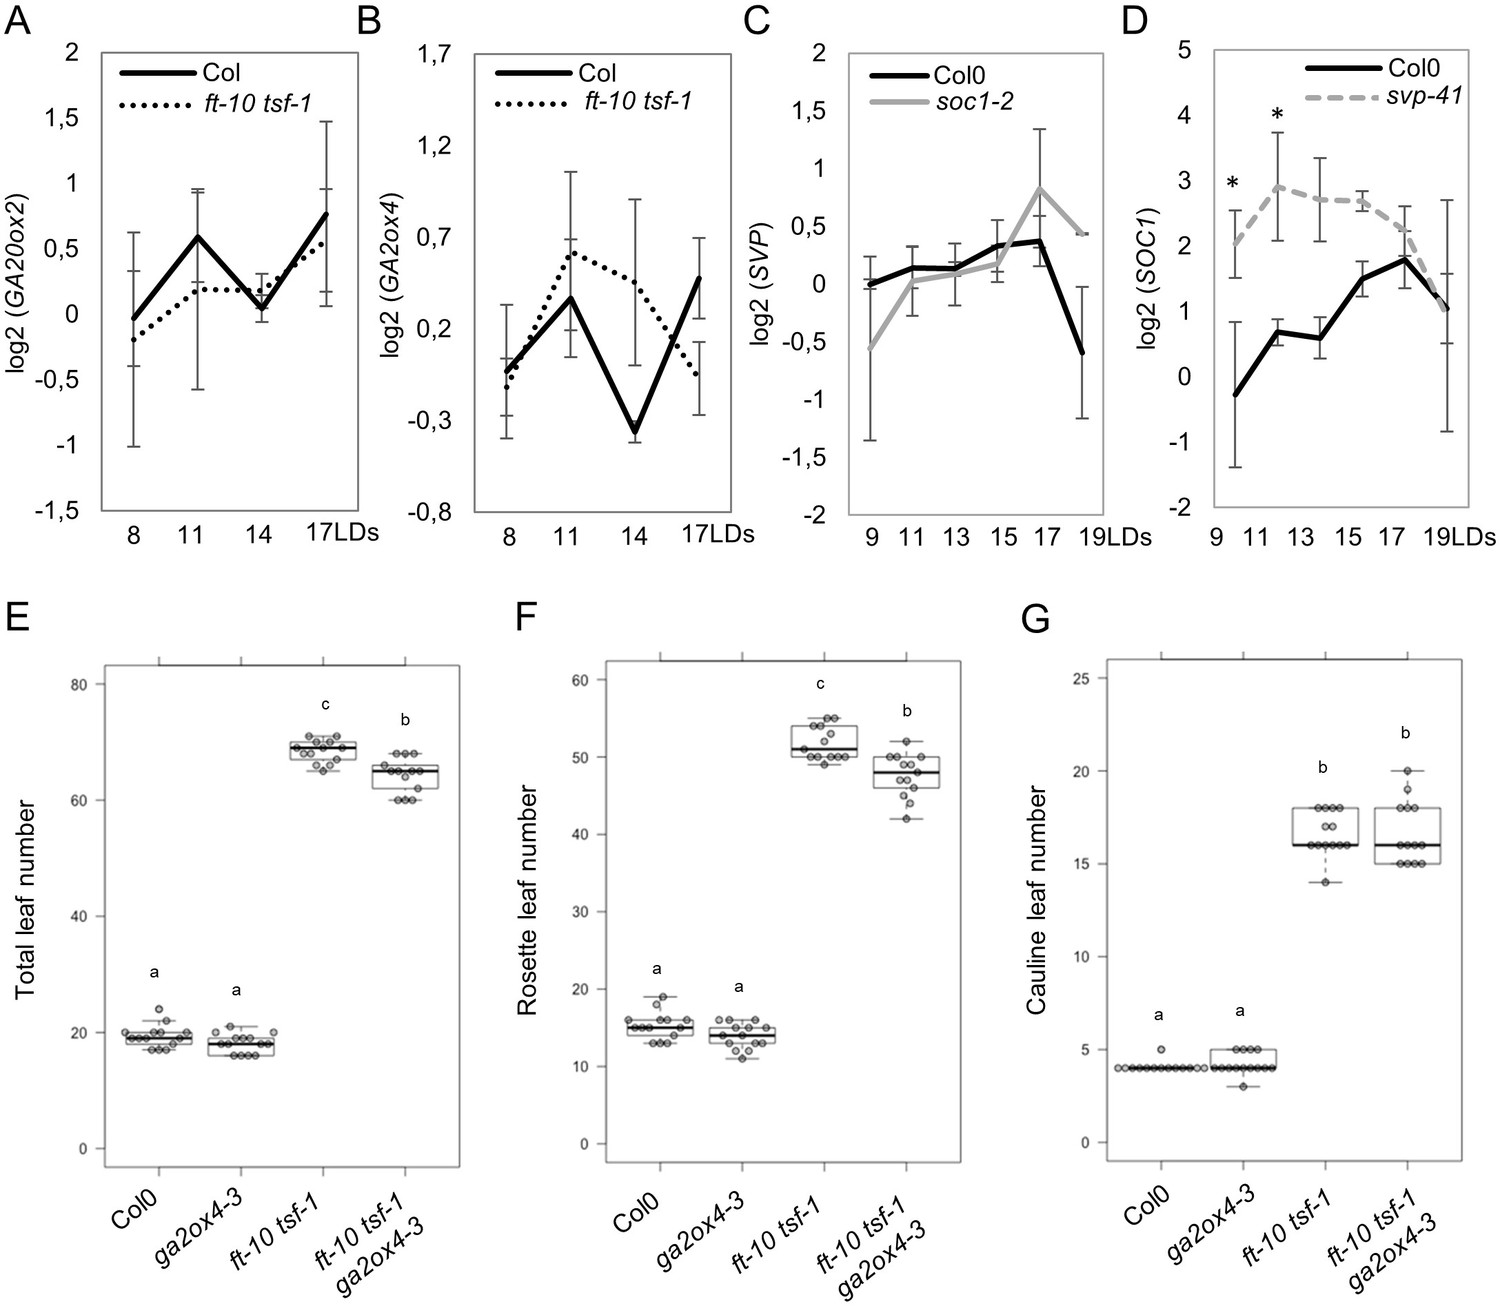
Effect of photoperiodic mutants on transcripts of gibberellin (GA) metabolism genes and their genetic interaction.
(A and B) Transcript levels of GA20ox2 (A) and GA2ox4 (B) in the apices of wild-type and ft-10 tsf-1. (C and D) Transcript levels of SHORT VEGETATIVE PHASE (SVP) (C) or SOC1 (D) in the apices of wild-type and soc1-2 (C) or svp-41 (D), respectively. The shoot apices were harvested at ZT8 h. Asterisks show significant differences between conditions (p<0.05, using ANOVA followed by Tukey's pairwise multiple comparisons). (E–G) Effect of ga2ox4 mutation on the ft-10 tsf-1 double mutant phenotype. The numbers of total leaves (E), rosette leaves (F), and cauline leaves (G) were scored for wild type (Col-0), ga2ox4–3, ft-10 tsf-1, and ft-10 tsf-1 ga2ox4–3 (n ≥ 14; letters a–c in panels E–G show statistical differences calculated with ANOVA, Tukey’s Honest Significant Difference (HSD) test; p<0.001).
Figure 7
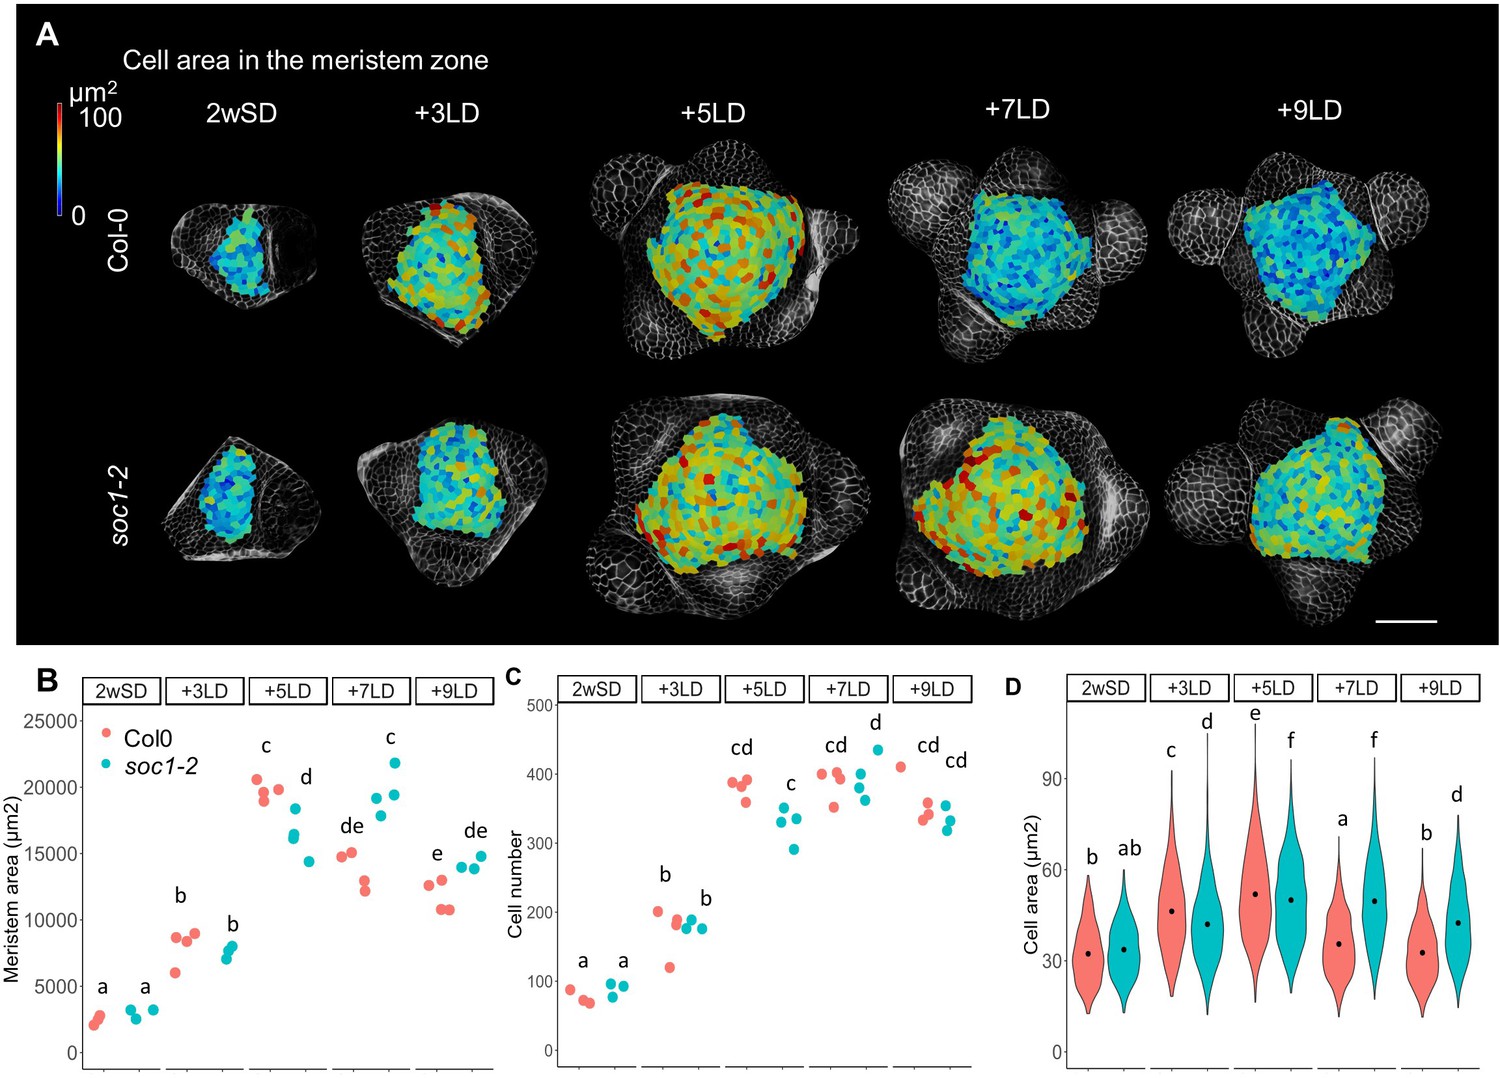
Protracted doming of the soc1 mutant in response to long days (LDs).
(A) Heat-map quantification of cell area in the meristem region of Col-0, and soc1-2 grown for 2 weeks in non-inductive short days (SDs) (2wSD) and transferred to inductive LDs for 3LDs (+3LD), 5LDs (+5LD), 7LDs (+7LD), or 9LDs (+9LD). Scale bars, 50 µm. (B–D) Quantification of the meristem area (B), the cell number (C), and the cell area in the meristem region (D) in Col-0, and soc1-2 grown for 2 weeks in non-inductive SDs (2wSD) and transferred to inductive LDs for 3LDs (+3LD), 5LDs (+5LD), 7LDs (+7LD), or 9LDs (+9LD). Letters a–f in panels B–F show significant differences between conditions and genotypes (p<0.05, using ANOVA followed by Tukey's pairwise multiple comparisons), n = 3–4 apices.
-
Figure 7—source data 1
Original data of meristem area and cell number of each genotype for Figure 7B and C.
- https://cdn.elifesciences.org/articles/60661/elife-60661-fig7-data1-v2.xlsx
-
Figure 7—source data 2
Original data of cell size of each genotype for Figure 7D.
- https://cdn.elifesciences.org/articles/60661/elife-60661-fig7-data2-v2.xlsx
Figure 8
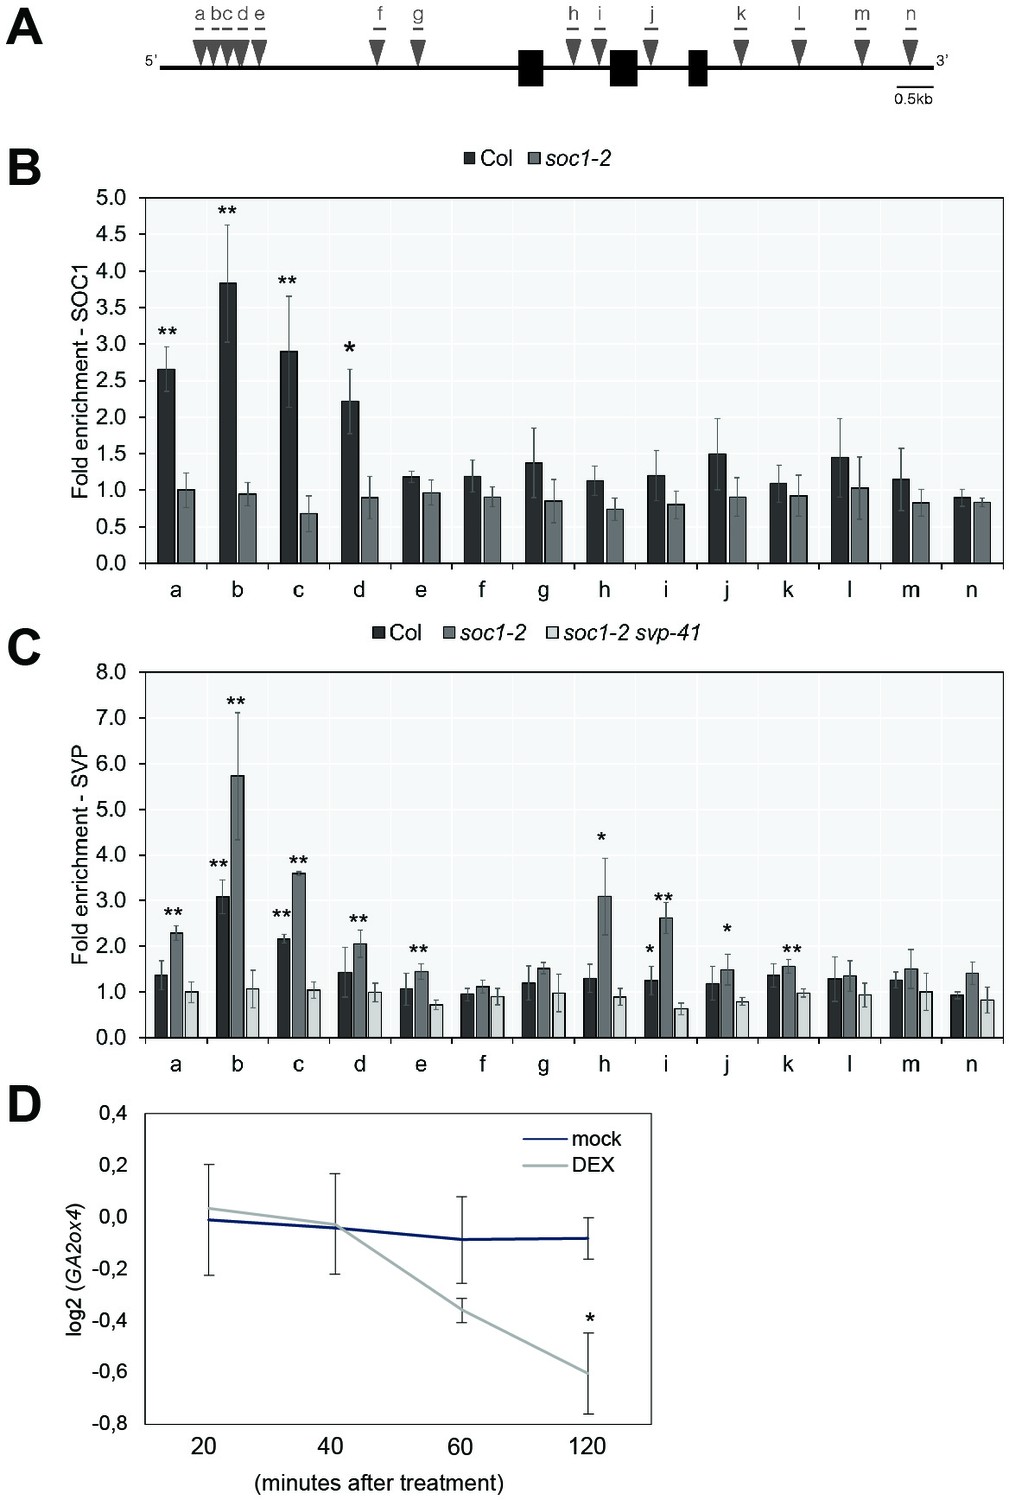
GA2ox4 is directly regulated by SOC1 and SHORT VEGETATIVE PHASE (SVP).
(A) Schematic representation of the GA2ox4 locus. Exons are represented by black boxes, introns by white boxes, and UTRs are represented as gray boxes. Consensus binding sites (CArG-boxes) are indicated as triangles. (B) ChIP analysis of SOC1 binding to the CArG-boxes at the GA2ox4 locus. (C) ChIP analysis of SVP binding to the CArG-boxes at the GA2ox4 locus (mean ± SD, *p<0.05, **p<0.01, paired t-test). (D) Transcript level of GA2ox4 in 35S::SOC1:GR plants after mock or DEX treatment. An asterisk shows significant differences between conditions at the indicated time points (p<0.05, using ANOVA followed by Tukey's pairwise multiple comparisons).
-
Figure 8—source data 1
Original ChIP-PCR data for Figure 8.
- https://cdn.elifesciences.org/articles/60661/elife-60661-fig8-data1-v2.xlsx
Figure 9 with 2 supplements
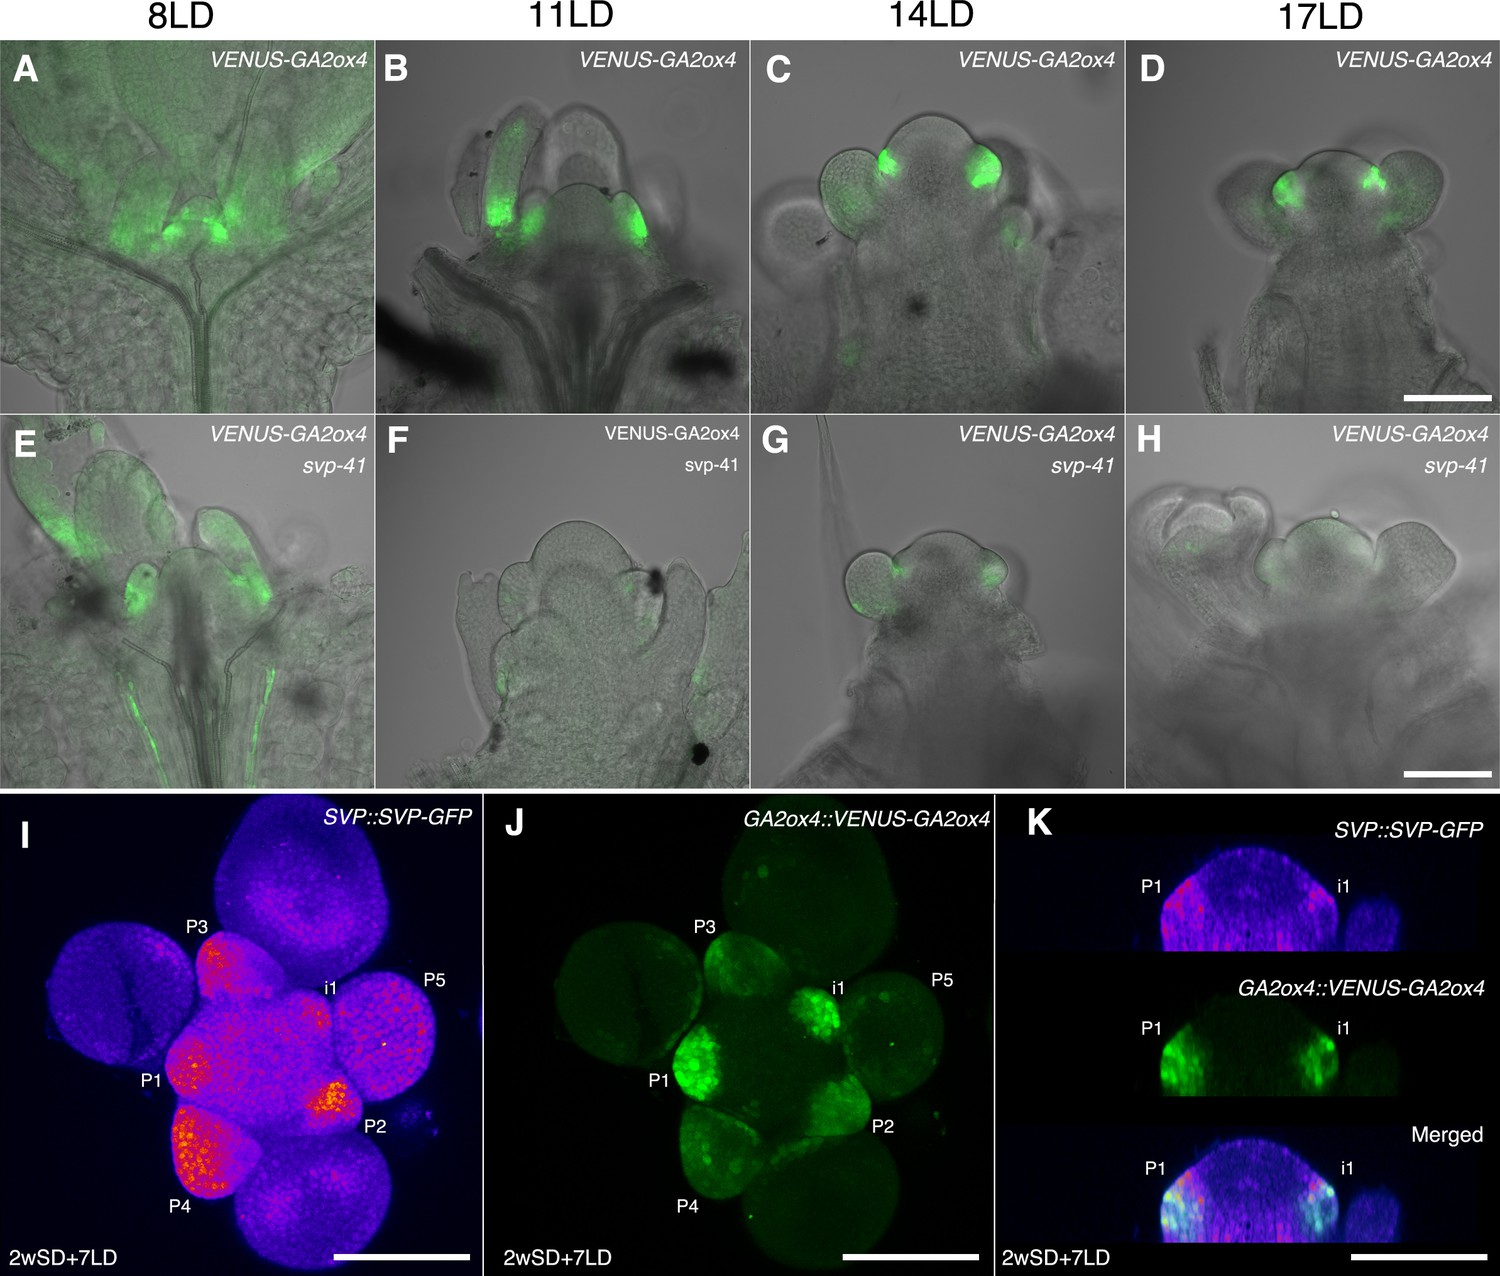
SHORT VEGETATIVE PHASE (SVP) regulates GA2ox4 expression in the floral primordia.
(A–H) Confocal imaging of longitudinal sections of meristems expressing pGA2ox4::VENUS-GA2ox4 in the wild-type (A–D) and svp-41 (E–H) backgrounds. VENUS-GA2ox4 is detected at a low level in the floral primordia of svp-41 after floral transition (F–H). (I–K) Expression of SVP::SVP-GFP (heat map) and GA2ox4::VENUS-GA2ox4 #8 (green) grown for 2 weeks in short days (SDs) and transferred to long day for 7 days. Maximum intensity projection (I and J) and optical sections (thickness 0.69 µm, K) are shown. Scale bar, 100 µm. At least four meristems were observed.
Figure 9—figure supplement 1
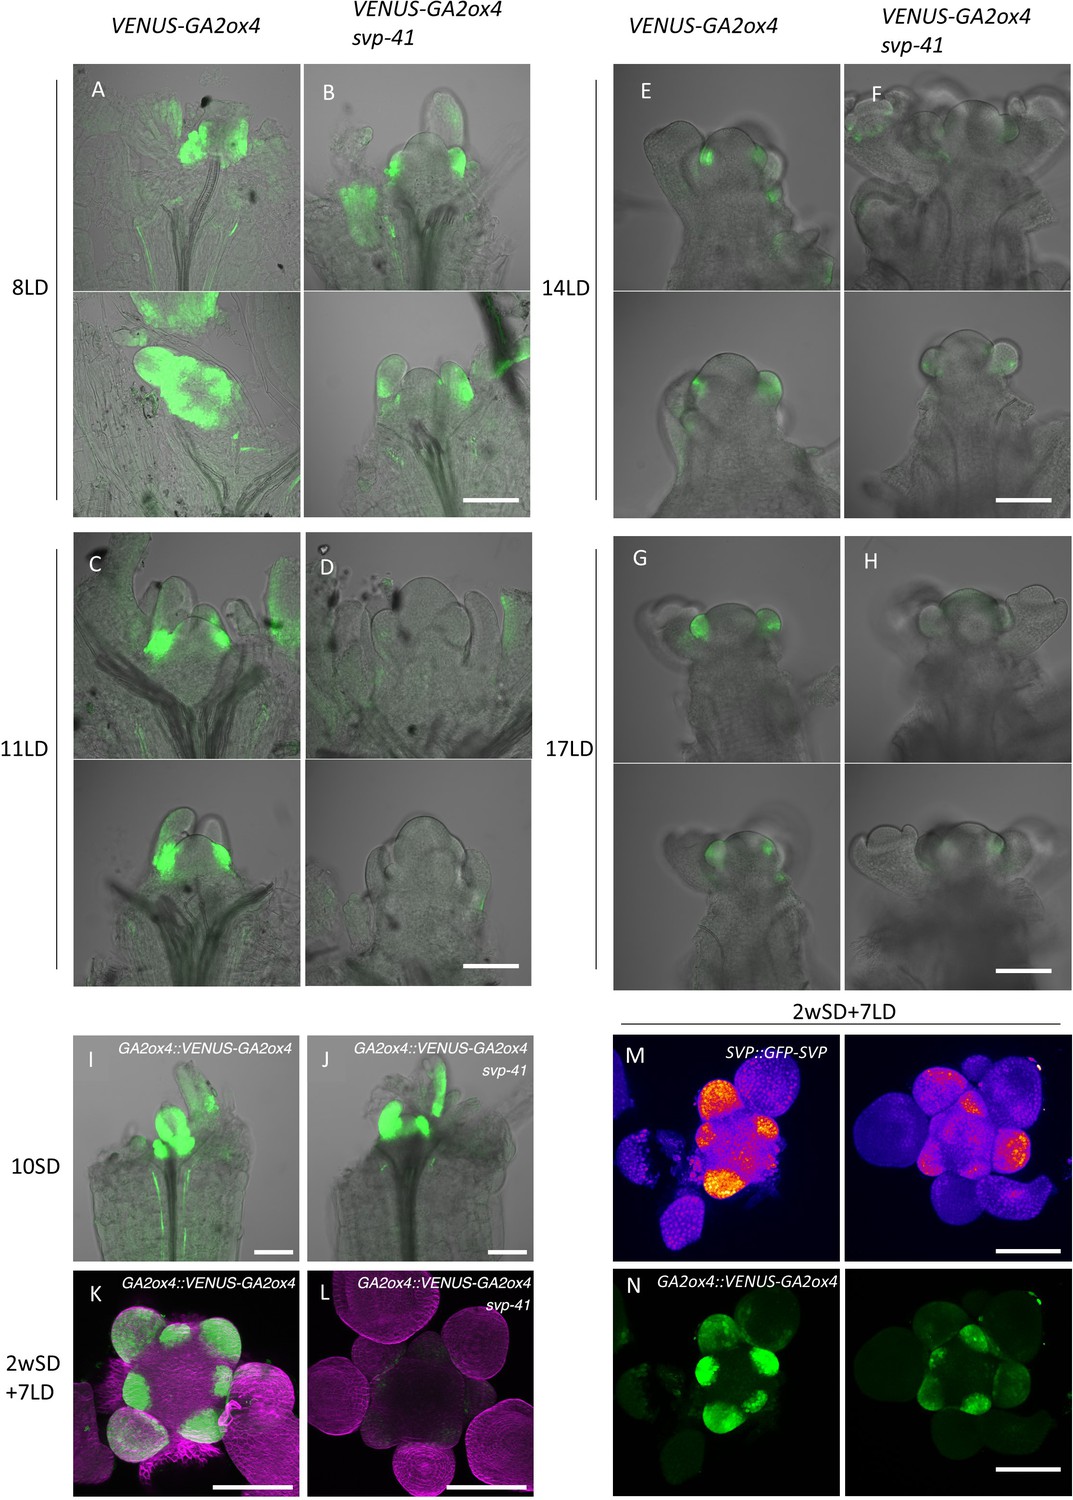
SHORT VEGETATIVE PHASE (SVP) enhances GA2ox4 expression in the floral primordia.
(A–H) Additional replicates for Figure 9A–H. Longitudinal confocal sections in the pGA2ox4::VENUS-GA2ox4 meristems in the wild-type (A, C, E, and G) and svp-41 (B, D, F, and H) backgrounds. (I and J) Expression pattern of pGA2ox4::VENUS-GA2ox4 in wild-type (A) or svp-41 (B) backgrounds during the vegetative stage. Plants were germinated on soil and grown for 10 short days (SDs). Strong VENUS signal was detected in both genotypes. (K and L) Expression pattern of pGA2ox4::VENUS-GA2ox4 in wild-type (C) or svp-41 (D) backgrounds during the reproductive stage. Plants were germinated on soil and grown under SDs for 2 weeks and in long days (LDs) for 7 days. VENUS signal is downregulated in floral primordia in svp-41. (M and N) Additional replicates for Figure 9I–K. Maximum intensity projection of the SVP::SVP-GFP (heat map) and GA2ox4::VENUS-GA2ox4 #8 (green) grown for 2 weeks in SDs and transferred to LD for 7 days. Scale bar, 100 µm.
Figure 9—figure supplement 2
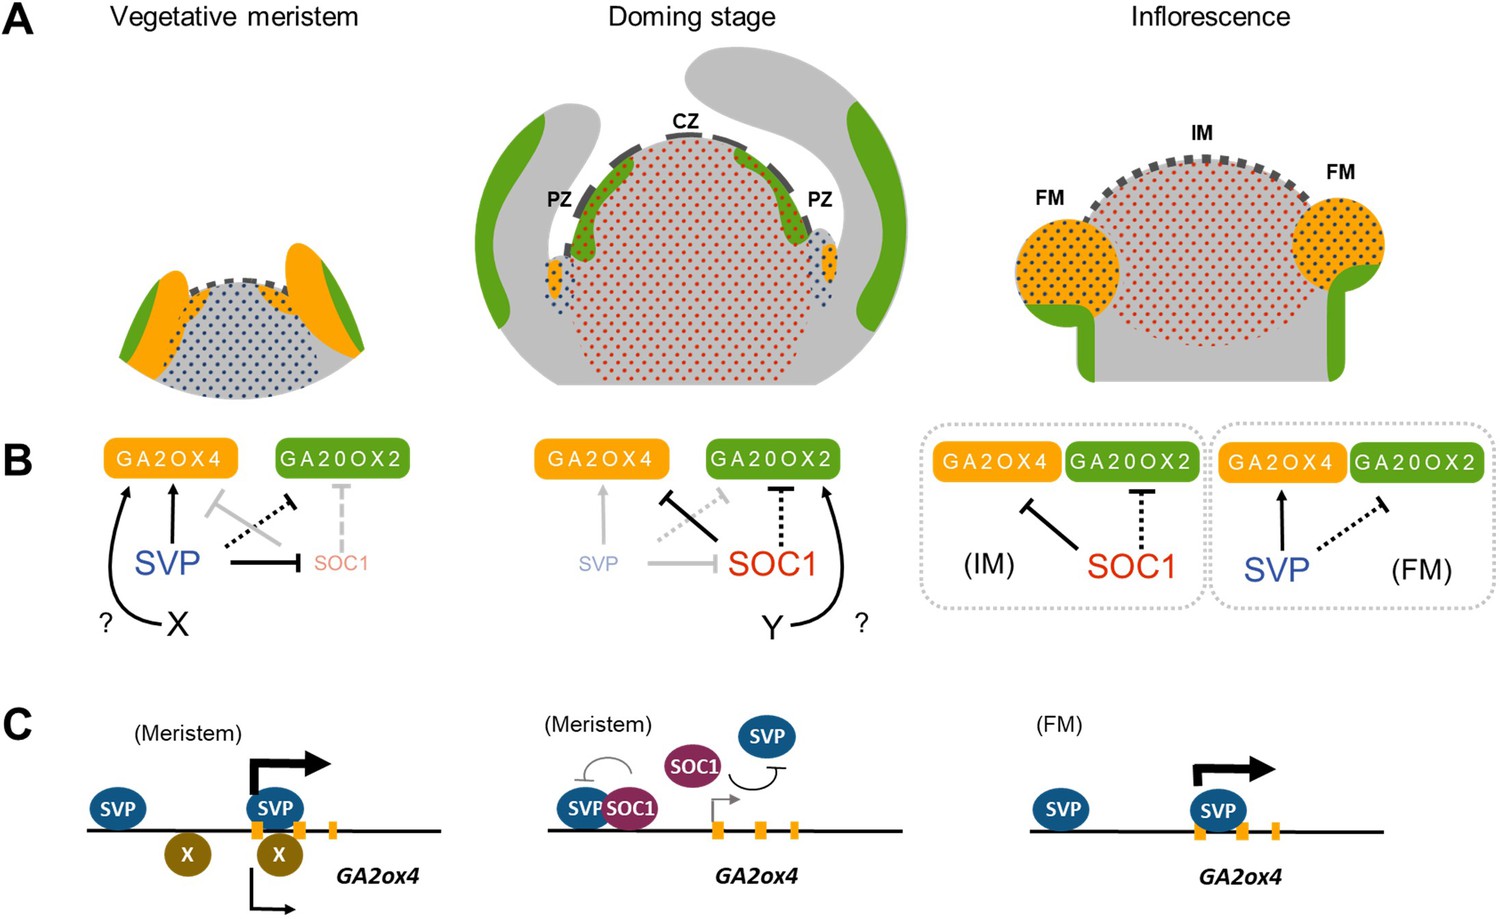
Working model summarizing the dynamics of GA2ox4 and GA20ox2 expression in the shoot apical meristem (SAM) during floral transition.
(A) Spatiotemporal patterns of expression of GA2ox4, GA20ox2, SHORT VEGETATIVE PHASE (SVP), and SOC1 in the SAM at the vegetative stage (left), doming stage (middle), and in the inflorescence (right). Regions of accumulation of GA2ox4 (yellow), GA20ox2 (green), SVP (blue dots), and SOC1 (red dots) are shown. Squares represent the increase in cell size observed in the L1 of the SAM at the doming stage. (B) Schematic representation of GA2ox4 and GA20ox2 regulation by SVP and SOC1 at the shoot apex at vegetative stage, doming stage, and in the inflorescence. SVP activates GA2ox4 at the vegetative stage, but GA2ox4 is still present in the vegetative meristem of the svp mutant suggesting the presence of an unknown factor X inducing GA2ox4 specifically at this stage. The activation of GA20ox2 in the PZ of the L1 at doming stage suggests the presence of a factor Y inducing GA20ox2 specifically there. (C) Dynamics of the direct binding of SVP and SOC1 to the GA2ox4 locus in the vegetative meristem (left), transition meristem (middle), and inflorescence (right). CZ: central zone, PZ: peripheral zone, IM: inflorescence meristem, and FM: floral meristem. Plain arrow indicates direct binding while dashed arrow indicates non-direct interaction.
Tables
Key resources table
| Reagent type (species) or resource | Designation | Source or reference | Identifiers | Additional information |
|---|---|---|---|---|
| Genetic reagent (Arabidopsis thaliana) | ga2ox1–1 (Col-0) | Rieu et al., 2008a | ||
| Genetic reagent (Arabidopsis thaliana) | ga2ox2–1 (Col-0) | Rieu et al., 2008a | ||
| Genetic reagent (Arabidopsis thaliana) | ga2ox3–1 (Col-0) | Rieu et al., 2008a | ||
| Genetic reagent (Arabidopsis thaliana) | ga2ox4–1 (Col-0) | Rieu et al., 2008a | ||
| Genetic reagent (Arabidopsis thaliana) | ga2ox4–3 (Col-0) | Rieu et al., 2008a | ||
| Genetic reagent (Arabidopsis thaliana) | ga2ox6–2 (Col-0) | Rieu et al., 2008a | ||
| Genetic reagent (Arabidopsis thaliana) | ga2ox7–2 (Col-0) | Magome et al., 2008 | ||
| Genetic reagent (Arabidopsis thaliana) | ga2ox8 (WiscDsLox263B11) (Col-0) | Mateos et al., 2015 | ||
| Genetic reagent (Arabidopsis thaliana) | ga20ox2–1 (Col-0) | Rieu et al., 2008b | ||
| Genetic reagent (Arabidopsis thaliana) | ga3ox3–1 (Col-0) | Mitchum et al., 2006 | ||
| Genetic reagent (Arabidopsis thaliana) | soc1-2 (Col-0) | Lee et al., 2000 | ||
| Genetic reagent (Arabidopsis thaliana) | svp-41 (Col-0) | Hartmann et al., 2000 | ||
| Genetic reagent (Arabidopsis thaliana) | ft-10 tsf-1 (Col-0) | Jang et al., 2009 | ||
| Genetic reagent (Arabidopsis thaliana) | KNAT1::GA2ox7 (Col-0) | Porri et al., 2012 | ||
| Genetic reagent (Arabidopsis thaliana) | AP1::AP1-GFP (Col-0) | Urbanus et al., 2009 | ||
| Genetic reagent (Arabidopsis thaliana) | SVP::SVP-GFP (Col-0) | Gregis et al., 2013 | ||
| Genetic reagent (Arabidopsis thaliana) | 35S::SOC1:GR soc1-1 (Ler-0) | Hyun et al., 2016 | ||
| Genetic reagent (Arabidopsis thaliana) | GA20ox2::VENUS-GA20ox2 (Col-0) | This study | See Materials and methods, section ‘Plasmid construction and plant transformation’ | |
| Genetic reagent (Arabidopsis thaliana) | GA2ox2::VENUS-GA2ox2 (Col-0) | This study | See Materials and methods, section ‘Plasmid construction and plant transformation’ | |
| Genetic reagent (Arabidopsis thaliana) | GA2ox4::VENUS-GA2ox4 (Col-0) | This study | See Materials and methods, section ‘Plasmid construction and plant transformation’ | |
| Genetic reagent (Arabidopsis thaliana) | GA2ox6::VENUS-GA2ox6 (Col-0) | This study | See Materials and methods, section ‘Plasmid construction and plant transformation’ | |
| Sequence-based reagent | Various oligonucleotides | This paper | Primers for cloning | See Supplementary file 1 |
| Sequence-based reagent | Various oligonucleotides | This paper | Primers for RT-qPCR | See Supplementary file 2 |
| Sequence-based reagent | Various oligonucleotides | This paper | Primers for ChIP-qPCR | See Supplementary file 4 |
| Chemical compound, drug | Renaissance 2200 | Musielak et al., 2015 | ||
| Software, algorithm | RStudio Team, 2015 | RRID:SCR_000432 | ||
| Software, algorithm | MorphoGraphX | https://morphographx.org/ | ||
| Other | Fiji | doi:10.1038/nmeth.2019 | RRID:SCR_002285 |
Additional files
-
Supplementary file 1
Primers used for cloning in this study.
- https://cdn.elifesciences.org/articles/60661/elife-60661-supp1-v2.xlsx
-
Supplementary file 2
Primers used for RT-qPCR in this study.
- https://cdn.elifesciences.org/articles/60661/elife-60661-supp2-v2.xlsx
-
Supplementary file 3
Putative CArG-boxes and positions in GA2ox4.
- https://cdn.elifesciences.org/articles/60661/elife-60661-supp3-v2.xlsx
-
Supplementary file 4
Primers used for ChIP-qPCR for GA2ox4.
- https://cdn.elifesciences.org/articles/60661/elife-60661-supp4-v2.xlsx
-
Transparent reporting form
- https://cdn.elifesciences.org/articles/60661/elife-60661-transrepform-v2.pdf
Download links
A two-part list of links to download the article, or parts of the article, in various formats.
Downloads (link to download the article as PDF)
Open citations (links to open the citations from this article in various online reference manager services)
Cite this article (links to download the citations from this article in formats compatible with various reference manager tools)
Regulation of shoot meristem shape by photoperiodic signaling and phytohormones during floral induction of Arabidopsis
eLife 9:e60661.
https://doi.org/10.7554/eLife.60661


