Convergence of cortical types and functional motifs in the human mesiotemporal lobe
- Multimodal Imaging and Connectome Analysis Lab, McConnell Brain Imaging Centre, Montreal Neurological Institute and Hospital, McGill University, Canada
- Brain and Mind Institute, University of Western Ontario, Canada
- Translational Neuromodeling Unit, Institute for Biomedical Engineering, University of Zurich & ETH Zurich, Switzerland
- Institute of Neuroscience and Medicine (INM-7: Brain and Behaviour), Research Centre Jülich, Germany
- Institute of Systems Neuroscience, Heinrich Heine University Düsseldorf, Germany
- Neuroimaging Of Epilepsy Laboratory, McConnell Brain Imaging Centre, Montreal Neurological Institute and Hospital, McGill University, Canada
- McConnell Brain Imaging Centre, Montreal Neurological Institute and Hospital, McGill University, Canada
- McGill Centre for Integrative Neuroscience, McGill University, Canada
- Monash University, Australia
- University of York, United Kingdom
Figures
Figure 1 with 2 supplements
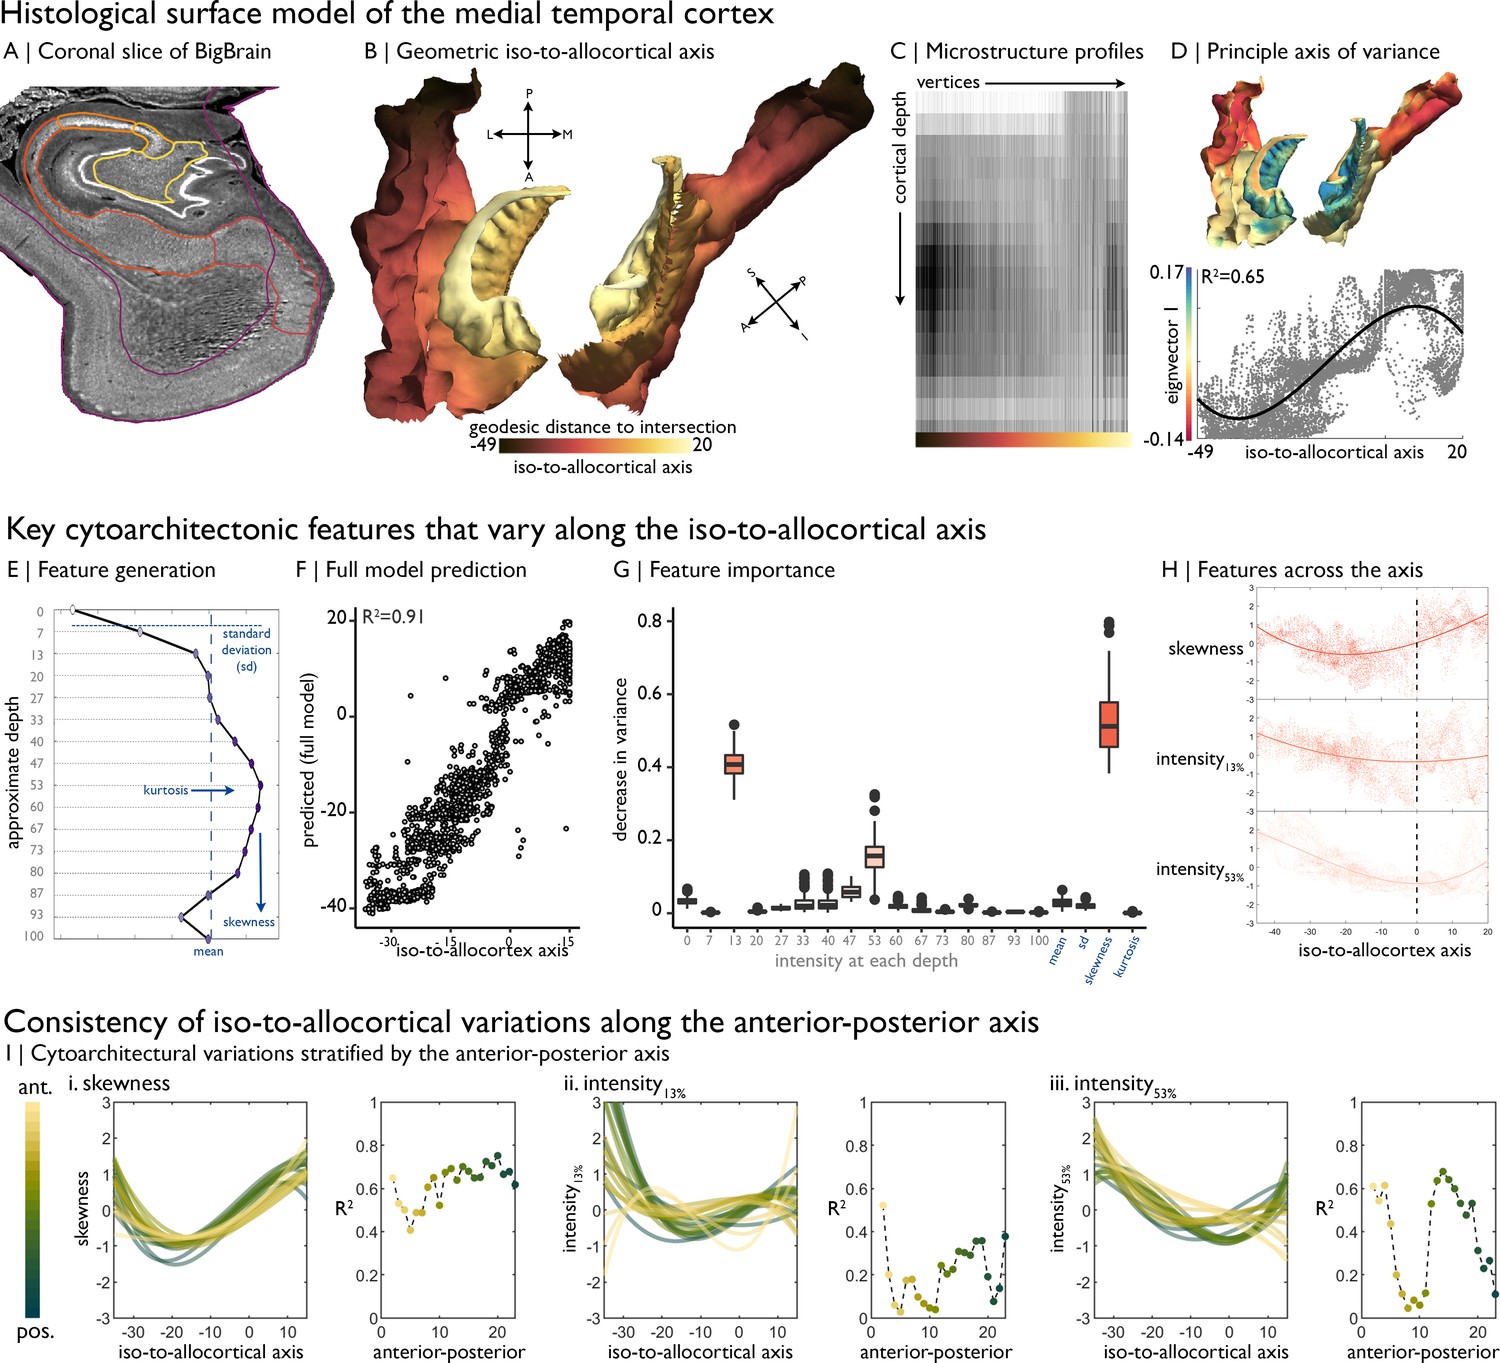
Cytoarchitectural profiling of the mesiotemporal confluence.
(A) Isocortical and allocortical surfaces projected onto the 40 µm BigBrain volume. Notably, conventional isocortical surface construction skips over the allocortex. Purple = isocortex. Red = subiculum. Dark orange = CA1. Orange = CA2. Light orange = CA3. Yellow = CA4. (B) The iso-to-allocortical axis was estimated as the minimum geodesic distance to the intersection of the isocortical and hippocampal surface models. (C) Intensity sampling along 16 surfaces from the inner/pial to the outer/white surfaces produced microstructure profiles. Darker tones represent higher cellular density/soma size. (D) Above. The principle eigenvector/axis of cytoarchitectural differentiation, projected onto the confluent surface. Below. The association between the principle eigenvector and the iso-to-allocortical axis, with the optimal polynomial line of best fit. (E) Cytoarchitectural features generated for each microstructure profile. (F) Empirical vs predicted position on the iso-to-allocortical, based on supervised random forest regression with cross-validation. (G) Feature importance was approximated as how much the feature decreased variance in the random forest. (H) Cubic fit of each selected feature with the iso-to-allocortical axis. Feature values are z-standardised. (I) Line plots show the cubic fit of cytoarchitectural features to the iso-to-allocortical axis within 23 bins of the anterior-posterior axis (yellow-to-green). Neighbouring scatter plots depict the goodness of fit (adjusted R2) of each polynomial, showing high consistency of the pattern of skewness.
Figure 1—figure supplement 1
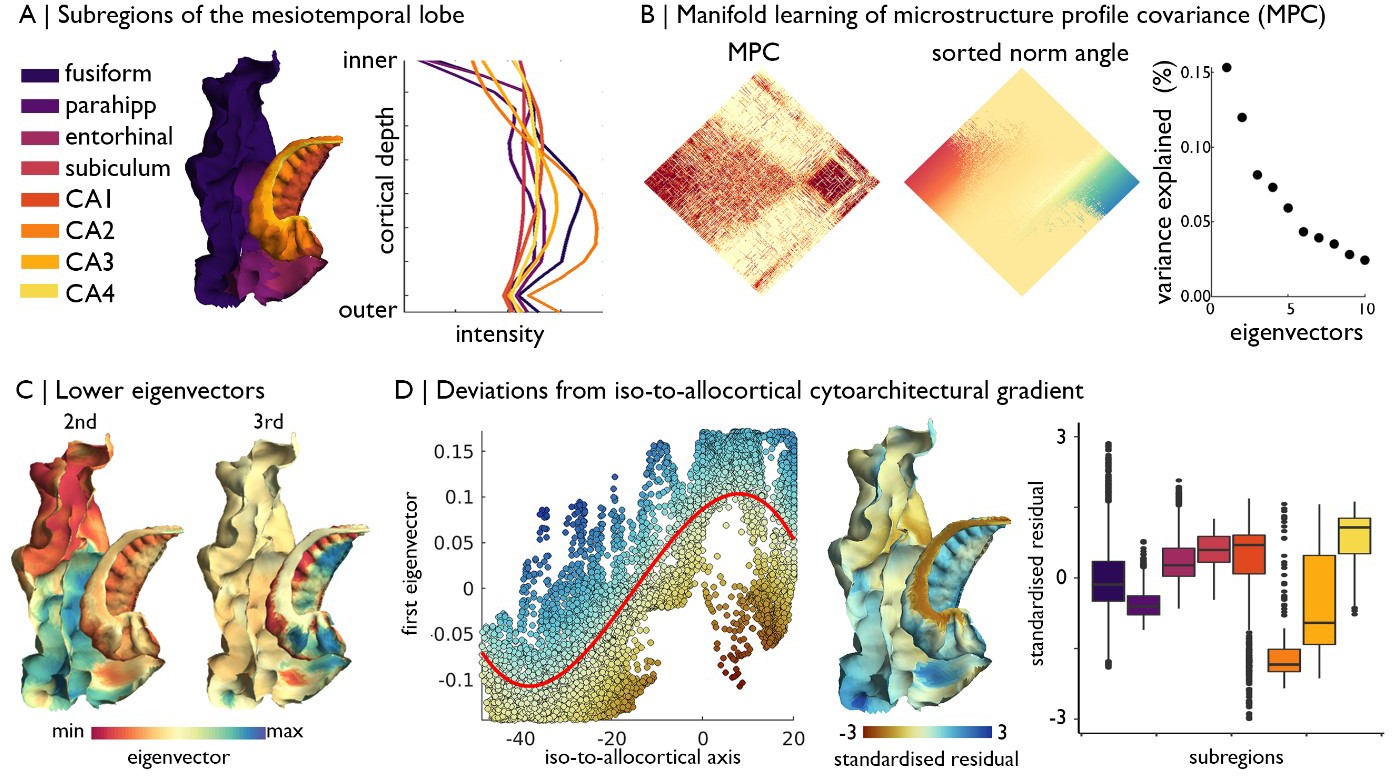
Manifold learning of MTL cytoarchitecture and relation to subregions.
(A) Surface projection and average microstructure profiles of MTL subregions, defined by the Desikan-Killany atlas for isocortex and manual segmentations for the hippocampus proper. (B) Microstructure profile covariance (MPC) across all vertices in the cortical confluence model was transformed into a normalised angle matrix and sorted according to the first eigenvector from diffusion map embedding. Scatterplot shows approximate variance explained by each eigenvector. (C) Second and third eigenvectors shown on the MTL confluence model. (D) Deviations from the polynomial association of the geometric iso-to-allocortical axis with the first eigenvector were estimated by the standardised residuals. Standardised residuals are shown on the surface projection and stratified by subregions.
Figure 1—figure supplement 2
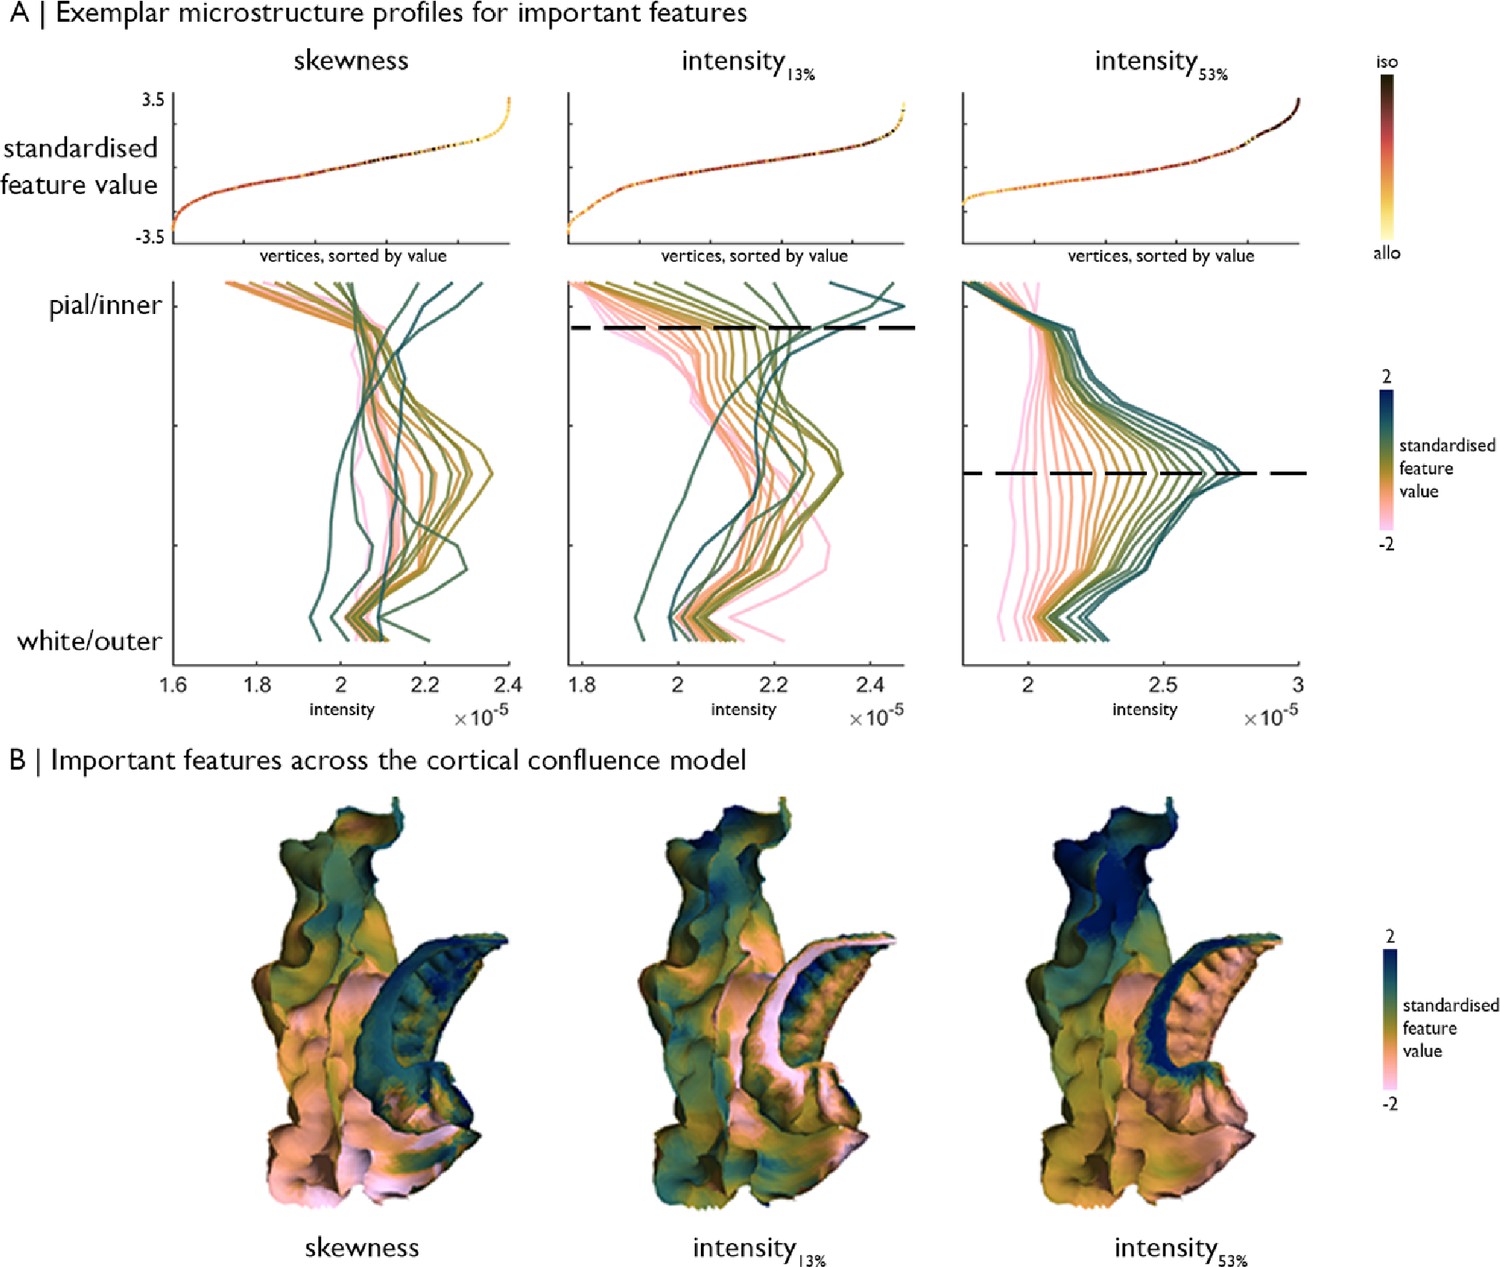
Exemplar microstructure profiles of selected features, namely skewness, intensity at ~13% depth and ~53% depth.
(A) Top: Standardised feature values of each vertex, sorted by value and coloured by position on the iso-toallocortical axis. Bottom: Average profiles of vertices within 20 bins, stratified by the respective feature value, which illustrate how features capture differences in the profile shape. Profiles are coloured by standardised feature value. Higher Merker-staining intensity values reflect higher cellular density/soma size. (B) Feature values of each vertex projected onto the MTL confluence model.
Figure 2 with 1 supplement
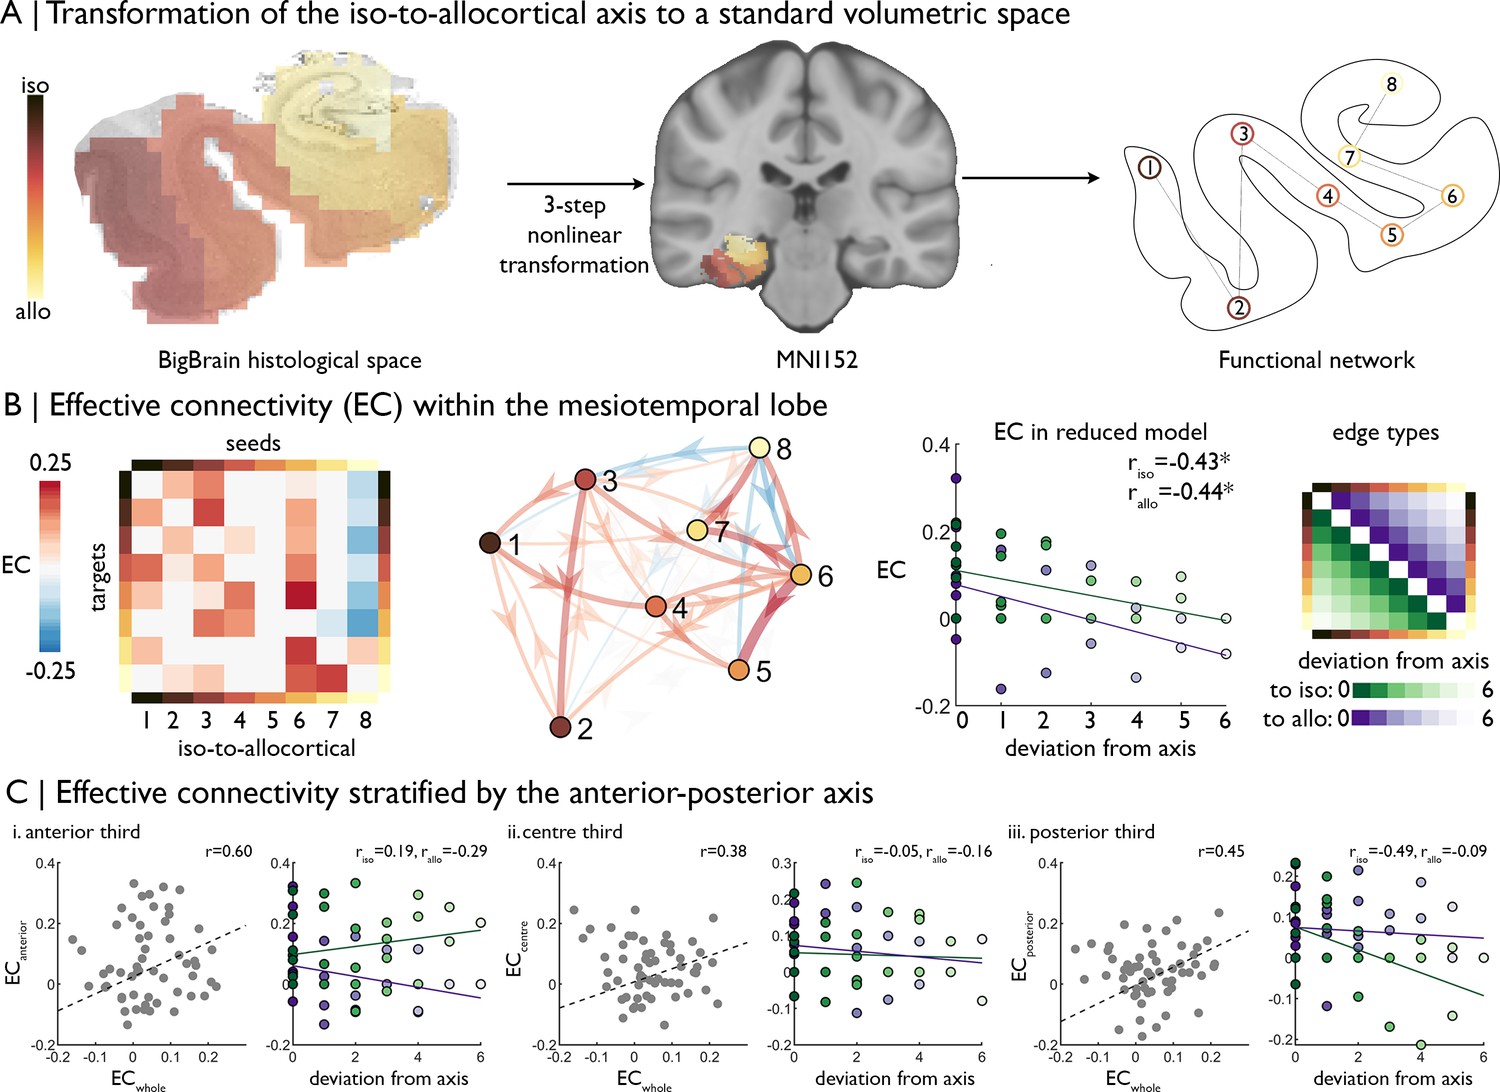
| Intrinsic functional signal flow across the cortical confluence.
(A) The surface-based iso-to-allocortical axis was projected into the native volume space of BigBrain, then registered to stereotaxic MNI152 space. We used this as a standard atlas to extract resting state functional MRI timeseries. An 8-node decomposition was used for the dynamic model (subregion overlap shown in Figure 2—figure supplement 1 ). (B) Left Posterior estimates of effective connectivity (EC) between 8-nodes of the iso-to-allocortical axis. Columns are seeds and rows are targets. Right. Strength of effective connectivity with deviation from the iso-to-allocortical axis, stratified by direction. * signifies pFDR <0.05. (C) Association of effective connectivity within anterior-posterior thirds of cortical confluence model (y-axes) with effective connectivity of the whole model and deviation from the iso-to-allocortical axis (x-axes).
Figure 2—figure supplement 1
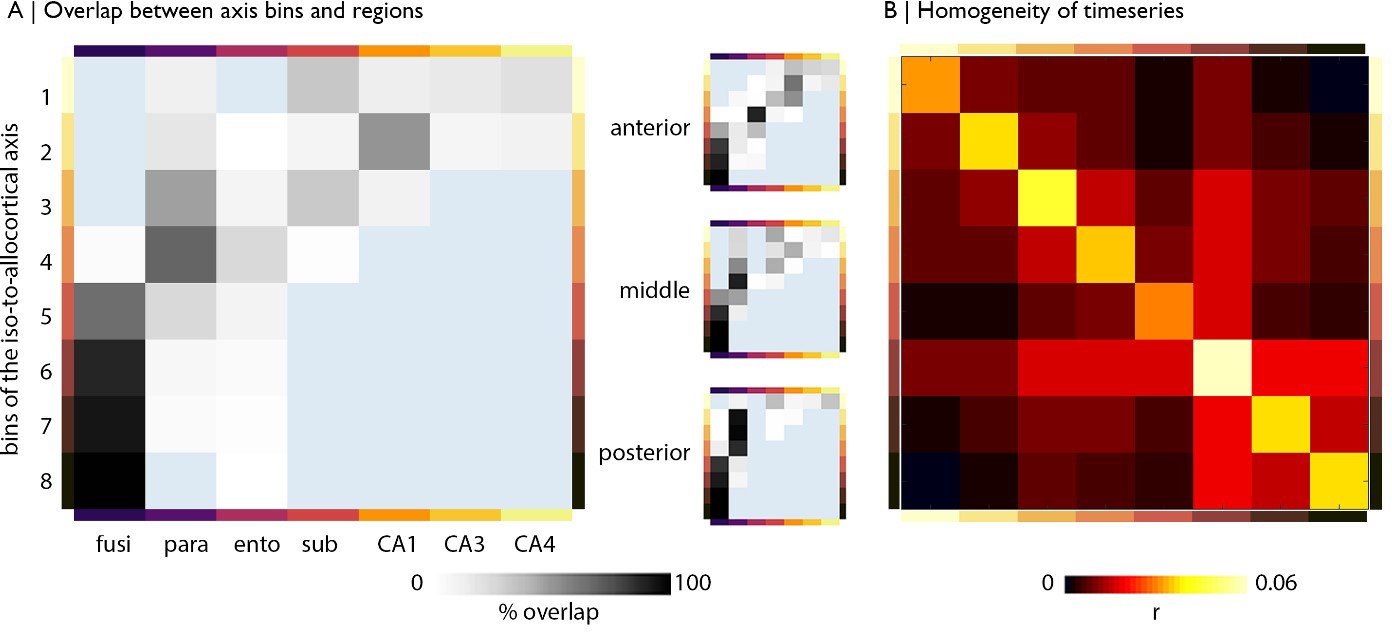
Alignment with subfields and functional homogeneity of iso-to-allocortical bins.
(A) Percentage overlap of bins with subregions for the whole model (left) and anterior-posterior stratified models (right). The overlap was calculated in MN152 space using the Desikan Killany atlas (Desikan et al., 2006) and an atlas of the hippocampus based on ultra-high-resolution ex vivo MRI data (Iglesias et al., 2015). (B) Homogeneity of rs-fMRI timeseries within bins of the iso-to-allocortical axis, taken as the average product moment linear correlation between all pairs of voxels in each bin (excluding self-connections) and averaged across subjects.
Figure 3
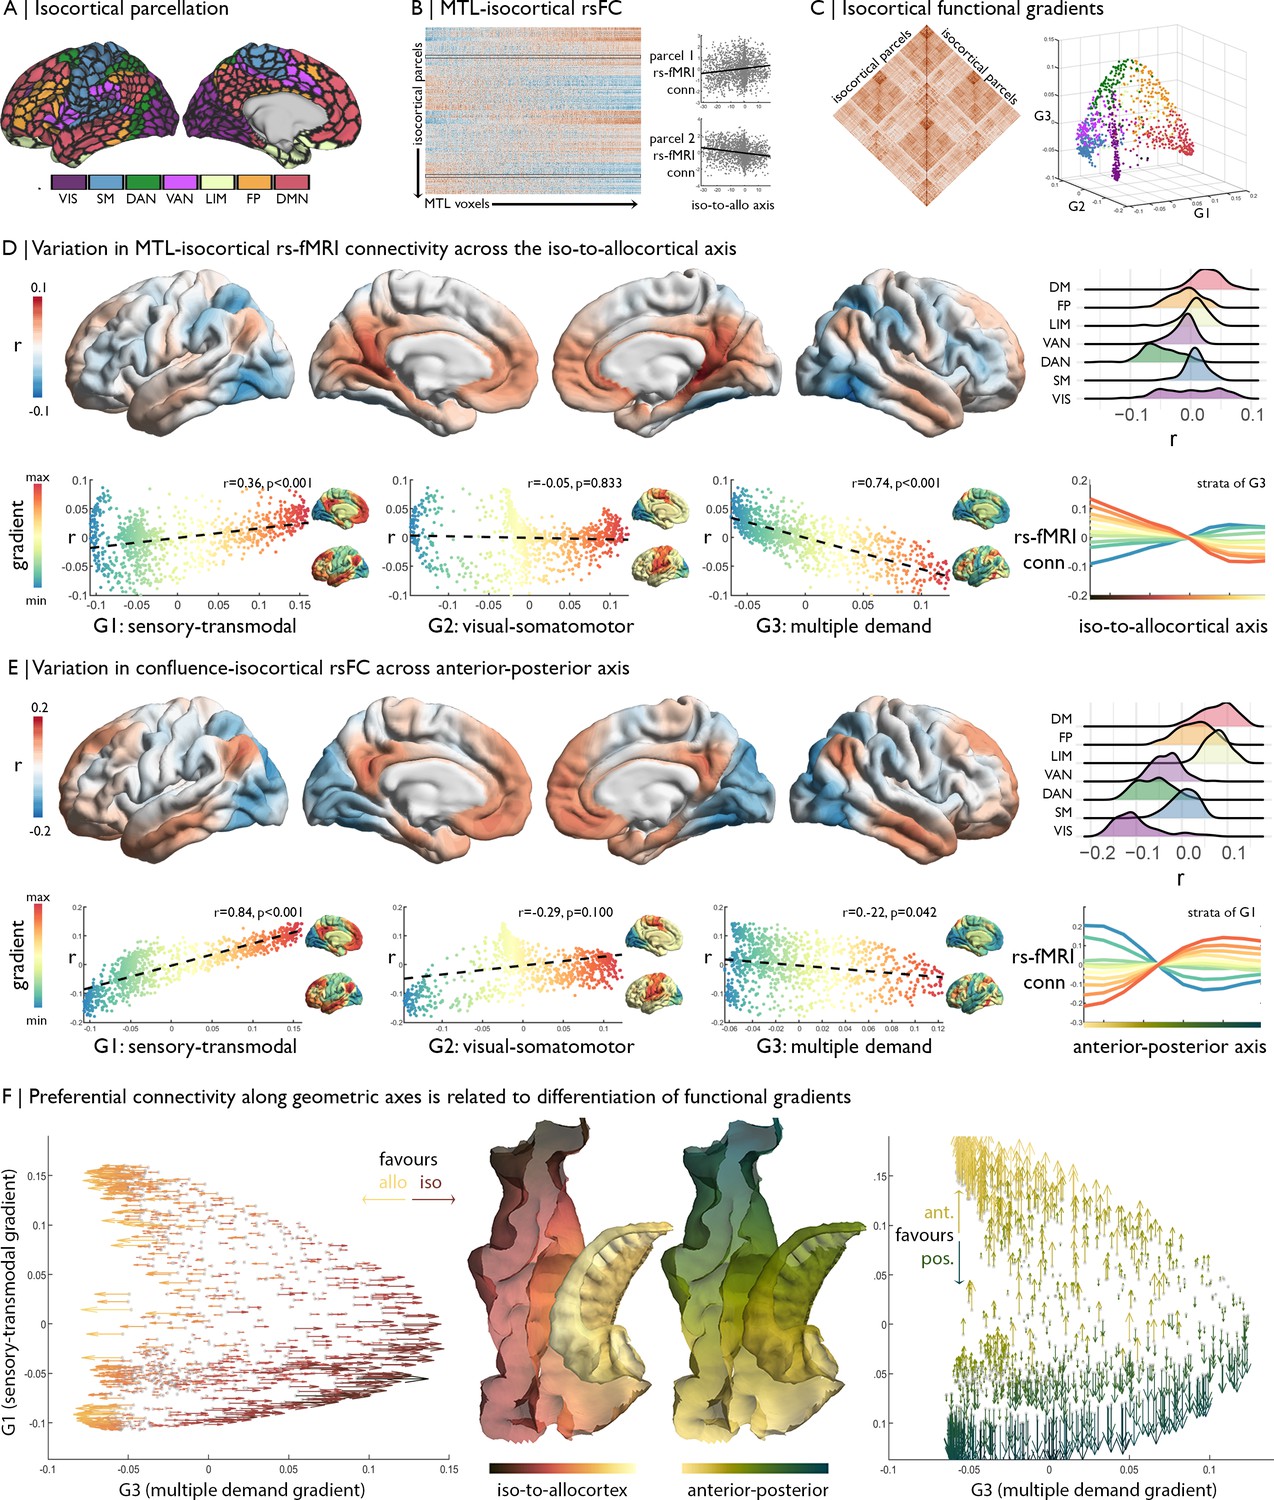
Relation of MTL axes with large-scale functional motifs.
(A) Parcellation of the isocortex, coloured by functional community (Schaefer et al., 2018). (B) rs-fMRI connectivity between isocortical parcels and MTL voxels, with examples of row-wise associations with the iso-to-allocortical axis. (C) Isocortical rs-fMRI connectivity was decomposed into a set of functional gradients, shown in a 3D space on the right. (D) Surface maps show parcel-wise correlation of rs-fMRI connectivity with iso-to-allocortical axis. Red indicates increasing connectivity towards the allocortex, whereas blue indicates increasing functional connectivity towards the isocortex. The ridgeplot depicts the r values for each community. Scatter plots depict how regional associations with iso-to-allocortical axis (r, y-axis) vary as a function of the position each of the functional gradients (x-axis). Functional gradients are presented on the cortical surface insets right to each scatter plot. Line plot shows the average rs-fMRI connectivity ten strata of the third functional gradient with MTL voxels, organised along the iso-to-allocortical axis. (E) We repeated the analysis in D for the anterior-posterior axis, showing a strong association with the sensory-transmodal gradient. (F) Both scatterplots depict isocortical parcels in functional gradient space, defined by the sensory-transmodal and the multiple-demand gradients. Arrows represent the correlation of rs-fMRI connectivity from that isocortical parcel with the iso-to-allocortical (left) and the anterior-posterior axes (right). Arrow direction reflects the sign of the correlation, corresponding to the respective axis, and the colour depicts the strength.
Figure 4
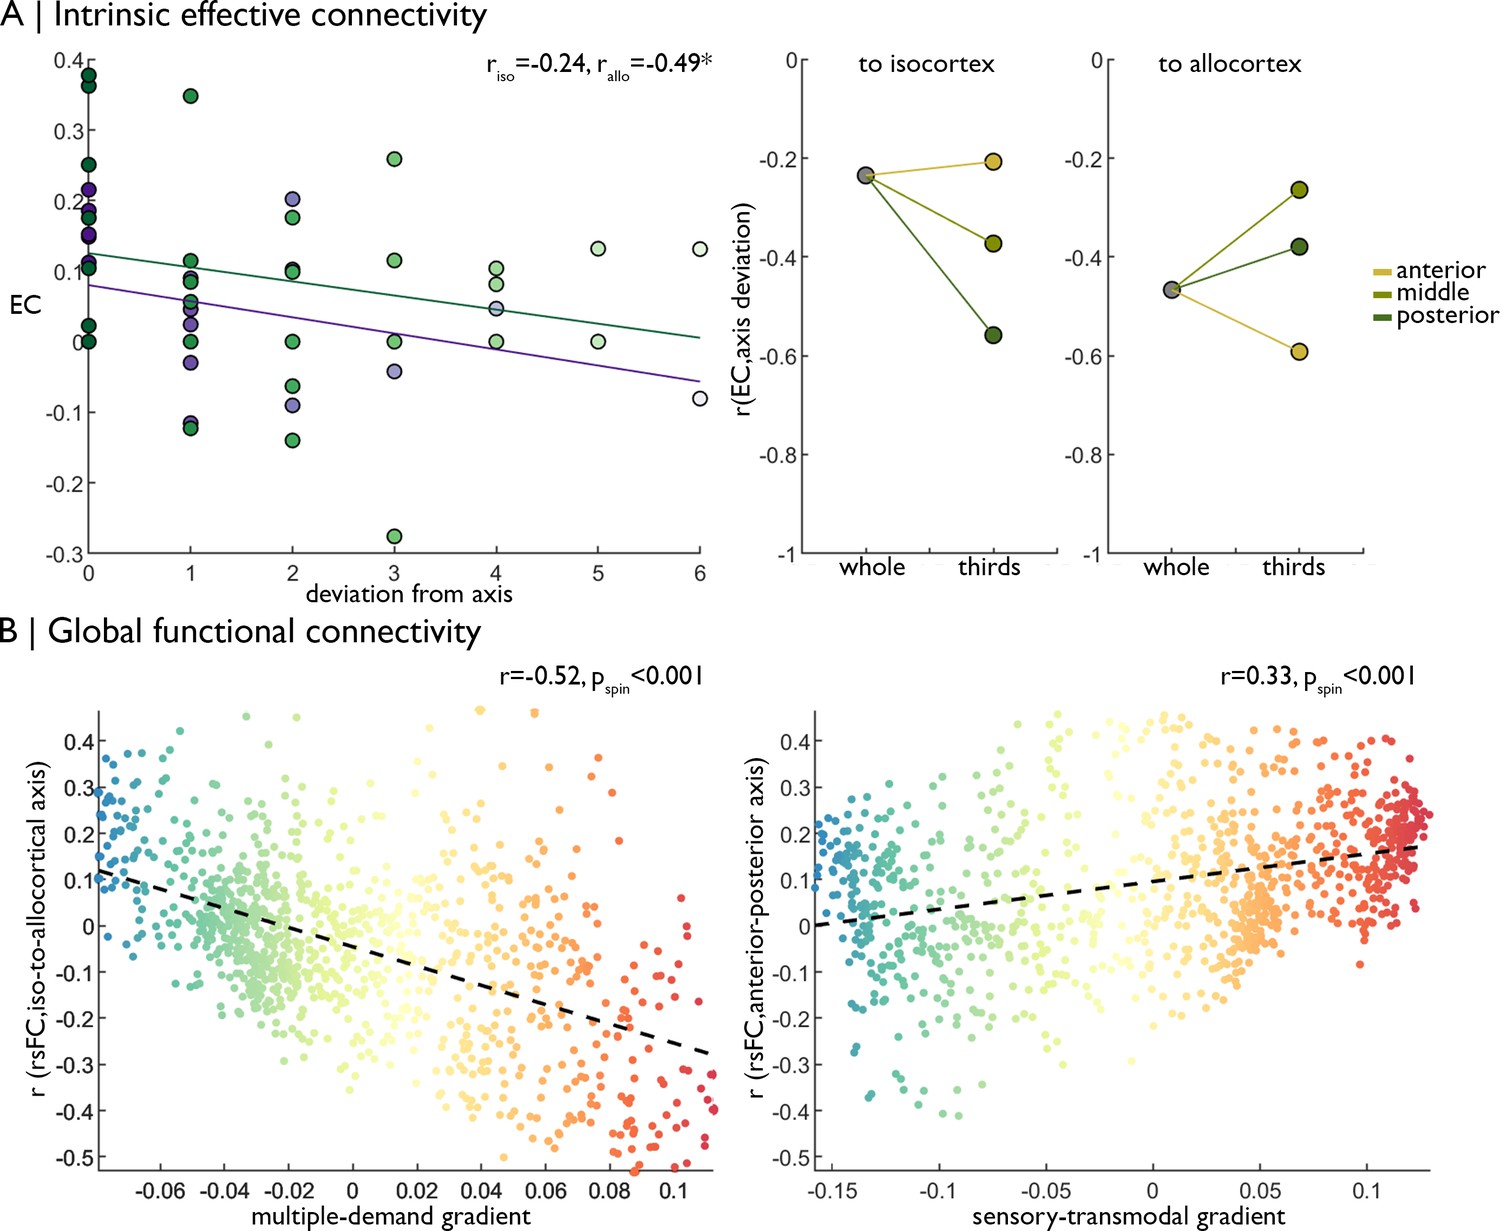
Replication of functional analyses in an independent dataset.
(A) Left Strength of effective connectivity decreases with deviation from the iso-to-allocortical axis. Green = to isocortex. Purple = to allocortex. Right The correlation between effective connectivity and deviation from iso-to-allocortical axis differed within anterior, middle and posterior thirds. (B) Scatterplots show relationship between varying strength of rs-fMRI along the iso-to-allocortical (left) and anterior-posterior (right) axes mirror multiple-demand and sensory-transmodal isocortical functional gradients, respectively.
Figure 5
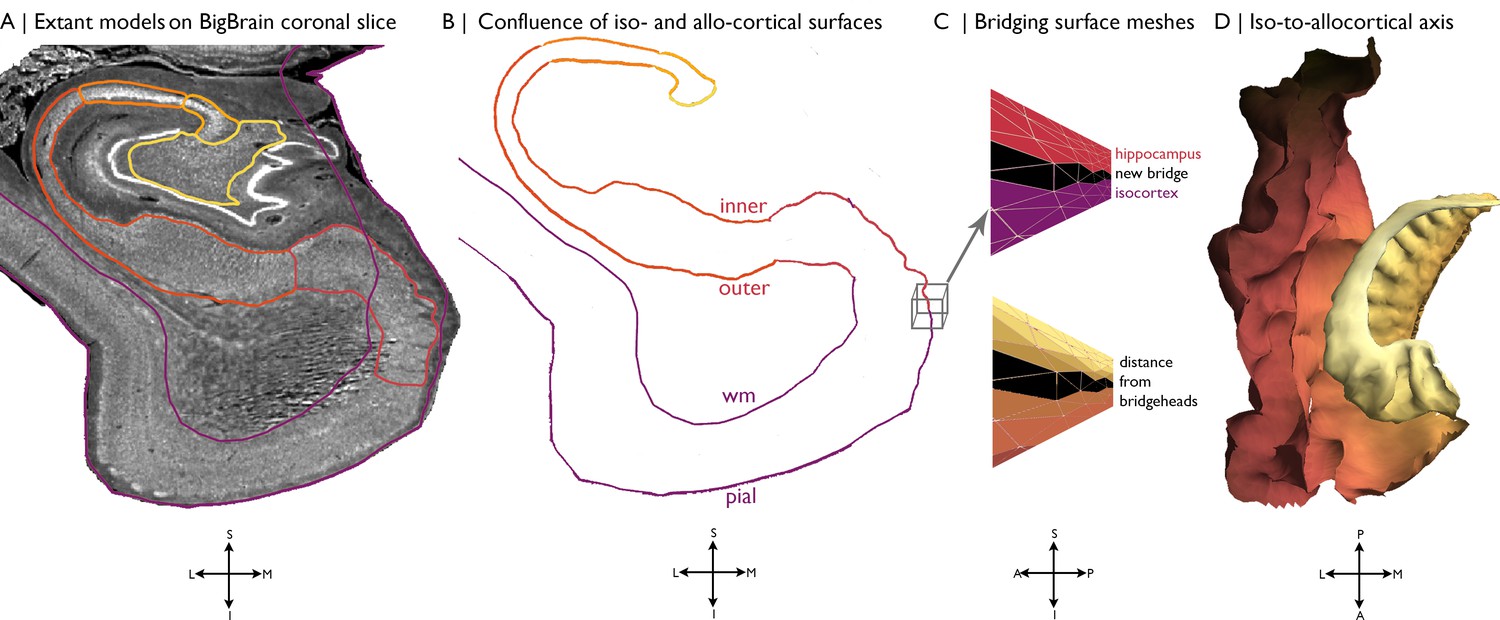
Building a continuous cortical surface model of the MTL.
(A) Isocortical surface models and hippocampal subfield outlines projected on a the 40 µm resolution coronal slice of BigBrain. (B-C) We initialised the continuous cortical surface model with inner hippocampal vertices (minimum value on inner-outer axis) and mesiotemporal pial vertices (entorhinal, parahippocampal or fusiform cortex), as well as the triangles that defined their connections in the existing surface meshes. Within this model, we then identified hippocampal bridgehead vertices (medial aspect of the subiculum) and matched each to the closest isocortical vertex that had a lower z-coordinate. We only selected inferior vertices to discount the section of the isocortical model that skips over the hippocampus. Then, we created new triangles in the surface mesh that included a hippocampal bridgehead, the matched isocortical vertex and a neighbouring bridgehead on either side, thus creating a bridge between the two surface constructions. Finally, we calculated the geodesic distance along the continuous surface mesh from each vertex to the nearest hippocampal bridgehead. (D) Iso-to-allocortical axis represents the geodesic distance to the hippocampal bridgehead. Orientations are provided below where S = superior, I = inferior, L = lateral, M = medial, A = anterior, p=posterior.
Additional files
Download links
A two-part list of links to download the article, or parts of the article, in various formats.
Downloads (link to download the article as PDF)
Open citations (links to open the citations from this article in various online reference manager services)
Cite this article (links to download the citations from this article in formats compatible with various reference manager tools)
Convergence of cortical types and functional motifs in the human mesiotemporal lobe
eLife 9:e60673.
https://doi.org/10.7554/eLife.60673


