Vascular dimorphism ensured by regulated proteoglycan dynamics favors rapid umbilical artery closure at birth
- Department of Biomedical Engineering, Cleveland Clinic Lerner Research Institute, United States
- Department of Biomedical Engineering, Yale University, United States
- Case Comprehensive Cancer Center, Case Western Reserve University, United States
- Department of Experimental Medical Science and Wallenberg Center for Molecular Medicine, Lund University, Sweden
- The Sir Martin Evans Building, School of Biosciences, Cardiff University, United Kingdom
- Department of Pediatrics, University of Chicago, United States
- Department of Medicine, Case Western Reserve University, United States
- The Women's Health Institute, Department of Obstetrics and Gynecology, Cleveland Clinic, United States
Figures
Figure 1 with 5 supplements
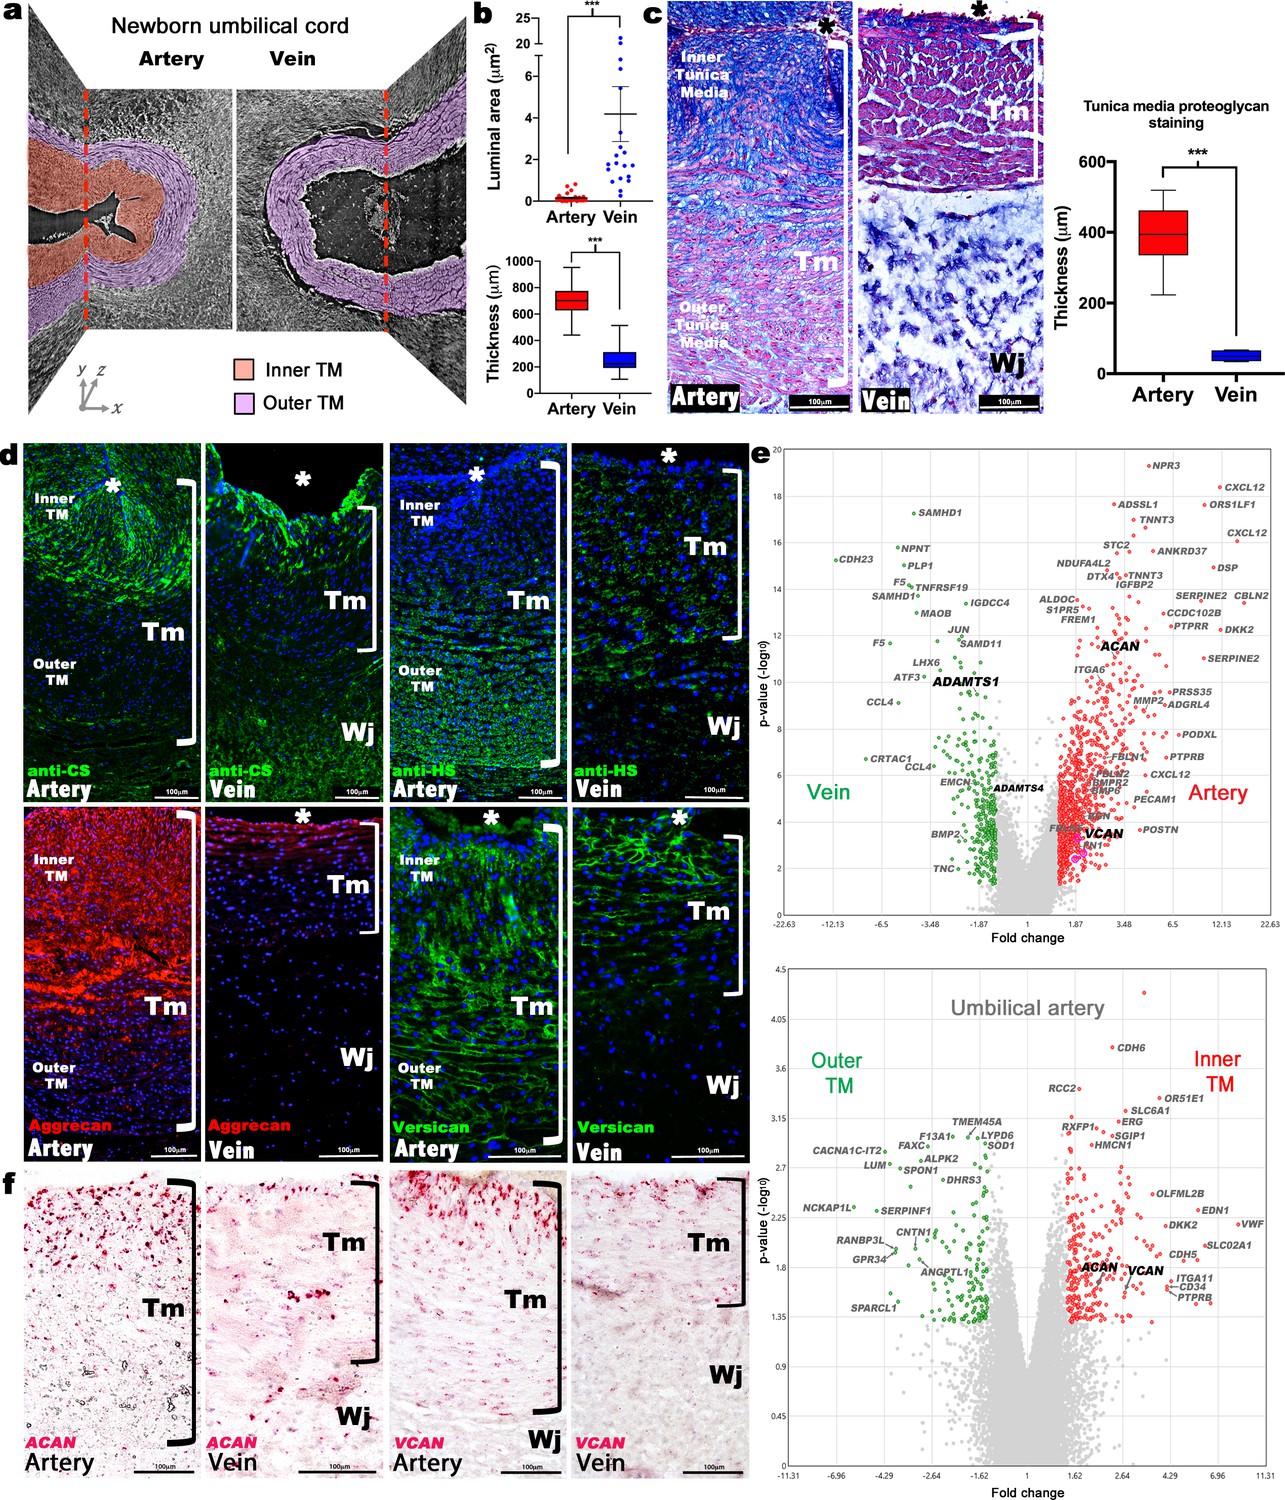
Dimorphism of the human umbilical artery and vein.
(a) Synchrotron imaging of umbilical vessels at birth illustrates a bilayered arterial wall comprising an inner buckled tunica media (TM) (red) and outer TM (purple) but no distinct inner layer or buckling in the vein. X-Y and Y-Z image planes are indicated by red dashed lines (n = 3 umbilical cords). (b) Quantitation of luminal cross-sectional area at birth shows that the umbilical arteries are occluded whereas the veins remain patent (top) and have significantly thicker walls (bottom) (n = 20 cords, error bars indicate mean ± S.E.M., whiskers indicate minimum and maximum values. ***, p<0.001). (c) Alcian blue, eosin (pink) and nuclear fast red staining of umbilical vessel cross-sections shows a proteoglycan-rich (blue) inner TM in the umbilical artery but not the vein. Quantified staining intensity is shown on the right (n = 6 umbilical cords, whiskers indicate minimum and maximum values, ***, p<0.001). (d) Chondroitin sulfate (CS), heparan sulfate (HS), aggrecan and versican immunofluorescence (n = 4 cords for each antibody) showing that CS staining corresponds with aggrecan and versican staining and alcian blue in (c). (e) Volcano plots illustrating differential gene expression between human umbilical artery (red) and vein (green) (top, n = 4 umbilical arteries and veins) and differential gene expression between human umbilical artery inner TM (red) and the outer TM (green) (bottom, n = 2). (f) RNA in situ hybridization shows robust ACAN and VCAN expression (red signal) in the inner artery TM and weak expression in the vein (n = 3 umbilical cords for each in situ probe). * marks the vessel lumen. Brackets in c,d,f mark the TM. Wj, Wharton’s jelly. Scale bars = 100 μm in c,d,f.
Figure 1—figure supplement 1
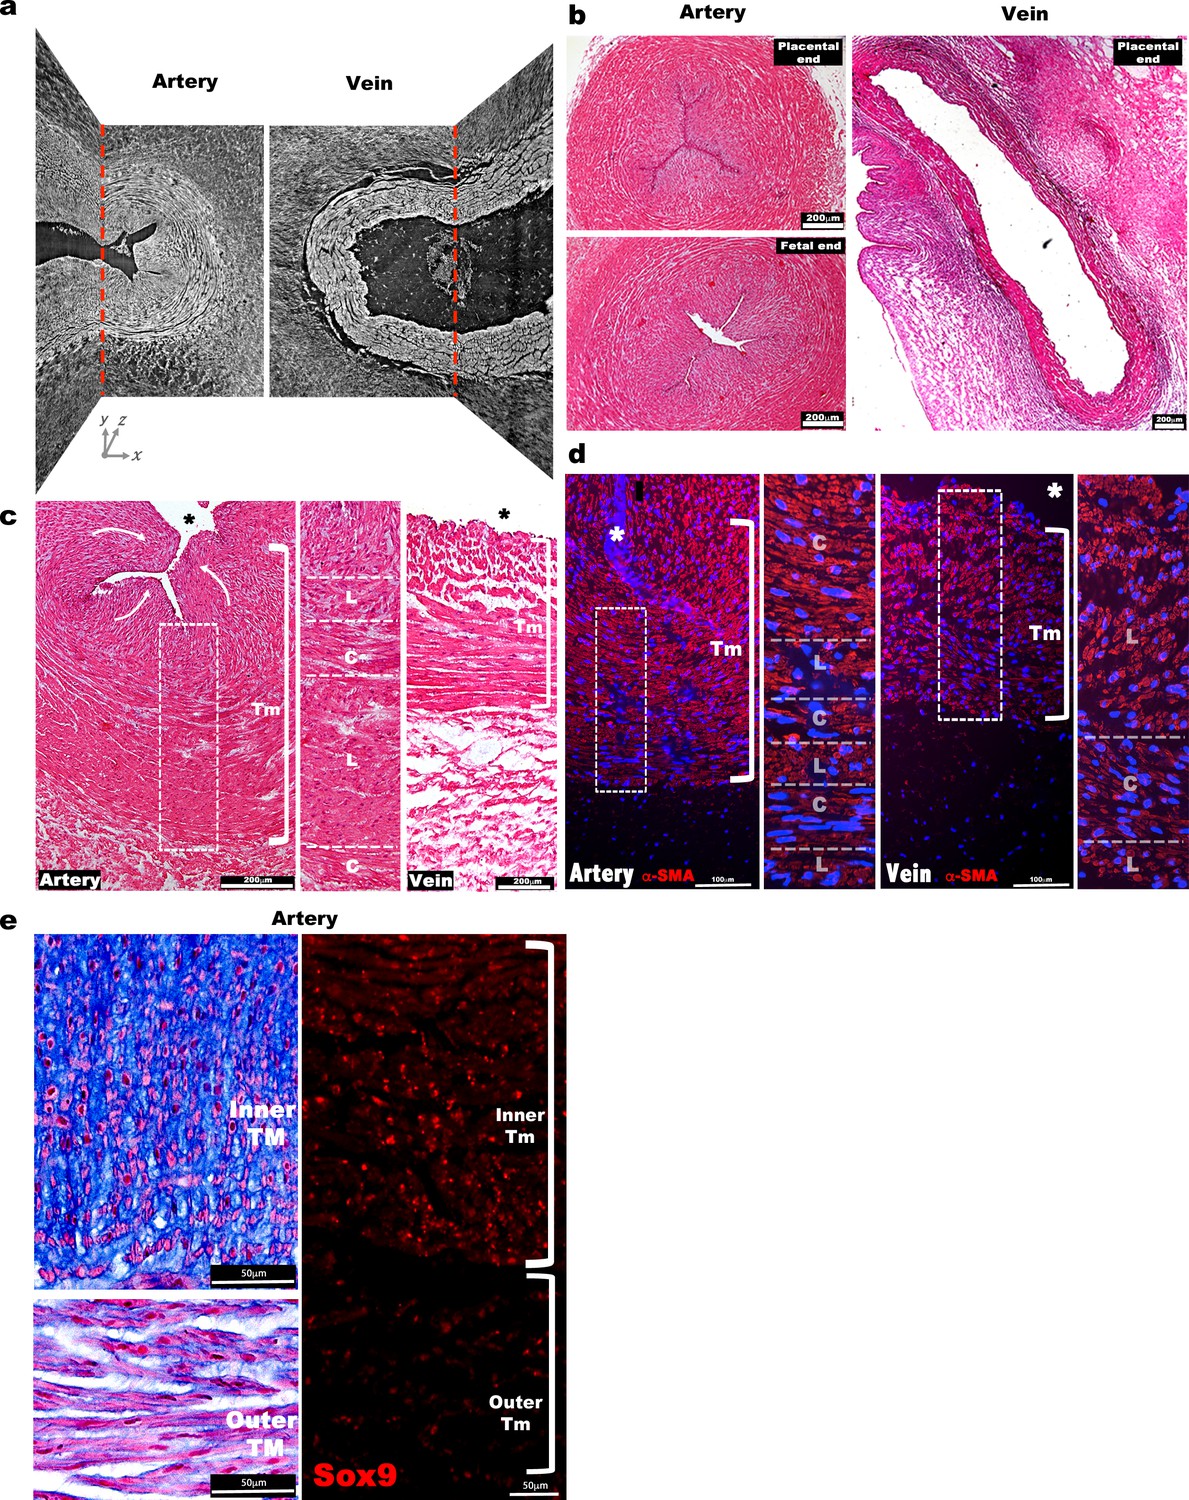
Morphological and cellular characteristics of the human umbilical arteries and veins at birth.
(a) Synchrotron image from Figure 1a without red and purple shading illustrates contrast between inner and outer arterial tunica media (TM) as well as inner TM buckling, compared with a uniform appearance of venous TM and lack of buckling (n = 3 umbilical cords). (b) Hematoxylin and eosin stained human umbilical artery cross-sections collected from the placental and fetal ends show occlusion of the umbilical artery with buckling of its interior, while the vein remains patent and lacks buckling (n = 25 umbilical cords). (c) Hematoxylin and eosin stained cross-sections show multiple cell layers composed of alternating circumferentially (C) or longitudinally (L) oriented smooth muscle cells (SMC) in the umbilical artery. Curved white arrows indicate internal protrusion of the inner TM of the umbilical artery arising from buckling. (d) α-SMA (α-smooth muscle actin, red) and DAPI (blue) staining of the umbilical artery and vein shows distinct orientation of the SMC layers as in (c) (n = 3 umbilical cords). (e) (Left) Alcian blue staining shows intense staining of the inner arterial TM, with radially-oriented rounded cells contrasting with outer TM cells having elongated morphology. Eosin (pink) and nuclear fast red counterstaining. (Right) Sox9 immunostaining shows nuclear staining of SMCs of the inner umbilical artery TM (n = 6 umbilical cords, * marks the vessel lumen in panels (c,d,e). White brackets in (c,d and e) mark the TM. Tm, tunica media). Scale bars = 200 μm in (b) and c, 100 μm in d and 50 μm in e.
Figure 1—figure supplement 2
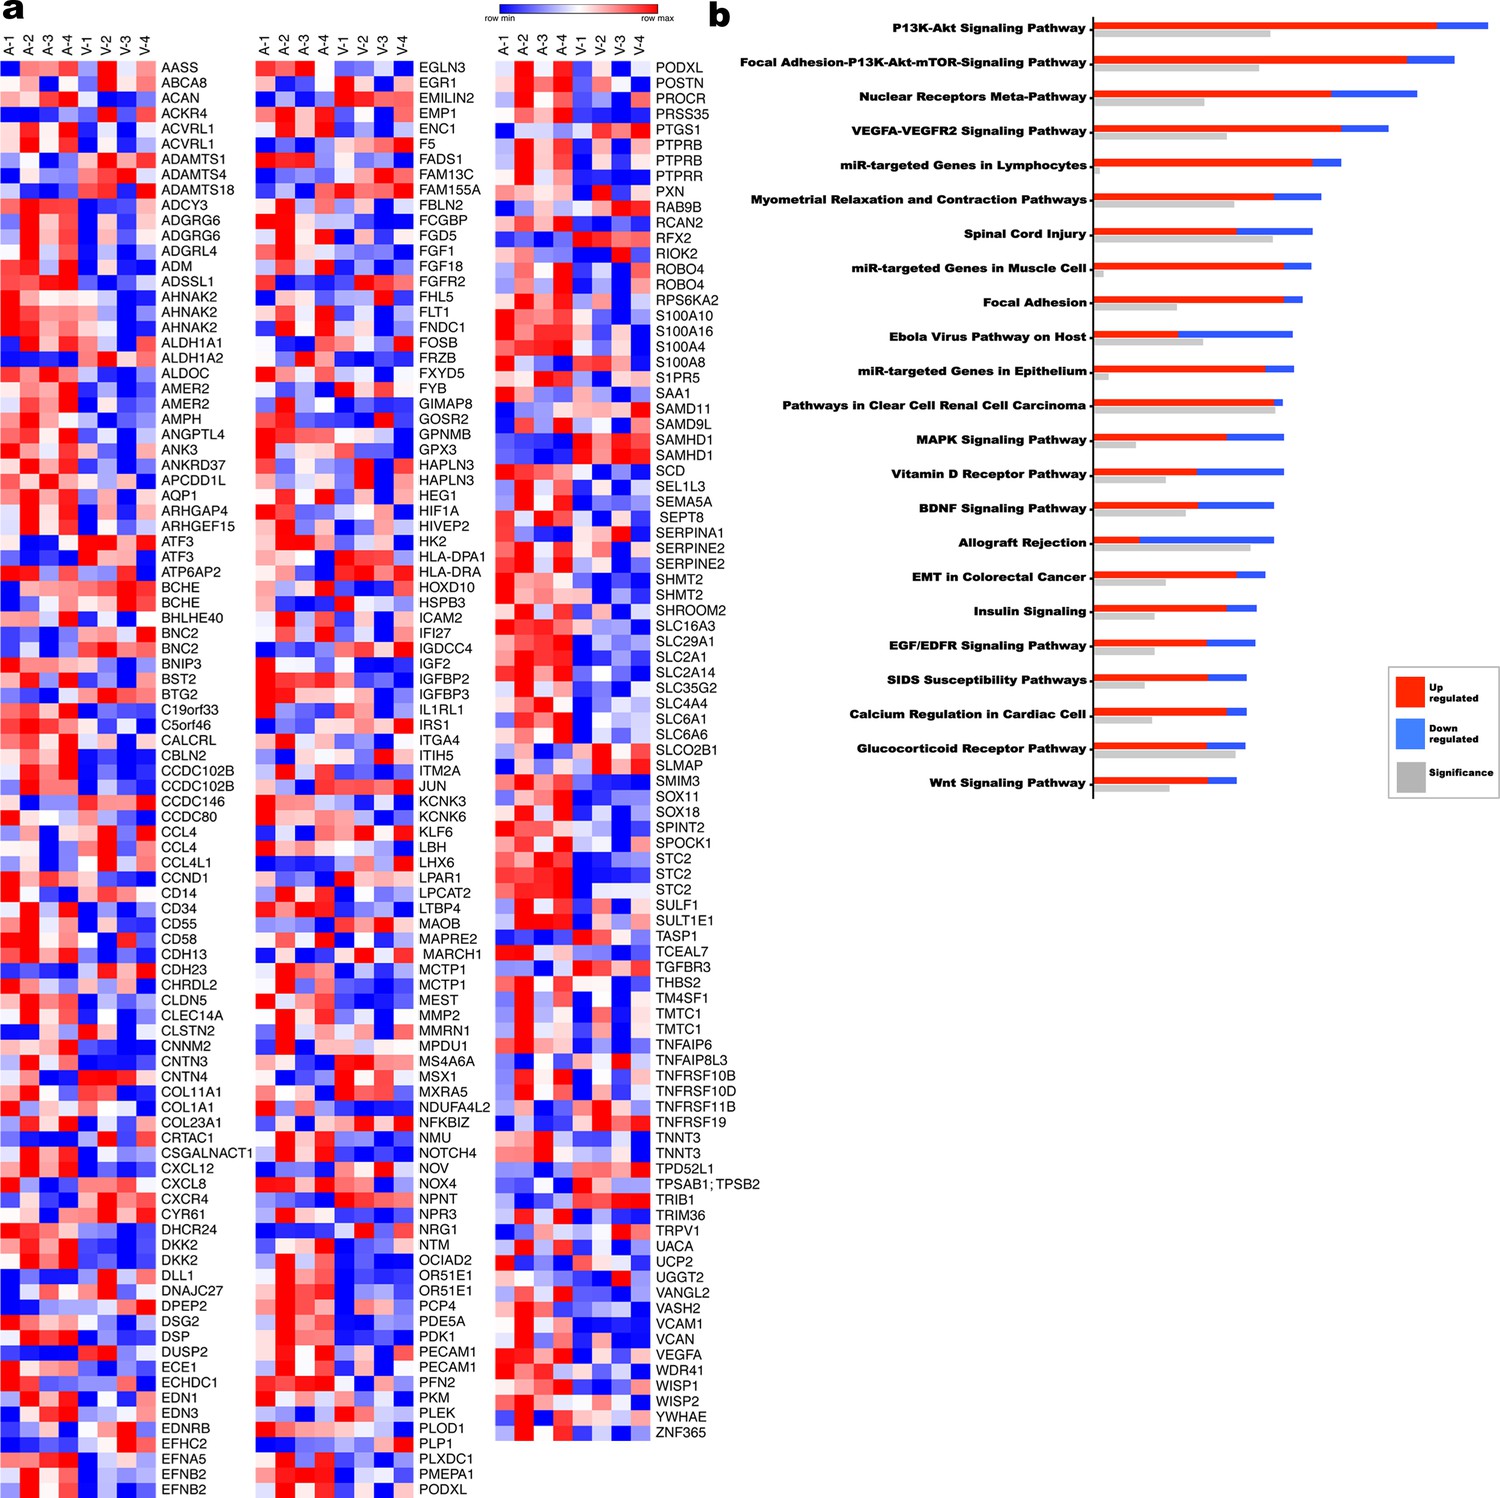
Transcriptome comparison and pathway analysis of differences in the human umbilical artery and vein.
(a) Heat map of a subset of differentially expressed genes (1.9 fold-change) from umbilical artery vs vein (n = 4 umbilical cords). (b) Ingenuity pathway analysis (IPA) summary of the most significantly different pathways (n = 4 umbilical cords).
Figure 1—figure supplement 3
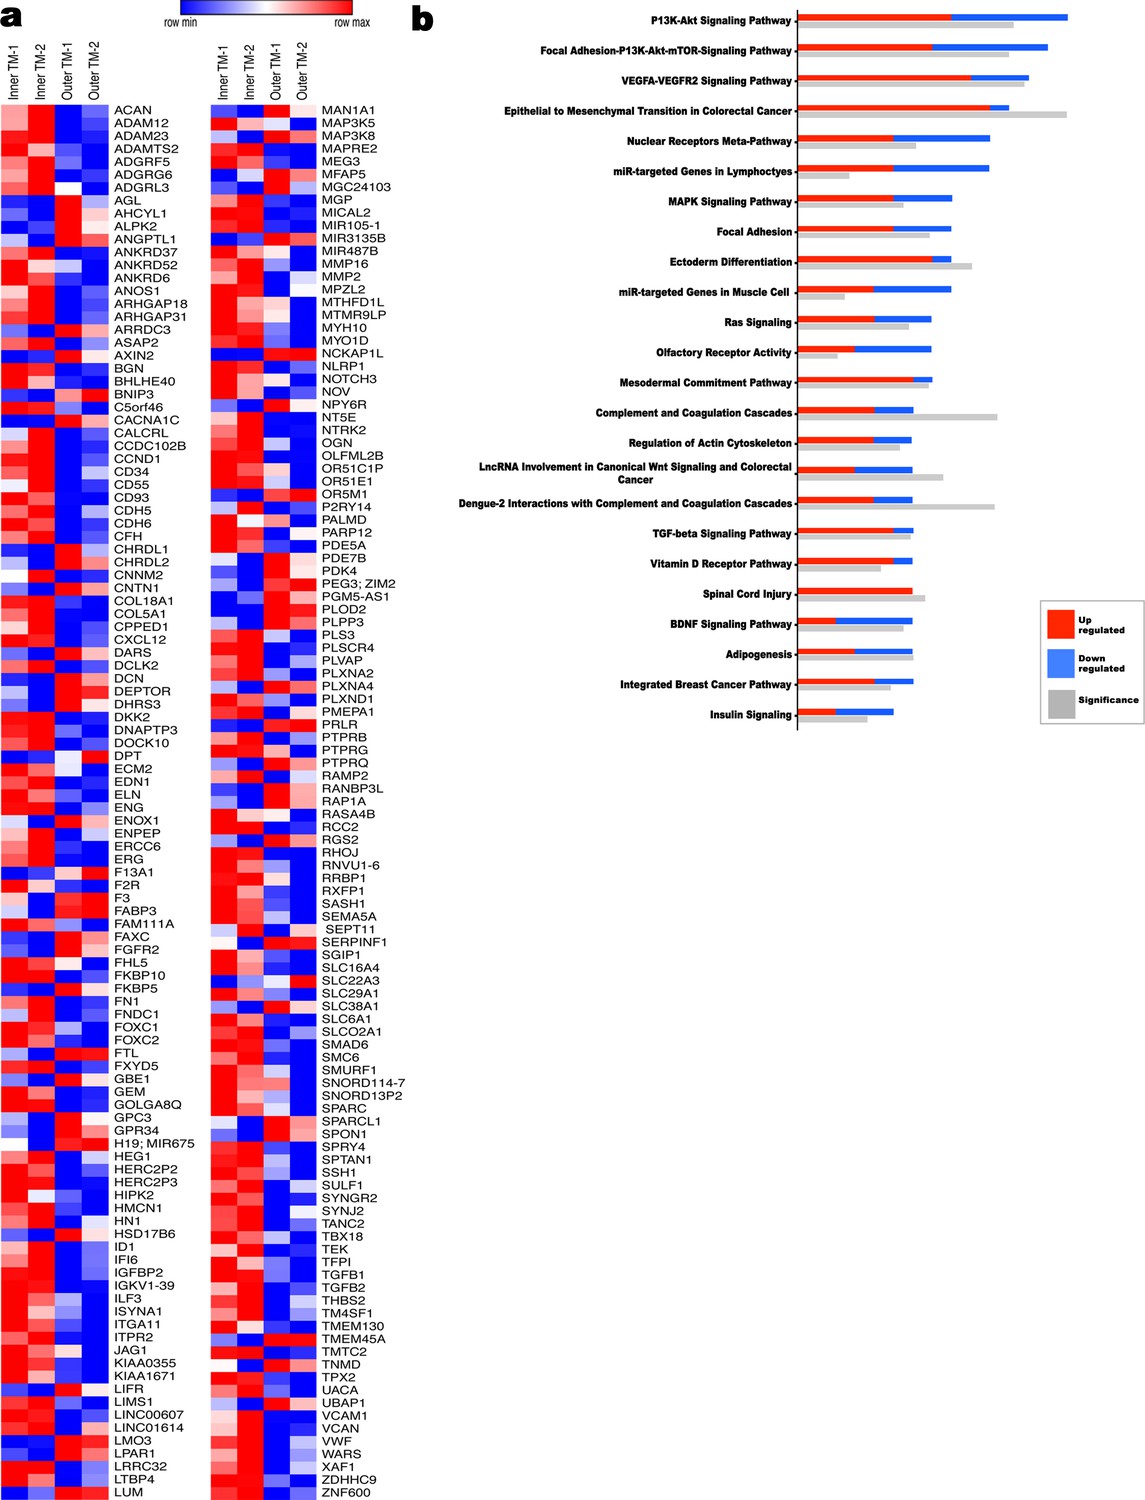
Transcriptome comparison and pathway analysis of differences in the human inner umbilical artery tunica media (TM) vs the outer tunica media.
(a) Heat map of a subset of differentially expressed genes (1.9 fold-change) (n = 2 umbilical arteries, two inner TM samples matched to two outer TM samples). (b) Ingenuity pathway analysis (IPA) showing significantly different pathways in the umbilical artery inner and outer tunica media (n = 2 umbilical arteries, two inner TM samples matched to two outer TM samples).
Figure 1—video 1
Synchrotron image stack of an umbilical artery.
A human umbilical artery was imaged cross-sectionally and the images reconstructed along the luminal axis using Amira.
Figure 1—video 2
Synchrotron image stack of an umbilical vein.
A human umbilical vein was imaged cross-sectionally and the images reconstructed along the luminal axis using Amira.
Figure 2
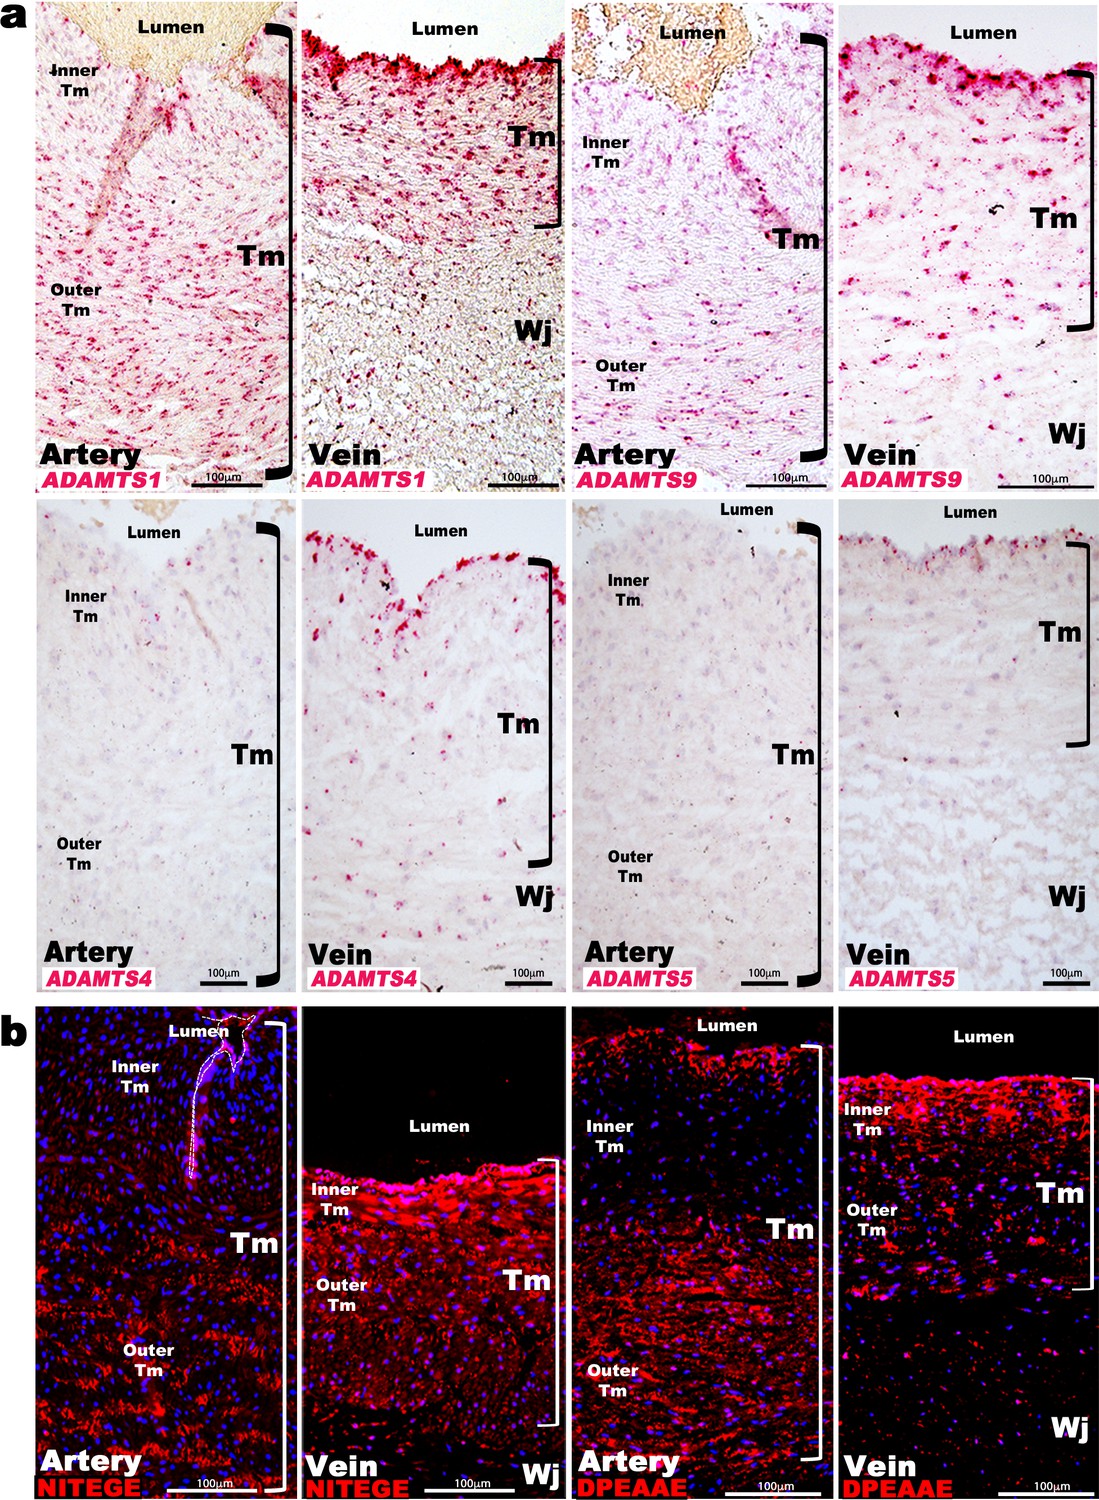
ADAMTS proteoglycanases are highly expressed and active in the human umbilical vein.
(a) RNA in situ hybridization shows robust ADAMTS1 and ADAMTS9 expression in umbilical vein endothelium and tunica media (TM) and in outer arterial TM. Robust ADAMTS4 and ADAMTS5 expression was confined to the venous endothelium, with moderate ADAMTS4 expression and minimal ADAMTS5 expression in SMC (n = 3 umbilical cords for each probe). (b) ADAMTS-cleaved aggrecan (anti-NITEGE, red) and versican (anti-DPEAAE, red) both showed strong ADAMTS proteolytic activity throughout the venous wall and the outer artery TM. Unlike aggrecan, extensive versican proteolysis is seen in the arterial intima and sub-intima (n = 4 umbilical cords for each antibody). Wj, Wharton’s jelly. The brackets mark TM boundaries. Scale bars in a-b = 100 μm.
Figure 3 with 1 supplement
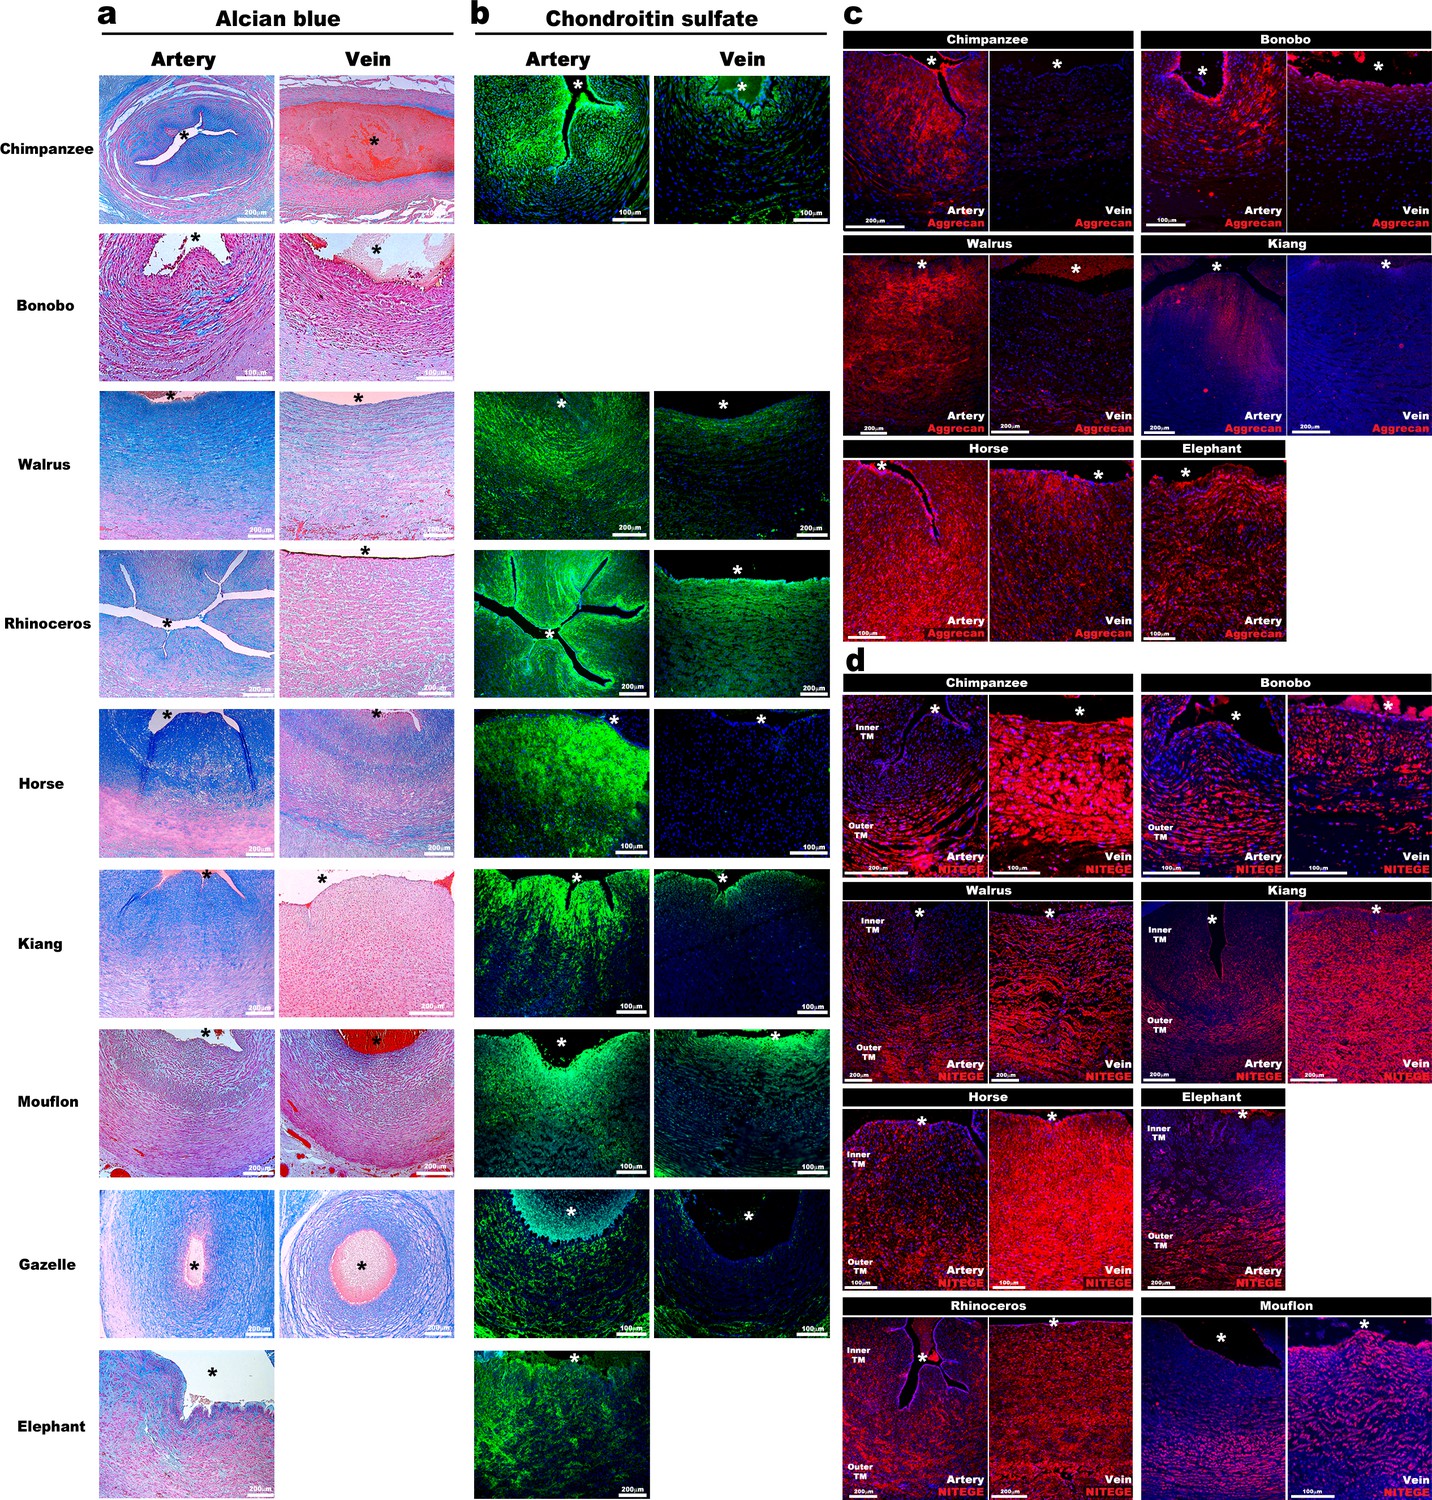
Aggrecan enrichment in the inner umbilical artery tunica media (TM) and its proteolysis in the umbilical vein is a characteristic of large mammals.
(a) Alcian blue-eosin staining of umbilical cord sections shows proteoglycan enrichment (blue) in the inner arterial tunica media (TM). The elephant umbilical vein was unavailable. (b) Anti-CS immunofluorescence (7D4, green) shows enrichment in the inner arterial TM. Bonobo cords lacked 7D4 reactivity. (c,d) Aggrecan and anti-NITEGE immunostaining from reactive species showed aggrecan enrichment in the inner arterial TM and aggrecan proteolysis in the vein and outer artery TM. n = 3 for Gazelle and n = 1 for other mammals. Triplicate sections were stained from each animal cord. Scale bars = 100 μm and 200 μm. * indicates the vessel lumen.
Figure 3—figure supplement 1
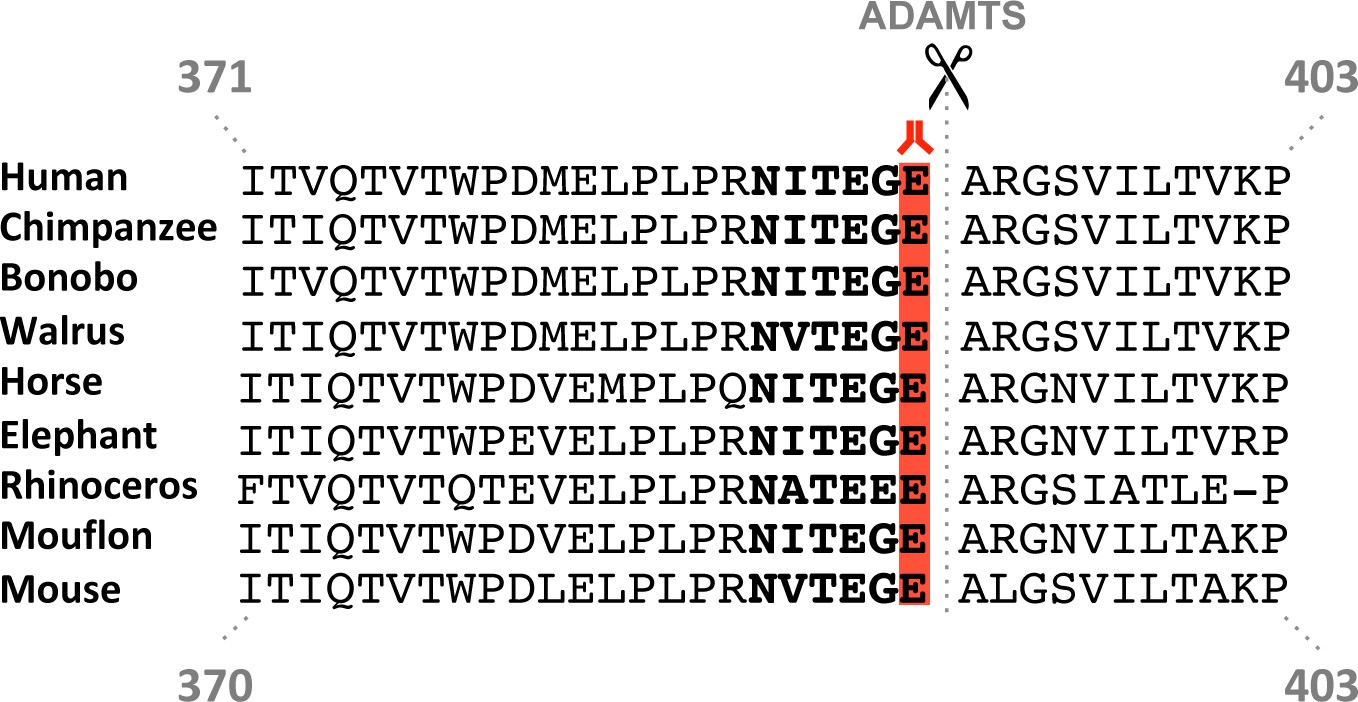
Aggrecan cleavage site conservation in mammals.
The cleavage site location is shown over the sequence alignment by scissors, and the critical Glu(E) residue essential for cleavage is shown by red highlighting. Bold text identifies the cleavage-revealed neo-epitope NITEGE. Residue numbers are indicated for human and mouse aggrecan only.
Figure 4 with 1 supplement
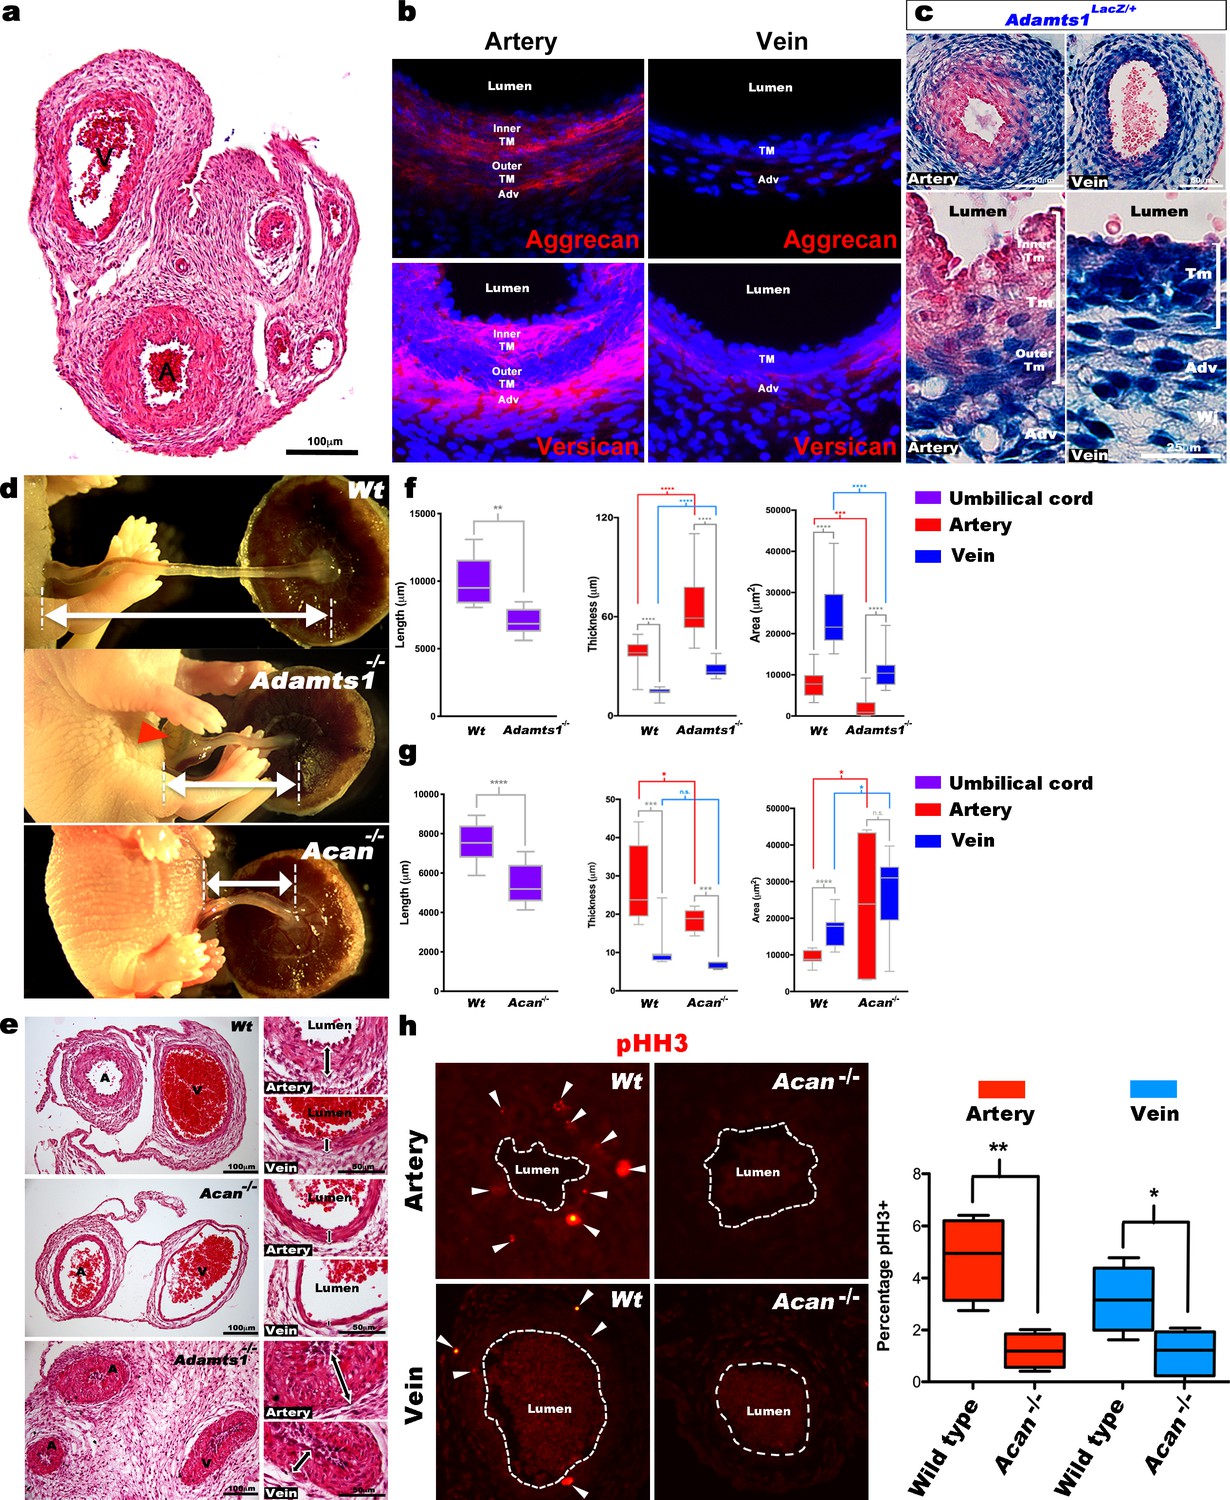
Defective morphogenesis in Acan and Adamts1 mutant mouse umbilical cords.
(a) H and E staining of E18.5 wild-type cords showing thicker umbilical arterial (A) and thinner venous (V) wall (n = 6 umbilical cords). (b) Aggrecan and versican localization (red, DAPI counterstain blue) in E18.5 wild-type cords showing staining in the arterial inner tunica media (TM) and adventitia but not the vein (n = 3 umbilical cords). (c) β-gal (blue) and eosin (red) staining of E18.5 Adamts1LacZ/+ (Adamts1+/-) cord showing strong Adamts1 expression in venous endothelium and TM and outer artery TM (n = 3 umbilical cords). (d) Short umbilical cords in E18.5 Adamts1-/- and Acan-/- embryos compared to wild type. Red arrowhead indicates an omphalocele in Adamts1-/- embryos. (e) H & E staining of E18.5 wild type, Acan-/- and Adamts1-/- cord cross-sections showing thinner walls in Acan-/- umbilical vessels and thicker walls in Adamts1-/- umbilical vessels. (f–g) Cord length, TM thickness and vessel luminal area quantifications for Adamts1-/- (f) and Acan-/- mice (g) at E18.5 compared to wild-type littermates. Acan-/- umbilical cords show larger lumens and Adamts1-/- vessels show smaller lumens in (n = 7–11 umbilical cords each, whiskers indicate minimum and maximum values, *, p<0.05; **, p<0.01; ***, p<0.001; ****, p<0.0001). (h) Phospho-histone H3 (pHH3) staining shows significantly fewer proliferating cells (white arrowheads) in Acan-/- umbilical vessels. Dotted white lines mark the boundaries of vessel lumens (n = 4 cords each, whiskers indicate minimum and maximum values, **, p<0.001; *, p<0.05). Scale bars = 100 μm in (a), 25 μm in (c), 100 μm and 50 μm in (e).
Figure 4—figure supplement 1
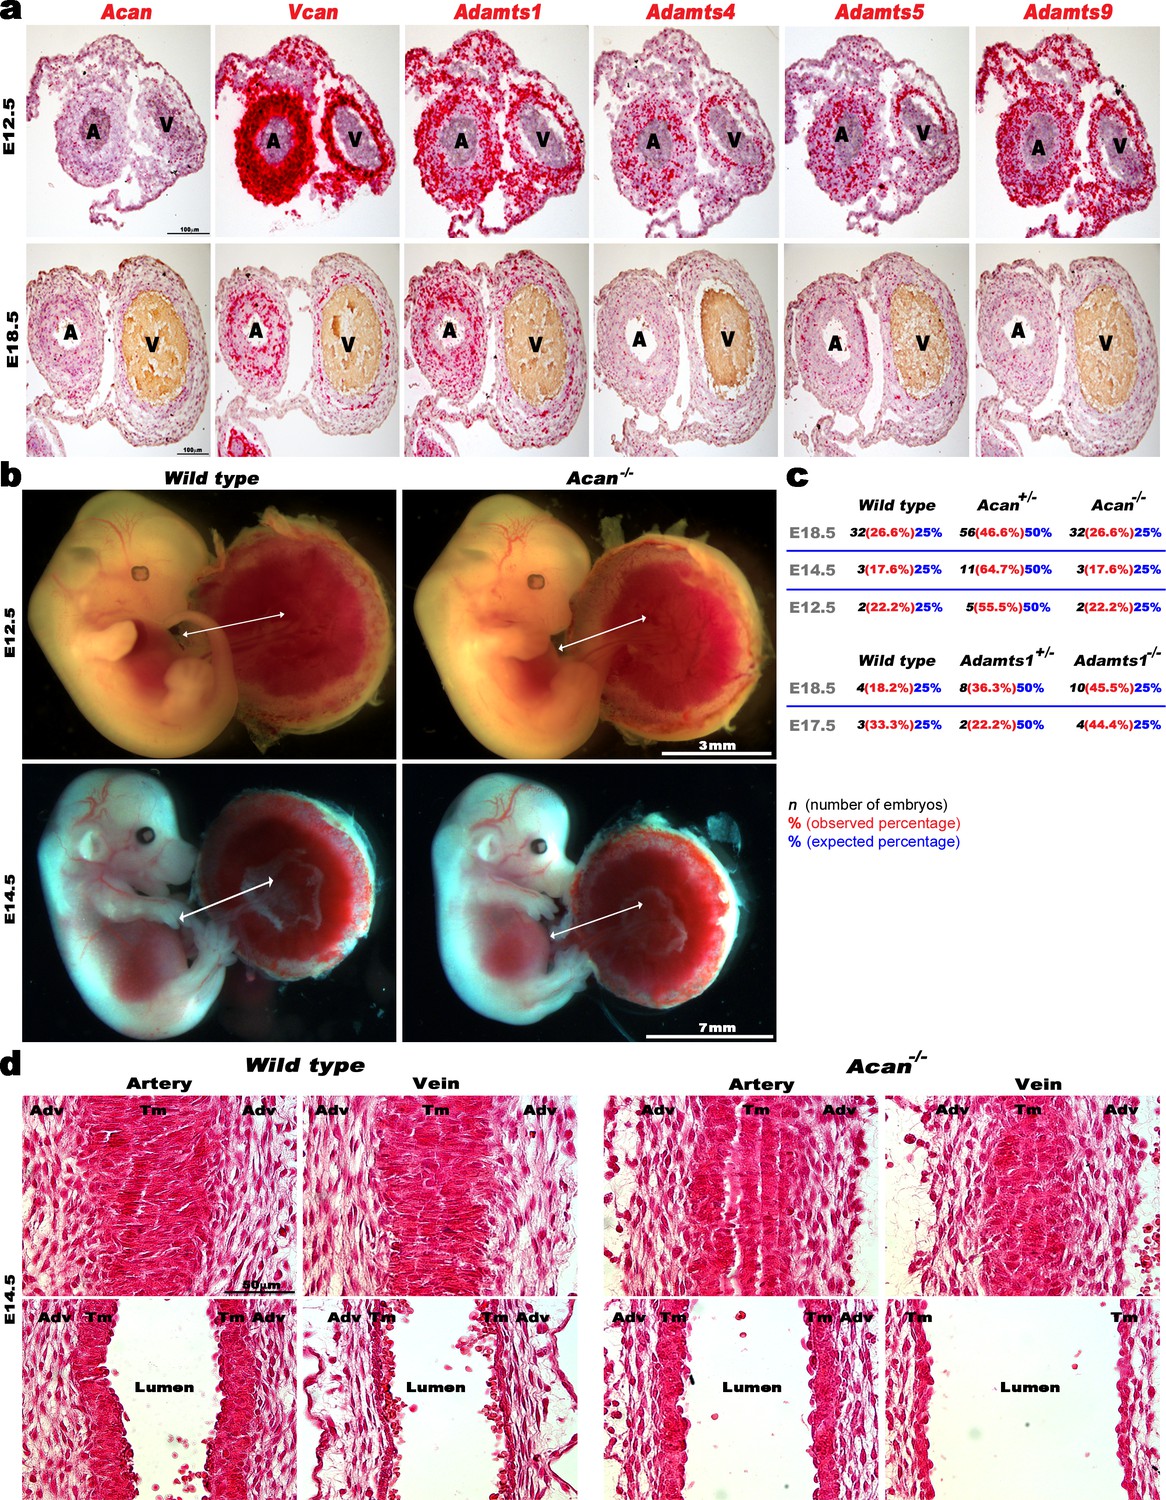
ADAMTS, Vcan and Acan expression and impact of aggrecan loss on early mouse umbilical cord and vessel development.
(a) RNA in situ hybridization analysis of E12.5 and E18.5 mouse umbilical cord sections Acan, Vcan and relevant ADAMTS genes (n = 3 umbilical cords for each probe). (b) E12.5 and E14.5 wildtype and Acan-/- embryos have a comparable umbilical cord length (n = 2 Acan-/- at E12.5 and n = 3 at E14.5). (c) Observed and expected genotype ratios at different embryonic stages from Acan+/- and Adamts1+/- intercrosses. (d) Hematoxylin and eosin staining of E14.5 wild type and Acan-/- umbilical cords shows completion of longitudinal to circumferential reorientation of smooth muscle cells in the mutant arterial tunica media (TM). Upper panels show tangential longitudinal sections whereas the lower panels are taken through the approximate center of each vessel (n = 3 umbilical cords of each genotype). Adv, adventitia; Tm, tunica media. Scale bars in a = 100 μm, 3 mm and 7 mm in (b) and 50 μm in (d).
Figure 5
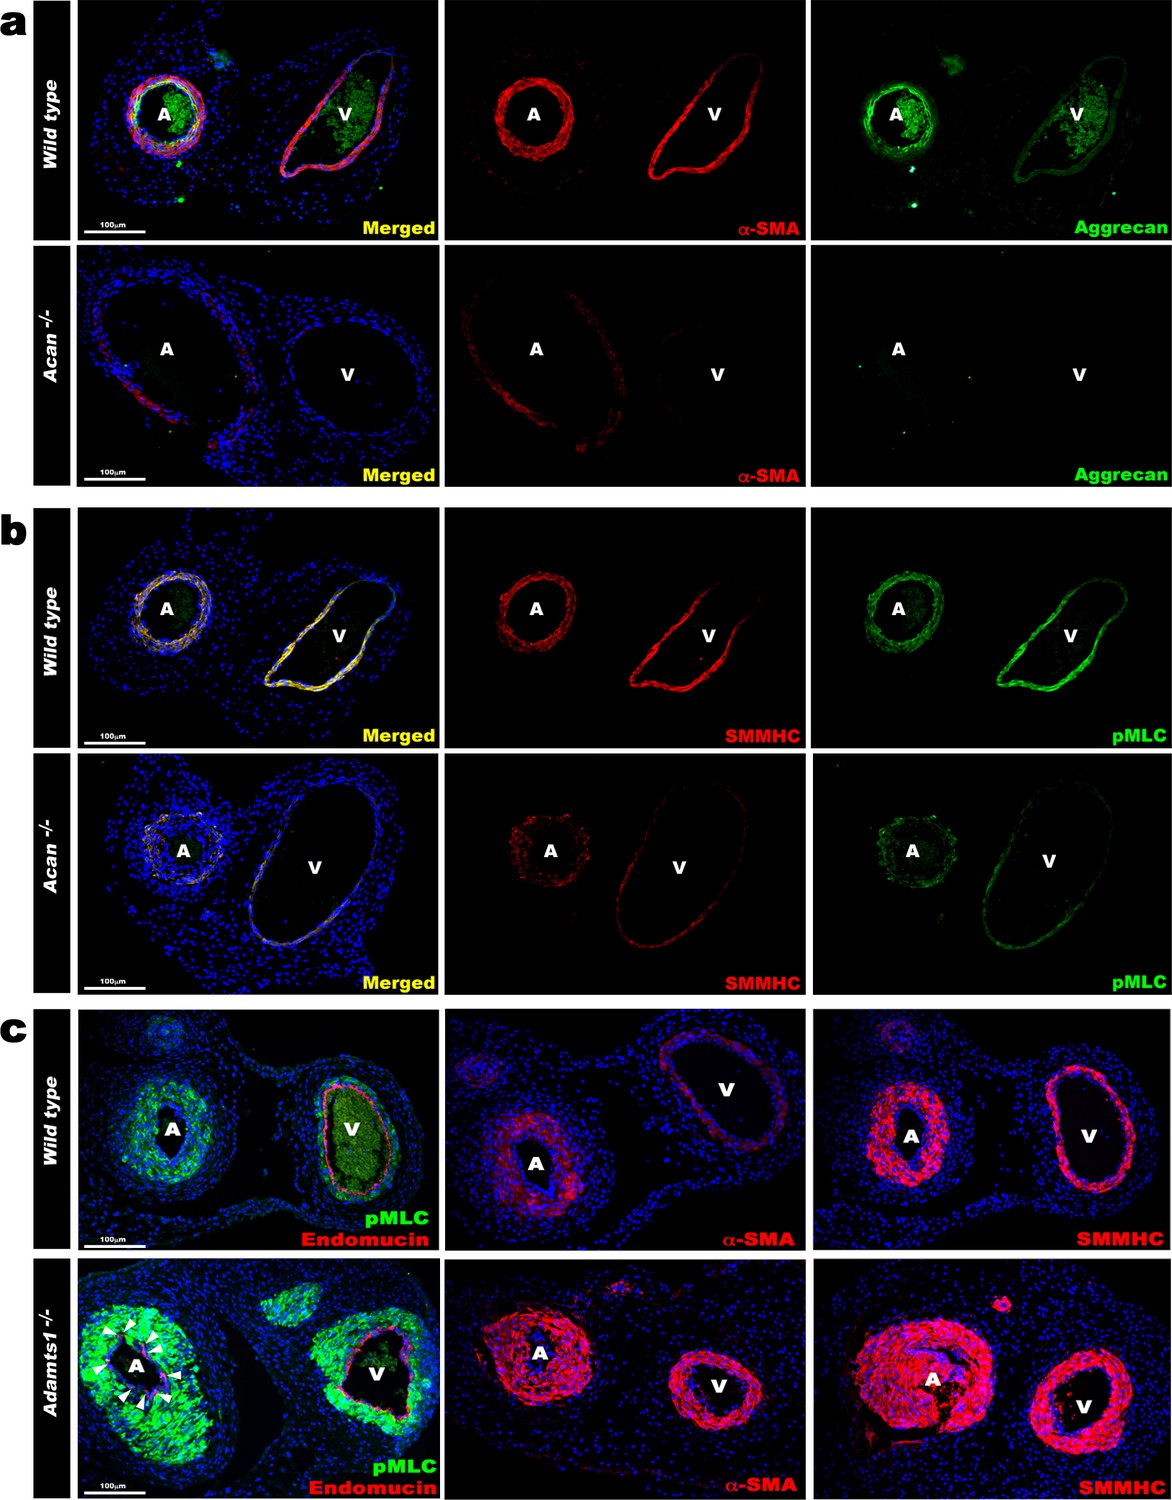
Contrasting smooth muscle cell (SMC) phenotype modulation in Acan and Adamts1-deficient umbilical vessels.
(a) Aggrecan (green) and α-SMA staining (red) in E18.5 umbilical cords show loss of aggrecan and weak α-SMA staining in Acan-/- vessels (n = 3 umbilical cords each genotype). (b) Smooth muscle myosin heavy chain (SMMHC, red) and phosphorylated myosin light chain (pMLC, green) staining in E18.5 umbilical cords showing dramatic signal attenuation in the Acan-/- vessels (n = 3 umbilical cords each genotype) (c) pMLC (green), endomucin (red), α-SMA (red, center panels) and SMMHC (red, right-hand panels) staining shows blunted dimorphism of Adamts1-/- umbilical artery and vein with stronger expression of differentiated SMC markers in Adamts1-/- umbilical vessels and acquisition of endomucin, a venous endothelium marker, by arterial endothelium (n = 3 umbilical cords each genotype) Scale bars = 100 μm in (a–c).
Figure 6
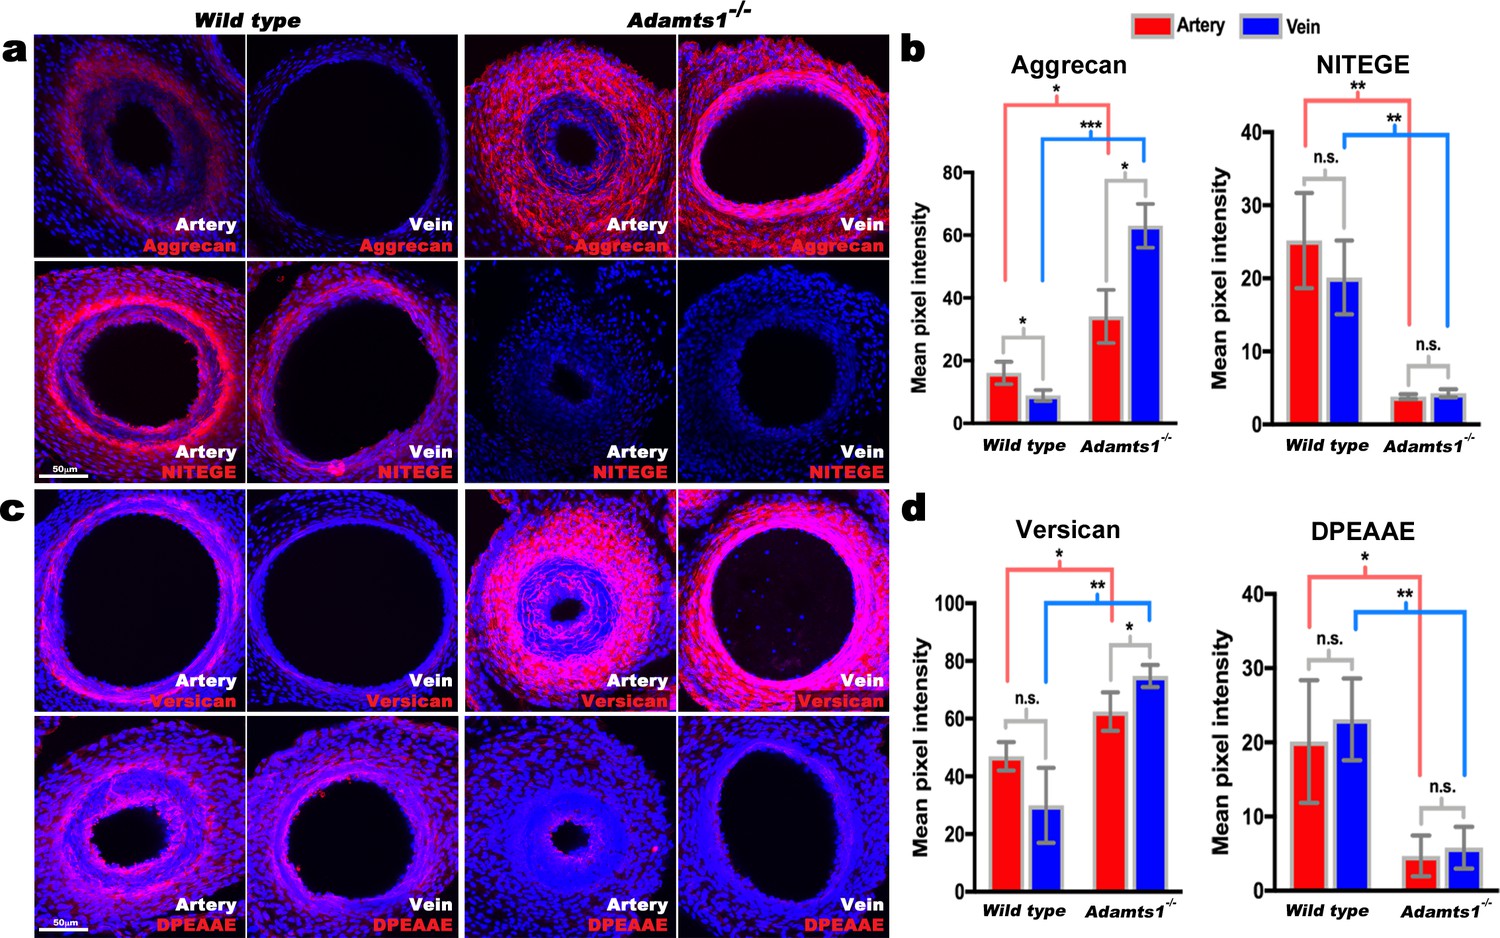
Reduced aggrecan and versican proteolysis in Adamts1-/-umbilical vessels.
(a,b) E17.5 Adamts1-/- umbilical vessels show increased aggrecan staining and reduced anti-NITEGE staining in (a), quantified in (b) (n = 3 cords each genotype, error bars indicate mean ±S.D.*, p<0.05; **, p<0.01; ***, p<0.001). (c,d) Adamts1-/- umbilical vessels show increased versican (c) and reduced anti-DPEAAE staining quantified in (d) (n = 3 cords each genotype, error bars indicate mean ±S.D. *, p<0.05; **, p<0.01). Scale bars = 50 μm in (a–c).
Figure 7 with 2 supplements
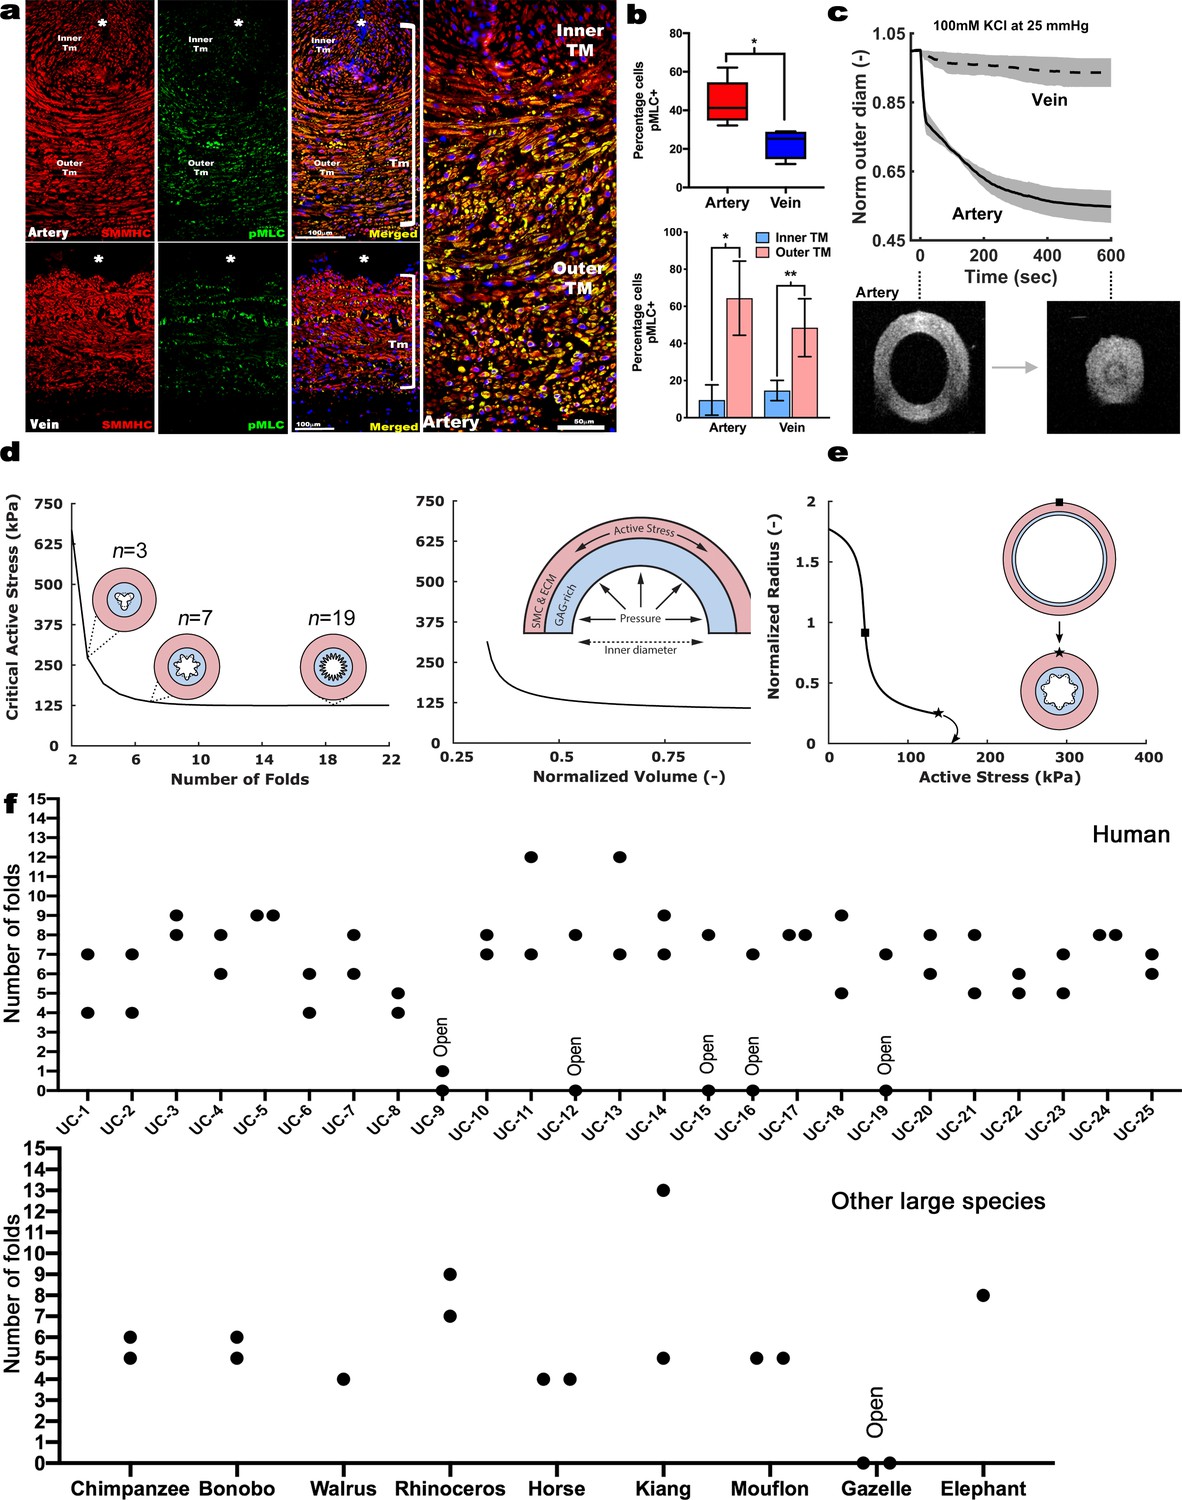
Contraction-induced buckling ensures effective closure of the umbilical artery at birth.
(a) Smooth muscle myosin heavy chain (SMMHC-red) and serine-20 phosphorylated myosin light-chain (pMLC-green) show more contraction-primed SMCs in the outer arterial tunica media (TM, white brackets) than the umbilical vein. Scale bars are 100 µm. (b) Quantitation of pMLC+ SMCs in the artery (red) and vein (blue) (top, n = 5 arteries, four veins, whiskers indicate minimum and maximum values, *, p<0.05) and inner and outer TM of both reveal similar distributions but more pMLC+ SMC in the outer artery TM (bottom, n = 3 arteries, four veins, error bars indicate mean ±S.D. *, p<0.05; **, p<0.01). (c) Differential contraction of murine umbilical artery and vein stimulated by 100 mM potassium chloride (KCl) under biaxial loading confirms greater contractility in the artery, with OCT images prior to and following contraction-induced arterial closure (n = 4 arteries and n = 4 veins). (d) Computational simulations of a bilayered artery with contractile SMCs in the outer layer and swollen inner layer: critical contractile stress values leading to buckling for (left) different numbers of folds for a normalized inner layer volume of 0.5 and (right) decreasing values of normalized volume of the inner layer for seven folds. (e) Normalized inner radius as a function of contractile stress for inner layer volume change of 0.5 and 7 folds. The states for the inflection (square) and critical active stress (star) are illustrated by the schematics; complete closure achieved with contraction-induced buckling. All simulations were run for 25 mmHg pressure. Due to the linear stability analysis, the amplitude of the folds in the buckled schematics is illustrative. (f) Number of buckles observed in human (top, indicated as umbilical cord (UC)1–25) and other large mammalian (bottom) umbilical arteries. Both arteries per cord were included. Open vessel lumens are indicated where observed.
Figure 7—figure supplement 1
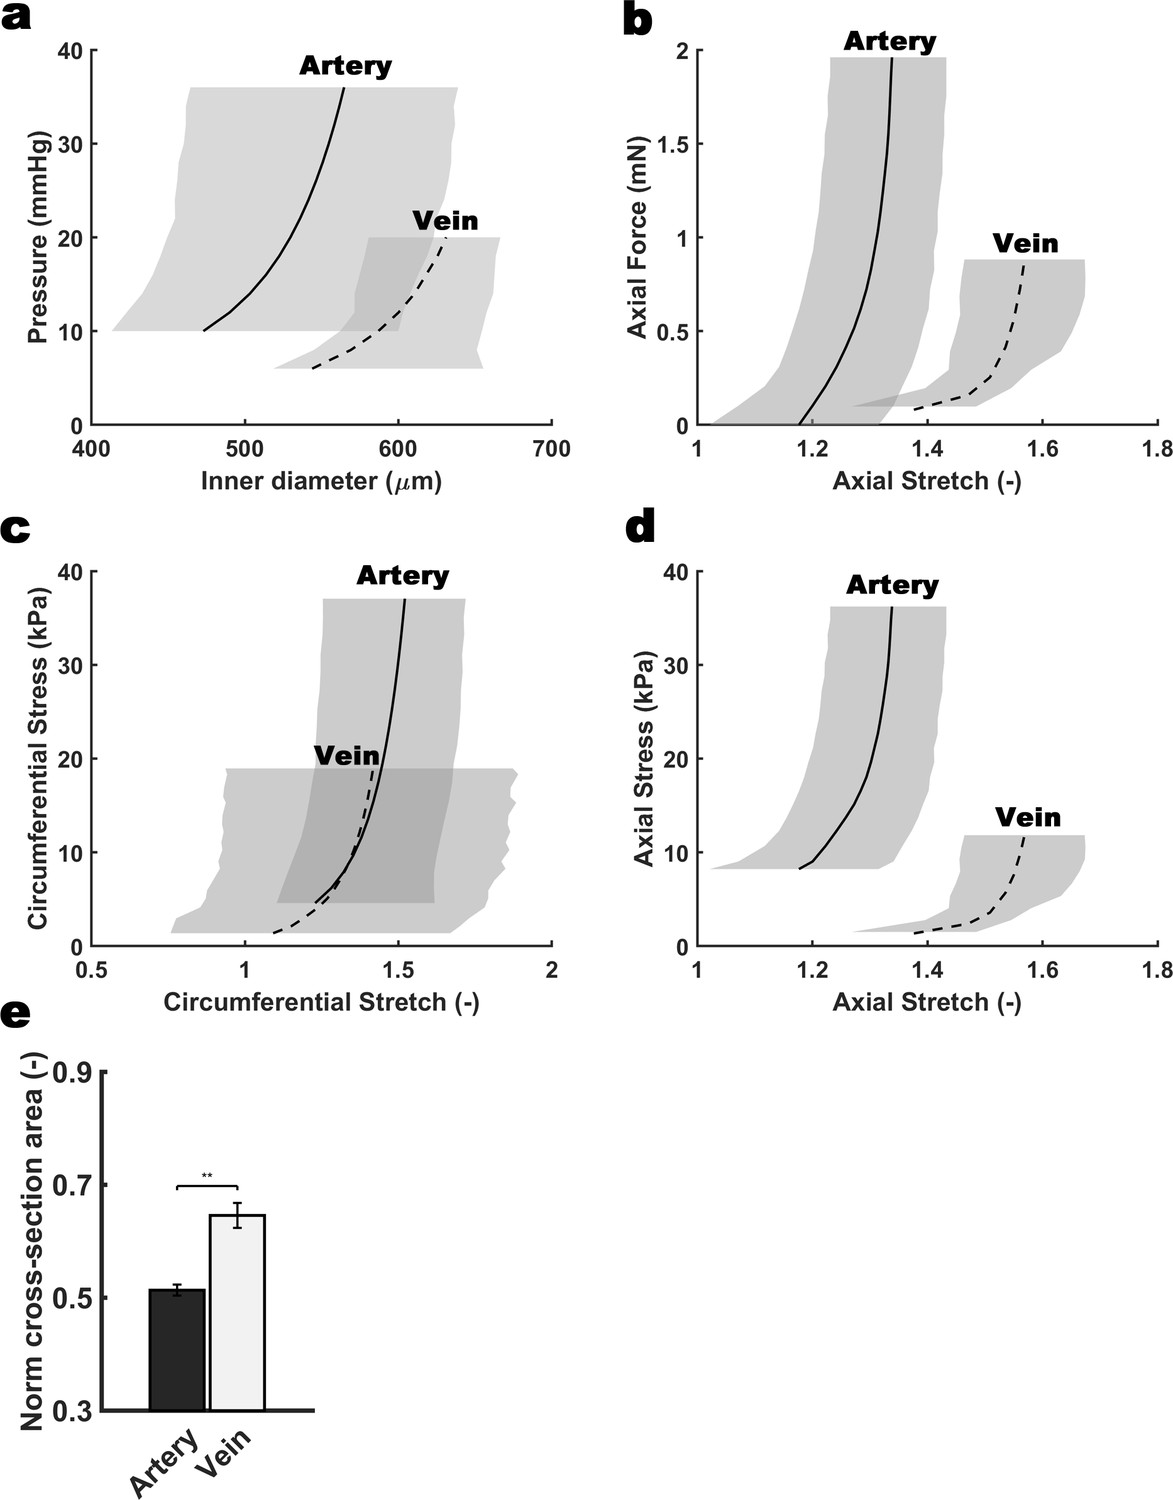
Differential biomechanical properties of arteries and veins of the mouse umbilical cord.
Biaxial structural (a,b) and material (c,d) behaviors exhibited by umbilical arteries and veins harvested from wild type E18.5 umbilical cords. The curves show model predicted results for the mean behaviors based on best-fit parameters determined from seven different testing protocols performed individually on n = 4 arteries and n = 4 veins. Though based on data from all seven protocols, for illustrative purposes results are shown for pressure-diameter behaviors during quasi-static pressurization at a fixed vessel-specific in vivo length and quasi-static axial extension at fixed pressures (25 mmHg for the arteries, and 5 mmHg for the veins). Grey-shaded regions show S.D. (e) Change in normalized cross-sectional area for the umbilical vein at 5 mm Hg and for the umbilical artery at 25 mm Hg during isobaric contraction. Error bars indicate S.E.M, **, p<0.01.
Figure 7—figure supplement 2

Computational results for a model umbilical artery.
(a) Normalized inner radius as a function of normalized volume of the inner layer alone for different fixed values of the active stress parameter Tact and (b) inner radius as a function of the active stress parameter Tact for different fixed values of normalized volume in the inner layer. Loaded inner radius a was normalized by the unloaded inner radius A; the current volume of the vessel v was normalized by the original volume of the vessel V. (c) Critical value of the active stress parameter Tact as a function of the normalized volume in the inner layer for different numbers of buckling-induced luminal folds n. (d) Mean circumferential stress tθθ across the umbilical artery wall for varying normalized volumes: (i) and (ii) show circumferential stress for the case of shrinkage of the inner layer alone with v/V = 0.5 while (iii) and (iv) show the case of no swelling with v/V = 1.0. All simulations use the loading conditions, luminal pressure p=25 mmHg and fixed axial stretch λz=1.28.
Figure 8

The unique bilayered design of the umbilical artery underlies its rapid occlusion at birth.
(a) Differential expression of ADAMTS proteases and large CS-proteoglycans during development results in a bilayered artery with a hydrated proteoglycan-rich inner layer and most contractile SMCs located in the outer layer, contrasting with the umbilical vein (see key at top of figure identifying the illustrated major elements). (b) At birth, SMC contraction in the outer layer and fluid movement-induced inner layer buckling redirects the inner layer into the lumen. The single-layered vein does not undergo buckling. (c) Umbilical artery occlusion at birth prevents neonatal exsanguination, whereas the patent vein allows a final transfusion from the placenta.
Tables
Table 1
Model parameters fixed for all simulations of the umbilical artery, determined primarily from the biaxial biomechanical data and histological findings.
| Parameters | Description | Values |
|---|---|---|
| Unloaded inner, interface, outer radius | 161.77, 206.86, 236.92 µm | |
| Loaded axial stretch | 1.28 | |
| GAG/matrix shear modulus inner, outer layer | 3.0 kPa, 0.1 kPa | |
| Axial fiber family material parameters | 0.013 kPa, 11.65 | |
| Circumferential fiber family material parameters | 2.66 kPa, 1.20 | |
| Diagonal fiber families’ material parameters | 3.04 kPa, 4.23 | |
| Diagonal fiber families’ alignment parameter | 41.92°, −41.92° | |
| Maximum, minimum contractile stretch | 2.5, 0.2 |
Key resources table
| Reagent type (species) or resource | Designation | Source or reference | Identifiers | Additional information |
|---|---|---|---|---|
| Gene (Homo sapiens) | ACAN | GenBank | RRID:HGNC:319 | Chondroitin sulphate proteoglycan 1 |
| Gene (Homo sapiens) | VCAN | GenBank | RRID:HGNC:2464 | Chondroitin sulphate proteoglycan 2 |
| Gene (Homo sapiens) | ADAMTS1 | GenBank | RRID:HGNC:217 | ADAM metallopeptidase with thrombospondin type 1 motif 1 |
| Gene (Homo sapiens) | ADAMTS4 | GenBank | RRID:HGNC:220 | ADAM metallopeptidase with thrombospondin type 1 motif 4 |
| Gene (Homo sapiens) | ADAMTS5 | GenBank | RRID:HGNC:221 | ADAM metallopeptidase with thrombospondin type 1 motif 5 |
| Gene (Homo sapiens) | ADAMTS9 | GenBank | RRID:HGNC:13202 | ADAM metallopeptidase with thrombospondin type 1 motif 9 |
| Genetic reagent (Mus musculus) | Acancmd-Bc (C57BL/6J background) | Krueger et al., 1999 | RRID:MGI:1855999 | Acan null allele |
| Genetic reagent (Mus musculus) | Adamts1tm1Dgen (C57BL/6J background) | Oller et al., 2017 | RRID:MGI:5427602 | Adamts1 null and LacZ reporter allele |
| Antibody | Mouse monoclonal smooth muscle α-actin (α-SMA) Cy3 conjugated | Millipore Sigma C6198 | RRID:AB_476856 | IF (1:400) |
| Antibody | Rat monoclonal smooth muscle myosin heavy chain (SMMHC) | Kamiya Biomedical MC352 | RRID:AB_1241986 | IF (1:400) |
| Antibody | Rabbit polyclonal Serine-20 phosphorylated myosin light chain (pMLC) | Abcam Ab2480 | RRID:AB_303094 | IF (1:200) |
| Antibody | Rabbit polyclonal anti-serine-10 phosphorylated histone H3 (pHH3) | Millipore Sigma 06–570 | RRID:AB_310177 | IF (1:200) |
| Antibody | Mouse monoclonal anti-chondroitin sulfate (7D4) antibody | Bruce Caterson/Clare Hughes laboratory (Sorrell et al., 1990) | RRID:AB_2864328 | IF (1:200) |
| Antibody | Mouse monoclonal FITC-conjugated anti-heparan sulfate (10E4) antibody | US Biological H-1890 | RRID:AB_10013601 | IF (1:200) |
| Antibody | Rabbit polyclonal Anti-versican (pVC) | Apte laboratory (Foulcer et al., 2014) | RRID:AB_2864327 | IF (1:400) human tissue |
| Antibody | Rabbit polyclonal anti-versican GAG-beta | Millipore Sigma AB1033 | RRID:AB_90462 | IF (1:400) mouse tissue |
| Antibody | Rabbit polyclonal anti-versican V0/V1 neo epitope DPEAAE | Invitrogen PA1-1748A | RRID:AB_2304324 | IF (1:200) human/mouse |
| Antibody | Rabbit polyclonal anti-aggrecan | Millipore Sigma AB1031 | RRID:AB_90460 | IF (1:400) all species |
| Antibody | Rabbit polyclonal anti-aggrecan neo epitope NITEGE | Invitrogen PA1-1746 | RRID:AB_2242021 | IF (1:200) all species |
| Antibody | Rat monoclonal anti-endomucin antibody (clone eBioV.7C7) | Invitrogen 14-5851-85 | RRID:AB_891531 | IF (1:400) |
| Antibody | Rabbit polyclonal anti-SOX9 antibody | Millipore Sigma AB5535 | RRID:AB_2239761 | IF (1:200) |
| Commercial assay or kit | ACAN RNAscope In situ probe | ACD bio | 506841 | Human probe |
| Commercial assay or kit | Acan RNAscope In situ probe | ACD bio | 439101 | Mouse probe |
| Commercial assay or kit | VCAN-E8 RNAscope In situ probe | ACD bio | 452241 | Human probe detects exon 8 |
| Commercial assay or kit | Vcan-E8 RNAscope In situ probe | ACD bio | 428321 | Mouse probe detects exon 7 |
| Commercial assay or kit | ADAMTS1 RNAscope In situ probe | ACD bio | 524501 | Human probe |
| Commercial assay or kit | Adamts1 RNAscope In situ probe | ACD bio | 463361 | Mouse probe |
| Commercial assay or kit | ADAMTS4 RNAscope In situ probe | ACD bio | 537341 | Human probe |
| Commercial assay or kit | Adamts4 RNAscope In situ probe | ACD bio | 497161 | Mouse probe |
| Commercial assay or kit | ADAMTS5 RNAscope In situ probe | ACD bio | 427611 | Human probe |
| Commercial assay or kit | Adamts5 RNAscope In situ probe | ACD bio | 427621 | Mouse probe |
| Commercial assay or kit | ADAMTS9 RNAscope In situ probe | ACD bio | 445321 | Human probe |
| Commercial assay or kit | Adamts9 RNAscope In situ probe | ACD bio | 400441 | Mouse probe |
| Commercial assay or kit | RNAscope 2.5 HD Red In situ detection kit | ACD bio | 322350 | Used for detecting all probes in this study |
| Software, algorithm | Affymetrix Transcriptome Analysis Console, RMA-SST sketch algorithm | Affymetrix TAC 4.0 | RRID:SCR_018718 | Used for gene expression analysis for all microarray experiments in the study |
| Software, algorithm | R | Bell Laboratories/R Foundation for Statistical Computing Ver. 3.5.2. | RRID:SCR_001905 | Used for statistical computing of microarray data |
| Software, algorithm | GraphPad Prism | GraphPad | RRID:SCR_002798 | Used for statistical computing of other experimental data |
-
Abbreviations, IF, Immunofluorescence.
Additional files
-
Supplementary file 1
Microarray comparison of transcriptome of the human umbilical artery and vein.
- https://cdn.elifesciences.org/articles/60683/elife-60683-supp1-v2.xlsx
-
Supplementary file 2
Microarray comparison of the transcriptome of the inner umbilical artery tunica media with the outer umbilical artery tunica media.
- https://cdn.elifesciences.org/articles/60683/elife-60683-supp2-v2.xlsx
-
Transparent reporting form
- https://cdn.elifesciences.org/articles/60683/elife-60683-transrepform-v2.docx
Download links
A two-part list of links to download the article, or parts of the article, in various formats.
Downloads (link to download the article as PDF)
Open citations (links to open the citations from this article in various online reference manager services)
Cite this article (links to download the citations from this article in formats compatible with various reference manager tools)
Vascular dimorphism ensured by regulated proteoglycan dynamics favors rapid umbilical artery closure at birth
eLife 9:e60683.
https://doi.org/10.7554/eLife.60683


