Generation of stress fibers through myosin-driven reorganization of the actin cortex
- HiLIFE Institute of Biotechnology, University of Helsinki, Finland
- Section of Pathology, Department of Veterinary Biosciences, Faculty of Veterinary Medicine, University of Helsinki, Finland
Figures
Figure 1 with 2 supplements
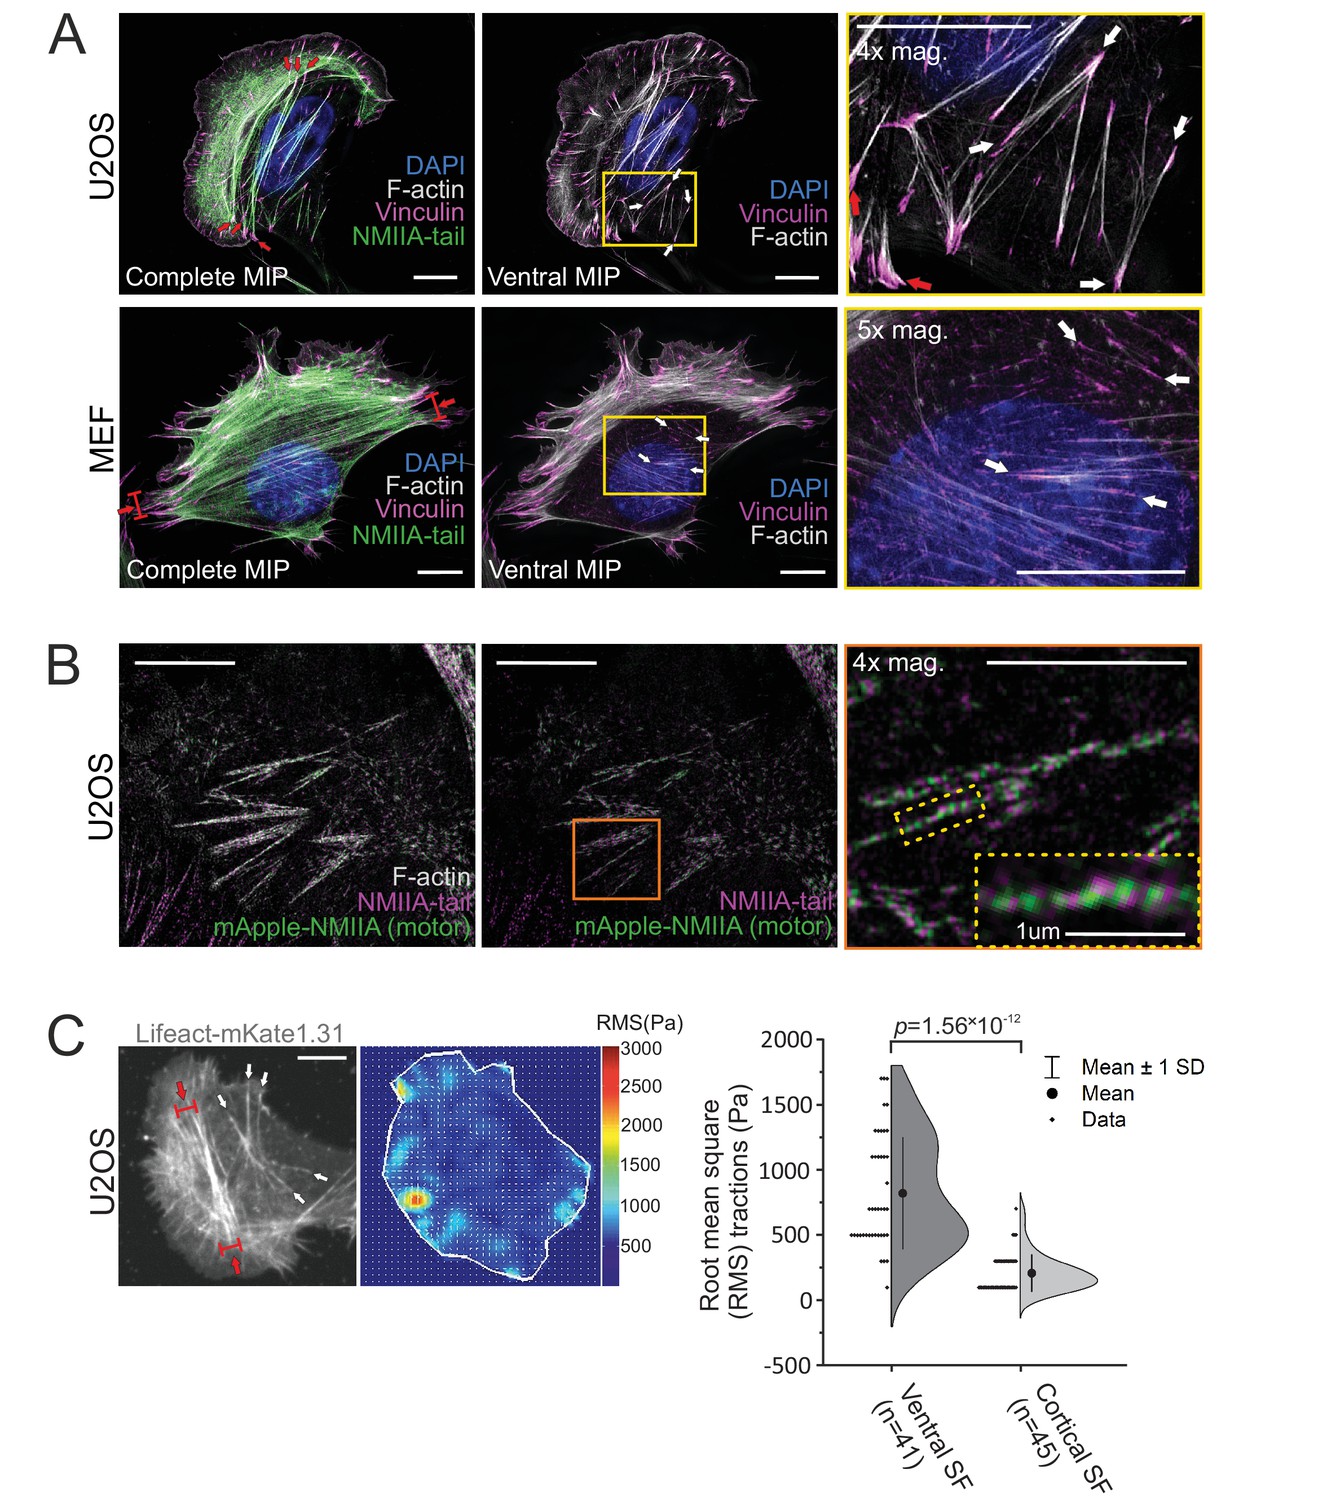
Stress fiber architecture of migrating cells.
3D-structured illumination microscopy (SIM) maximum intensity projections (MIPs) of the actomyosin networks in cells migrating on fibronectin. (A) Human osteosarcoma (U2OS) and mouse embryonic fibroblast (MEF) cells, where the panels on the left display complete MIPs. The panels in the middle show only the filament structures close to the ventral plane (‘ventral MIP’), and the panels on the right are magnifications of the boxed regions from the middle panels. Red arrows highlight ventral stress fibers, and white arrows indicate examples of thin cortical stress fibers that are embedded at the cell cortex. DAPI (blue) and phalloidin (gray) were applied to mark the F-actin and nucleus, respectively. Vinculin (magenta) and non-muscle myosin II (NMII)A tails (green) were detected with respective specific antibodies. (B) 3D-SIM MIP projection from the ventral plane of a U2OS cell transfected with mApple-NMIIA construct (motor, green) and stained with NMIIA-tail specific antibody (magenta, tail) and phalloidin to visualize F-actin. 4× and 10× magnifications (orange box and yellow dotted box, respectively) show the bipolar NMIIA filaments in cortical stress fibers. (C) Traction force microscopy (TFM) analysis of the forces exerted by ventral stress fibers (red arrows) and cortical stress fibers (white arrows) to the underlying substrate. On the left, exemplary image of a LifeAct-mKate1.31-expressing U2OS cell and the obtained force map with root mean square tractions (RMS). Quantification of the RMS forces between the two stress fiber subtypes (n = 41 for ventral stress fibers [SF] and 45 for cortical stress fibers) is shown on right as half-violin plot including binned individual data points and mean with ±1 standard deviation (SD). p = 1.56 × 10⁻¹² (Mann–Whitney U-test, including outliers). Scale bars 10 µm and 5 µm for whole cell images and magnifications, respectively.
-
Figure 1—source data 1
Combined data of RMS traction forces.
- https://cdn.elifesciences.org/articles/60710/elife-60710-fig1-data1-v4.xlsx
Figure 1—figure supplement 1
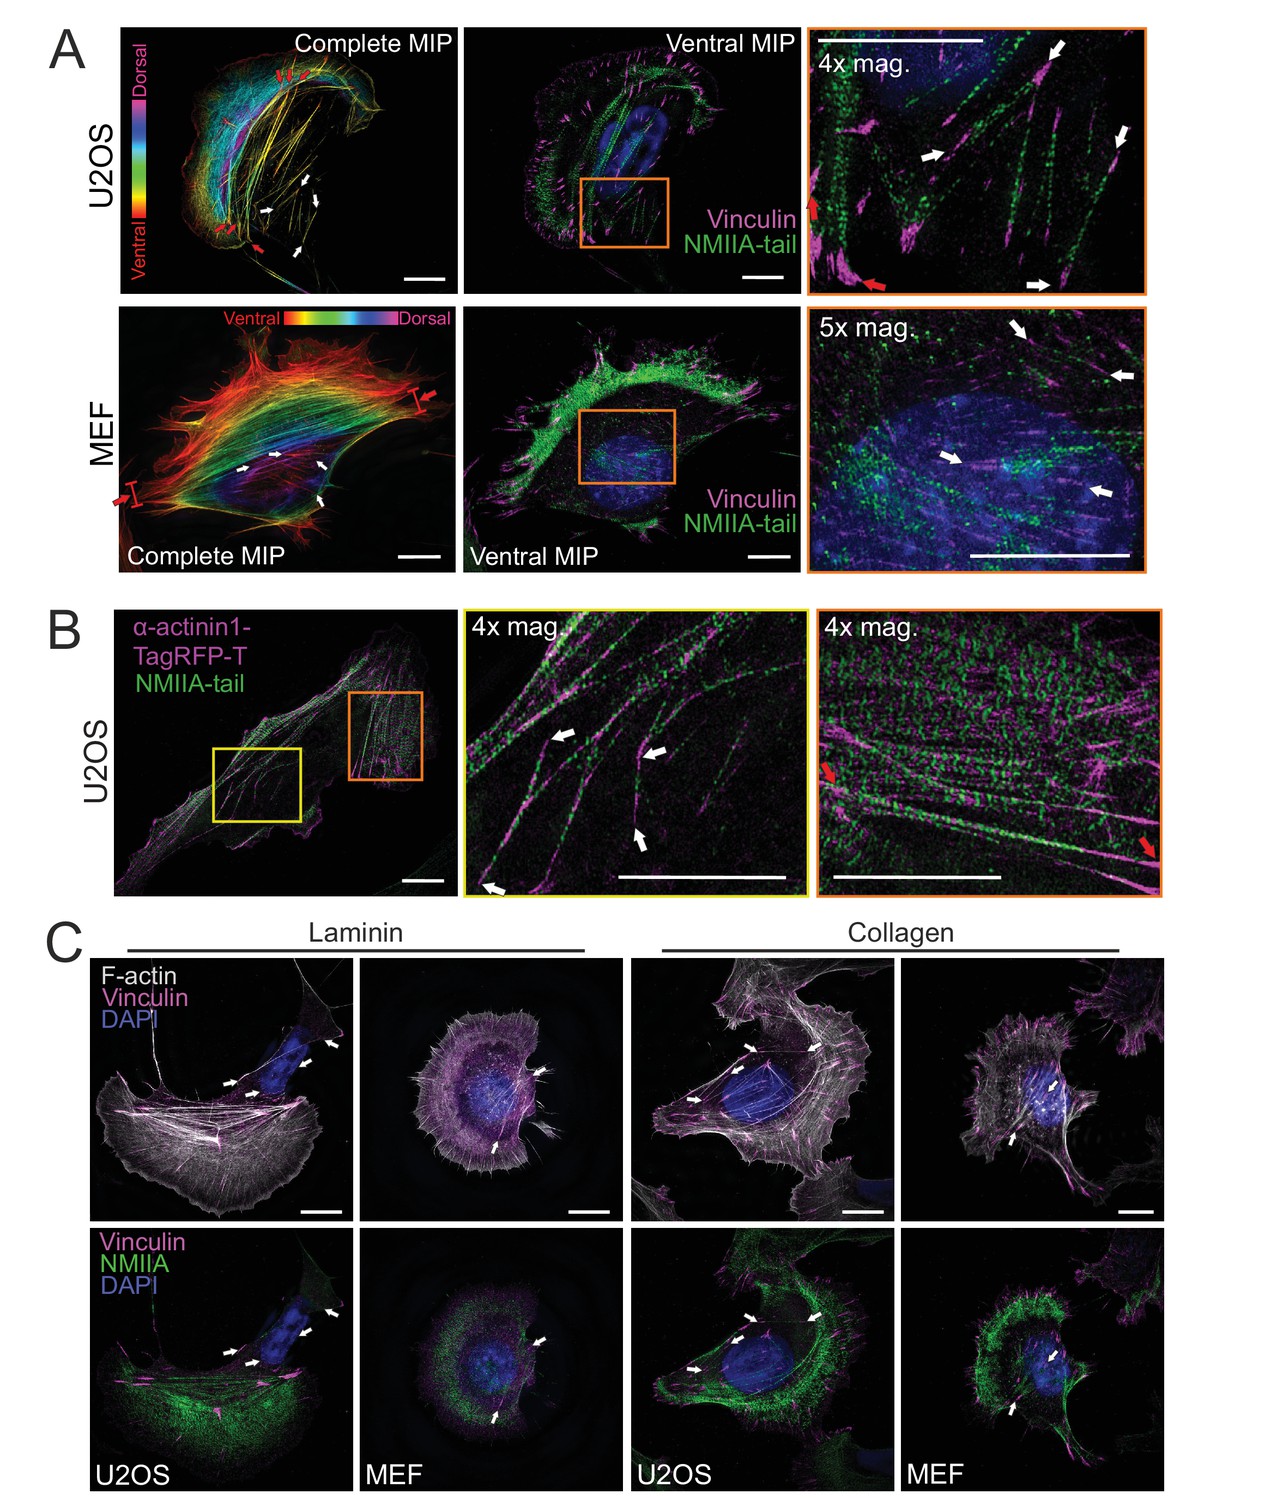
Cortical stress fibers display periodic non-muscle myosin II (NMII) — α-actinin pattern and assemble on different ECMs.
(A) Human osteosarcoma (U2OS) and mouse embryonic fibroblast (MEF) cells (related to Figure 1A), where vinculin and NMII were detected by specific antibodies, and F-actin and nucleus by fluorescent phalloidin and DAPI, respectively. Two panels on the left show temporal color-coded projection from the phalloidin staining, where red and white arrows highlight ventral stress fibers and cortical stress fibers, respectively. At the middle, ventral plane of the cells show the localizations of vinculin and NMIIA tail. On the right, magnification of the boxed regions form the middle panels demonstrating the presence of thin cortical stress fibers (white arrows) at the back of the cell and in the vicinity of the nucleus. (B) α-actinin-1 and NMIIA localization in ventral stress fibers and cortical stress fibers in a U2OS cell. 3D-structured illumination microscopy (SIM) maximum intensity projection (MIP) with 4× magnifications of ventral stress fibers (orange box) display the periodic localization of the α−actinin1-TagRFP-T and NMIIA in the ventral stress fibers (red arrows), whereas cortical stress fibers (4× mag., yellow box) display less regular pattern of α-actinin. (C) 3D-SIM MIPs of U2OS and MEF cells cultured either on laminin or collagen coated dishes. F-actin was visualized by fluorescent phalloidin, focal adhesions by vinculin antibody, and nuclei by DAPI. Endogenous NMIIA tail domain was visualized by specific antibody. White arrows indicate examples of cortical stress fibers. Scale bars 10 µm and 5 µm for whole cell images and magnified areas, respectively.
Figure 1—figure supplement 2
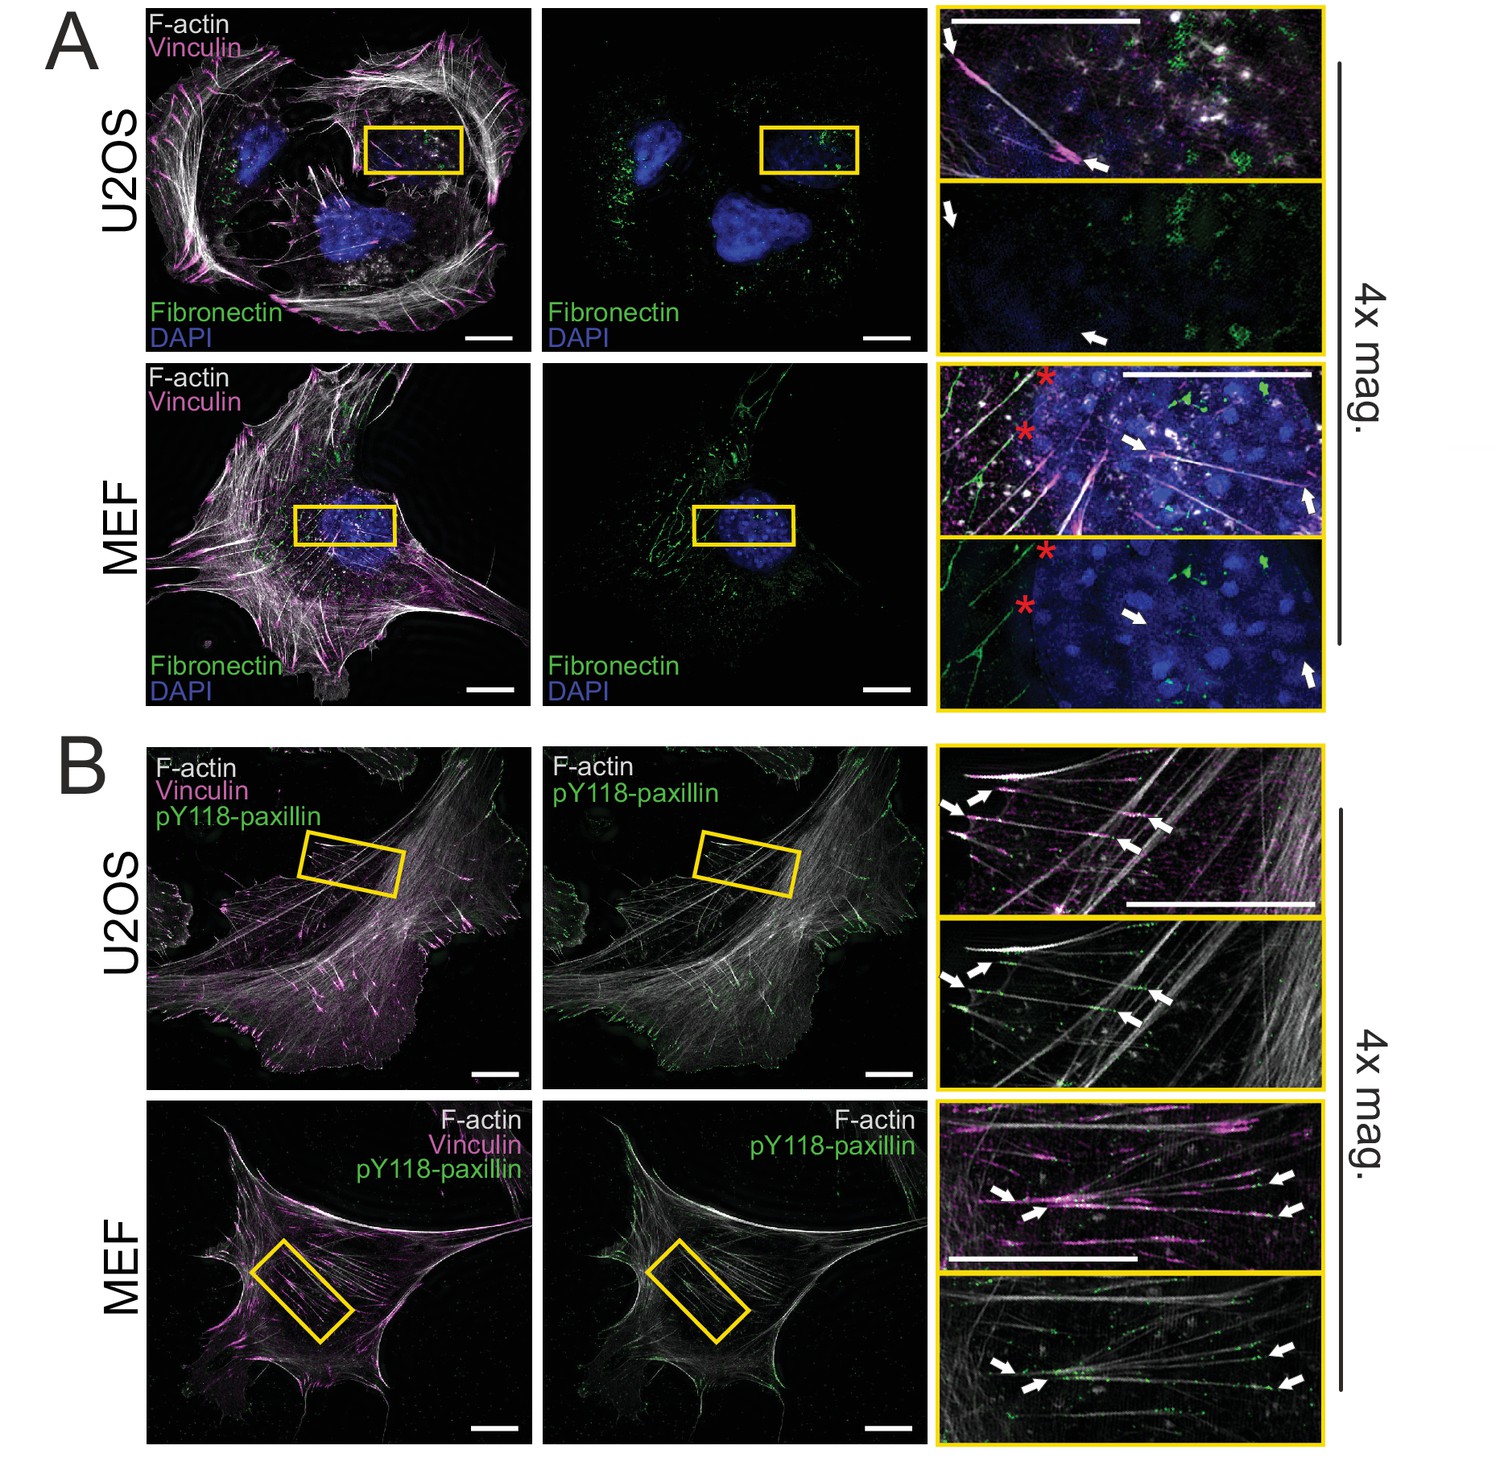
Cortical stress fibers are not linked to fibrillar adhesions.
(A) 3D-structured illumination microscopy (SIM) maximum intensity projections (MIPs) of human osteosarcoma (U2OS) cells and mouse embryonic fibroblasts (MEFs) cultured on uncoated high precision glass coverslips. An antibody detecting fibronectin was applied to visualize fibronectin deposits under the cells. 4× magnifications on the right (from yellow boxes) display cortical stress fibers (white arrows) in both cell types and demonstrate that in U2OS cells they do not co-localize with the fibronectin. For MEFs, some cortical stress fibers were associated with the fibronectin deposits (red asterisks). Nuclei were detected by DAPI. (B) An antibody detecting the Y118-phosphorylated version of the paxillin was applied to discern the focal adhesions from fibrillar adhesions, which were reported to be devoid of paxillin phosphorylation (Zaidel-Bar et al., 2007). 3D-SIM MIPs from both U2OS and MEF cells on fibronectin-coated high precision coverslips were stained with phalloidin (F-actin) and an antibody to detect vinculin. 4× magnification of marked areas (yellow boxes) illustrate pY118-paxillin co-localization with vinculin at the focal adhesions in the ends of cortical stress fibers (white arrows). Scale bars 10 μm and 5 μm for the whole cell images and magnified images, respectively.
Figure 2 with 1 supplement
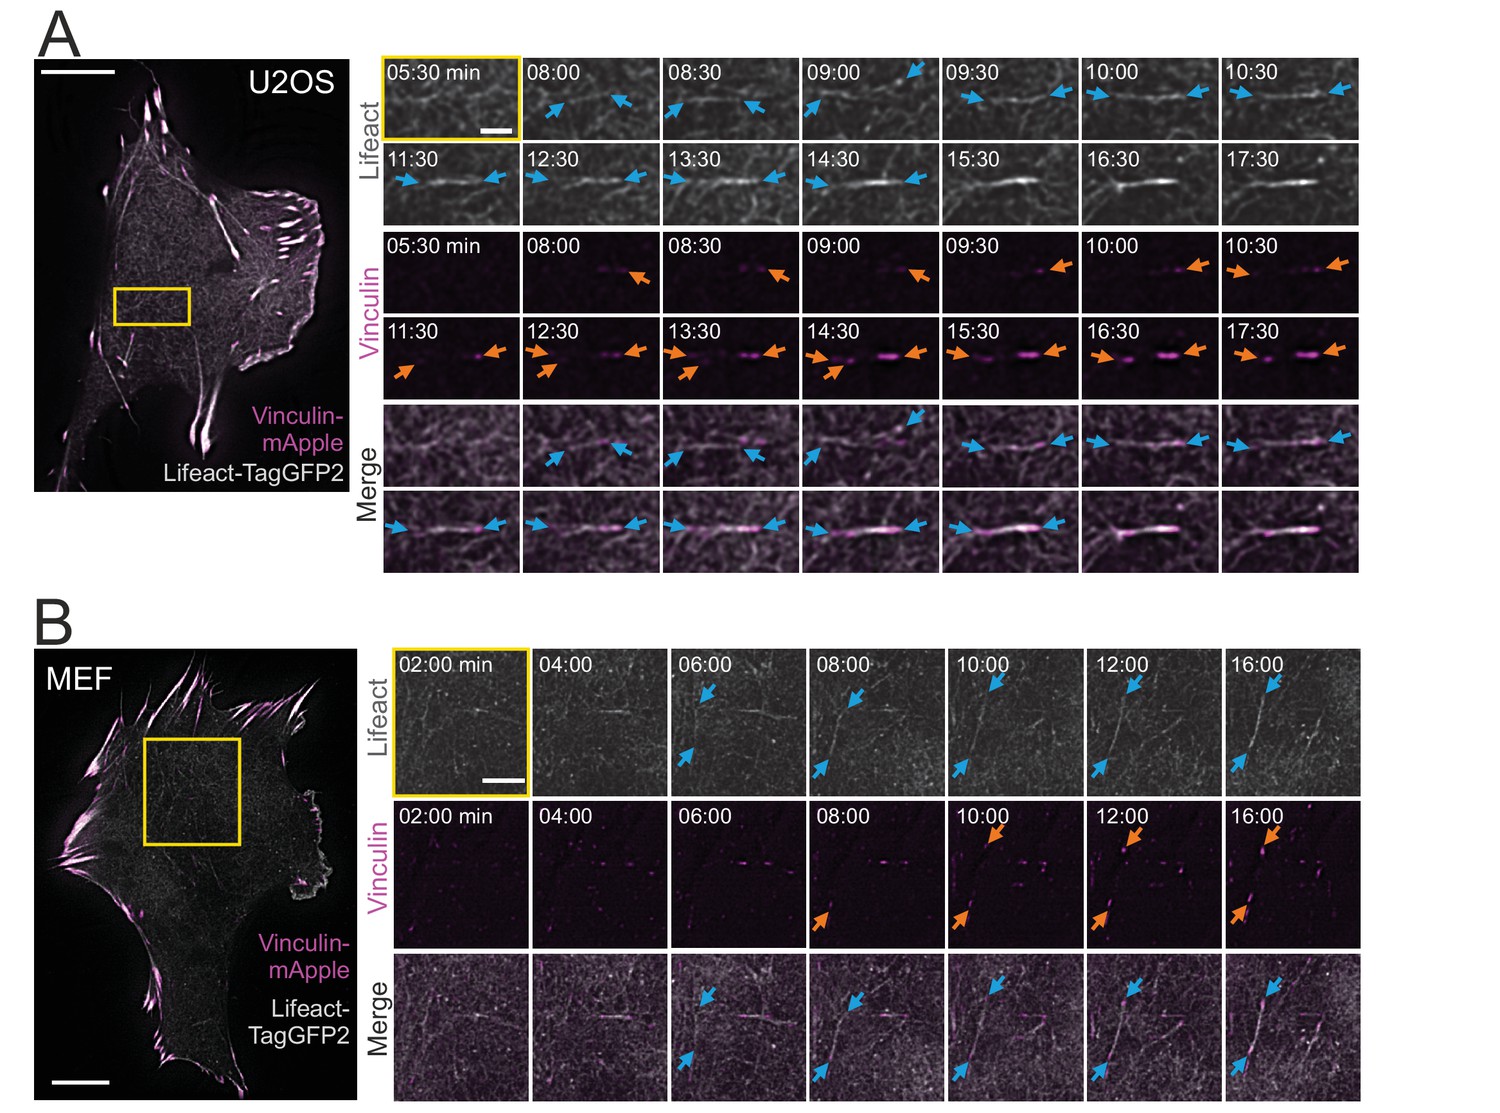
Cortical stress fibers assemble de novo from the actin cortex.
TIRF time-lapse imaging of a migrating human osteosarcoma (U2OS) (A) and mouse embryonic fibroblast (MEF) cell (B) expressing LifeAct-TagGFP2 (gray) and vinculin-mApple (magenta). Selected time-lapse frames from the magnified areas (yellow box) are shown on the right as separate channels and merged frames. These demonstrate the de novo emergence of a cortical stress fiber from the ventral actin cortex. Blue arrows illustrate F-actin bundling and orange arrows point the maturation of the vinculin-positive focal adhesions. See also Videos 1 and 2. Scale bars 10 µm and 2 µm for whole cell images and time-lapse zoom-ins, respectively. Imaging interval 30 s.
Figure 2—figure supplement 1
Cortical stress fibers emerge from the ventral actin cortex through different intermediate assembly states.
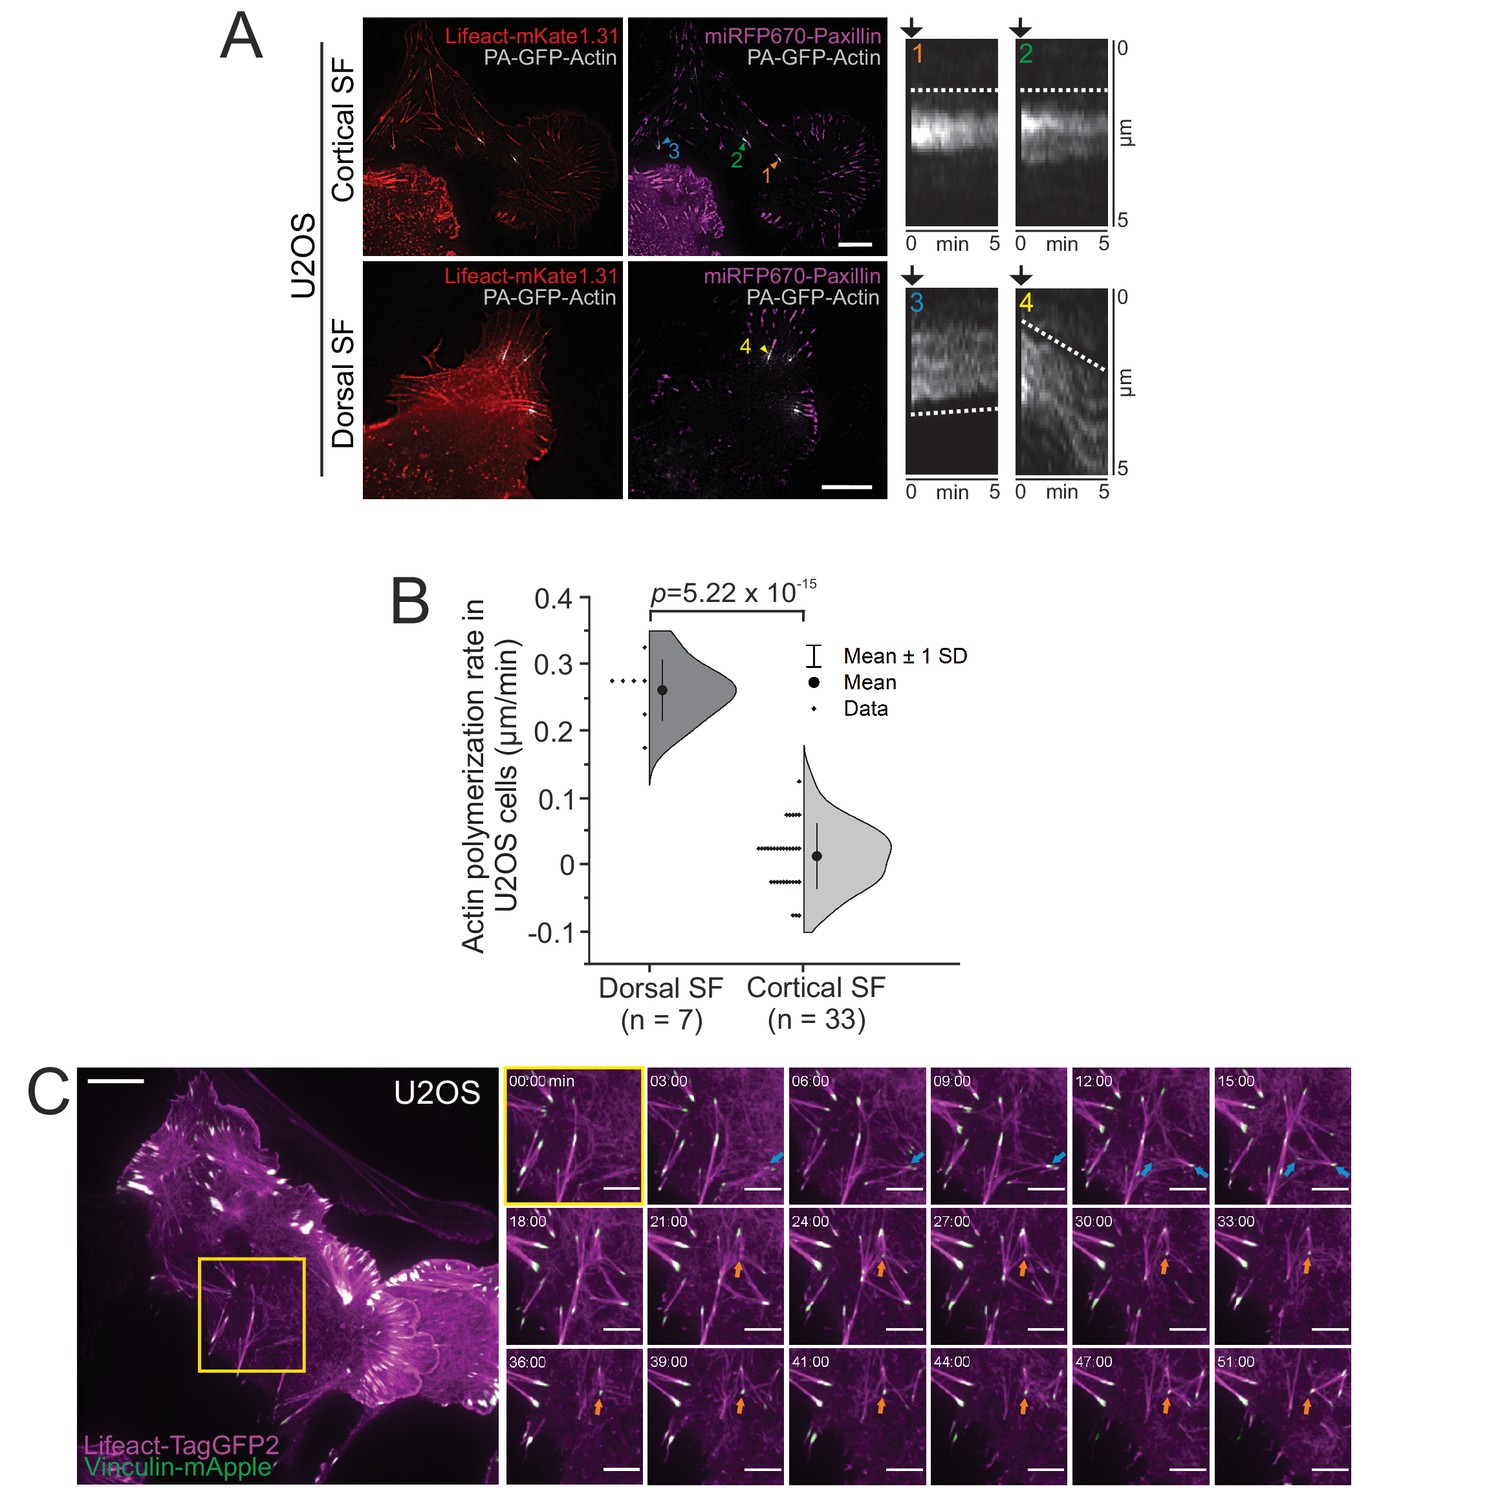
(A) Photoactivation of PA-GFP-actin (gray) at both cortical and dorsal stress fibers in human osteosarcoma (U2OS) cells that additionally expressed Lifeact-mKate1.31 (red) and miRFP670-paxillin (magenta). PA-GFP-actin was always activated adjacent to a paxillin positive adhesion. The images of entire cells after photoactivation are shown on the left. Kymographs of PA-GFP-actin dynamics from the selected stress fibers indicated in the whole cell images illustrate that, unlike dorsal stress fibers (4), cortical stress fibers do not elongate through actin polymerization from the adhesion (1,2), and can occasionally even exhibit slow actin flow towards the adhesion (3). All kymographs were oriented in a way that the adhesion is facing to the top. Black arrows on the kymographs indicate the activation time-point, preceded by three time-lapse frames, and the dashed lines movement of activated stress fiber segments. Imaging interval was 10 s, and scale bars are 10 µm in whole cell images. (B) Quantification of the actin polymerization rates from focal adhesions. Actin polymerization rates (µm/min) are shown as half-violin plot, displaying binned individual data points and mean with ±1 SD. p = 5.22 × 10⁻¹⁵ (two-sample t-test). Polymerization rates for individual data points/kymographs were obtained through plot profiles, subtracting the distance of the peak intensities at time points 10 s and 300 s after photoactivation. N (cortical SF) = 13 cells; 33 foci and N (dorsal SF) = 6 cells; seven foci. (C) Cortical stress fiber assembly in a migrating U2OS cell expressing LifeAct-TagGFP2 (F-actin, magenta) and vinculin-mApple (focal adhesions, green) imaged by TIRF microscopy. Blue arrows exemplify the de novo generation of a cortical stress fiber, and the orange arrow highlights a vinculin positive adhesion that was used by several cortical stress fibers over the time. Imaging interval 30 s. See also Video 3. Scale bars 10 μm and 5 μm for the whole cell images and magnified images, respectively.
-
Figure 2—figure supplement 1—source data 1
PA-actin intensity profiles from photoactivated foci.
- https://cdn.elifesciences.org/articles/60710/elife-60710-fig2-figsupp1-data1-v4.xlsx
Figure 3 with 1 supplement
Non-muscle myosin II (NMII)A pulse-mediated cortical stress fibers assembly occurs predominantly underneath the nucleus in migrating cells.
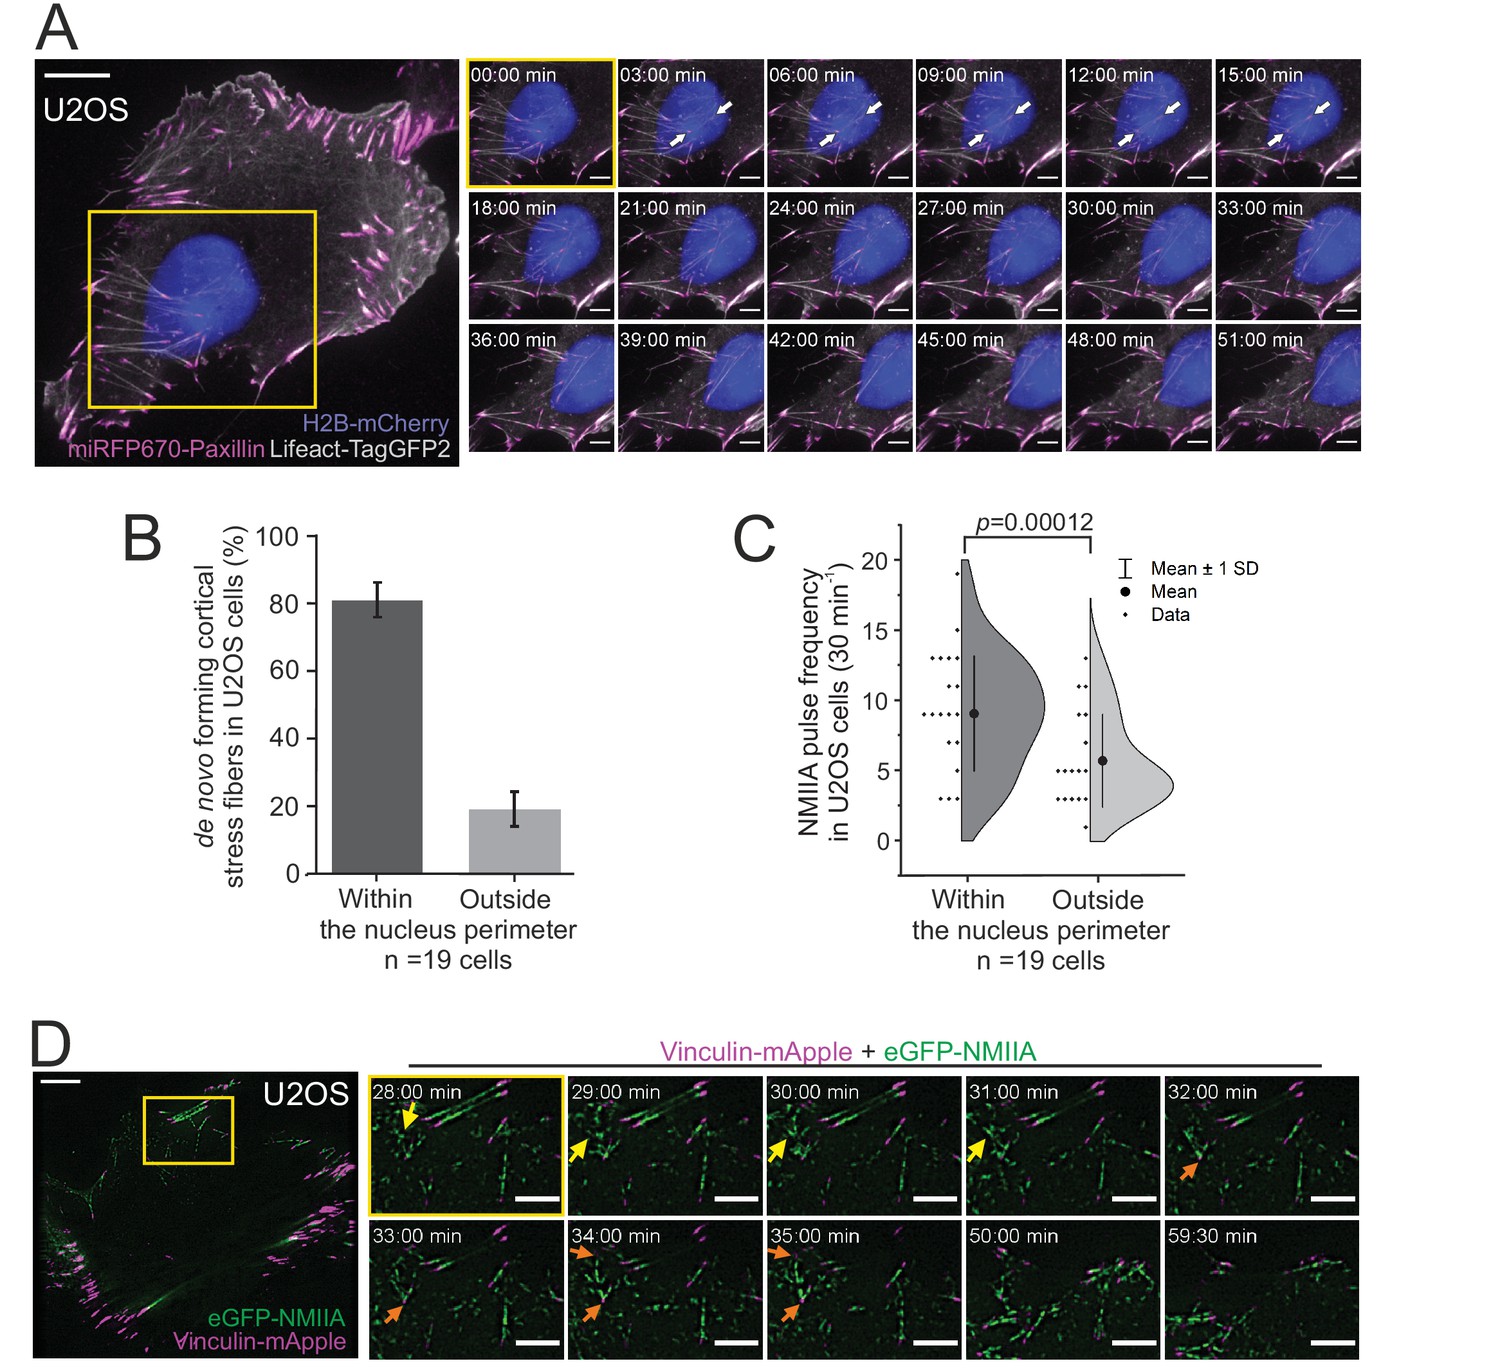
(A) TIRF time-lapse imaging of a migrating human osteosarcoma (U2OS) cell. The selected time-lapse frames (from the yellow boxed area) illustrate the assembly of a cortical stress fiber (exemplified by white arrows) below the moving nucleus. Histone H2B-mCherry was applied to detect the nucleus (blue, EPI-TIRF) and miRFP670-paxillin (magenta) and LifeAct-TagGFP2 (gray) to visualize focal adhesions and F-actin, respectively. See also Video 4. (B) Quantification of the position of de novo formation of cortical stress fibers from TIRF-time-lapse videos of U2OS cells expressing LifeAct-TagGFP2, Histone-H2B-mCherry, and miRFP670-paxillin. Data are presented as %-distribution of cortical stress fibers assembled under the nucleus versus outside the nucleus perimeter ± SEM. n = 101 cortical stress fibers analyzed from 19 cells. (C) Quantification of NMIIA pulse location at the ventral cortex of U2OS cells expressing Histone H2B-eGFP and mApple-NMIIA. Data are presented as pulse frequency (number of individual pulses) under the nucleus vs. outside the nucleus perimeter (rest of the ventral cortex). Each data point is normalized to the area of nucleus. Half-violin plot displays binned individual data points and mean with ±1 standard deviation (SD), n = 19 cells. Significance (p = 0.00012) tested with a paired t-test. (D) TIRF time-lapse imaging of a migrating U2OS cell expressing eGFP-NMIIA (green) and vinculin-mApple (magenta). Selected time-lapse frames from the magnified area (yellow box) demonstrate that NMIIA pulses (yellow arrows) are associated with the assembly of a cortical stress fiber and enforcement of vinculin positive focal adhesions (orange arrows). See also Figure 4C and Video 7. For (A) and (D), scale bars 10 µm and 5 µm for whole cell images and time-lapse zoom-ins, respectively. Imaging interval 30 s.
-
Figure 3—source data 1
Analysis of de novo forming cortical SFs.
- https://cdn.elifesciences.org/articles/60710/elife-60710-fig3-data1-v4.xlsx
-
Figure 3—source data 2
Analysis of NMIIA pulse dynamics.
- https://cdn.elifesciences.org/articles/60710/elife-60710-fig3-data2-v4.xlsx
Figure 3—figure supplement 1

Myosin pulses are associated with cortical stress fibers assembly underneath the nucleus, and morphologically similar adhesion-attached actin filament bundles also exist in cells migrating in 3D matrix.
(A) TIRF time-lapse imaging of a migrating human osteosarcoma (U2OS) cell expressing histone H2B-eGFP (gray), mApple-NMIIA (green), and miRFP670-paxillin (focal adhesions, magenta). Selected time-lapse frames from the magnified area (yellow box) show examples of myosin pulses that assemble into cortical stress fibers underneath the nucleus, with concurrent maturation of paxillin-positive focal adhesions. Orange arrow illustrates how a single focal adhesion is used by two different cortical stress fibers assembling over the time (original imaging interval 30 s). Scale bars 10 µm and 5 µm for the whole cell image and magnified time-lapse frames, respectively. See also Video 5. (B) Stress fibers in three eGFP-paxillin (green) expressing U2OS cells migrating in 3D fibrin matrix. Magnifications of selected regions (1. to 3.) from a 3D-reconstruction of representative confocal stack display examples of stress fibers (orange arrows) that based on their small size (length <10 µm), presence of small adhesions at each end, and vicinity to nucleus resemble the cortical stress fibers of cells migrating on 2D matrix. Also thicker and longer ‘ventral- stress fiber’ – like actomyosin bundles (blue arrows) – were frequently observed. However, it is important to note that as such, there is no ventral nor dorsal side in cells migrating in 3D matrix. DAPI (blue) and phalloidin (magenta) were applied to visualize the F-actin and nucleus, respectively. Scale bars 10 µm. See also Video 6.
Figure 4 with 2 supplements
Cortical non-muscle myosin II (NMII) pulses orchestrate F-actin bundling for the assembly of cortical stress fibers.
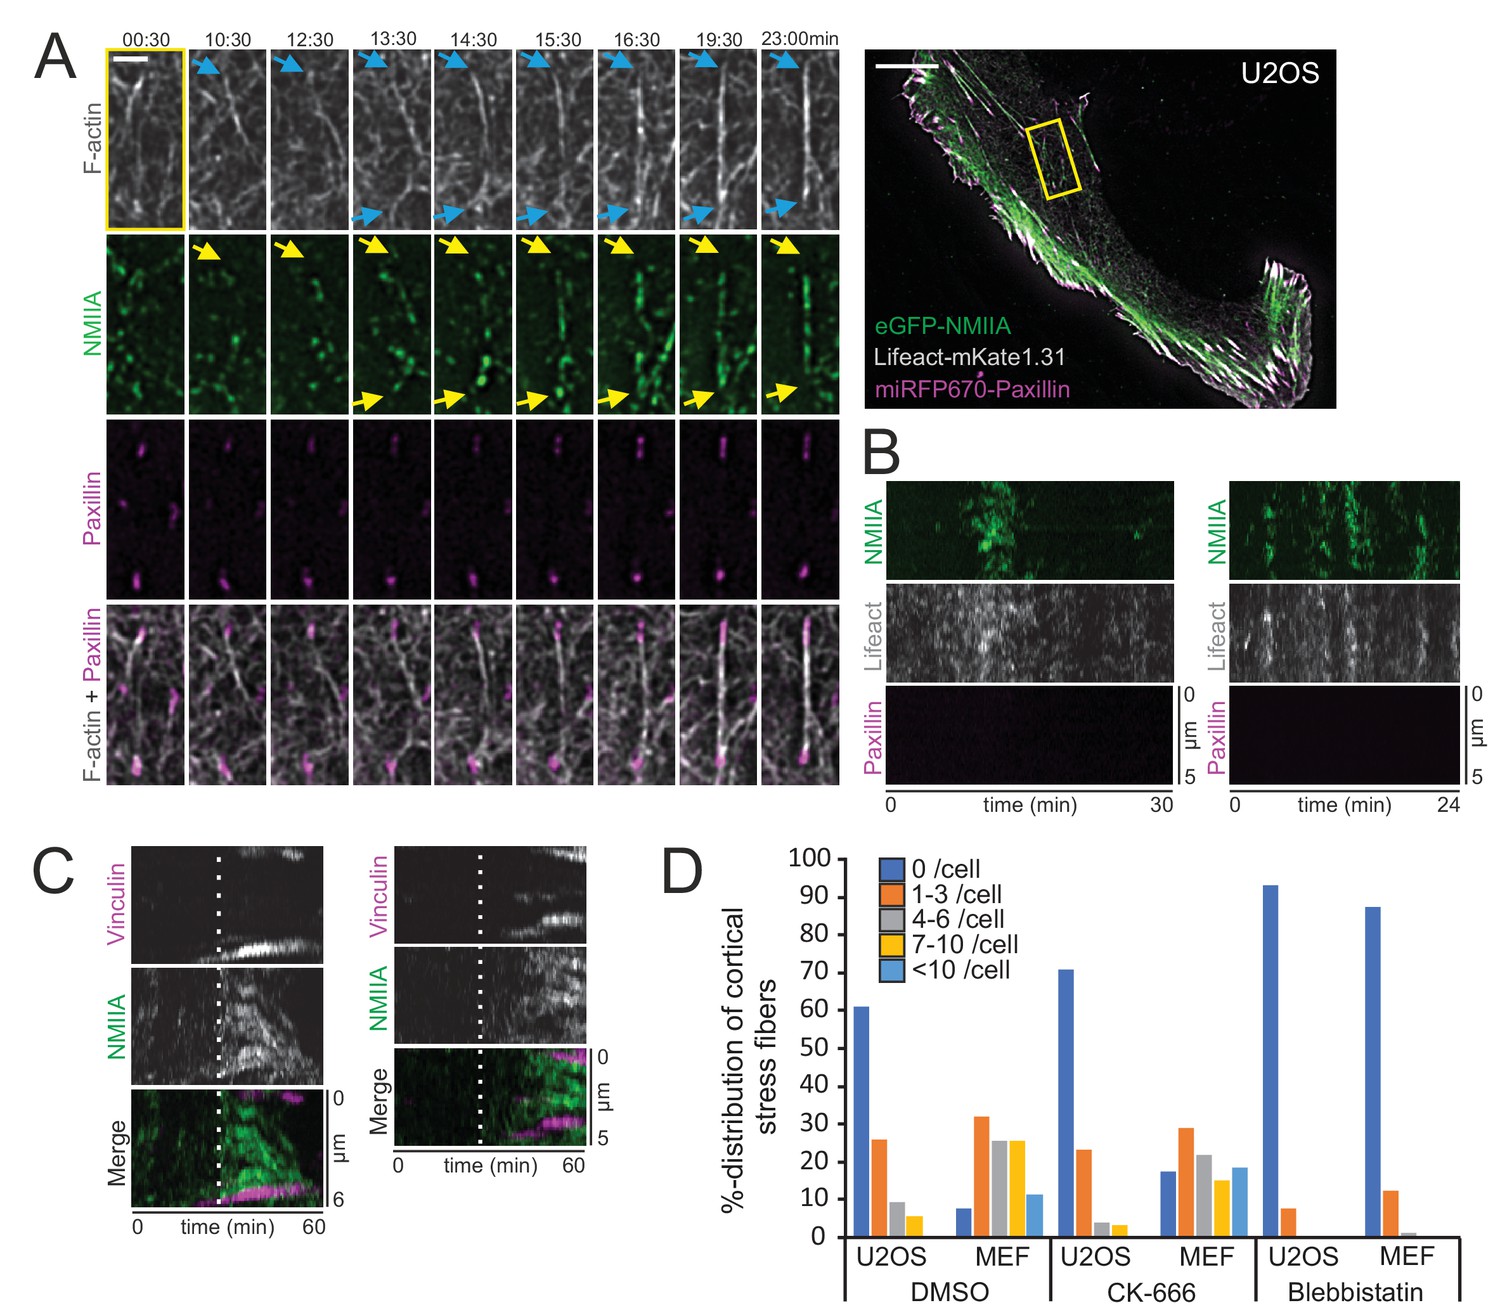
(A) Formation of a cortical stress fiber from the ventral cortex of a migrating human osteosarcoma (U2OS) cell as studied by time-lapse TIRF microscopy. The entire cell is shown on the right, and the selected time-lapse frames (from the region indicated by yellow box) display how F-actin (gray, LifeAct-mKate1.31; blue arrows) and NMIIA (green, eGFP-NMIIA; yellow arrows) organize into an actomyosin bundle, which promotes the enlargement of pre-existing paxillin-positive focal adhesions (FA) (magenta, miRFP670-paxillin). Note that prior to bundle assembly, the pre-existing focal adhesions were connected to different actomyosin bundles. Original imaging interval 30 s. See also Video 8. Scale bars 10 µm and 2 µm for whole cell image and magnified time-lapse frames, respectively. (B) Two representative kymographs of transient NMIIA pulses occurring at the ventral cortex of U2OS cells expressing eGFP-NMIIA, LifeAct-mKate 1.31 and miRFP670-paxillin. The ‘non-productive’ NMIIA pulses are accompanied by transient accumulation of F-actin, but without emergence of paxillin-positive nascent adhesions and stabilization of the actomyosin bundle. Kymographs were obtained from TIRF time-lapse videos with imaging interval of 10 s. (C) Two representative kymographs (obtained from Video 7) illustrating how emergence of a NMIIA pulse (green) leads to enforcement of adhesions (magenta) and maturation of a cortical stress fiber. White dashed lines in the kymographs indicate the onsets of NMIIA pulses. See also Figure 3D. (D) Percentual distribution of cortical stress fiber numbers in U2OS cells and mouse embryonic fibroblasts (MEFs) after different pharmacological perturbations. Cortical stress fiber number and length measurements were obtained through blind analysis of the tile-scan TIRF data. n = DMSO 157 and 247, CK-666, 166, and 182, Blebbistatin 195 and 198 cells for U2OS cells and MEFs, respectively. See also respective Figure 4—figure supplement 2A and C.
-
Figure 4—source data 1
Cortical SF number quantification after pharmacological inhibitions.
- https://cdn.elifesciences.org/articles/60710/elife-60710-fig4-data1-v4.xlsx
Figure 4—figure supplement 1
Different ways to assemble cortical stress fibers from the ventral actomyosin cortex.
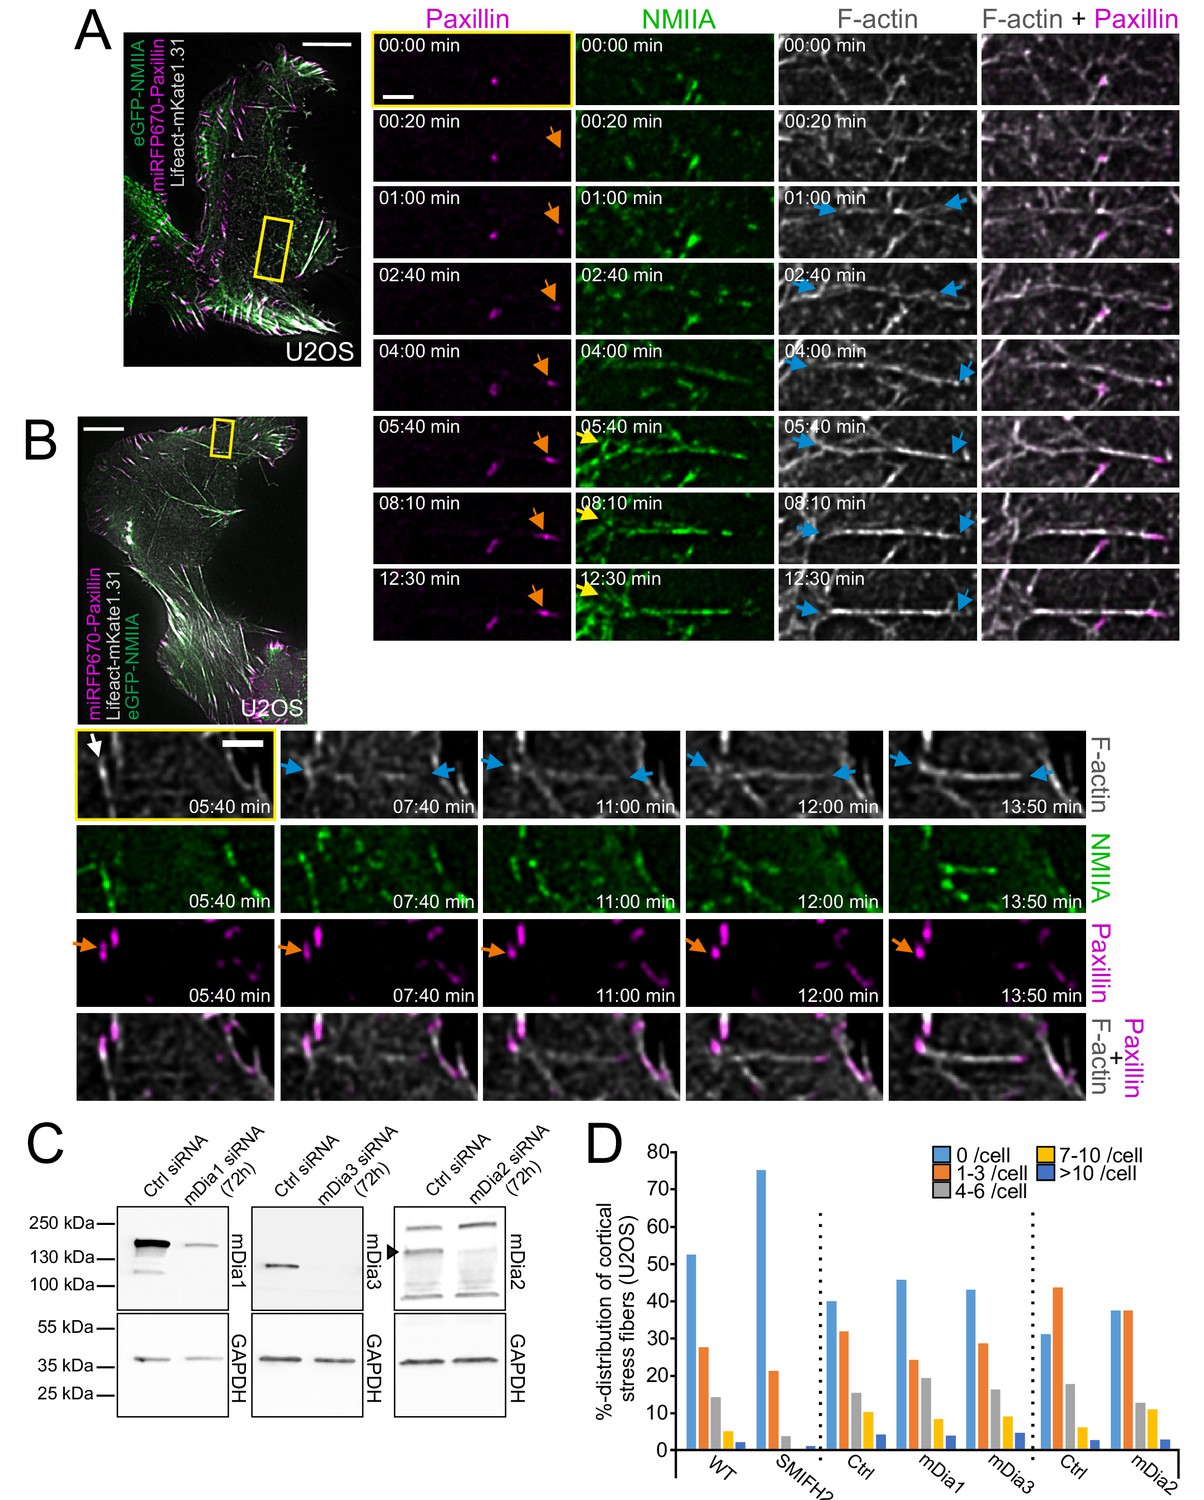
(A) Example of a formation of cortical stress fiber in a migrating human osteosarcoma (U2OS) cell, where one end of the stress fiber connects to a focal adhesion and the other one to a cortical actomyosin patch. Blue arrows in the selected, magnified time-lapse frames (from the yellow-boxed area) illustrate F-actin bundling, orange arrows highlight the maturing paxillin-positive focal adhesion (magenta, miRFP670-paxillin), and yellow arrows highlight the non-muscle myosin II (NMII) patch where the stress fiber is connected from its other end. NMIIA (green) and F-actin (gray) were visualized by expressing eGFP-NMIIA and LifeAct-mKate1.31, respectively. See also Video 9. (B) Example of a focal adhesion exchanging from one cortical stress fiber to another one in a migrating U2OS cell expressing LifeAct-TagGFP2 (F-actin, gray), eGFP-NM-IIA (green), and miRFP670-paxillin (magenta). Selected time-lapse frames (magnified from the yellow boxed area) show that after disassembly of the preceding cortical stress fiber (white arrow), the newly forming cortical stress fiber (illustrated with blue arrows) engages itself to the pre-existing paxillin-positive focal adhesion (orange arrow). See also Video 10. For both (A and B), scale bars 10 µm and 2 µm for whole cell images and magnified time-lapse frames, respectively. Original imaging interval 10 s. (C) Depletion of mDia1, mDia3 and mDia2 by siRNAs from U2OS cells as detected by western blot. GAPDH was probed to assess equal sample loading. Black arrowhead points to the mDia2 band with correct MW. D) Effects of formin inhibitor SMIFH2 (left) and mDia1, mDia3 and mDia2 depletions (right) on cortical stress fibers as examined by blind analysis of cortical stress fiber numbers (percentual distribution of indicated categories) from tile-scan TIRF datasets. For SMIFH2 experiments, the ‘WT’ represents control cells treated only with DMSO, whereas for siRNA experiments the ‘Ctrl’ cells were transfected with negative control siRNA. Please note that because SMIFH2 was recently shown to inhibit also NMII activity (Nishimura et al., 2020), it was used at low (12.5 µM) concentration for 1 hr prior fixation to minimize unspecific effects. N = WT 209, SMIFH2 229, Ctrl siRNA 232 (for mDia1 and mDia3 depletion), mDia1 163, mDia3 138, mDia2 113, and Ctrl siRNA (for mDia2 depletion) 120 U2OS cells analyzed.
-
Figure 4—figure supplement 1—source data 1
Cortical SF number quantification after formin inhibitions.
- https://cdn.elifesciences.org/articles/60710/elife-60710-fig4-figsupp1-data1-v4.xlsx
Figure 4—figure supplement 2
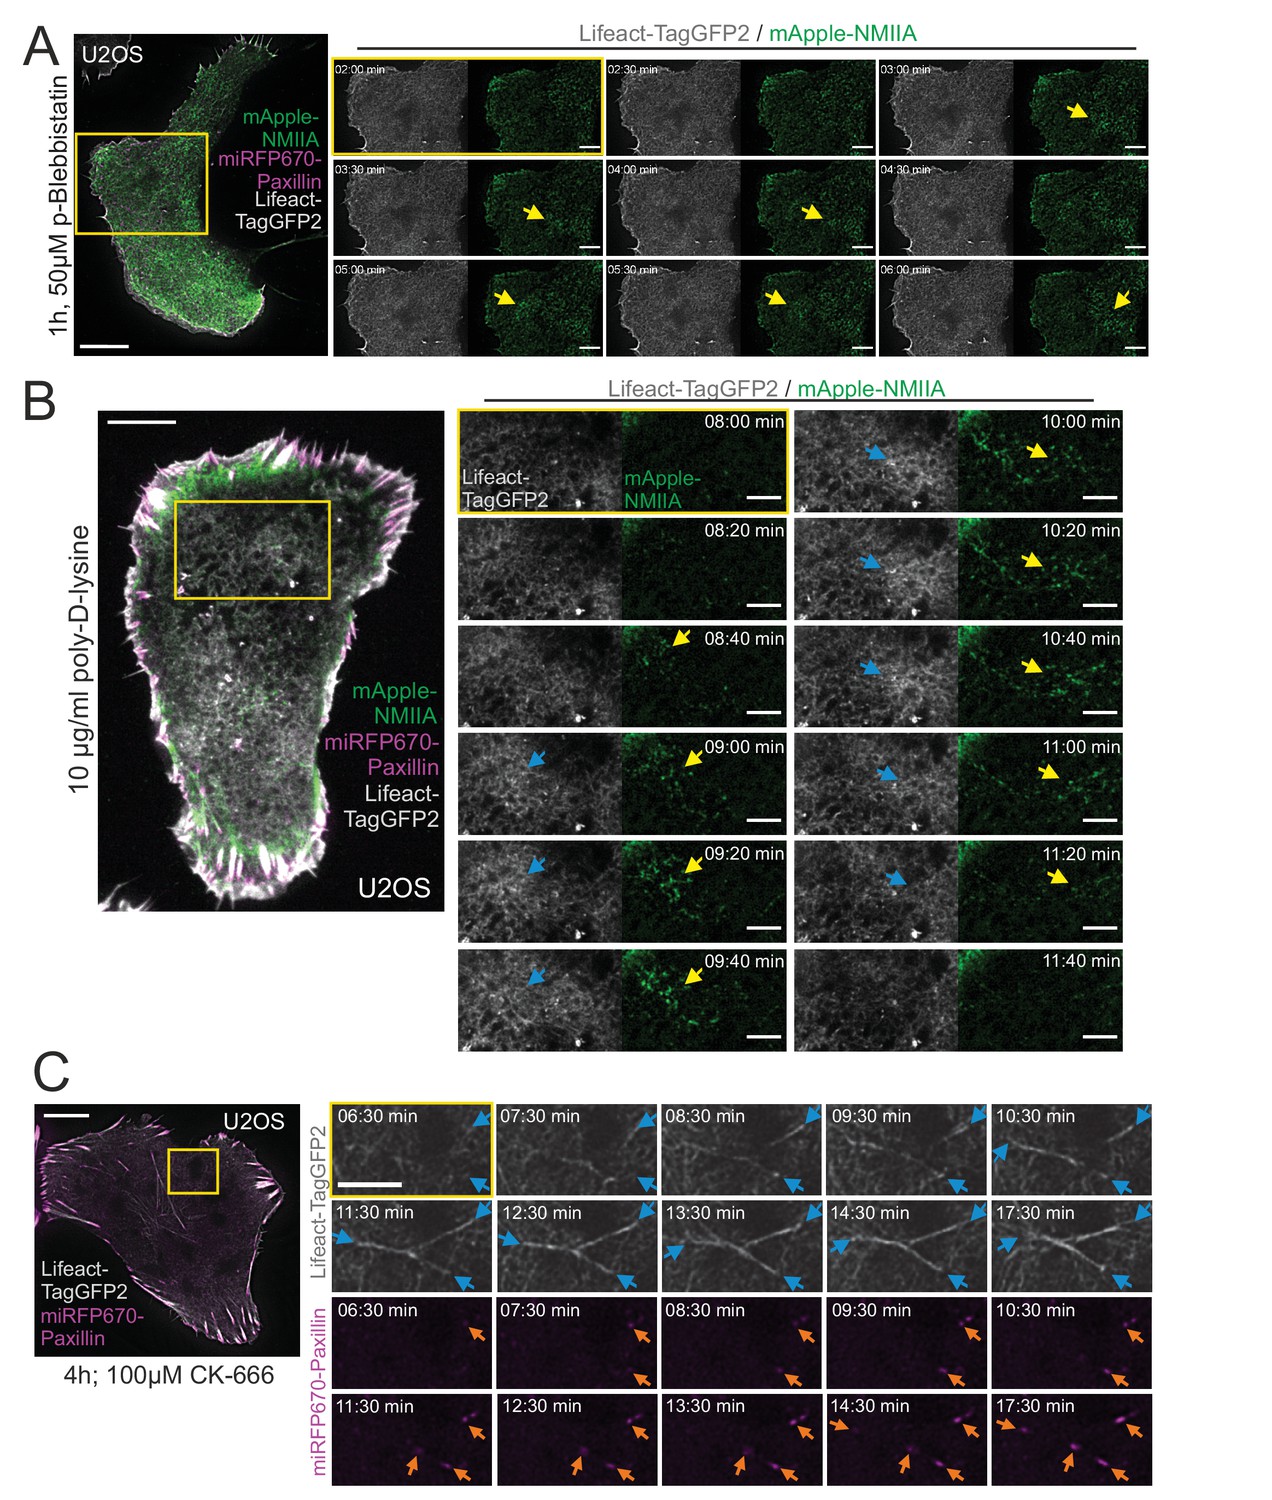
Cortical stress fiber assembly is dependent on functional non-muscle myosin II (NMII) and integrin-based adhesions.
(A) TIRF time-lapse images of a human osteosarcoma (U2OS) cell expressing mApple-NMIIA (green), miRFP670-paxillin (magenta), and LifeAct-TagGFP2 (gray), after 1 hr incubation with 50 µM para-amino Blebbistatin. Blebbistatin does not cease myosin pulses highlighted with yellow arrows (see also Baird et al., 2017), but abolishes cortical stress fiber formation. Magnified time-lapse frames (from yellow boxed area) and display NMIIA pulses (yellow arrows) that are unable to bundle F-actin. See also Video 11B. (B) TIRF time-lapse imaging of U2OS cells plated onto poly-D-lysine coated dishes 24 hr prior imaging. Only cells that displayed partial integrin-mediated adhesion (based on miRFP670-paxillin, magenta) from their edges were imaged. Exemplary time-lapse images from the magnified region (yellow box) illustrate NMIIA pulses (mApple-NMIIA, green) that are unable to stabilize F-actin bundles. Note the blue arrows pointing out the transient accumulation of cortical actin (LifeAct-TagGFP2, gray), coinciding with the NMIIA pulses (yellow arrows). See also Video 12. (C) Cortical stress fiber formation in a U2OS cell transfected with miRFP670-paxillin and LifeAct-TagGFP2, and subjected to CK-666 for 4 hr prior onset of TIRF-imaging. Selected time-lapse frames from the magnified regions show an example of cortical stress fiber formation (blue arrows) and reinforcement of focal adhesions (orange arrows). See also Video 13. Scale bars 10 µm and 5 µm for the whole cell images and magnifications, respectively. Time-lapse imaging interval 30 s for (A and C) and 20 s for (B), respectively.
Figure 5
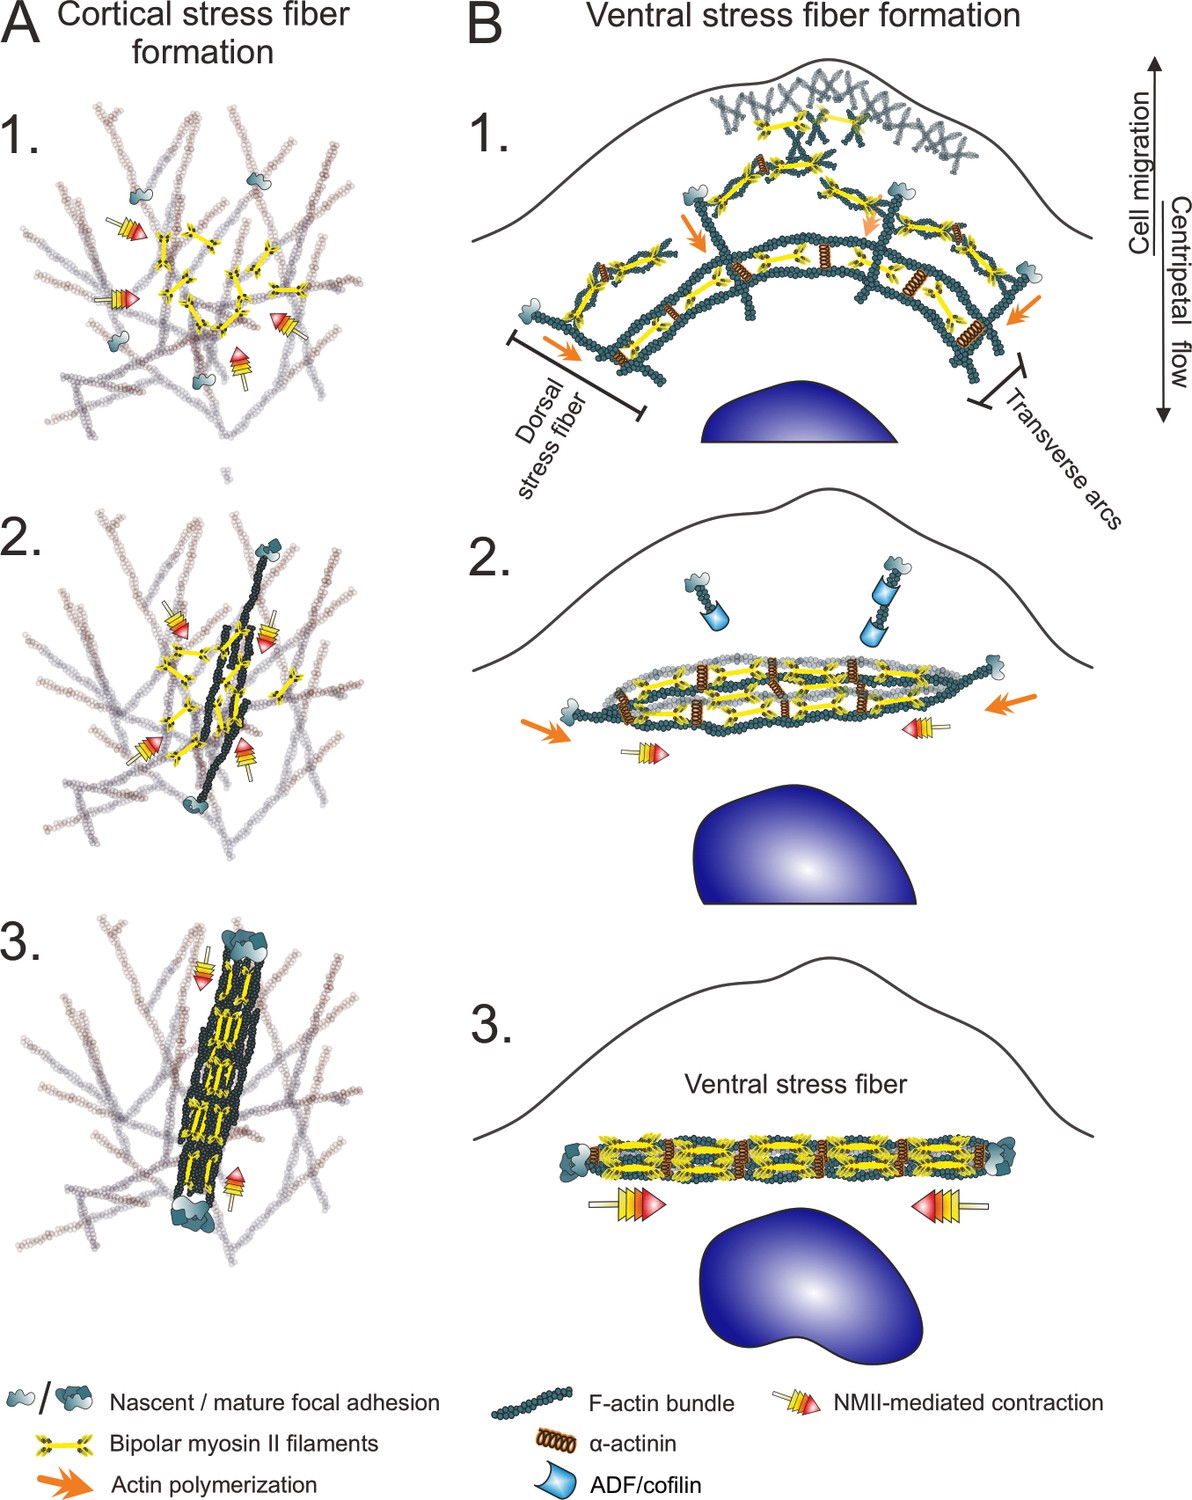
Two different mechanisms for generation of contractile stress fibers.
(A) Schematic representation of the de novo assembly of a cortical stress fiber from the ventral actomyosin cortex. 1. Non-muscle myosin II (NMII) pulses occur frequently at the ventral actin cortex. 2. These pulses can cause transient accumulation and bundling of the cortical actin filaments via myosin-mediated actin filament crosslinking and reorganization. This triggers the enlargement of nascent focal adhesions at the ends of the bundle. 3. The transient actomyosin bundle can mature to a cortical SF through recruitment of more actin filaments and NMII. (B) Ventral stress fibers assemble from pre-existing stress fiber precursors at the lamellum of a migrating cell. 1. Dorsal stress fibers elongate through actin filament polymerization at focal adhesions, whereas transverse arcs are generated from NMII filaments and actin filaments at the lamellipodium–lamella interface. Assembly of transverse arcs does not involve prominent myosin pulses, but they are formed during retraction phase of lamellipodium (Burnette et al., 2011). The network of dorsal stress fibers and transverse arcs flows toward the cell center, and the arcs fuse with each other to form thicker actomyosin bundles. 2. The dorsal stress fibers in parallel to the transverse arcs are under strongest tension and begin to align with the fusing transverse arc network. On the other hand, the dorsal stress fibers arranged perpendicularly to the fusing transverse arcs sense lower tension and are disassembled by ADF/cofilins. 3. This leads to the formation of a thick stress fiber that is attached to focal adhesions at both ends (Tojkander et al., 2015; Tojkander et al., 2018).
Author response image 1
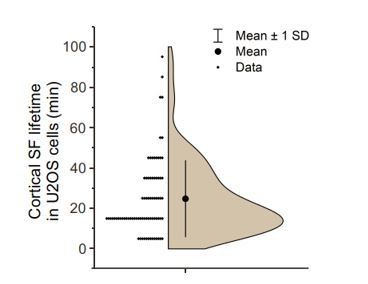
Analysis of cortical stress fiber half-life in U2OS cells migrating on a fibronectin and expressing LifeAct-TagGFP2 and mApple-Paxillin.
120 min TIRFM time-lapse videos with 1-minute imaging interval. N = 15 cells; 77 cortical stress fibers. Please note that all stress fibers that were visible already in the beginning of videos and/or were present in the end of videos were excluded from the analysis. We only analysed cortical stress fibers of max 10 µm length arising at the cell center, approximately within the nucleus perimeter. It is also important to note that in many cases cortical stress fibers fused with each other, making it difficult to accurately measure their half-lifes.
Videos
Video 1
Cortical stress fiber formation at the ventral actin cortex of a migrating human osteosarcoma (U2OS) cell.
Zoom in of a U2OS cell expressing LifeAct-TagGFP2 (gray) and mApple-vinculin (magenta), migrating on a fibronectin (10 µg/ml)-coated high-precision imaging dish. Related to Figure 2A. Time-lapse ring-TIRFM video was recorded with Deltavision OMX SR with 30 s imaging interval. Playback rate 10 frames/s. Scale bar 2 µm.
Video 2
Cortical stress fiber formation at the ventral actin cortex of a migrating mouse embryonic fibroblast (MEF) cell.
Zoom in of a MEF cell expressing LifeAct-TagGFP2 (gray) and mApple-vinculin (magenta), migrating on a fibronectin (10 µg/ml)-coated high-precision imaging dish. Related to Figure 2B. Time-lapse ring-TIRFM video was recorded with Deltavision OMX SR with 30 s imaging interval. Playback rate 10 frames/s. Scale bar 2 µm.
Video 3
Cortical stress fiber assembly at the trailing edge of a migrating human osteosarcoma (U2OS) cell.
Zoom in of a U2OS cell expressing LifeAct-TagGFP2 (magenta) and mApple-vinculin (green), migrating on a fibronectin (10 µg/ml)-coated high-precision imaging dish. Related to Figure 2—figure supplement 1C. Time-lapse ring-TIRFM video was recorded with Deltavision OMX SR with 30 s imaging interval. Playback rate 20 frames/s; Scale bar 5 µm.
Video 4
Cortical stress fiber assembly under the nucleus of migrating human osteosarcoma (U2OS) cell.
Zoom in of a U2OS cell expressing LifeAct-TagGFP2 (gray), histone-H2B-mCherry (blue), and miRFP670-paxillin (magenta), migrating on a fibronectin (10 µg/ml)-coated high-precision imaging dish. Related to Figure 3A. Time-lapse ring-TIRFM video was recorded with Deltavision OMX SR with 30 s imaging interval. Playback rate 20 frames/s. Scale bar 5 µm.
Video 5
Non-muscle myosin II (NMII)A pulses assemble into cortical stress fibers under the nucleus of migrating human osteosarcoma (U2OS) cell.
Zoom in of a U2OS cell expressing histone H2B-eGFP (gray), mApple-NMIIA (green), and miRFP670-paxillin (magenta), migrating on a fibronectin (10 µg/ml)-coated high-precision imaging dish. Related to Figure 3—figure supplement 1A. Time-lapse ring-TIRFM video was recorded with Deltavision OMX SR with 20 s imaging interval. Playback rate 20 frames/s. Scale bar 5 µm.
Video 6
3D-reconstruction of human osteosarcoma (U2OS) cells migrating in a 3D fibrin matrix.
U2OS cells expressing eGFP-paxillin (green), stained further with phalloidin for F-actin (magenta) and DAPI (blue) for visualization of the nuclei. Related to Figure 3—figure supplement 1B. Confocal stacks were acquired and deconvolved with Andor Dragonfly 505; 3D-reconstruction performed with Imaris 9.2.1. Scale bar size (µm) is proportional to the degree of zoom in the video and is indicated at the lower left corner.
Video 7
Non-muscle myosin II (NMII)A pulses at the trailing edge of a migrating human osteosarcoma (U2OS) cells.
Zoom in of a U2OS cell expressing eGFP-NMIIA (green) and mApple-vinculin (magenta) migrating on a fibronectin (10 µg/ml)-coated high-precision imaging dish. Related to Figure 3D and Figure 4C. Time-lapse ring-TIRFM video was recorded with Deltavision OMX SR with 30 s imaging interval. Playback rate 20 frames/s. Scale bar 5 µm.
Video 8
Non-muscle myosin II (NMII)A pulses coordinate the cortical stress fiber assembly in a migrating human osteosarcoma (U2OS) cell.
Zoom in of a U2OS cell expressing LifeAct-TagGFP2 (gray), mApple-NMIIA (green), and miRFP670-paxillin (magenta), migrating on a fibronectin (10 µg/ml)-coated high-precision imaging dish. Related to Figure 4A. Time-lapse ring-TIRFM video was recorded with Deltavision OMX SR with 30 s imaging interval. Playback rate 10 frames/s. Scale bar 2 µm.
Video 9
NMIIA pulse-coordinated cortical stress fiber assembly in a migrating U2OS cell, where one end of the fiber connects to actomyosin mesh.
Zoom in of a U2OS cell expressing LifeAct-TagGFP2 (gray), mApple-NMIIA (green), and miRFP670-paxillin (magenta), migrating on a fibronectin (10 μg/ml)-coated high-precision imaging dish. Related to Figure 4—figure supplement 1A. Time-lapse ring-TIRFM video was recorded with Deltavision OMX SR with 10s imaging interval. Playback rate 20 frames/s. Scale bar 2 μm.
Video 10
NMIIA pulse-coordinated cortical stress fiber assembly in a migrating U2OS cell, where one end of the fiber connects to a pre-existing adhesion.
Zoom in of a U2OS cell expressing LifeAct-TagGFP2 (gray), mApple-NMIIA (green), and miRFP670-paxillin, migrating on a fibronectin (10 μg/ml)-coated high-precision imaging dish. Related to Figure 4—figure supplement 1B. Time-lapse ring-TIRFM video was recorded with Deltavision OMX SR with 10s imaging interval. Playback rate 20 frames/s. Scale bar 2 μm.
Video 11
Inhibiting non-muscle myosin II (NMII) activity abolishes cortical stress fiber assembly.
Zoom in of a human osteosarcoma (U2OS) cell expressing LifeAct-TagGFP2 (gray), mApple-NMIIA (green), and miRFP670-paxillin (magenta, not shown in the zoom in) migrating on a fibronectin (10 µg/ml)-coated high precision imaging dish after 1 hr treatment with 50 µM p-amino-Blebbistatin. Related to Figure 4—figure supplement 2A. Time-lapse ring-TIRFM video was recorded with Deltavision OMX SR with 30 s imaging interval. Playback rate 20 frames/s. Scale bar 5 µm.
Video 12
Inhibiting integrin-based ECM adhesion obstructs cortical stress fiber formation.
Zoom in of a human osteosarcoma (U2OS) cell expressing LifeAct-TagGFP2 (gray), mApple-NMIIA (green), and miRFP670-paxillin (magenta, not shown in the zoom in) on a poly-D-lysine (10 µg/ml)-coated high-precision imaging dish. Imaging started 24 hr post plating. Related to Figure 4—figure supplement 2B. Time-lapse ring-TIRFM video was recorded with Deltavision OMX SR with 20 s imaging interval. Playback rate 20 frames/s. Scale bar 5 µm.
Video 13
CK-666 mediated Arp2/3 inhibition does not prevent cortical stress fiber assembly.
Zoom in of a human osteosarcoma (U2OS) cell expressing LifeAct-TagGFP2 (gray) and miRFP670-paxillin (magenta) migrating on a fibronectin (10 µg/ml)-coated high-precision imaging dish after 4 hr treatment with 100 µM CK-666. Related to Figure 4—figure supplement 2C. Time-lapse ring-TIRFM video was recorded with Deltavision OMX SR with 30 s imaging interval. Playback rate 20 frames/s. Scale bar 5 µm.
Tables
Key resources table
| Reagent type (species) or resource | Designation | Source or reference | Identifiers | Additional information |
|---|---|---|---|---|
| Cell line (Homo sapiens) | Human osteosarcoma cells (U2OS) | ATCC | Cat# HTB-96, RRID:CVCL_0042 | Authenticated through STR profiling |
| Cell line (Mus musculus) | Mouse embryonic fibroblasts (MEFs) | Jiu et al., 2015 | A gift from John Eriksson (University of Turku, Finland) | |
| Recombinant DNA reagent | eGFP-NMIIA (plasmid) | Addgene, Jacobelli et al., 2009 | RRID:Addgene_38297 | A gift from Mathew Krummel (University of California, San Francisco) |
| Recombinant DNA reagent | PA-GFP-Actin (plasmid) | Addgene | RRID:Addgene_57121 | A gift from Michael Davidson |
| Recombinant DNA reagent | LifeAct-mKate1.31 (plasmid) | Addgene, Shcherbo et al., 2009 | RRID:Addgene_54668 | A gift from Michael Davidson |
| Recombinant DNA reagent | mApple-NMIIA (plasmid) | Addgene, Burnette et al., 2014 | RRID:Addgene_54929 | A gift from Michael Davidson |
| Recombinant DNA reagent | Vinculin-mApple (plasmid) | Addgene | RRID:Addgene_54962 | A gift from Michael Davidson |
| Recombinant DNA reagent | α-actinin1-TagRFP-T (plasmid) | Addgene | RRID:Addgene_58033 | A gift from Michael Davidson |
| Recombinant DNA reagent | LifeAct-TagGFP2 (plasmid) | Stefani et al., 2017 | A gift from Emmanuel Lemichez (Pasteur Institute, France) | |
| Recombinant DNA reagent | Histone H2B-eGFP (plasmid) | This paper | A gift from Maria Vartiainen (University of Helsinki, Finland) | |
| Recombinant DNA reagent | Histone H2B-mCherry (plasmid) | This paper | A gift from Maria Vartiainen (University of Helsinki, Finland) | |
| Recombinant DNA reagent | eGFP-Paxillin (plasmid) | This paper | Gallus gallus paxillin ORF with T132S and M133L unattended mutations (pPL1277) | |
| Recombinant DNA reagent | miRFP670-Paxillin (plasmid) | This paper | eGFP in eGFP-Paxillin replaced with miRFP670-N1 (pPL1514) | |
| Recombinant DNA reagent | miRFP670-N1 (plasmid) | Addgene, Shcherbakova et al., 2016 | RRID:Addgene_79987 | A gift from Vladislav Verkusha (Albet Einstein College of Medicine, NY) |
| Transfected construct (human) | SMARTpoolON-TARGETplus siRNA to mDia1 | Dharmacon | Cat# L-010347-00-0005 | Transfected using GeneSilencer |
| Transfected construct (human) | SMARTpoolON-TARGETplus siRNA to mDia2 | Dharmacon | Cat# L-018997-00-0005 | Transfected using GeneSilencer |
| Transfected construct (human) | SMARTpoolON-TARGETplus siRNA to mDia3 | Dharmacon | Cat# L-012029-00-0005 | Transfected using GeneSilencer |
| Transfected construct (human) | negative (non-targeting) control siRNA | Qiagen | Cat# 1027281 | Transfected using GeneSilencer |
| Antibody | anti-vinculin (mouse monoclonal) | Sigma Aldrich | Cat# V9131, RRID:AB_477629 | 1:400 (IF) |
| Antibody | anti-NMIIA (C-termini) (rabbit polyclonal) | Biolegend | Cat# 909801, RRID:AB_2565100 | 1:800 (IF) |
| Antibody | anti-fibronectin (rabbit polyclonal) | Sigma Aldrich | Cat# F3648, RRID:AB_476976 | 1:400 (IF) a gift from Johanna Ivaska (University of Turku, Finland) |
| Antibody | anti-Y118-paxillin (rabbit monoclonal) | Cell Signaling Technology | Cat# 2541, RRID:AB_2174466 | 1:50 (IF) a gift from Johanna Ivaska (University of Turku, Finland) |
| Antibody | anti-human mDia1 (rabbit monoclonal) | Abcam | Cat# ab129167, RRID:AB_11143749 | 1:1000 (WB) |
| Antibody | anti-human mDia2 (rabbit polyclonal) | Proteintech | Cat# 14342-1-AP, RRID:AB_2092930 | 1: 500 (WB) |
| Antibody | anti- human mDia3 (rabbit polyclonal) | Sigma Aldrich | Cat# HPA005647, RRID:AB_1078657 | 1:10,00 (WB) |
| Antibody | anti-GAPDH (rabbit polyclonal) | Sigma Aldrich | Cat# G9545, RRID:AB_796208 | 1:10,000 (WB) |
| Antibody | Anti-mouse Alexa Fluor 488 (goat polyclonal) | Thermo Fisher Scientific | Cat# A-11001, RRID:AB_2534069 | 1:200 (IF) |
| Antibody | Anti-mouse Alexa Fluor 568 (goat polyclonal) | Thermo Fisher Scientific | Cat# A-11031, RRID:AB_144696 | 1:200 (IF) |
| Antibody | Anti-rabbit Alexa Fluor Plus 647 (goat polyclonal) | Thermo Fisher Scientific | Cat# A32733, RRID:AB_2633282 | 1:400 (IF) |
| Antibody | HRP-conjugated anti–rabbit (goat polyclonal) | Thermo Fisher Scientific | Cat# 32460, RRID:AB_1185567 | 1:1000 (WB) |
| Commercial assay or kit | Lipofectamine 2000 | Thermo Fisher Scientific | Cat# 11668019 | Plasmid transfection (3.5:1 DNA: Lipofectamine ratio) |
| Commercial assay or kit | GeneSilencer | Genlantis | Cat# T500750 | siRNA transfection |
| Commercial assay or kit | jetPRIME | Polyplus transfection | Cat# 114–01 | Plasmid transfection (TFM) |
| Commercial assay or kit | NEBuilder | New England Biolabs | Cat# E5520S | |
| Chemical compound, drug | Para-amino Blebbistatin | Optopharma | Cat# DR-Am-89 | 50 µM working concentration |
| Chemical compound, drug | SMIFH2 | Sigma Aldrich | Cat# S4826 | 12.5 µM working concentration |
| Chemical compound, drug | CK-666 | Sigma Aldrich | Cat# SML0006 | 100 µM working concentration |
| Chemical compound, drug | DMSO | Sigma Aldrich | Cat# D2650 | Diluent/negative control |
| Software, algorithm | Fiji | Schindelin et al., 2012 | RRID:SCR_002285 | |
| Software, algorithm | OriginPro | OriginLab Corp. | RRID:SCR_014212 | |
| Software, algorithm | NMII pulse quantification (macro) | This paper. Modified from Kim and Davidson, 2011 | Available at: https://github.com/UH-LMU/lmu-users/tree/master/jaakko/NMIIA_pulses | |
| Other | Fibrinogen (from human plasma) | Sigma Aldrich | Cat# 341578 | 2.25 mg/ml working concentration |
| Other | Thrombin (from human plasma) | Sigma Aldrich | Cat# T6884 | 1 U/ml working concentration |
| Other | Fibronectin (human plasma) | Sigma Aldrich | Cat# FIBRP-RO | 10 µg/ml working concentration |
| Other | Laminin | Sigma Aldrich | Cat# L2020 | 25 µg/ml working concentration |
| Other | Collagen | Sigma Aldrich | Cat# C4243 | 500 µg/ml working concentration |
| Other | poly-D-lysine | Sigma Aldrich | Cat# P0899 | 10 µg/ml working concentration |
| Other | DAPI stain | Thermo Fisher Scientific | Cat# D1306 | 0.2 µM working concentration (IF) |
| Other | Alexa Fluor 488-Phalloidin | Thermo Fisher Scientific | Cat# A12379 | 1:200 (IF) |
| Other | Alexa Fluor 568-Phalloidin | Thermo Fisher Scientific | Cat# 12380 | 1:200 (IF) |
| Other | Fluorescent microspheres. 0.2 µm diameter | Invitrogen | Cat# F8848 |
Additional files
Download links
A two-part list of links to download the article, or parts of the article, in various formats.
Downloads (link to download the article as PDF)
Open citations (links to open the citations from this article in various online reference manager services)
Cite this article (links to download the citations from this article in formats compatible with various reference manager tools)
Generation of stress fibers through myosin-driven reorganization of the actin cortex
eLife 10:e60710.
https://doi.org/10.7554/eLife.60710


