Evolution of fibroblasts in the lung metastatic microenvironment is driven by stage-specific transcriptional plasticity
- Department of Pathology, Sackler Faculty of Medicine, Tel Aviv University, Israel
- Department of Obstetrics and Gynecology, Tel Aviv Sourasky Medical Center, Israel
- Department of Biomolecular Sciences, The Weizmann Institute of Science, Israel
- Department of Clinical Microbiology and Immunology, Sackler Faculty of Medicine, Tel Aviv University, Israel
- Blavatnik School of Computer Sciences, Faculty of Exact Sciences, Tel Aviv University, Israel
- Department of Pathology, Sheba Medical Center, Tel Hashomer, affiliated with Sackler Faculty of Medicine, Tel Aviv University, Israel
Figures
Figure 1 with 1 supplement
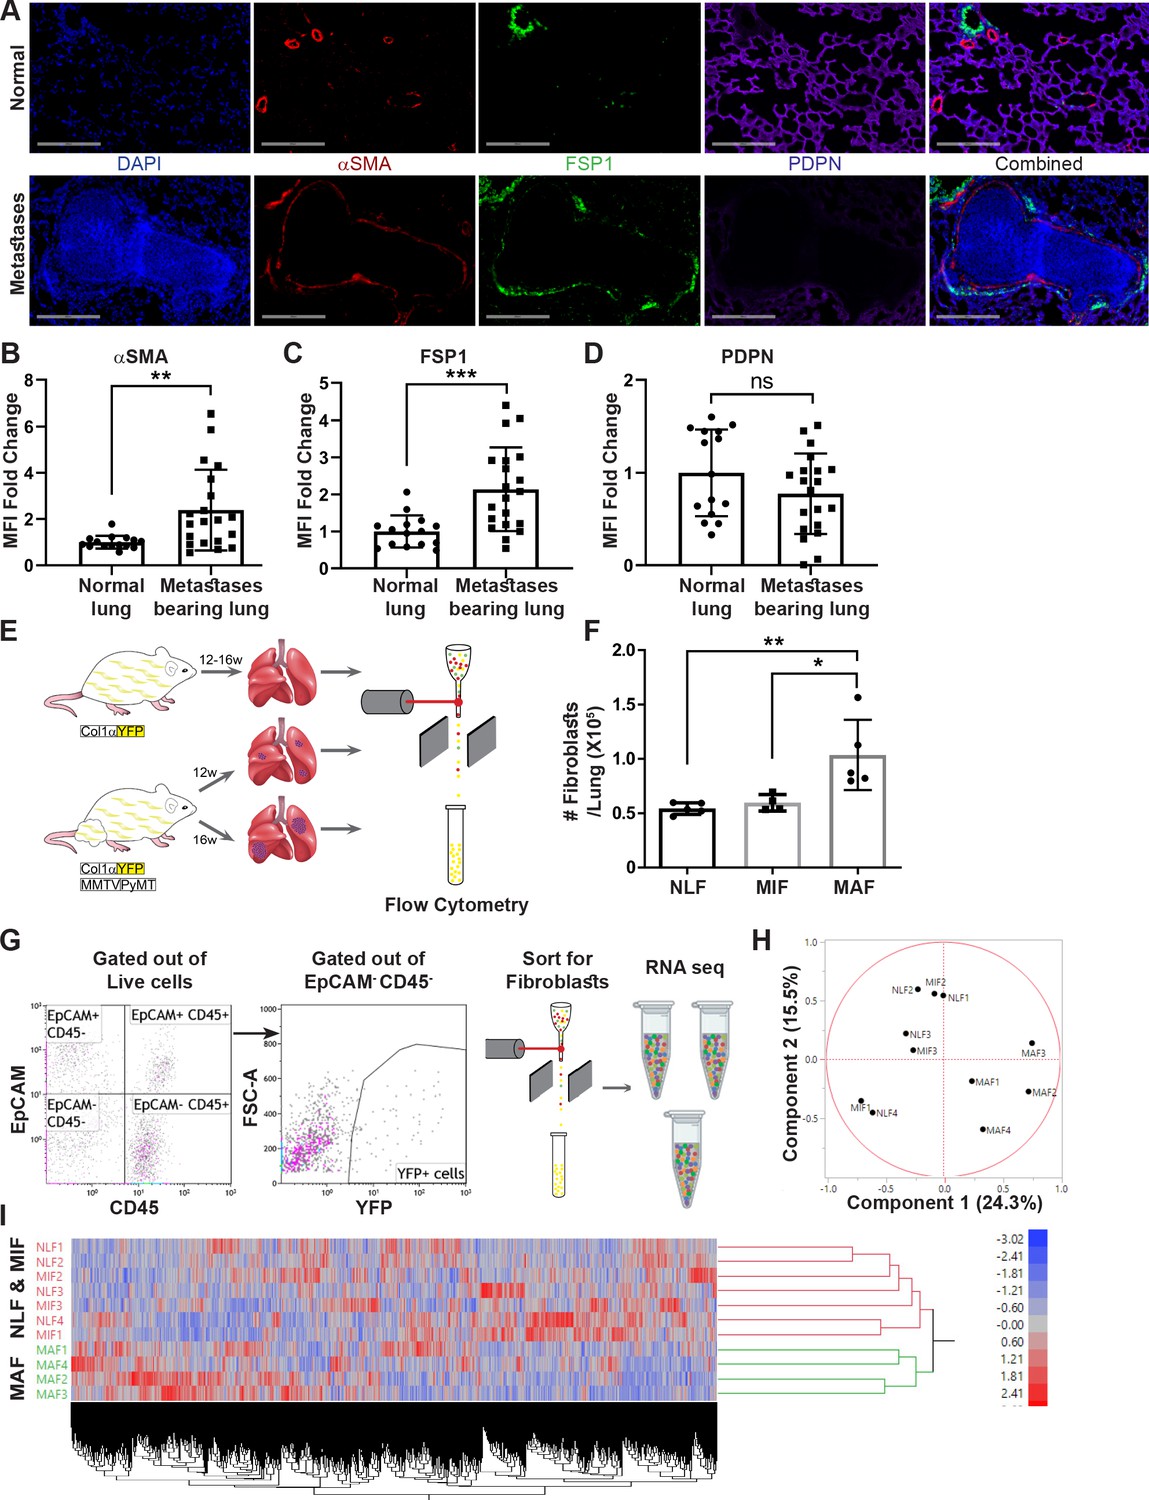
Fibroblasts are activated and transcriptionally reprogrammed in the lung metastatic niche.
(A) Representative immunofluorescent staining of αSMA (red), FSP-1 (green), and Podoplanin (PDPN) (purple) in normal lungs from FVB/n mice (n = 3), and metastases-bearing lungs from MMTV-PyMT mice (n = 4). Scale bar: 200 µM. (B–D) Quantification of mean fluorescent intensity (MFI) in 5 fields of view (FOV) per mouse of staining shown in (A). (E) Workflow illustration of fibroblast isolation (CD45-EpCAM-YFP+) from normal FVB/n;col1a1-YFP mice (NLF) and of micro- or macrometastasis-associated fibroblasts from MMTV-PyMT;Col1a1-YFP mice (MIF and MAF). (F) Quantification of number of fibroblasts per lung, based on flow cytometry analysis. *p<0.05, **p<0.01. Data are represented as mean ± SD, n = 5. (G) Flow cytometry gating strategy for isolation of fibroblasts prior to RNA-sequencing. (H, I) Principal component analysis (PCA) (H) and hierarchical clustering (I) of 11,115 protein coding genes identified in RNA-seq.
Figure 1—figure supplement 1
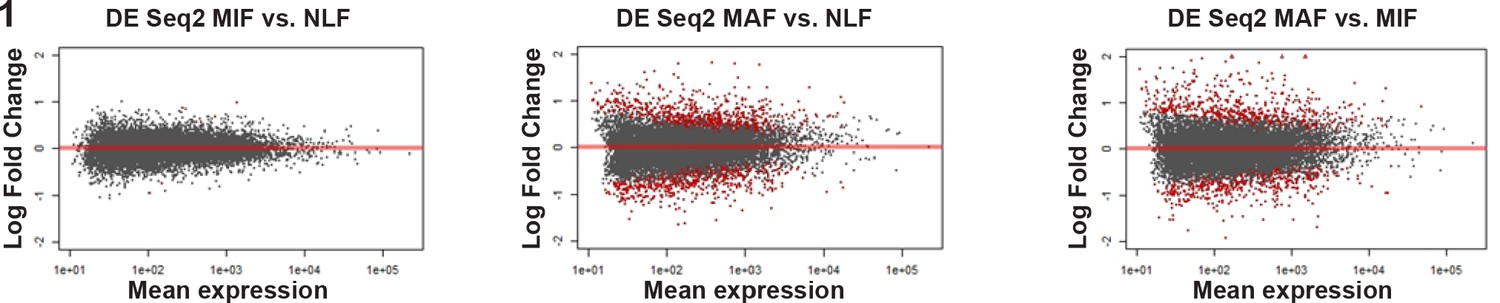
Volcano plots of differential expression analysis vs. mean expression of micrometastasis-associated fibroblast (MIF) vs. normal lung fibroblast (NLF), macrometastasis-associated fibroblast (MAF) vs. NLF and MAF vs. MIF using DESeq2.
Figure 2 with 1 supplement
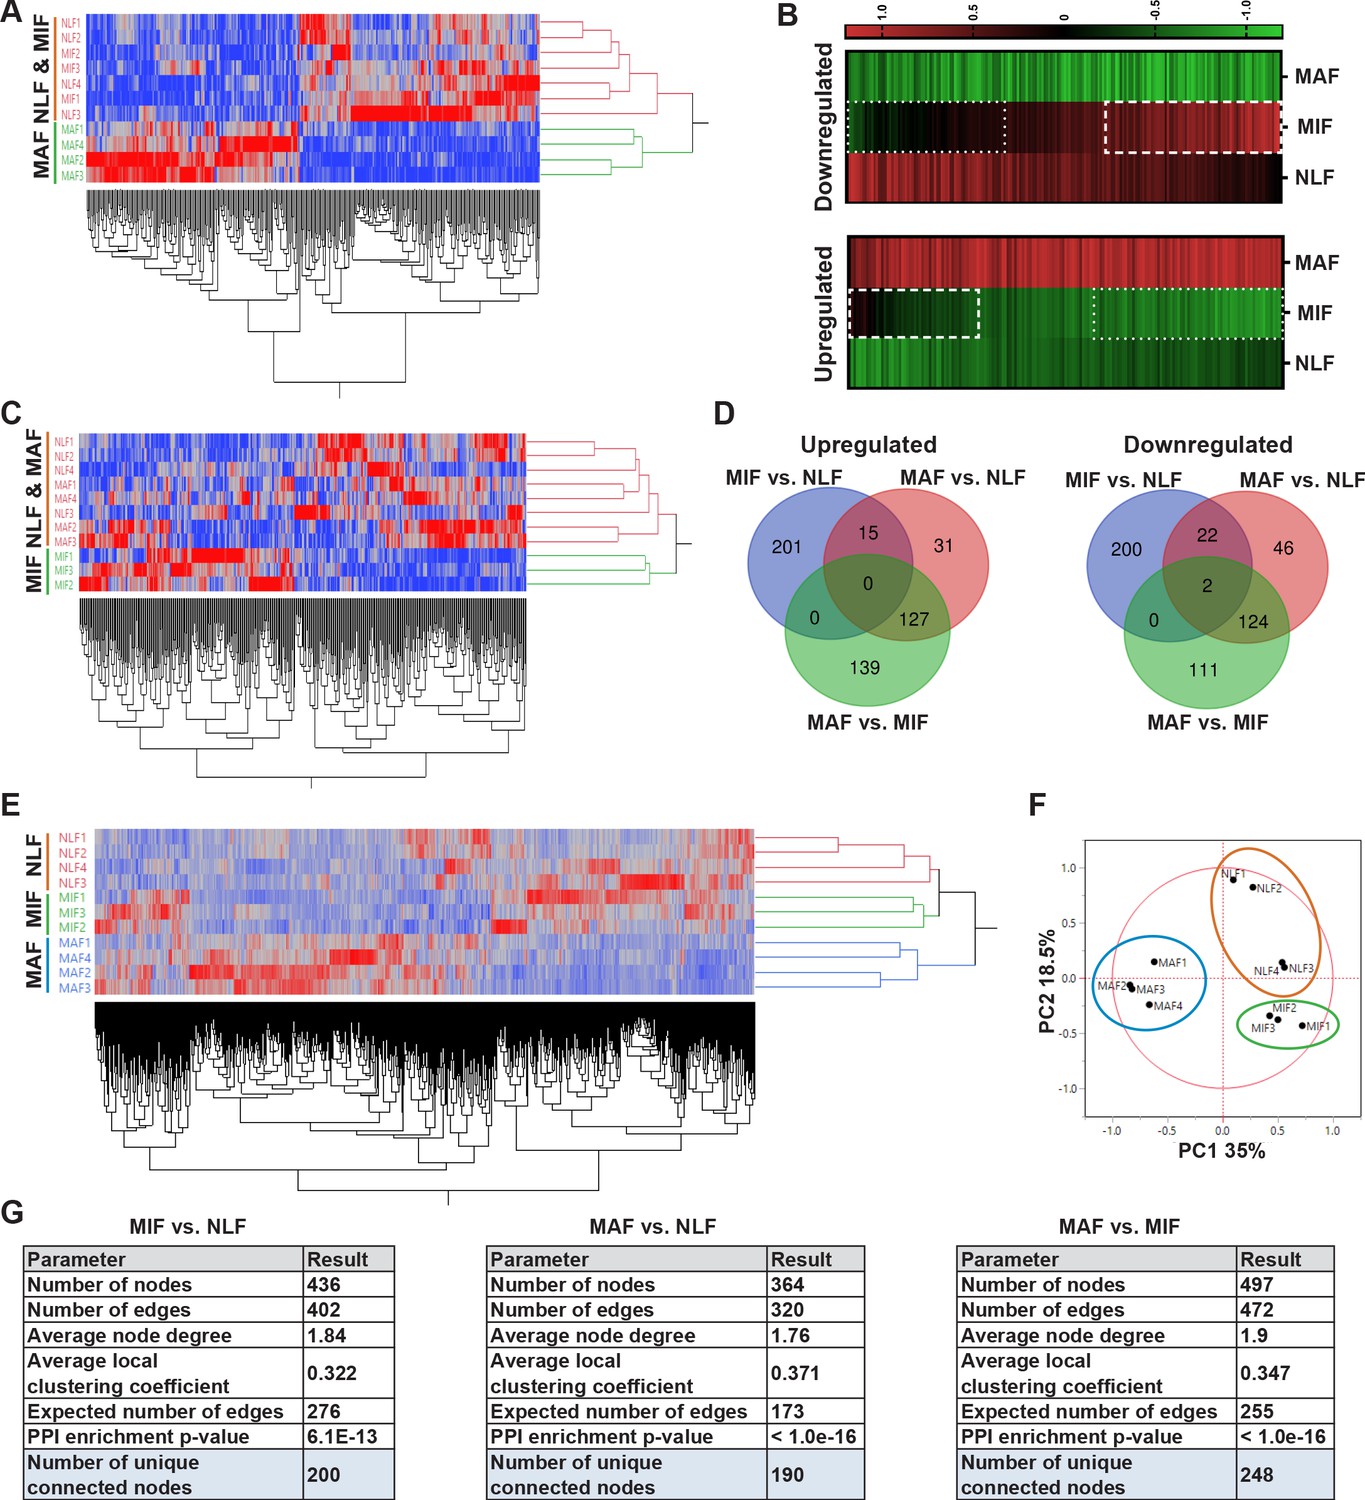
Transcriptome profiling of metastasis-associated fibroblasts reveals dynamic stage-specific changes in gene expression.
(A) Hierarchical clustering of genes upregulated or downregulated in macrometastasis-associated fibroblast (MAF) vs. normal lung fibroblast (NLF) based on fold change (FC) > |2|. (B) Presentation of the average Z-scored gene expression of genes differentially expression in MAF vs. NLF in all three groups: NLF, micrometastasis-associated fibroblast (MIF) and MAF. Dashed lines demarcate genes upregulated in MIF vs. NLF. Dotted lines demarcate genes downregulated in MIF vs. NLF. (C) Hierarchical clustering of genes upregulated or downregulated in MIF vs. NLF based on FC > |1.5|. (D) Venn diagram of upregulated or downregulated genes in the different comparisons. (E, F) Hierarchical clustering (E) and principal component analysis (PCA) (F) of genes upregulated or downregulated in the different comparisons (MIF vs. NLF, MAF vs, NLF, MAF vs. MIF). (G) Protein-protein interaction analysis of the differentially expressed genes per comparison performed in STRING platform. Interconnected genes were selected for subsequent analysis.
Figure 2—figure supplement 1
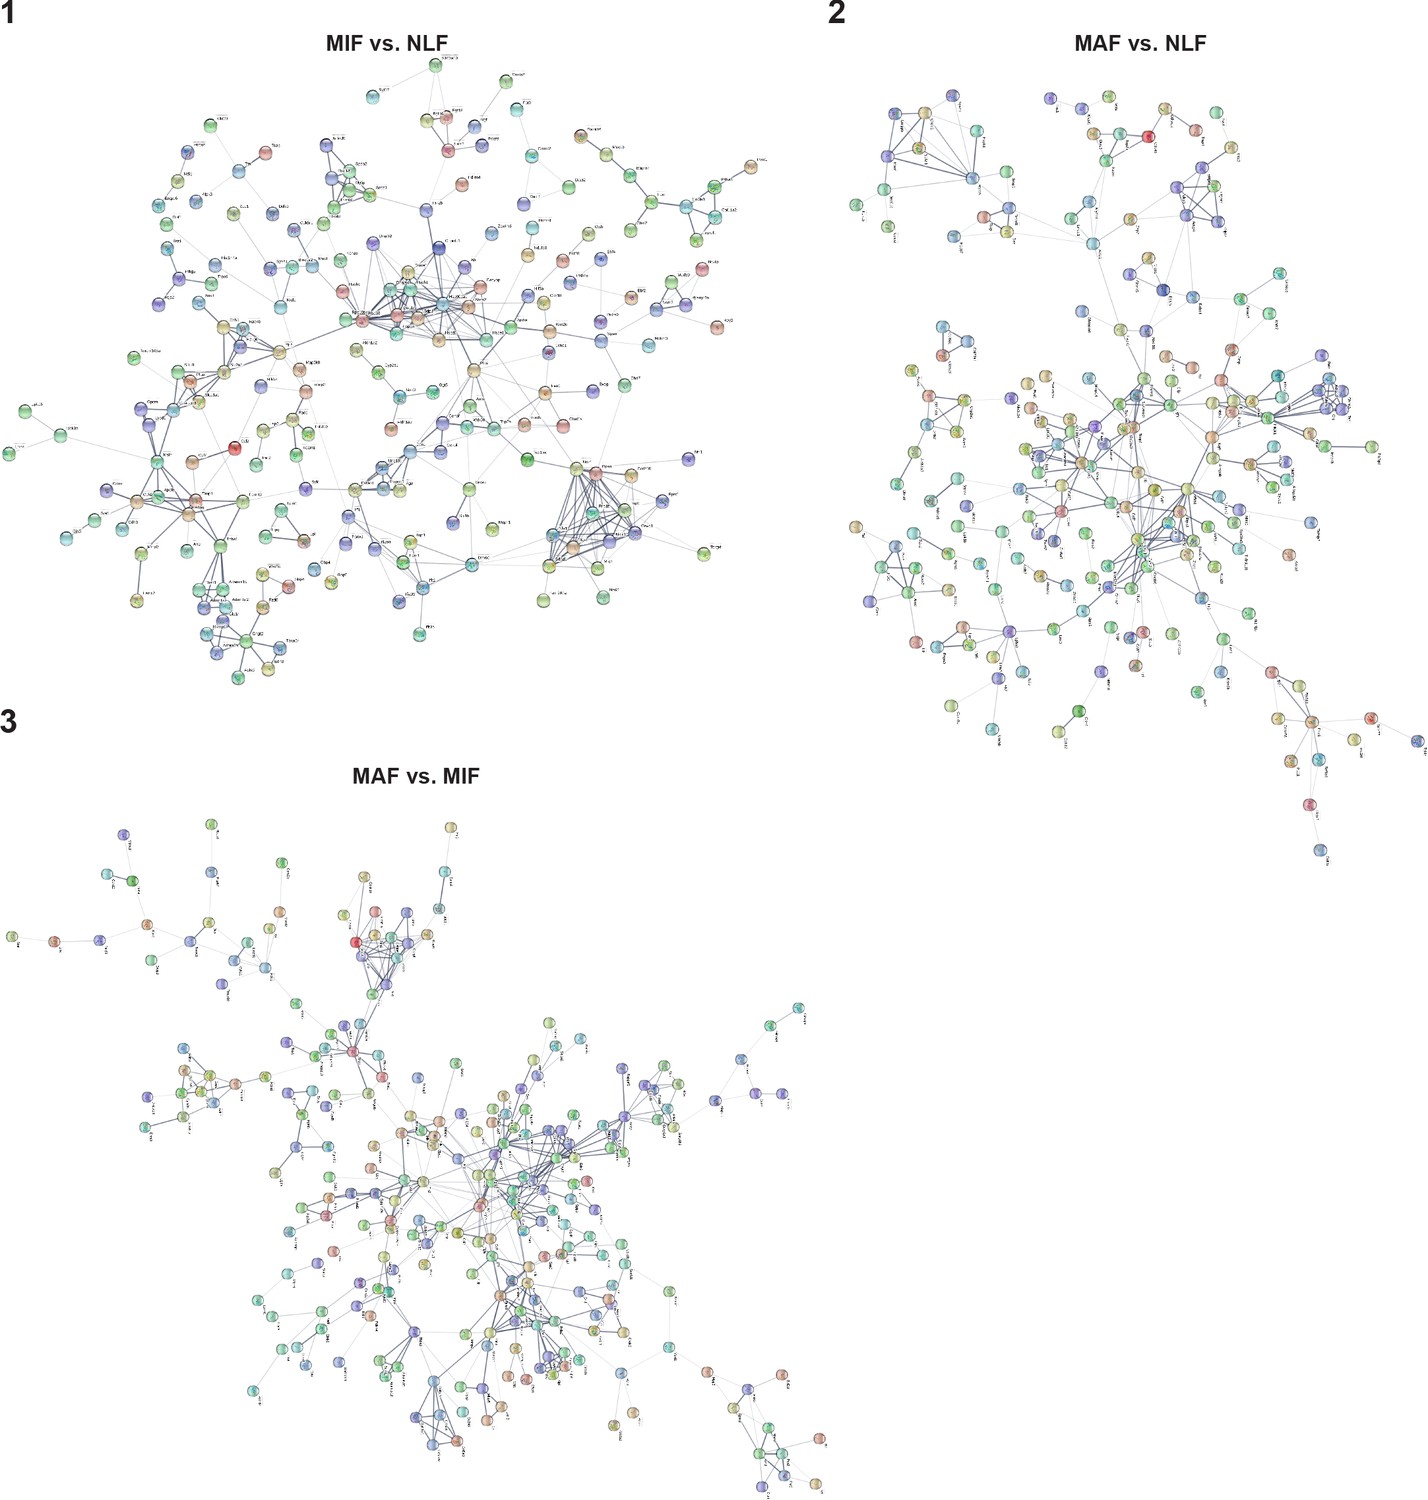
Protein-protein interactions of differentially expressed genes in each comparison (micrometastasis-associated fibroblast [MIF] vs. normal lung fibroblast [NLF] [1], macrometastasis-associated fibroblast [MAF] vs. NLF [2], MAF vs. MIF [3]), derived from the STRING platform.
Confidence > 0.3, text mining connections were excluded.
Figure 3 with 1 supplement
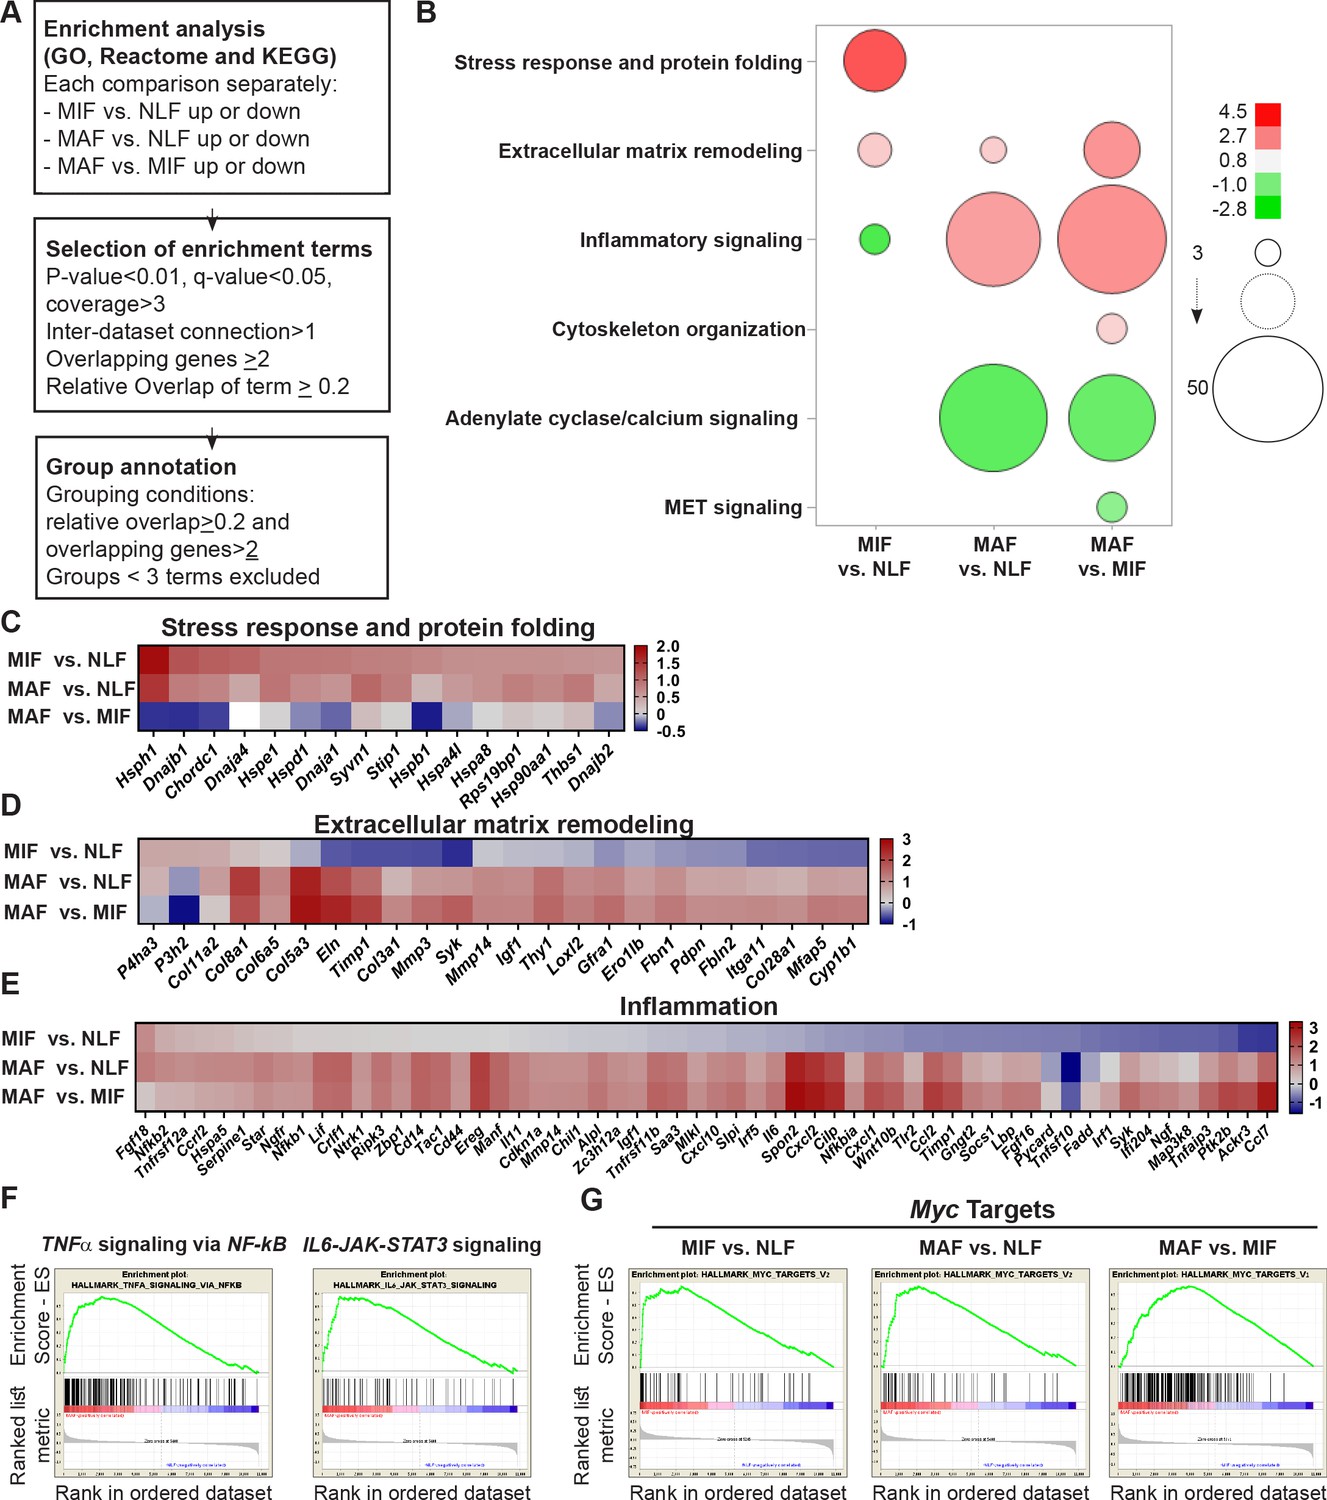
Fibroblast metastases-promoting tasks are driven by functional gene signatures related to stress response, inflammation, and extracellular matrix (ECM) remodeling.
(A) Flow chart of the pathway enrichment over-representation analyses based on GO, Reactome, and KEGG using the Consensus Path DB (CPDB) platform. (B) Bubble graph heat map based on the number of specific enrichment terms and their average log-transformed q-value per group. Circle sizes denote number of terms included in a group; color indicates the average log-transformed q-value. Enrichments based on downregulated genes are presented as negative values. (C–E) Heat maps of gene expression fold-change presenting genes in selected group annotations. Fold change was log2 transformed for presentation. Only genes found in at least two different terms are presented. (C) ‘Stress response and protein folding’ enriched genes. (D) ‘Extracellular matrix remodeling’ enriched genes. (E) ‘Inflammatory signaling’ and/or ‘Cytokine and chemokine activity’ enriched genes. (F) Gene Set Enrichment Analysis (GSEA) for hallmark datasets upregulated in macrometastasis-associated fibroblast (MAF) vs. normal lung fibroblast (NLF) related to inflammatory signaling, false discovery rate (FDR) < 0.05, normalized enrichment score (NES) > 2. (G) GSEA results for ‘Myc targets’ hallmark dataset that were upregulated in all comparisons. FDR < 0.05; NES > 2.
Figure 3—figure supplement 1
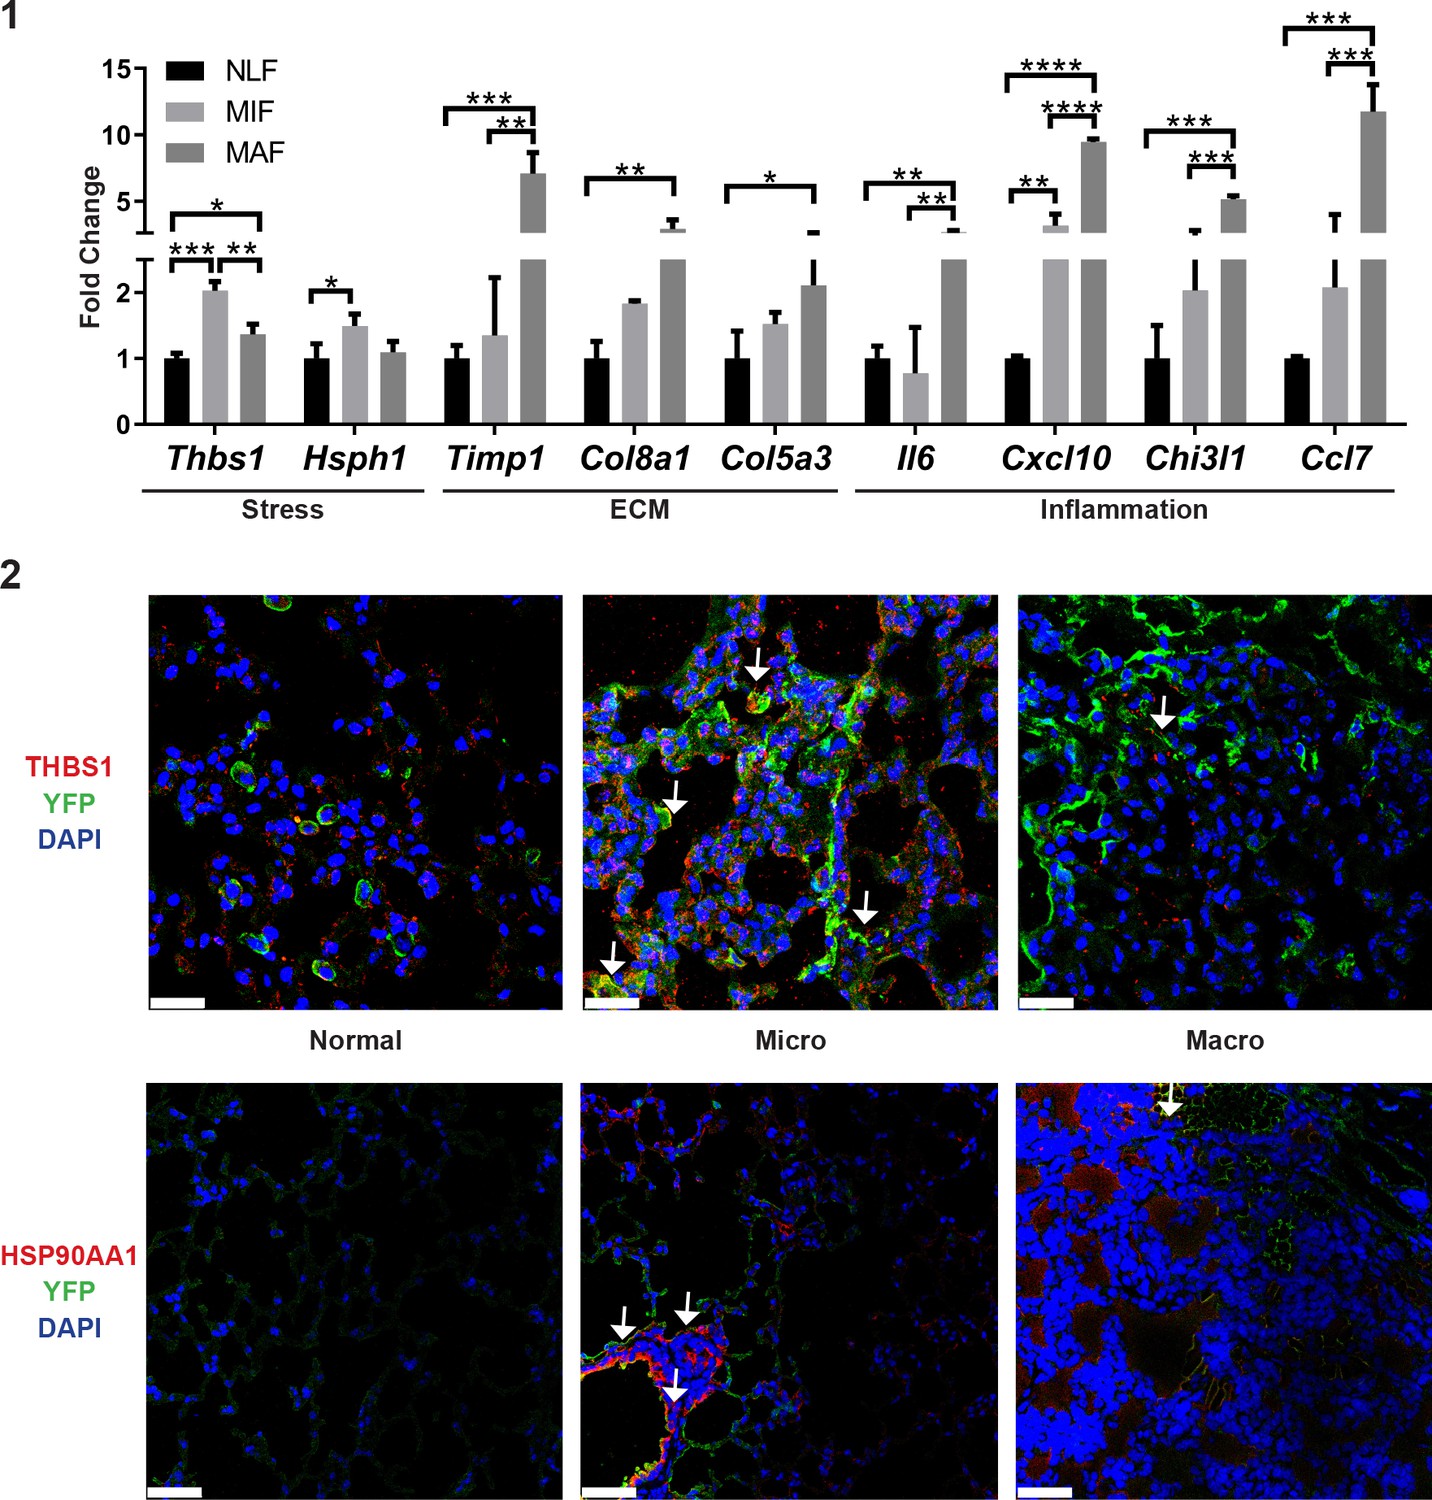
qRT-PCR analysis in sorted normal lung fibroblast (NLF), micrometastasis-associated fibroblast (MIF), and macrometastasis-associated fibroblast (MAF).
(1) Relative expression (normalized to NLF) of key genes found to be differentially expressed in RNA-seq. *p<0.05, **p<0.01, ***p<0.001, ****p<0.0001. Data are presented as mean ± SD, n = 3 per group. (2) Expression of THBS1 and HSP90AA1 in lung fibroblasts: representative images of YFP and THBS1 immunostaining (top) or YFP and HSP90AA1 (bottom) in normal lungs, micro- and macrometastases-bearing lungs from MMTV-PyMT mice (n = 3). Arrows denote co-staining. Scale bar THBS1: 25 µM. Scale bar HSP90AA1: 50 µM.
Figure 4 with 1 supplement

Multiple gene network analyses identify Myc as a central transcription factor (TF) in the rewiring of metastasis-associated fibroblasts.
(A) Heat maps of ranking parameters and analyses performed per each comparison to identify the centrality of five candidate TFs: Hif1a, Hsf1, Myc, Nfkb1, Stat3. Orange: STRING protein-protein interaction (PPI) analysis results. Yellow: Advanced Network Analysis Tool (ANAT) pathway analysis results. Green: RegNetwork analysis of connectivity between target genes and TFs. Purple: VarElect analysis results. (B) Representative ANAT protein-protein network using all TFs as anchors (green) and the stage-specific signature as target genes (red). Only interaction confidence > 0.6 are presented. (C) Box plot of VarElect scores for directly related genes to each TF (presenting top 50 per TF). (D) Z-score graphs of the results described in (A). *p<0.05, **p<0.01, ***p<0.001, ****p<0.0001, one-way ANOVA with Tukey correction for multiple comparisons. Data are presented as mean ± SD. (E) Expression of TFs in micrometastasis-associated fibroblast (MIF) and macrometastasis-associated fibroblast (MAF): representative multiplex immunofluorescent staining (MxIF) staining of YFP (green), STAT3 (cyan), NF-κB (magenta), MYC (red), and HSF1 (yellow) in tissue sections of micro- and macrometastases bearing lungs from PyMT;Col1a1-YFP mice (n = 3). Regions with co-staining of several TFs are denoted with solid lines, unique MYC staining regions are denoted in dashed lines. Scale bar: 50 µM.
Figure 4—figure supplement 1
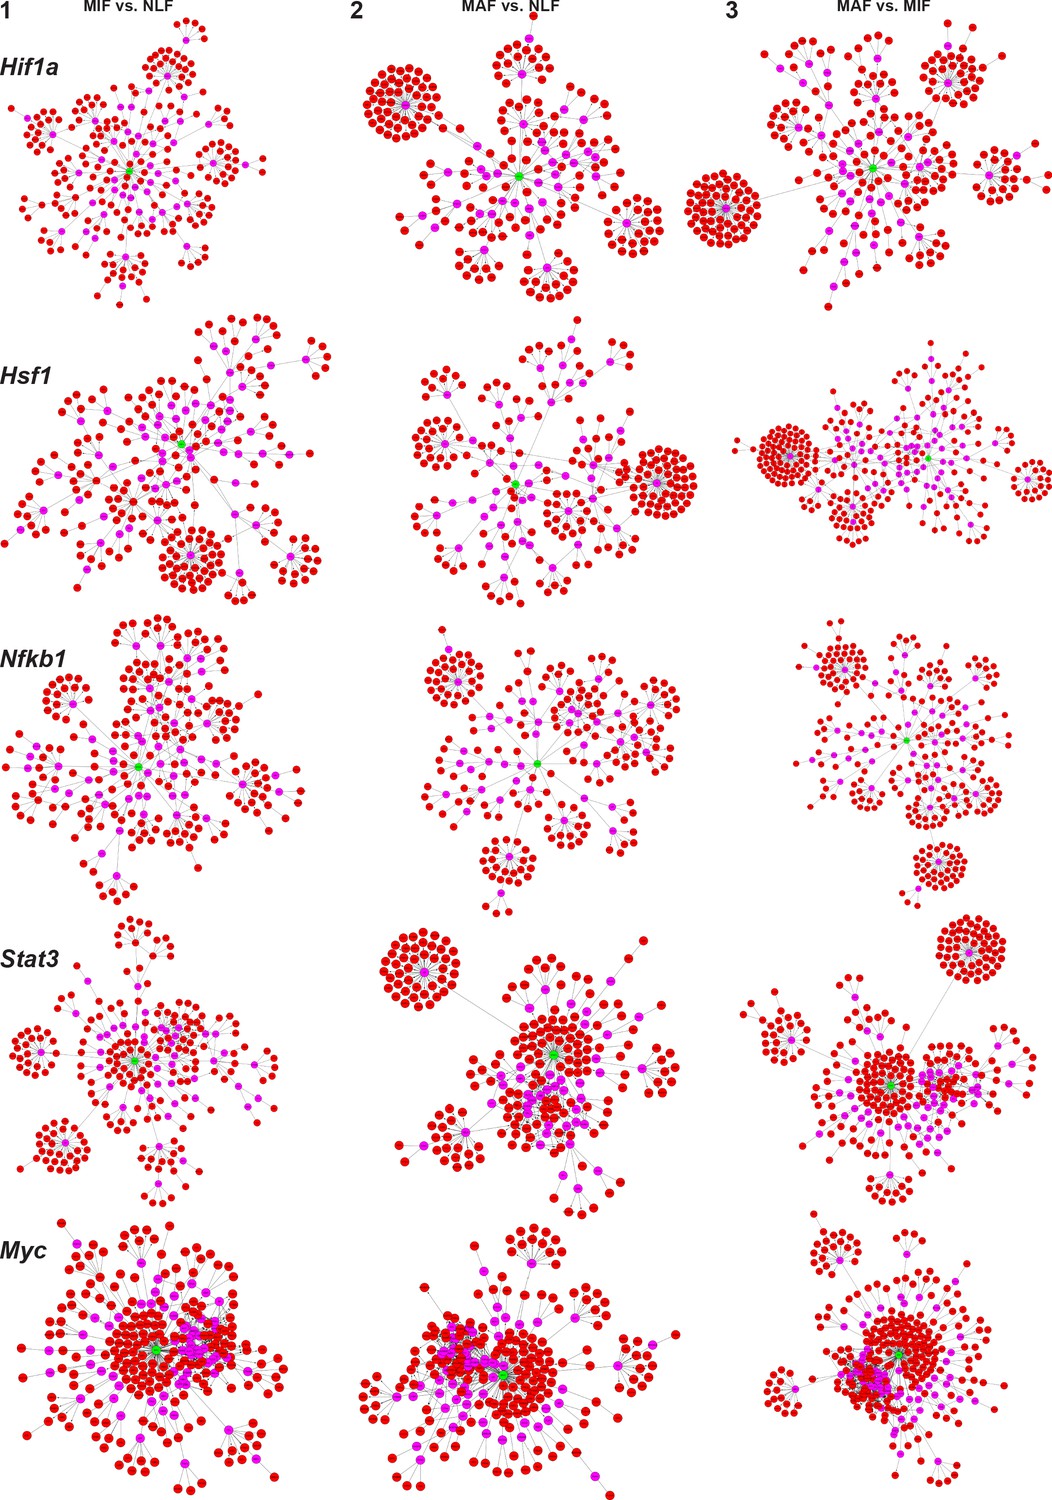
(1–3) Advanced Network Analysis Tool (ANAT) pathway networks for each transcription factor (TF) (Hif1a, Hsf1, Myc, Nfkb1, Stat3) and each comparison (micrometastasis-associated fibroblast [MIF] vs. normal lung fibroblast [NLF] [1], macrometastasis-associated fibroblast [MAF] vs. NLF [2], MAF vs. MIF [3]).
Figure 5 with 1 supplement
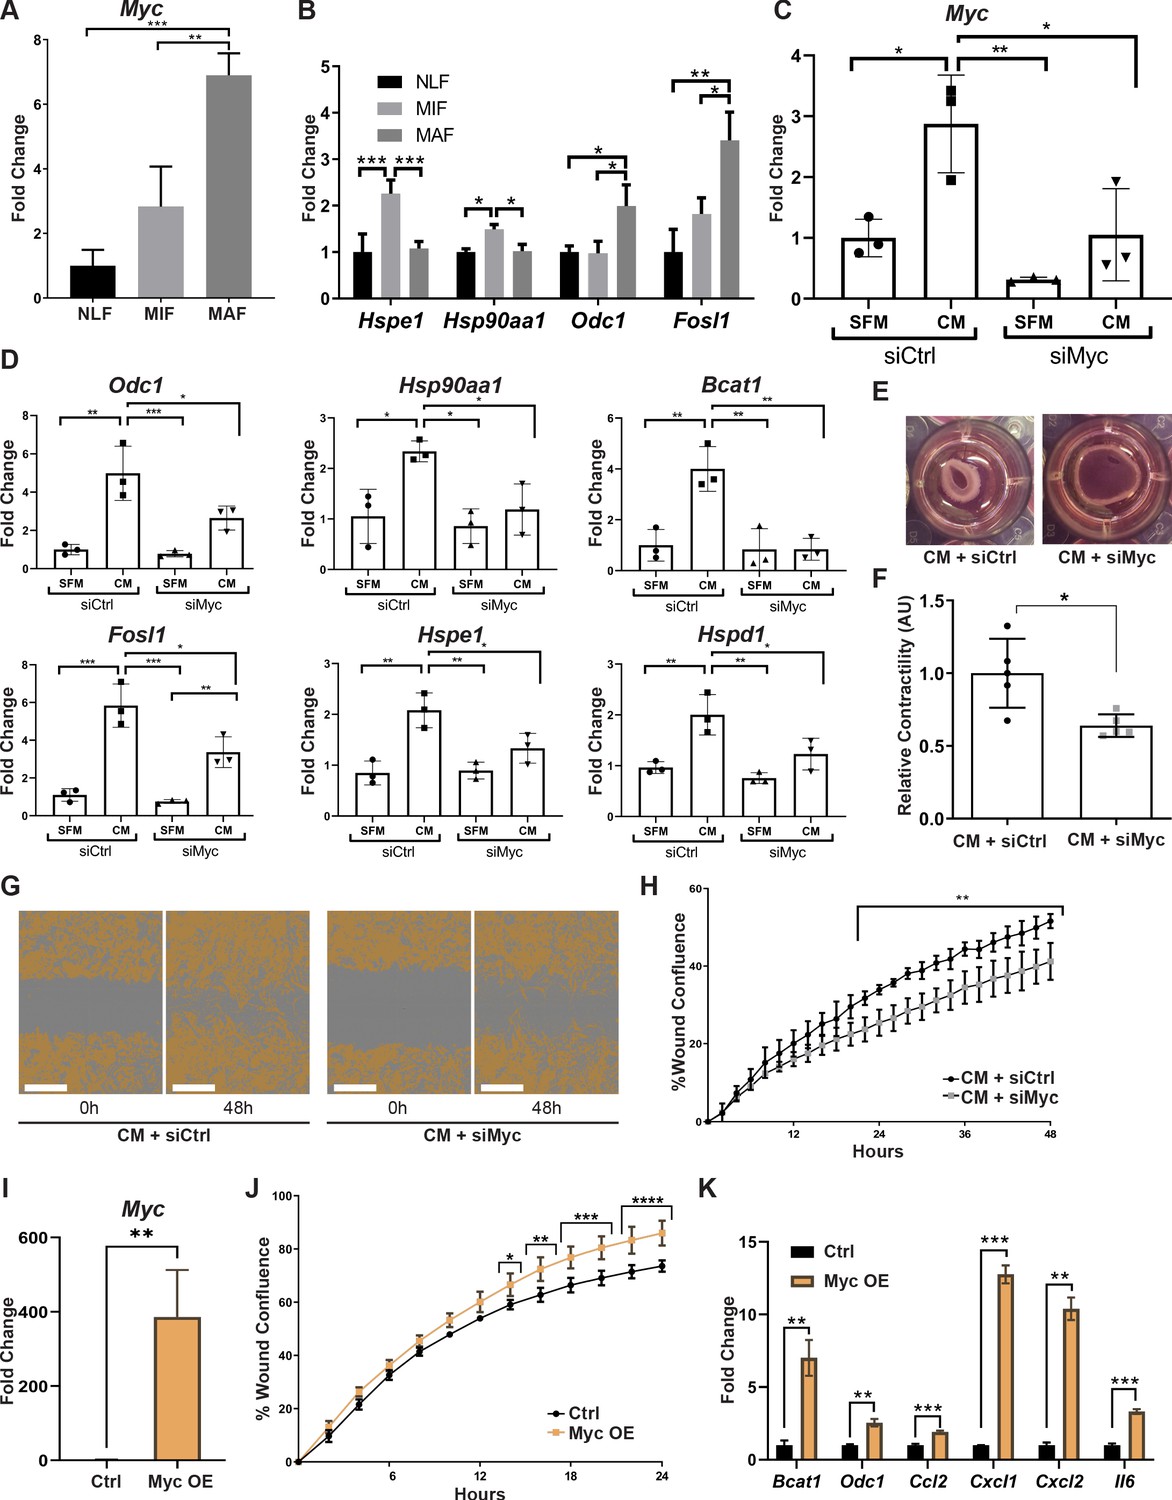
Myc is a central regulator in metastasis-associated fibroblasts and contributes to their acquisition of tumor-promoting traits.
(A) qRT-PCR analysis of Myc expression in sorted normal lung fibroblast (NLF), micrometastasis-associated fibroblast (MIF), and macrometastasis-associated fibroblast (MAF). **p<0.01. Data are represented as mean ± SD, n = 3 per group. (B) qRT-PCR analysis in sorted NLF, MIF, and MAF. Relative expression of Myc target genes found to be differentially expressed in RNA-seq. *p<0.05. Data are presented as mean ± SD, n > 3 per group. (C) Myc targeting by siRNA: Myc expression in NLF transfected with siRNA targeting Myc or with control siRNA (siMyc or siCtrl). Following transfection, cells were incubated with serum-free medium (SFM) or with Met-1 conditioned media (CM) supplemented with the same siRNA for additional 24 hr. Data are presented as mean ± SD, n = 3. (D) qRT-PCR analysis of Myc targets following treatment as in (C). Data are represented as mean ± SD, n = 3. (E, F) Representative images and quantification of collagen contraction assay of fibroblasts transfected with siMyc or siCtrl, incubated with Met-1 CM. *p<0.05. Data are represented as mean ± SD, n = 5. (G, H) Representative images and quantification of scratch closure assay of NLF transfected with siMyc or siCtrl and incubated with Met-1 CM. Scale bar: 400 µm. Two-way ANOVA with multiple comparisons. ***p<0.001. Data are presented as mean ± SD, n = 5. (I) Myc overexpression: qRT-PCR analysis of Myc expression in NLF transfected with Myc or with a control plasmid (Myc OE or Ctrl). Data are presented as mean ± SD, n = 3. (J) Quantification of scratch closure assay of NLF transfected with Myc or a control plasmid. Two-way ANOVA with multiple comparisons. *p<0.5, **p<0.01, ***p<0.001, ****p<0.0001. Data are presented as mean ± SD, n = 3. (K) qRT-PCR analysis of Myc target genes following treatment as in (I). Data are represented as mean ± SD, n = 3.
Figure 5—figure supplement 1
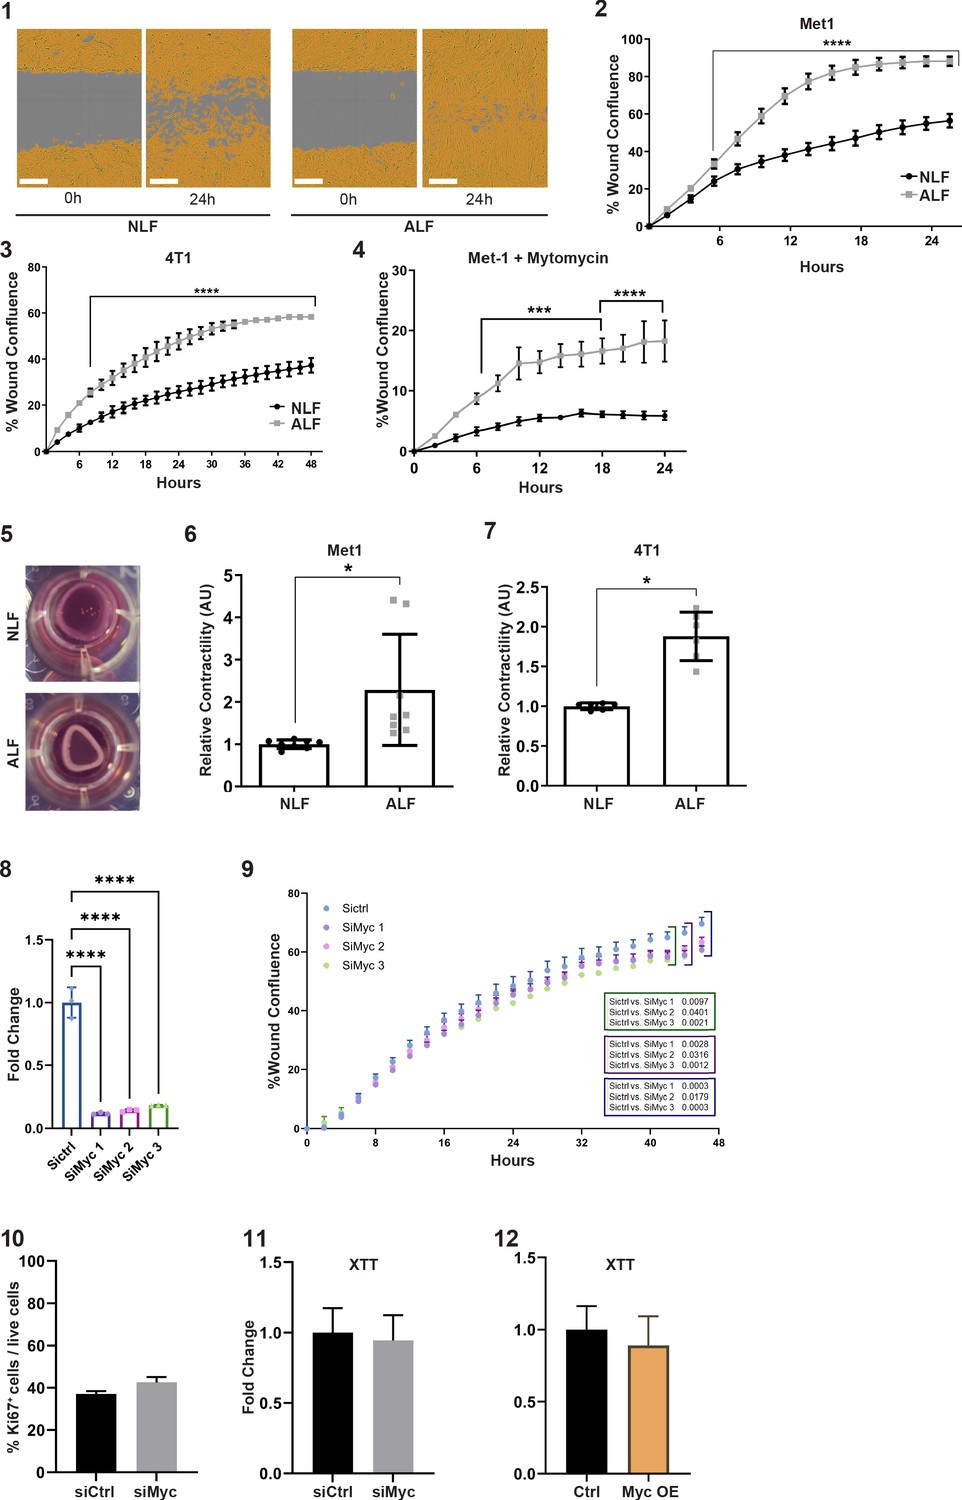
Representative images of scratch closure assay at 0 hr and 24 hr following scratch.
(1) Lung fibroblasts were incubated with serum-free medium (SFM) (normal lung fibroblasts [NLF]) or with tumor cell conditioned media (CM) (activated lung fibroblasts [ALF]), scale bar: 300 µM. (2) Quantification of scratch closure assay performed with FVB/n lung fibroblasts incubated with SFM (NLF, n = 3) or with Met1 CM (ALF, n = 3). ****p<0.0001. Two-way ANOVA with multiple comparisons. Data are represented as mean ± SD. (3) Quantification of scratch closure assay performed with BALB/c NLF incubated with SFM (n = 2) or with 4T1 CM (ALF, n = 2). ****p<0.0001. Two-way ANOVA multiple comparisons. Data are represented as mean ± SD. (4) Scratch closure is not a result of enhanced fibroblast proliferation: quantification of scratch closure of lung fibroblasts incubated with SFM (NLF), or with Met1-CM (ALF), and supplemented with the proliferation inhibitor mitomycin C. ***p<0.001, ****p<0.0001. Two-way ANOVA multiple comparisons. Data are presented as mean ± SEM, n = 3. (5) Representative images of collagen contraction assay at 24 hr. Lung fibroblasts were embedded in collagen gel and incubated with SFM (NLF) or in tumor cell CM (ALF). (6) Quantification of collagen contraction with FVB/n lung fibroblasts incubated with SFM (NLF, n = 8) or with Met1 CM (ALF, n = 8). *p<0.05. Data are represented as mean ± SD. (7) Quantification of collagen contraction with BALB/c NLF incubated with SFM (n = 2) or with 4T1 CM (ALF, n = 2). *p<0.05. Data are represented as mean ± SD. (8) Myc targeting by siRNA: Myc expression in NLF that were transfected with individual siRNA targeting Myc, or with control siRNA (siMyc1, siMyc2 siMyc3 or siCtrl). Data are presented as mean ± SD of technical repeats, n = 4. (9) Quantification of scratch closure assay of NLF transfected with individual siMyc1/2/3 or siCtrl and incubated with Met-1 CM. Two-way ANOVA with multiple comparisons. Data are presented as mean ± SEM, n = 4. (10) Flow cytometry analysis of Ki67+ cells in fibroblasts transfected with siMyc as compared with siCtrl. Data are presented as mean % of Ki67+ cells out of live cells ± SD, n = 3 per group. (11) Proliferation analysis (XTT) of fibroblasts transfected with siMyc as compared with siCtrl. Data are presented as mean fold change from siCtrl ± SD, n = 3 per group. (12) Proliferation analysis (XTT) of fibroblasts transfected with Myc overexpression plasmid or a control plasmid. Data are presented as mean fold change from control ± SD, n = 3 per group.
Figure 6 with 1 supplement
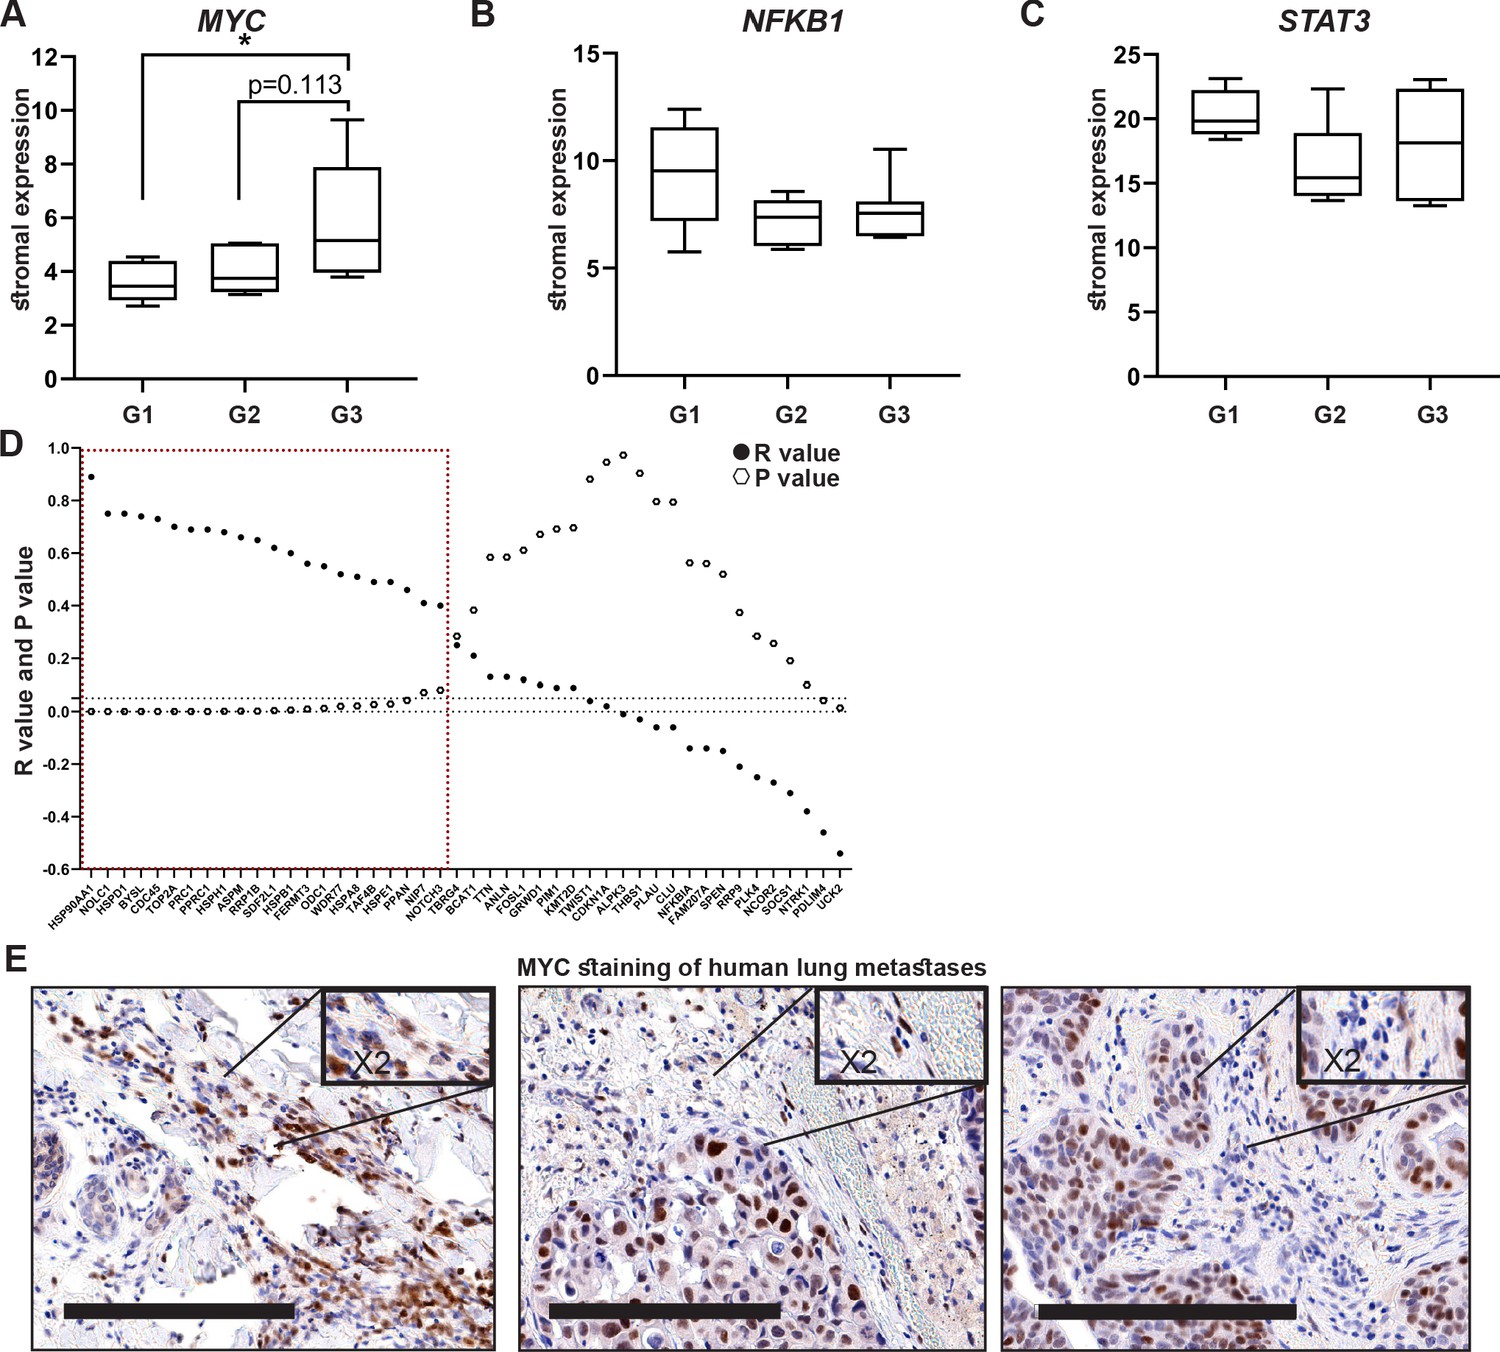
High expression of MYC and its downstream target genes is associated with tumor aggressiveness in human breast cancer.
(A–C) Box plots of MYC (A), NFKB1 (B), and STAT3 (C) expression in tumor-associated stroma from the GSE14548 dataset by disease grade (grade 1: G1; grade 2: G2; grade 3: G3). Data are presented as median and upper and lower quartiles ± SD. One-way ANOVA with Tukey correction for multiple comparisons, *p<0.05. (D) Correlations between the expression of MYC and selected downstream targets in tumor-associated stroma based on GSE14548. Positive correlations are marked in dotted red square. *p-value<0.05. (E) Representative immunohistochemistry staining of MYC in lung metastases of breast cancer patients (n = 9). Scale bars: 200 μm.
Figure 6—figure supplement 1
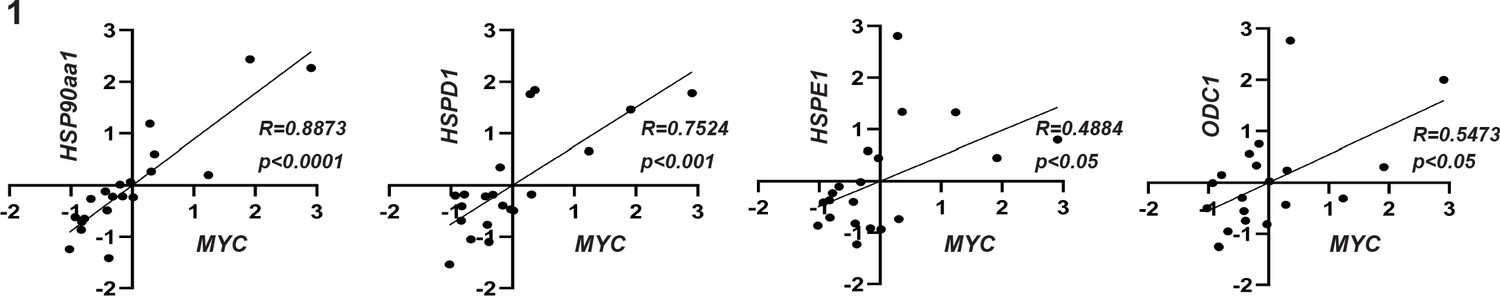
Correlation graphs between MYC expression and the expression of specific target genes.
p-values of Pearson correlation and correlation coefficient are presented in the graph.
Figure 7
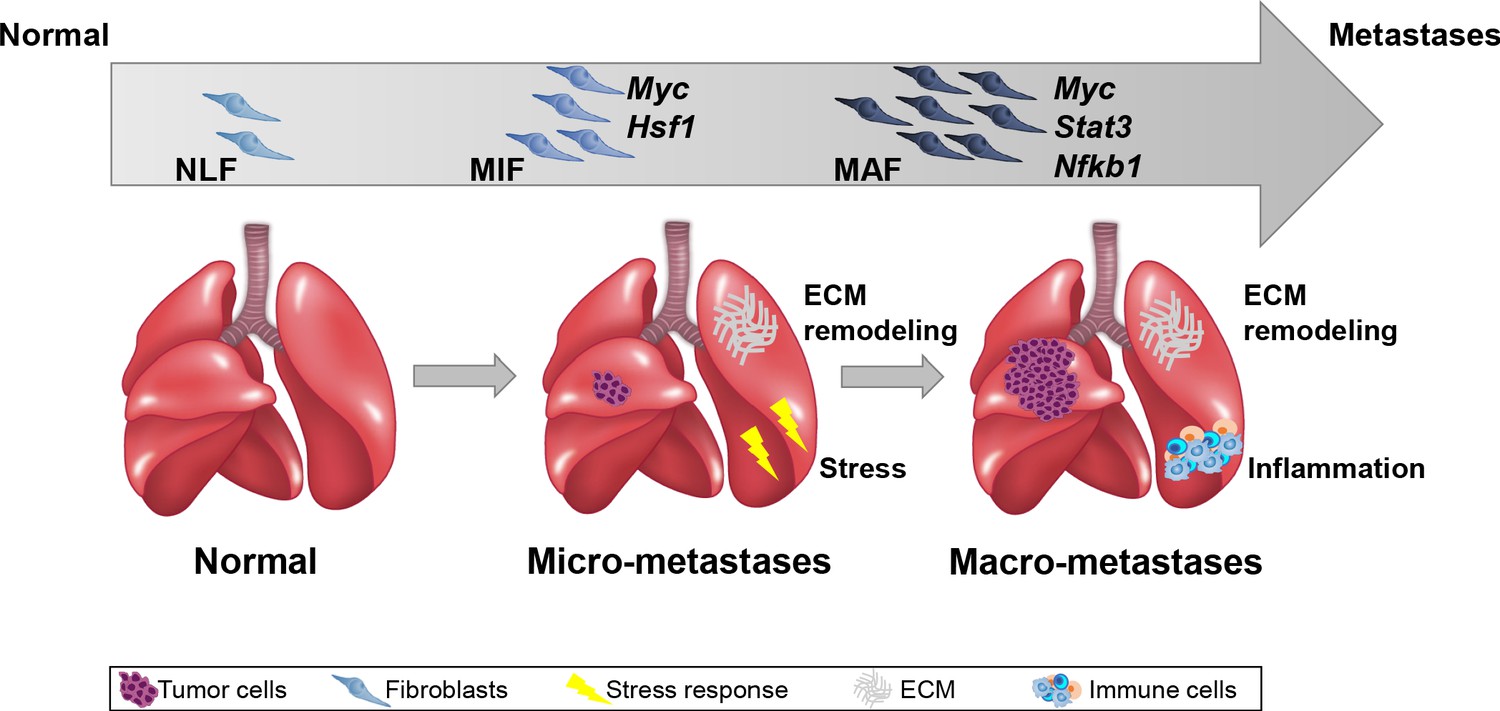
Summary scheme.
The co-evolution of lung fibroblasts at the metastatic microenvironment is driven by stage-specific transcriptional plasticity that activates growth-promoting tasks including stress response, extracellular matrix (ECM) remodeling, and instigation of inflammatory signaling.
Tables
Key resources table
| Reagent type (species) or resource | Designation | Source or reference | Identifiers | Additional information |
|---|---|---|---|---|
| Cell line (Mus musculus) | Met-1 | Collaborator’s lab | ||
| Cell line (M. musculus) | 4T1 | Collaborator’s lab | ||
| Transfected construct (M. musculus) | siRNA to Myc (Accell SMARTpool) | Dharmacon/ Thermo Fisher Scientific | E-040813 | |
| Transfected construct (M. musculus) | siRNA to Myc 1 | Dharmacon/ Thermo Fisher Scientific | A-040813-17 | CCUCAAACUUAAAUAGUAU |
| Transfected construct (M. musculus) | siRNA to Myc 2 | Dharmacon/ Thermo Fisher Scientific | A-040813-20 | CUCUGGUGCAUAAACUGAC |
| Transfected construct (M. musculus) | siRNA to Myc 3 | Dharmacon/ Thermo Fisher Scientific | A-040813-18 | GCUUCAGCCAUAAUUUUAA |
| Transfected construct (M. musculus) | Mouse Myc cDNA pCMV-SPORT6 | Tamar Laboratories | #MMM1013-202763479 | |
| Antibody | Monoclonal rat anti-mouse EpCAM-APC | eBioscience/ Thermo Fisher Scientific | 17-5791 | 1:100 |
| Antibody | Monoclonal rat anti-mouse CD45-PercpCy5.5 | eBioscience/ Thermo Fisher Scientific | 45-0451 | 1:200 |
| Antibody | Monoclonal rat anti-mouse CD31 PeCy7 | eBioscience/ Thermo Fisher Scientific | 25-0311 | 1:50 |
| Antibody | Monoclonal rat anti-mouse Ki67-PE | BioLegend | 652403 | 1:100 |
| Antibody | Monoclonal rabbit anti-mouse Nfkb1 | Cell Signaling | CST-8242S | 1:200 |
| Antibody | Monoclonal rabbit anti-mouse HSP90aa1 | Cell Signaling | CST-4877S | 1:200 |
| Antibody | Monoclonal rabbit anti-mouse Stat3 | Cell Signaling | CST 12640S | 1:200 |
| Antibody | Polyclonal chicken anti-GFP/YFP | Abcam | AB-ab13970 | 1:400 |
| Antibody | Polyclonal rabbit anti-GFP/YFP | Abcam | AB-ab6556 | 1:100 |
| Antibody | Monoclonal rabbit anti-mouse Myc | Abcam | AB-ab32072 | 1:200 |
| Antibody | Monoclonal rabbit anti-mouse THBS1 | Abcam | AB-ab263905 | 1:50 |
| Antibody | Polyclonal rabbit anti-mouse Hsf1 | Cell Signaling | 4356S | 1:800 |
| Antibody | Monoclonal mouse anti-mouse aSMA | Sigma-Aldrich | A2547 | 1:1000 |
| Antibody | Polyclonal goat anti-mouse PDPN | R&D Systems | AF3244 | 1:200 |
| Antibody | Polyclonal rabbit anti-mouse FSP-1 (S100A4) | Abcam | Ab41532 | 1:600 |
| Antibody | Polyclonal goat anti-rabbit | Jackson | 111-035-144 | 1:400 |
| Commercial assay or kit | Opal 520 Reagent Pack | Akoya Biosciences | FP1487001 KT | 1:400 |
| Commercial assay or kit | Opal 570 Reagent Pack | Akoya Biosciences | FP1488001 KT | 1:400 |
| Commercial assay or kit | Opal 620 Reagent Pack | Akoya Biosciences | FP1495001 KT | 1:400 |
| Commercial assay or kit | Opal 650 Reagent Pack | Akoya Biosciences | FP1496001 KT | 1:400 |
| Commercial assay or kit | Opal 690 Reagent Pack | Akoya Biosciences | FP1497001 KT | 1:400 |
| Commercial assay or kit | Intracellular staining Kit | BD Biosciences | 554714 | |
| Sequence-based reagent | Bcat1_F | HyLabs | PCR primers | CCCATCGTACCTCTTTCACCC |
| Sequence-based reagent | Bcat1_R | HyLabs | PCR primers | GGGAGCGTGGGAATACGTG |
| Sequence-based reagent | Ccl7_F | HyLabs | PCR primers | CCTGGGAAGCTGTTATCTTCAA |
| Sequence-based reagent | Ccl7_R | HyLabs | PCR primers | GGTTTCTGTTCAGGCACATTTC |
| Sequence-based reagent | Chi3l1_F | HyLabs | PCR primers | GGCAGAGAGAAACTCCTGCTCA |
| Sequence-based reagent | Chi3l1_R | HyLabs | PCR primers | TGAGATTGATAAAATCCAGGTGTTG |
| Sequence-based reagent | Myc_F | HyLabs | PCR primers | CGGACACACAACGTCTTGGAA |
| Sequence-based reagent | Myc_R | HyLabs | PCR primers | AGGATGTAGGCGGTGGCTTTT |
| Sequence-based reagent | Col5a3_F | HyLabs | PCR primers | AGGGACCAACTGGGAAGAGT |
| Sequence-based reagent | Col5a3_R | HyLabs | PCR primers | AAAGTCAGAGGCAGCCACAT |
| Sequence-based reagent | Col8a1_F | HyLabs | PCR primers | GCCAGCCAAGCCTAAATGTG |
| Sequence-based reagent | Col8a1_R | HyLabs | PCR primers | GTAGGCACCGGCCTGAATGA |
| Sequence-based reagent | Cxcl10_F | HyLabs | PCR primers | CACCATGAACCCAAGTGCTG |
| Sequence-based reagent | Cxcl10_R | HyLabs | PCR primers | TTGCGAGAGGGATCCCTTG |
| Sequence-based reagent | Fosl1_F | HyLabs | PCR primers | CCAGGGCATGTACCGAGACTA |
| Sequence-based reagent | Fosl1_R | HyLabs | PCR primers | TGGCACAAGGTGGAACTTCTG |
| Sequence-based reagent | Gapdh_F | HyLabs | PCR primers | TGTGTCCGTCGTGGATCTGA |
| Sequence-based reagent | Gapdh_R | HyLabs | PCR primers | TTGCTGTTGAAGTCGCAGGAG |
| Sequence-based reagent | Hsp90aa1_F | HyLabs | PCR primers | GCGTGTTCATTCAGCCACGAT |
| Sequence-based reagent | Hsp90aa1_R | HyLabs | PCR primers | ACTGGGCAATTTCTGCCTGA |
| Sequence-based reagent | Hspd1_F | HyLabs | PCR primers | CACAGTCCTTCGCCAGATGAG |
| Sequence-based reagent | Hspd1_R | HyLabs | PCR primers | CTACACCTTGAAGCATTAAGGCT |
| Sequence-based reagent | Hspe1_F | HyLabs | PCR primers | AGTTTCTTCCGCTCTTTGACAG |
| Sequence-based reagent | Hspe1_R | HyLabs | PCR primers | TGCCACCTTTGGTTACAGTTTC |
| Sequence-based reagent | Hsph1_F | HyLabs | PCR primers | CAACAGAAAGCTCGGATGTGGATAA |
| Sequence-based reagent | Hsph1_R | HyLabs | PCR primers | CTTCTGAGGTAAGTTCAGGTGAAG |
| Sequence-based reagent | Il6_F | HyLabs | PCR primers | ATACCACTCCCAACAGACCTGTCT |
| Sequence-based reagent | Il6_R | HyLabs | PCR primers | CAGAATTGCCATTGCACAACTC |
| Sequence-based reagent | Gusb_F | HyLabs | PCR primers | GCAGCCGCTACGGGAGTC |
| Sequence-based reagent | Gusb_R | HyLabs | PCR primers | TTCATACCACACCCAGCCAAT |
| Sequence-based reagent | Odc1_F | HyLabs | PCR primers | GACGAGTTTGACTGCCACATC |
| Sequence-based reagent | Odc1_R | HyLabs | PCR primers | CGCAACATAGAACGCATCCTT |
| Sequence-based reagent | Timp1_F | HyLabs | PCR primers | GTGCACAGTGTTTCCCTGTTTA |
| Sequence-based reagent | Timp1_R | HyLabs | PCR primers | GACCTGATCCGTCCACAAAC |
| Other | DAPI stain | Molecular Probes | D3571 | 1:1000 |
| Other | DAPI stain | BioLegend | 422801 | 1:1000 |
| Software, algorithm | JMP14 and up | JMP |
Additional files
-
Supplementary file 1
Related to Figure 3.
Detailed enrichment results for all comparisons based on selection criteria.
- https://cdn.elifesciences.org/articles/60745/elife-60745-supp1-v2.xlsx
-
Supplementary file 2
Related to Figure 3.
Full Gene Set Enrichment Analysis results for all comparisons, false discovery rate < 0.05, normalized enrichment score > |2|.
- https://cdn.elifesciences.org/articles/60745/elife-60745-supp2-v2.xlsx
-
Supplementary file 3
Related to Figure 4.
List of terms containing transcription factors enriched in all comparisons.
- https://cdn.elifesciences.org/articles/60745/elife-60745-supp3-v2.xlsx
-
Supplementary file 4
Related to Figure 4.
Full results of transcription factor ranking of all comparisons.
- https://cdn.elifesciences.org/articles/60745/elife-60745-supp4-v2.xlsx
-
Transparent reporting form
- https://cdn.elifesciences.org/articles/60745/elife-60745-transrepform-v2.pdf
Download links
A two-part list of links to download the article, or parts of the article, in various formats.
Downloads (link to download the article as PDF)
Open citations (links to open the citations from this article in various online reference manager services)
Cite this article (links to download the citations from this article in formats compatible with various reference manager tools)
Evolution of fibroblasts in the lung metastatic microenvironment is driven by stage-specific transcriptional plasticity
eLife 10:e60745.
https://doi.org/10.7554/eLife.60745


