CB1R regulates soluble leptin receptor levels via CHOP, contributing to hepatic leptin resistance
- Obesity and Metabolism Laboratory, Institute for Drug Research, School of Pharmacy, Faculty of Medicine, The Hebrew University of Jerusalem, Israel
- Laboratory of Physiological Studies, National Institute on Alcohol Abuse & Alcoholism, United States
- MTA-SE Laboratory of Molecular Physiology, Department of Physiology, Semmelweis University, Hungary
- Department of Biochemistry and Molecular Biology, The Institute for Medical Research Israel-Canada, The Hebrew University of Jerusalem, Israel
- The Institute for Drug Research, School of Pharmacy, Faculty of Medicine, The Hebrew University of Jerusalem, Israel
Figures
Figure 1 with 1 supplement
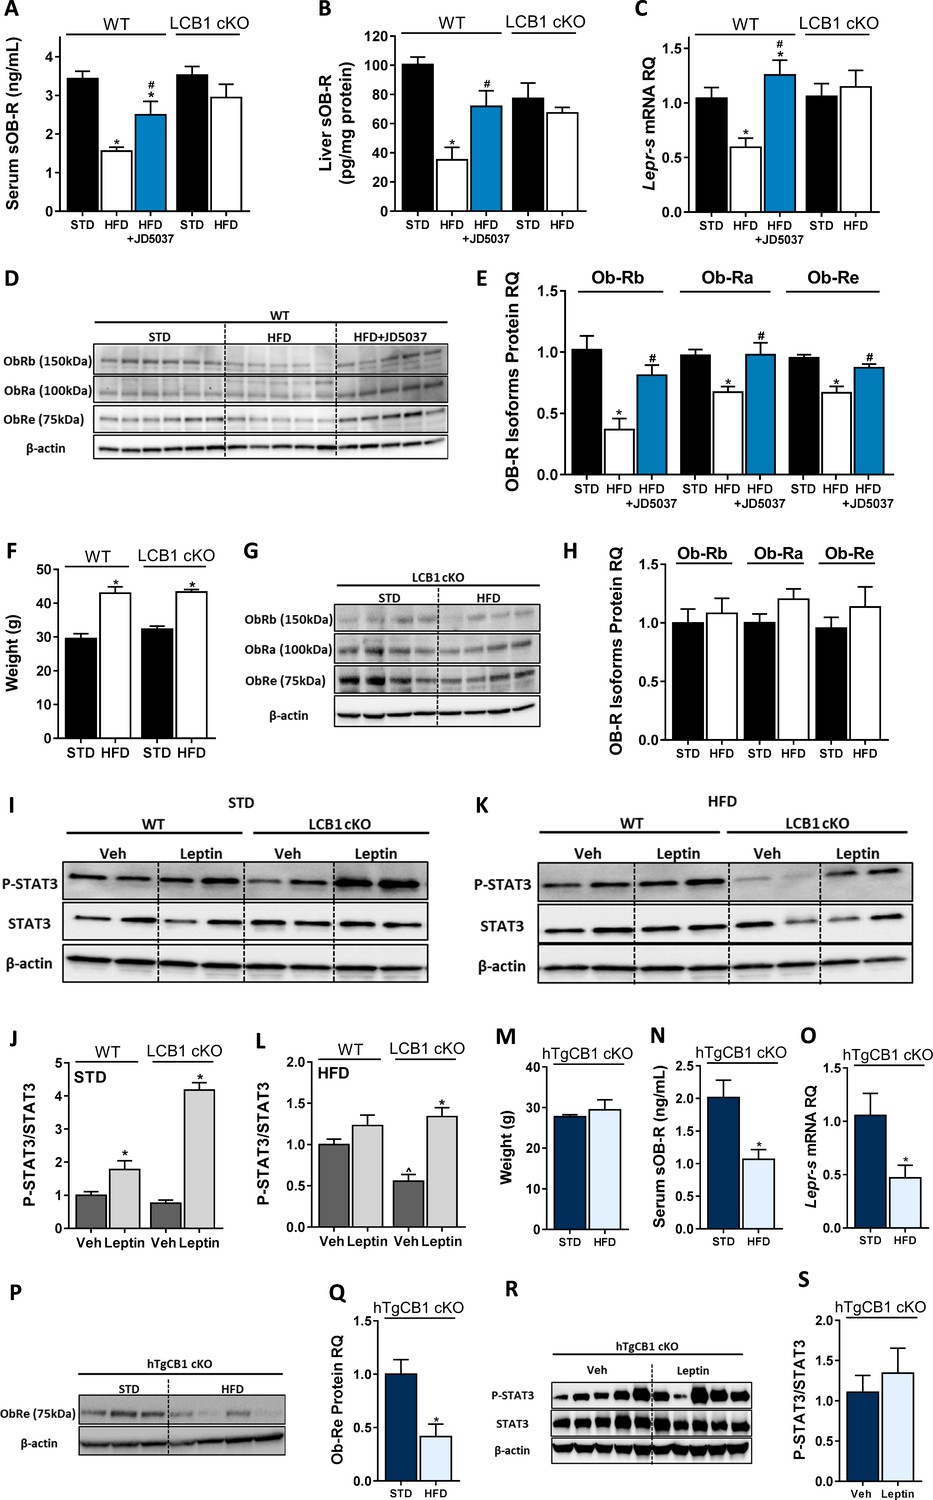
Hepatic CB1R regulates soluble isoform of leptin receptor (sOb-R) levels and leptin signaling in DIO.
Serum (A, n = 7–21) and liver (B, n = 6–9) levels of sOb-R are reduced following a 14 weeks consumption of high-fat diet (HFD) in wild-type (WT), but not LCB1 cKO mice. JD5037 (3 mg/kg, for 7 days) reverses the reduction in WT mice. The same trend observed in hepatic mRNA levels of Lepr-s (C, n = 3–12) as well as protein levels of Ob-Rb, Ob-Ra, and Ob-Re (D and E, n = 5–10; G and H, n = 8–10). Despite a comparable weight gain following HFD consumption in WT and LCB1 cKO mice (F, n = 4–20), obese mice that lack CB1R in hepatocytes remain leptin sensitive indicated by increased pSTAT3 levels (I–L, n = 3–4). Transgenic mice, expressing CB1R only in hepatocytes, are protected from DIO (M, n = 3–4). An exclusive hepatic overexpression of CB1R is sufficient for HFD feeding to induce reduction in serum, liver mRNA, and protein levels of sOb-R (N–Q, n = 4) as well as to reduce hepatic leptin sensitivity in response to exogenous leptin stimulation (R and S, n = 7). Data represent mean ± SEM of indicated number of replicates in each panel. The blots are representative. *p<0.05 relative to standard diet-fed animals from the same strain. #p<0.05 relative to HFD-fed mice from the same strain. ^p<0.05 relative to the same treatment group of WT mice.
-
Figure 1—source data 1
Raw data for Figure 1.
- https://cdn.elifesciences.org/articles/60771/elife-60771-fig1-data1-v2.xlsx
Figure 1—figure supplement 1
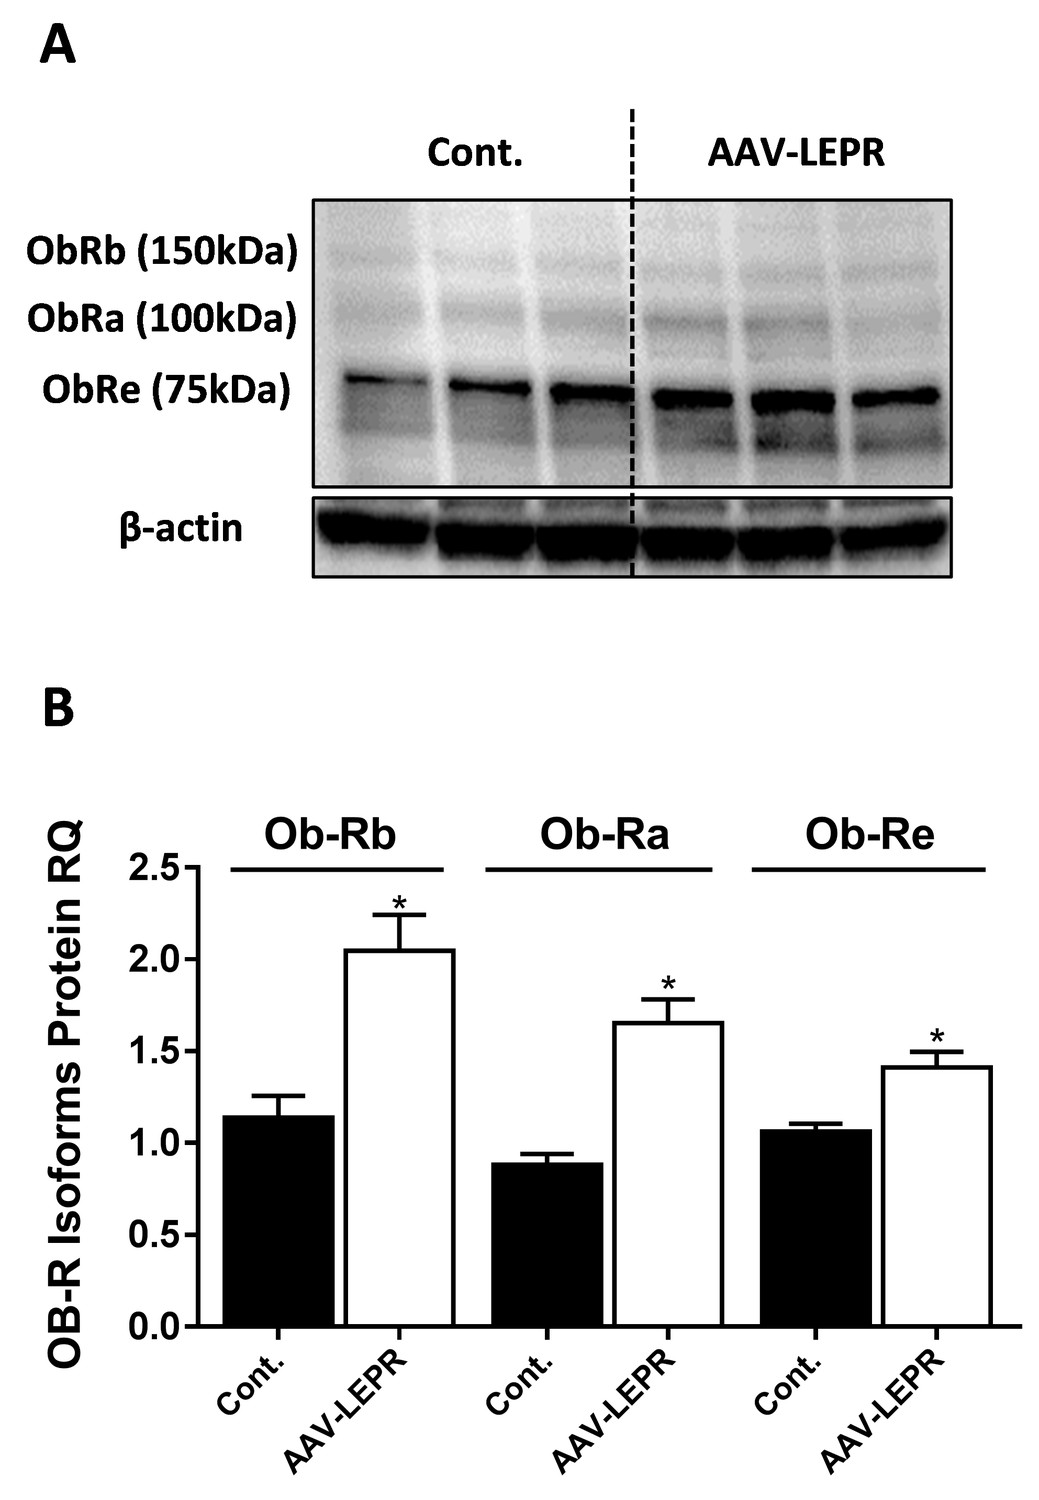
LEPR antibody detects isoforms of 75, 100, and 150 kDa.
Western blot analysis and quantification (A and B, n = 3) of LEPR expression levels in HK-2 cell line, infected with either empty vector or mouse LEPR expressing AAV. Vector also expressed eGFP and infection efficiency was approximately 30%, as assessed by fluorescent microscopy (not shown). Data represent mean ± SEM of indicated number of replicates in each panel. *p<0.05 relative to control cells.
-
Figure 1—figure supplement 1—source data 1
Raw data for Figure 1—figure supplement 1.
- https://cdn.elifesciences.org/articles/60771/elife-60771-fig1-figsupp1-data1-v2.xlsx
Figure 2 with 1 supplement
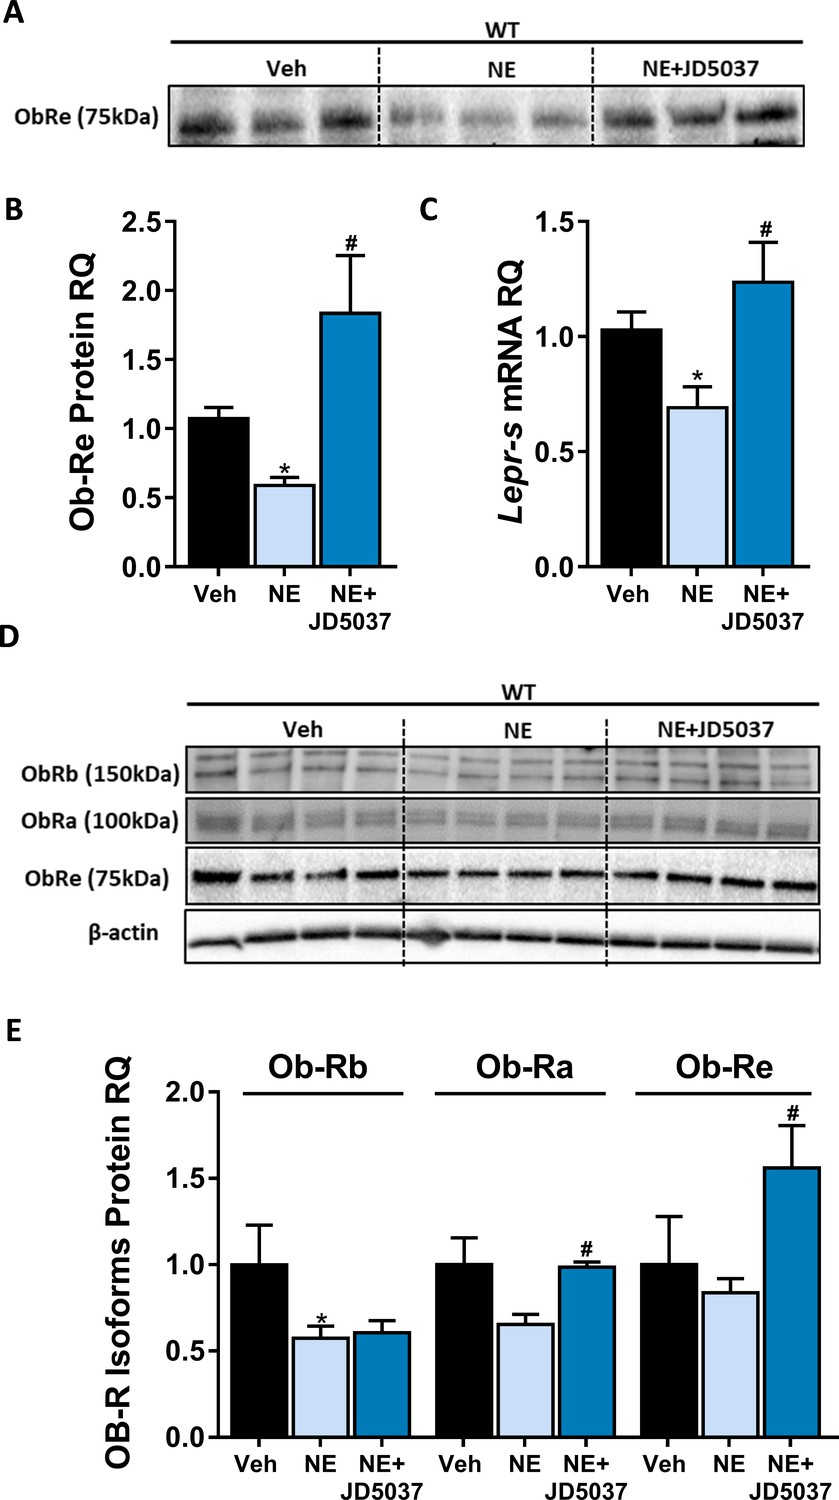
CB1R directly regulates soluble isoform of leptin receptor (sOb-R) levels in hepatocytes.
24 hr treatment with the synthetic CB1R agonist noladin ether (NE, 2.5 μM) induced reduction in sOb-R levels in the culture media of immortalized hepatocytes (blot was quantified using Ponceau staining as a loading control). This was completely ameliorated by 1 hr pretreatment with 100 nM JD5037 (A and B, n = 12–13). Similar results were observed in both mRNA (C, n = 12–17) and protein (D and E, n = 4) levels in hepatocytes lysate (for Ob-Rb, the lower band was quantified). Data represent mean ± SEM of indicated number of biological replicates. Blots are representative. *p<0.05 relative to vehicle-treated cells. #p<0.05 relative to NE-treated cells.
-
Figure 2—source data 1
Raw data for Figure 2.
- https://cdn.elifesciences.org/articles/60771/elife-60771-fig2-data1-v2.xlsx
Figure 2—figure supplement 1
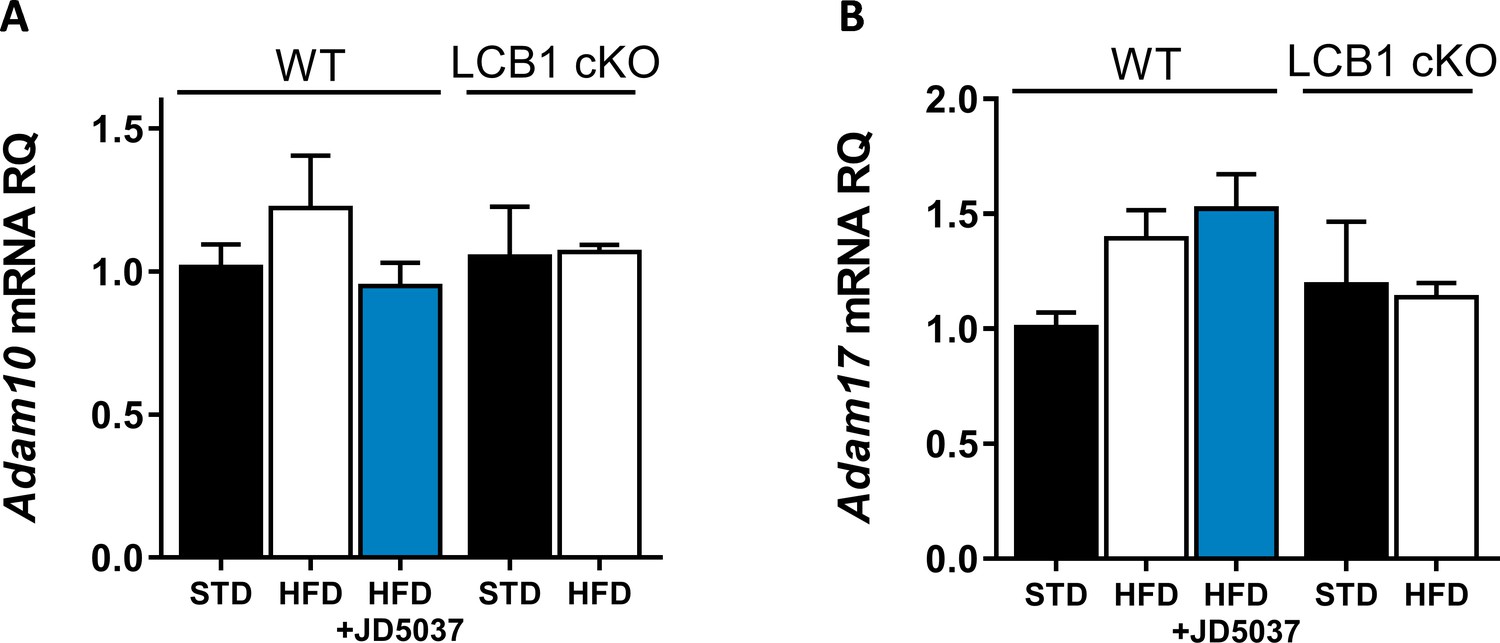
Hepatic expression of ADAM10 and ADAM17.
Hepatic mRNA expression levels of Adam10 (A) and Adam17 (B) in wild-type mice fed with standard diet (STD) or high-fat diet (HFD) for 14 weeks and treated with JD5037 (3 mg/kg, for 7 days) as well as in LCB1 cKO mice fed either STD or HFD for the same period. Data represent mean ± SEM of five to six animals per group.
-
Figure 2—figure supplement 1—source data 1
Raw data for Figure 2—figure supplement 1.
- https://cdn.elifesciences.org/articles/60771/elife-60771-fig2-figsupp1-data1-v2.xlsx
Figure 3 with 2 supplements
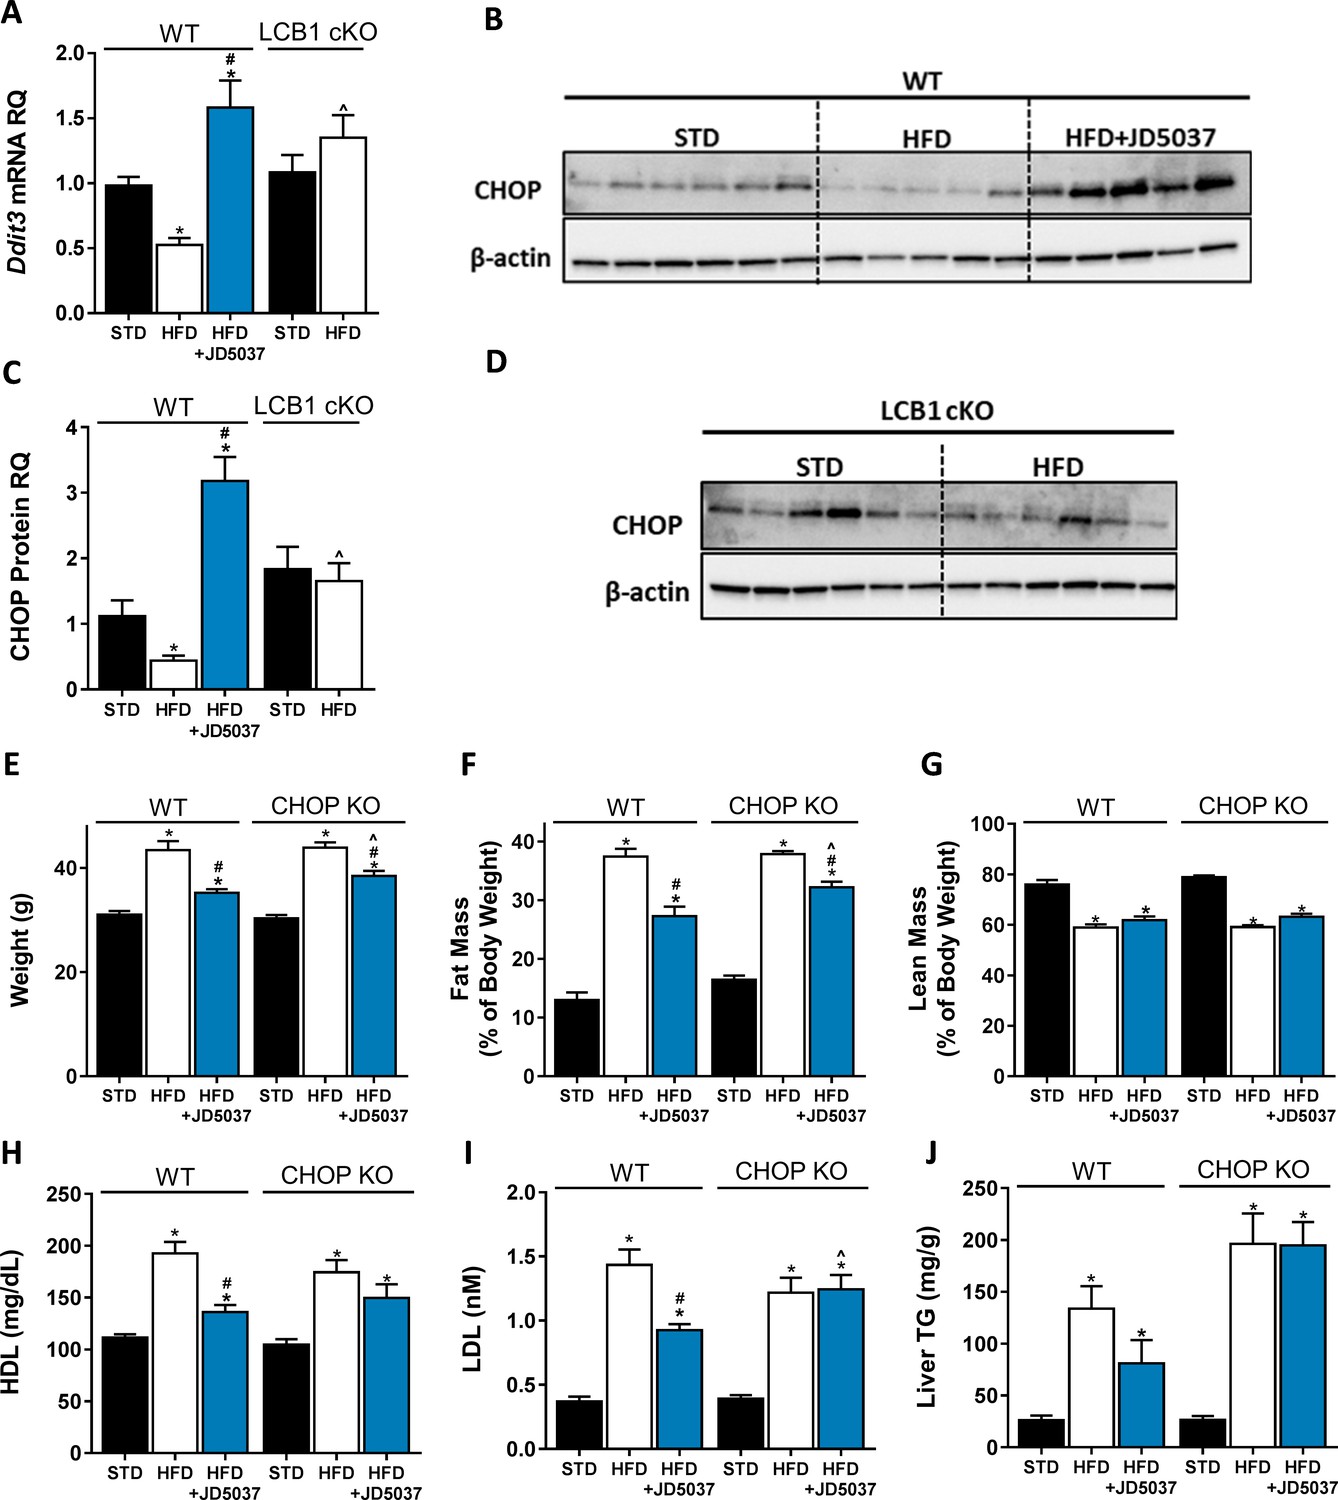
C/EBP homologous protein (CHOP) contributes to the metabolic benefits of peripheral CB1R blockade.
mRNA (A, n = 5–19) and protein (B–D, n = 4–6) levels of CHOP show reduced expression following 14 weeks on high-fat diet (HFD) in wild-type (WT), but not LCB1 cKO mice. JD5037 (3 mg/kg, for 7 days) treatment reverses the HFD-induced reduction in CHOP levels. Metabolic assessment of mice revealed diminished effect of JD5037 in CHOP KO mice. Weight (E, n = 10–23), fat and lean mass (F and G, n = 5–19), serum HDL, LDL as well as hepatic triglycerides (TG) (H–J, n = 9–26) were comparable in lean and obese WT and CHOP KO mice. JD5037 treatment was significantly more efficient in reducing weight, fat mass, LDL, and TG in WT mice. Data represent mean ± SEM of indicated number of replicates in each panel. *p<0.05 relative to standard diet-fed animals from the same strain. #p<0.05 relative to HFD-fed mice from the same strain. ^p<0.05 relative to the same treatment group of WT mice.
-
Figure 3—source data 1
Raw data for Figure 3.
- https://cdn.elifesciences.org/articles/60771/elife-60771-fig3-data1-v2.xlsx
Figure 3—figure supplement 1
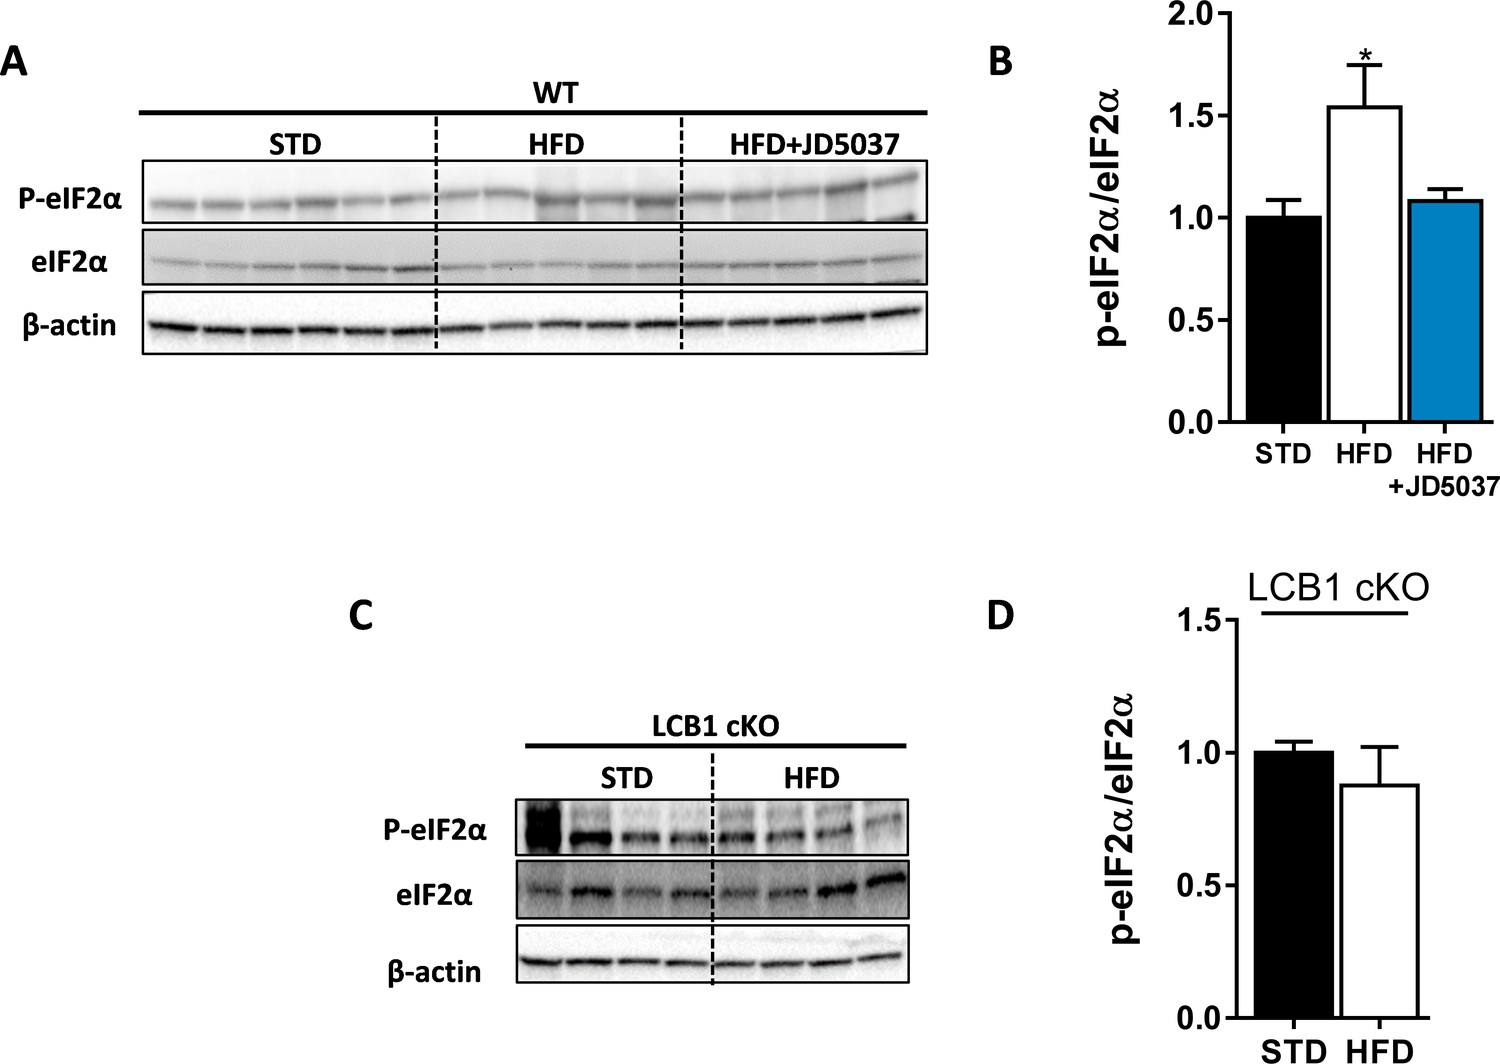
High-fat diet (HFD) induces eIF2α phosphorylation in wild-type (WT) mice.
Western blot analysis (A, C) and quantification (B, D) show increased hepatic ratio between phosphorylated and total eIF2α in WT, but not LCB1 cKO mice. Data represent mean ± SEM of five to six samples in each group. *p<0.05 relative to standard diet-fed animals from the same strain. Blots are representative.
-
Figure 3—figure supplement 1—source data 1
Raw data for Figure 3—figure supplement 1.
- https://cdn.elifesciences.org/articles/60771/elife-60771-fig3-figsupp1-data1-v2.xlsx
Figure 3—figure supplement 2
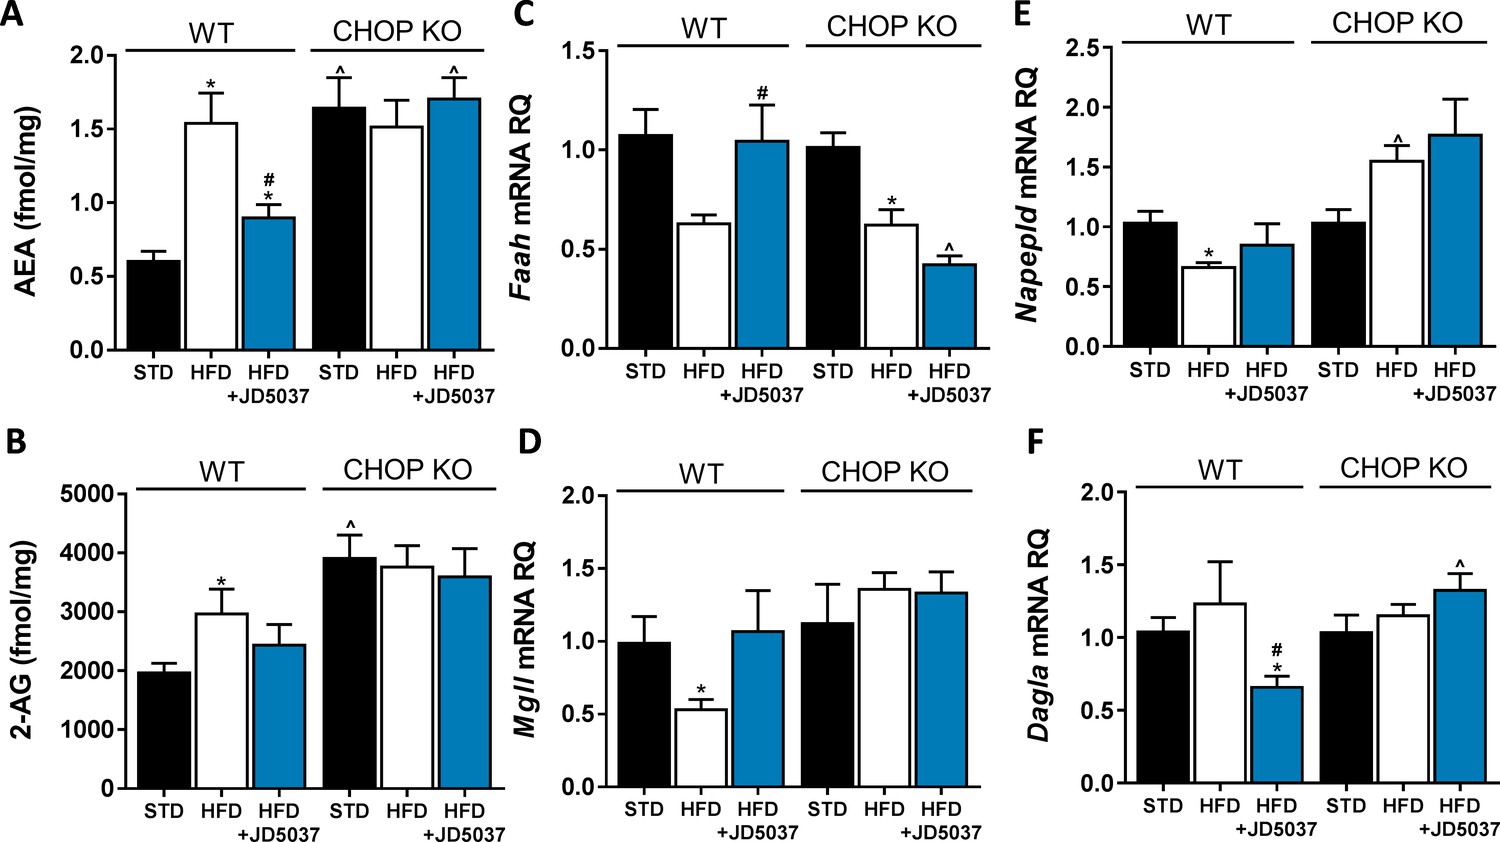
An altered endocannabinoid (eCB) 'tone' in C/EBP homologous protein (CHOP)-deficient mice.
Measurements of hepatic AEA (A, n = 6–12) and 2-AG (B, n = 6–12) levels in mice demonstrate an expected elevation of eCB levels in obese mice, and decreased levels following JD5037 treatment (3 mg/kg, for 7 days) in wild-type (WT), but not CHOP KO mice. This observation is partly explained by the changes measured in the mRNA expression levels of their synthesis and degradating enzymes (C–F, n = 6–15). Data represents mean ± SEM of indicated number of replicates in each panel. *p<0.05 relative to standard diet-fed animals from the same strain. #p<0.05 relative to HFD-fed mice from the same strain. ^p<0.05 relative to the same treatment group of WT mice.
-
Figure 3—figure supplement 2—source data 1
Raw data for Figure 3—figure supplement 2.
- https://cdn.elifesciences.org/articles/60771/elife-60771-fig3-figsupp2-data1-v2.xlsx
Figure 4
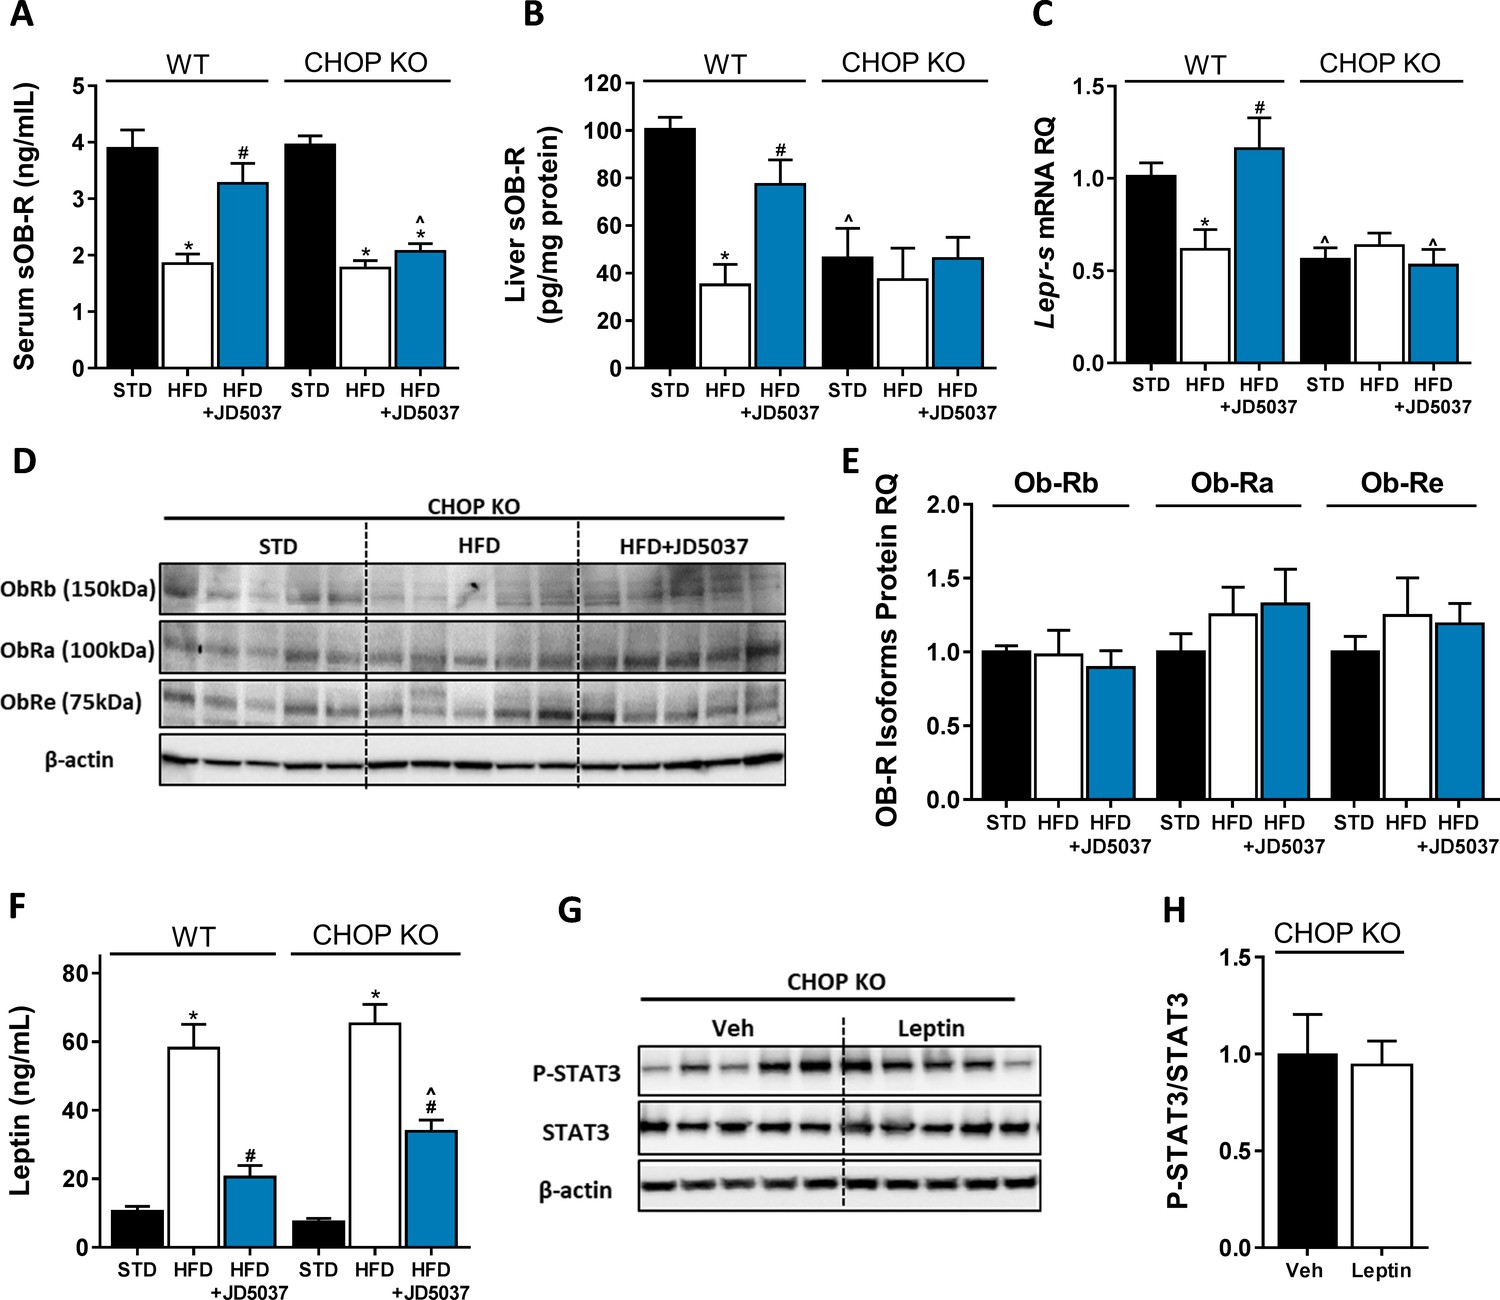
C/EBP homologous protein (CHOP) plays a key role in regulating soluble isoform of leptin receptor (sOb-R) by the endocannabinoid (eCB)/CB1R system.
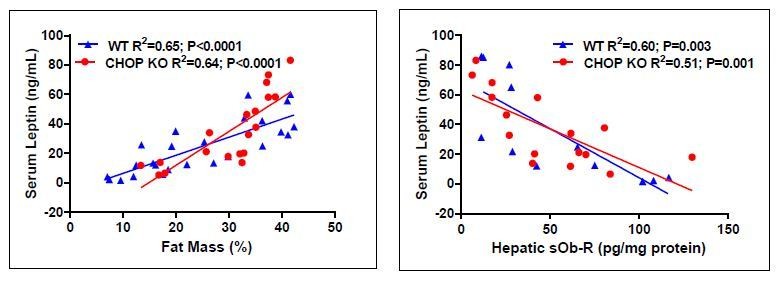
Serum (A, n = 11–18) levels of sOb-R were reduced following a 14 weeks consumption of high-fat diet (HFD). JD5037 (3 mg/kg, for 7 days) reversed the reduction in wild-type (WT), but not CHOP KO mice. Basal hepatic levels of sOb-R were lower in CHOP KO mice and did not change following HFD or JD5037 treatment (B, n = 5–8). A similar trend was observed in hepatic mRNA levels (C, n = 9–17) and protein level of Ob-Rb, Ob-Ra, and Ob-Re (D and E, n = 5–6). Whereas DIO-related hyperleptinemia was comparable between WT and CHOP KO mice, JD5037 was more efficacious in reducing it in WT mice (F, n = 8–16). Lean CHOP KO mice failed to increase the hepatic pSTAT3/STAT3 ratio in response to exogenous leptin administration (G and H, n = 5). Western blots are representative. Data represent mean ± SEM of indicated number of replicates in each panel. *p<0.05 relative to standard diet-fed animals from the same strain. #p<0.05 relative to HFD-fed mice from the same strain. ^p<0.05 relative to the same treatment group of WT mice.
-
Figure 4—source data 1
Raw data for Figure 4.
- https://cdn.elifesciences.org/articles/60771/elife-60771-fig4-data1-v2.xlsx
Figure 5
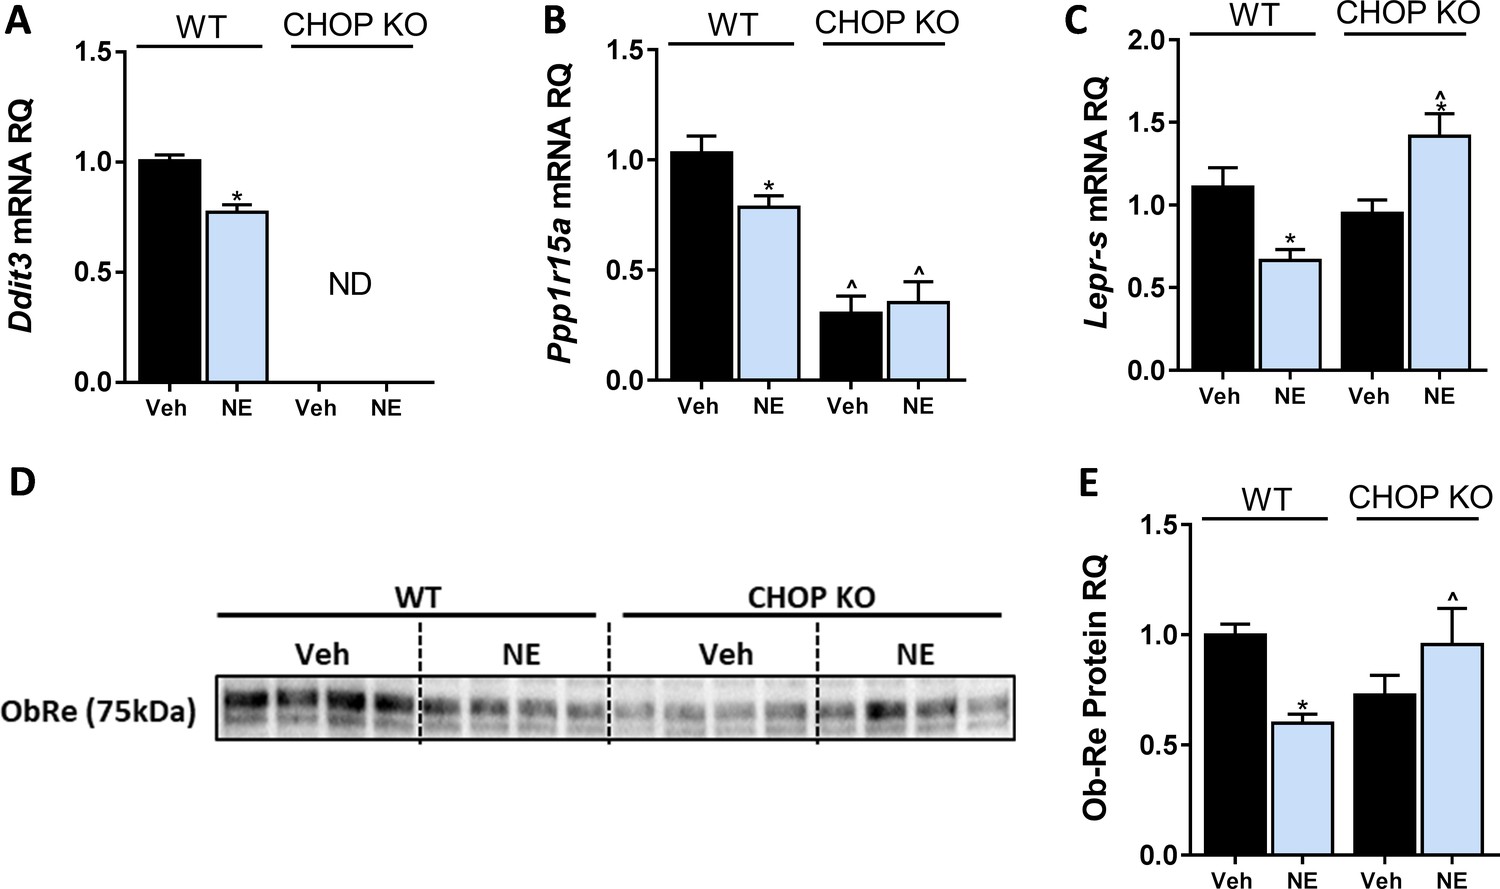
C/EBP homologous protein (CHOP) regulates LEPR expression in hepatocytes.
In vitro, 24 hr treatment with noladin ether (NE; 2.5 μM) induced reduction in mRNA levels of Ddit3. (ND – not detected) (A), Ppp1r15a (B), and Lepr-s (C) in wild-type (WT), but not CHOP KO hepatocytes. A similar trend was observed in soluble isoform of leptin receptor protein levels secreted into the culture media of hepatocytes (blot was quantified using Ponceau staining as a loading control) (D and E). Data represent mean ± SEM of 8–20 biological replicates. Blots are representative. *p<0.05 relative to vehicle-treated cells in the same genotype. ^p<0.05 relative to same treatment paradigm in WT.
-
Figure 5—source data 1
Raw data for Figure 5.
- https://cdn.elifesciences.org/articles/60771/elife-60771-fig5-data1-v2.xlsx
Figure 6 with 2 supplements

C/EBP homologous protein (CHOP) is a positive regulator of Lepr Promoter.
Induction of CHOP mRNA (A, n = 14) and protein (B, n = 3) expression using a 6 hr treatment with tunicamycin (TM; 2.5 µG/mL) was accompanied by elevated soluble isoform of leptin receptor (sOb-R) levels in the culture media (blot was quantified using Ponceau staining as a loading control) (C and D, n = 3) as well as mRNA levels (E, n = 8–21) of wild-type (WT) hepatocytes. A transient CHOP overexpression induced elevation in sOb-R levels in the culture media of WT hepatocytes (F and G, n = 3). Luciferase reporter assay (H, n = 14–16) and chromatin immunoprecipitation (ChIP) (I, n = 2–7) show increased Lepr promoter activity and CHOP binding to this promoter in WT hepatocytes treated with TM. Data represent mean ± SEM of indicated number of biological replicates. Blots are representative. *p<0.05 relative to vehicle-treated cells. ^p<0.05 relative to the same treatment group of WT hepatocytes.
-
Figure 6—source data 1
Raw data for Figure 6.
- https://cdn.elifesciences.org/articles/60771/elife-60771-fig6-data1-v2.xlsx
Figure 6—figure supplement 1
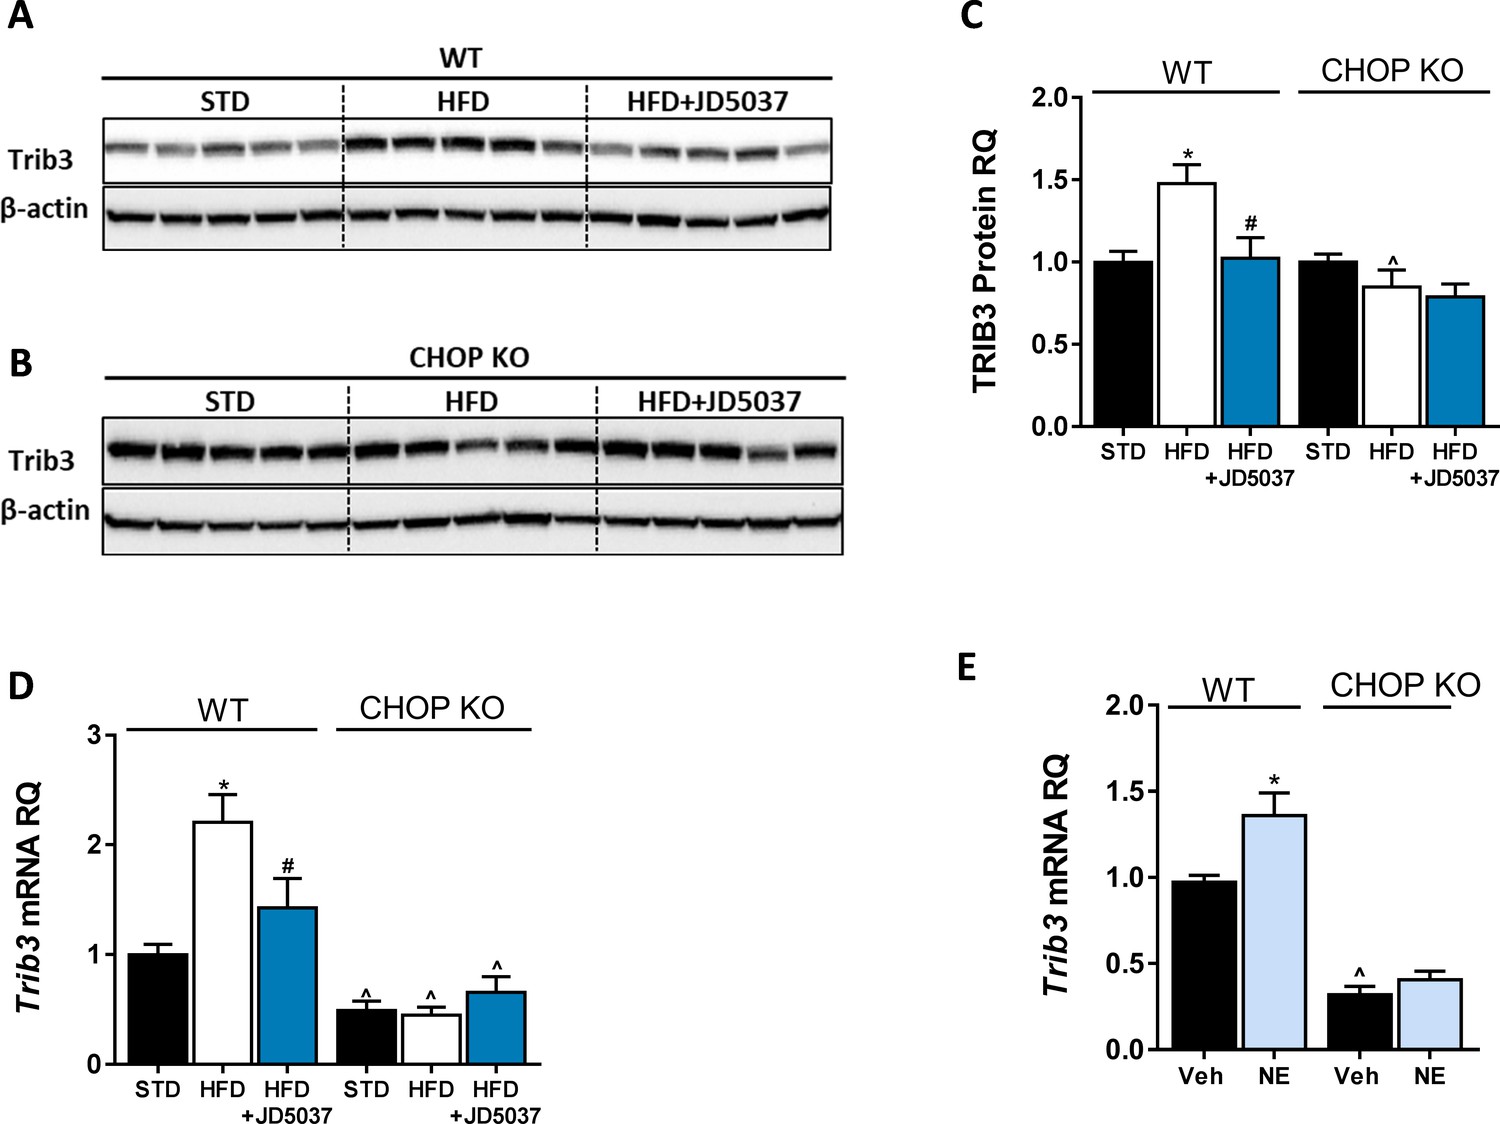
Trib3 as a possible link between CB1R and C/EBP homologous protein (CHOP).
Western blot analysis and quantification (A–C, n = 5) and mRNA of hepatic Trib3 expression levels (D, n = 5) in wild-type (WT) and CHOP KO mice show increased expression in obese WT, but not LCB1 cKO mice. A direct activation of CB1R by using noladin ether (NE) upregulated the mRNA expression of Trib3 in WT, but not in CHOP KO hepatocytes. In vivo: Data represent mean ± SEM of indicated number of replicates in each panel. Western blots are representative. *p<0.05 relative to standard diet-fed animals from the same strain. #p<0.05 relative to high-fat diet-fed mice from the same strain. ^p<0.05 relative to the same treatment group of WT mice. In vitro: Data represent mean ± SEM of 12–15 replicates from at least three independent experiments. *p<0.05 relative to vehicle-treated cells in the same genotype. ^p<0.05 relative to same treatment paradigm in WT.
-
Figure 6—figure supplement 1—source data 1
- https://cdn.elifesciences.org/articles/60771/elife-60771-fig6-figsupp1-data1-v2.xlsx
Figure 6—figure supplement 2
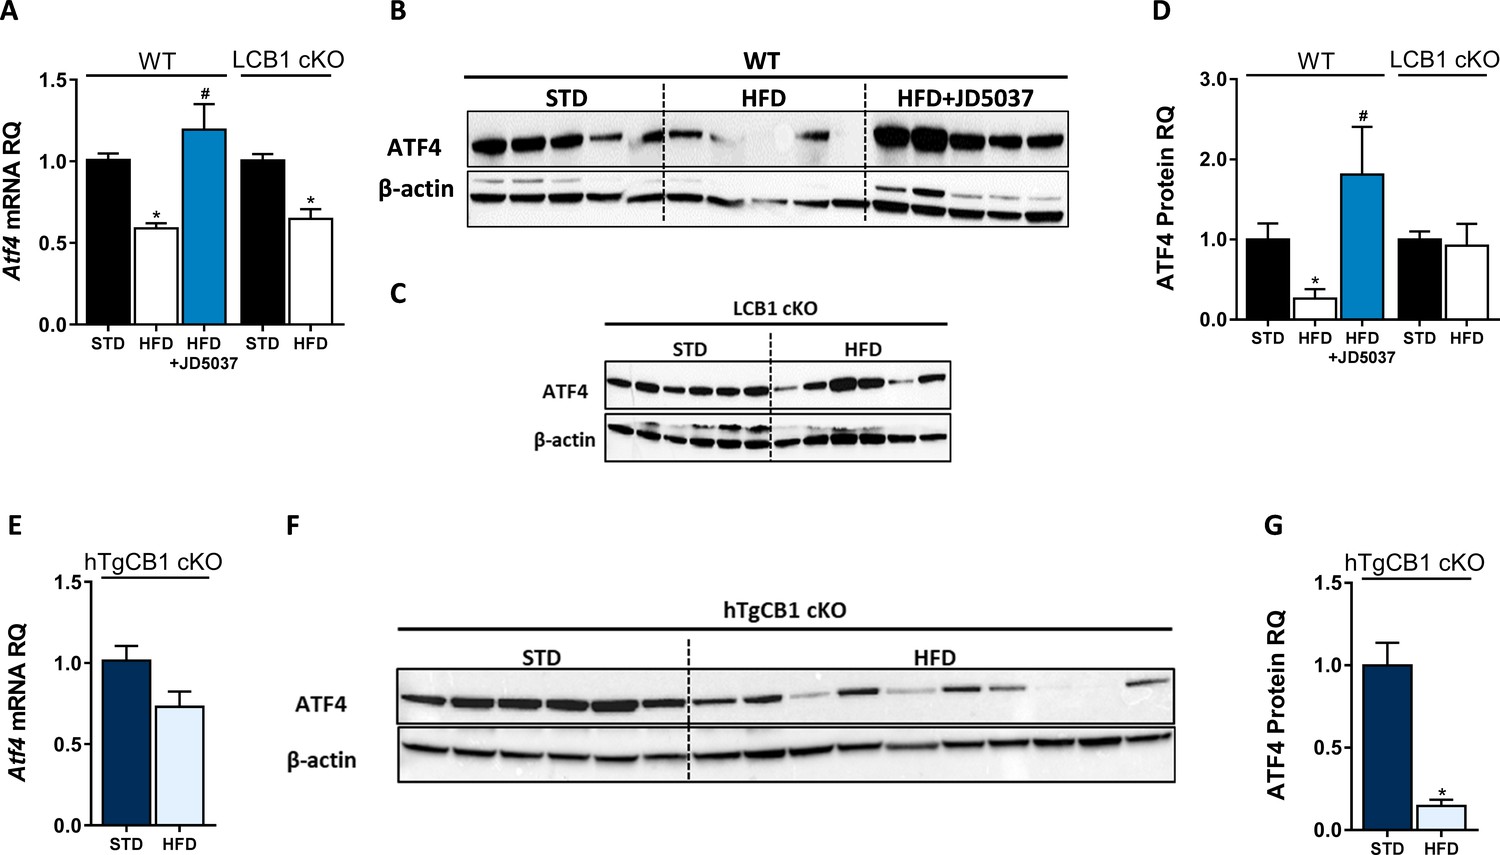
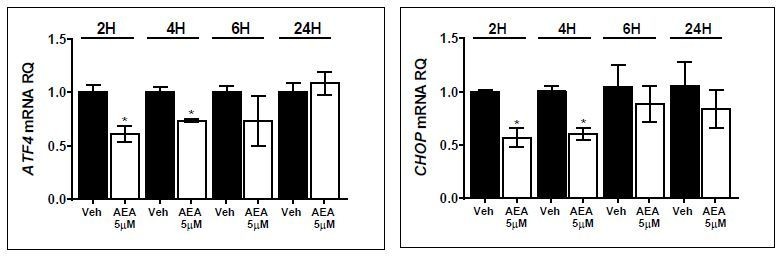
Hepatic ATF4 protein expression is regulated by CB1R and is correlated with C/EBP homologous protein levels.
Hepatic mRNA levels (A) of Atf4 are similarly reduced in wild-type (WT) and LCB1 cKO obese mice. However, western blot analysis and quantification (B–D, n = 5–6) revealed that the ATF4 protein levels in the WT mice are reduced on a high-fat diet (HFD), and reversed by JD5037, whereas they remain unchanged in obese LCB1 cKO mice. Like in WT mice, transgenic mice with CB1R overexpression in the liver (hTgCB1 cKO) have lower levels of hepatic Atf4 mRNA (E) and ATF4 protein (F and G, n = 6–10) levels when fed with a HFD. Data represent the mean ± SEM of the indicated number of replicates in each panel. *p<0.05 relative to standard diet-fed animals from the same strain. #p<0.05 relative to the HFD-fed mice from the same strain.
-
Figure 6—figure supplement 2—source data 1
Raw data for Figure 6-Figure Supplement 2.
- https://cdn.elifesciences.org/articles/60771/elife-60771-fig6-figsupp2-data1-v2.xlsx
Figure 7
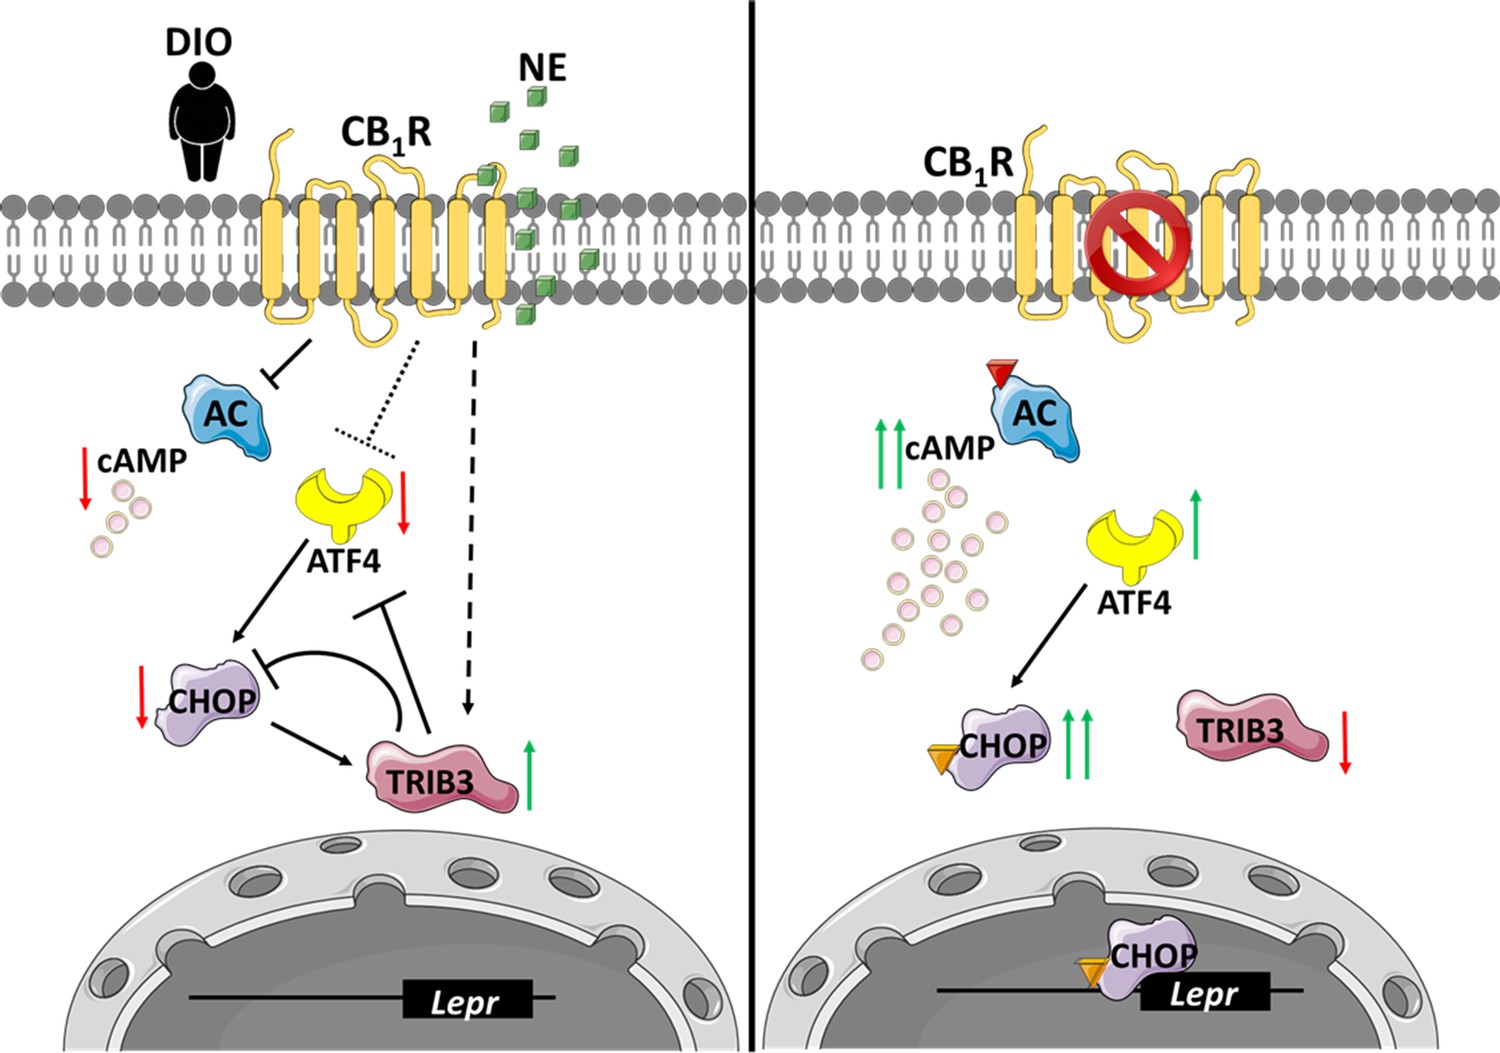
An illustration that describes the suggested molecular mechanism involving CB1R and C/EBP homologous protein (CHOP) in the regulation of soluble isoform of leptin receptor (sOb-R) levels.
(Left) When overexpressed in the liver, activated by endocannabinoids during diet-induced obesity (DIO) or synthetic cannabinoids, such as noladin ether (NE, green squares), CB1R attenuates cAMP (pink circles) production by inhibiting adenylate cyclase (AC). CB1R also represses the expression of ATF4, as well as upregulates Trib3 expression. As a consequence, CHOP levels are reduced, transcribing less Lepr. (Right) Blocking CB1R in hepatocytes reverses these changes, leading to the activation and translocation of CHOP to the nucleus, which, in turn, directly binds the Lepr promoter and promotes the expression of sOb-R. Red arrows represent downregulation, whereas green arrows represent upregulation. Colored triangles represent activation.
Author response image 1
Author response image 2
Tables
Key resources table
| Reagent type (species) or resource | Designation | Source or reference | Identifiers | Additional information |
|---|---|---|---|---|
| Gene (Mus musculus) | Lepr | e!Ensembl | ENSMUSG00000057722 | Leptin receptor |
| Strain, strain background (Mus musculus) | Wild type | Envigo Israel | C57Bl/6N | |
| Strain, strain background (Mus musculus) | LCB1 cKO | Osei-Hyiaman et al., 2008 | Liver-specific CB1R KO | |
| Strain, strain background (Mus musculus) | hTgCB1 cKO | Tam et al., 2010 | CB1R KO, overexpressing CB1R in hepatocytes | |
| Strain, strain background (Mus musculus) | CHOP KO | The Jackson Laboratory | B6.129S(Cg)-Ddit3tm2.1Dron/J, #005530 RRID:IMSR_JAX:005530 | |
| Transfected construct (Mus musculus) | mCHOP-9E10 | Addgene | CHOP6: mCHOP-WT-9E10-pCDNA, #21913 RRID:Addgene_21913 | |
| Transfected construct (Firefly,sv40) | pGL3 | Promega | pGL3-basic vector, E1751 | Luciferase Assay vector |
| Transfected construct (Mus musculus) | Ad-GFP-mLEPR | VECTOR BIOSYSTEMS Inc | ADV-263380 | |
| Cell line (Mus musculus) | Wild type | Uzi et al., 2013 | Immortalized mouse hepatocytes | |
| Cell line (Mus musculus) | CHOP KO | Uzi et al., 2013 | Immortalized mouse hepatocytes | |
| Antibody | LEPR (rabbit polyclonal) | Novus | NB-120–5593 RRID:AB_791038 | WB (1:2000) |
| Antibody | pSTAT3 (rabbit monoclonal) | Cell signaling | #9145 RRID:AB_2491009 | Phosphorylated Stat3 (Tyr705), WB (1:1000) |
| Antibody | STAT3 (mouse monoclonal) | Cell signaling | #9139 RRID:AB_331757 | WB (1:3000) |
| Antibody | p-eIF2α (rabbit polyclonal) | Cell signaling | #9721 RRID:AB_330951 | Phosphorylated eIF2α (Ser51), WB (1:1000) |
| Antibody | t-eIF2α (rabbit polyclonal) | Cell signaling | #9722 RRID:AB_2230924 | Total eIF2α WB (1:1000) |
| Antibody | ATF4 (rabbit monoclonal) | Cell signaling | #11815 RRID:AB_2616025 | WB (1:1000) |
| Antibody | CHOP (mouse monoclonal) | Cell signaling | #2895S RRID:AB_2089254 | WB (1:1000) ChIP (2.5 µg/sample) |
| Antibody | Trib3 (rabbit polyclonal) | Abcam | ab137526 RRID:AB_2876352 | WB (1:2000) |
| Antibody | β-Actin (mouse monoclonal) | Abcam | ab49900 RRID:AB_867494 | WB (1:30,000) |
| Antibody | H3 (rabbit polyclonal) | Abcam | ab1791 RRID:AB_302613 | ChIP (2.5 µg/sample) |
| Antibody | Anti-rabbit HRP (donkey polyclonal) | Abcam | ab97085 RRID:AB_10679957 | WB (1:10,000) |
| Antibody | Anti-mouse HRP (donkey polyclonal) | Abcam | ab98799 RRID:AB_10675068 | WB (1:10,000) |
| Commercial assay or kit | SLR ELISA | Shanghai Bluegene Biotech | E03S0226 | |
| Commercial assay or kit | Triglyceride Assay Kit | Abcam | ab65336 | |
| Commercial assay or kit | Dual-Glo Luciferase Assay System | Promega | E2920 | |
| Chemical compound, drug | JD5037 | Haoyuan Chemexpress Co., Ltd | HY-18697 | |
| Chemical compound, drug | NE | Cayman Chemicals | 62165 | 2-Arachidonyl glycerol ether |
| Chemical compound, drug | Tunicamycin (TM) | Holland Moran | 11089-65-9 | |
| Software, algorithm | GraphPad Prism | GraphPad Software | RRID:SCR_002798 |
Additional files
-
Supplementary file 1
Supplementary Tables 1 and 2.
- https://cdn.elifesciences.org/articles/60771/elife-60771-supp1-v2.docx
-
Transparent reporting form
- https://cdn.elifesciences.org/articles/60771/elife-60771-transrepform-v2.pdf
Download links
A two-part list of links to download the article, or parts of the article, in various formats.
Downloads (link to download the article as PDF)
Open citations (links to open the citations from this article in various online reference manager services)
Cite this article (links to download the citations from this article in formats compatible with various reference manager tools)
CB1R regulates soluble leptin receptor levels via CHOP, contributing to hepatic leptin resistance
eLife 9:e60771.
https://doi.org/10.7554/eLife.60771


