Neural effects of propofol-induced unconsciousness and its reversal using thalamic stimulation
- The Picower Institute for Learning and Memory and Department of Brain and Cognitive Sciences, Massachusetts Institute of Technology, United States
- The Department of Anesthesia, Critical Care and Pain Medicine, Massachusetts General Hospital/Harvard Medical School, United States
- The Institute for Medical Engineering and Science, Massachusetts Institute of Technology, United States
Figures
Figure 1
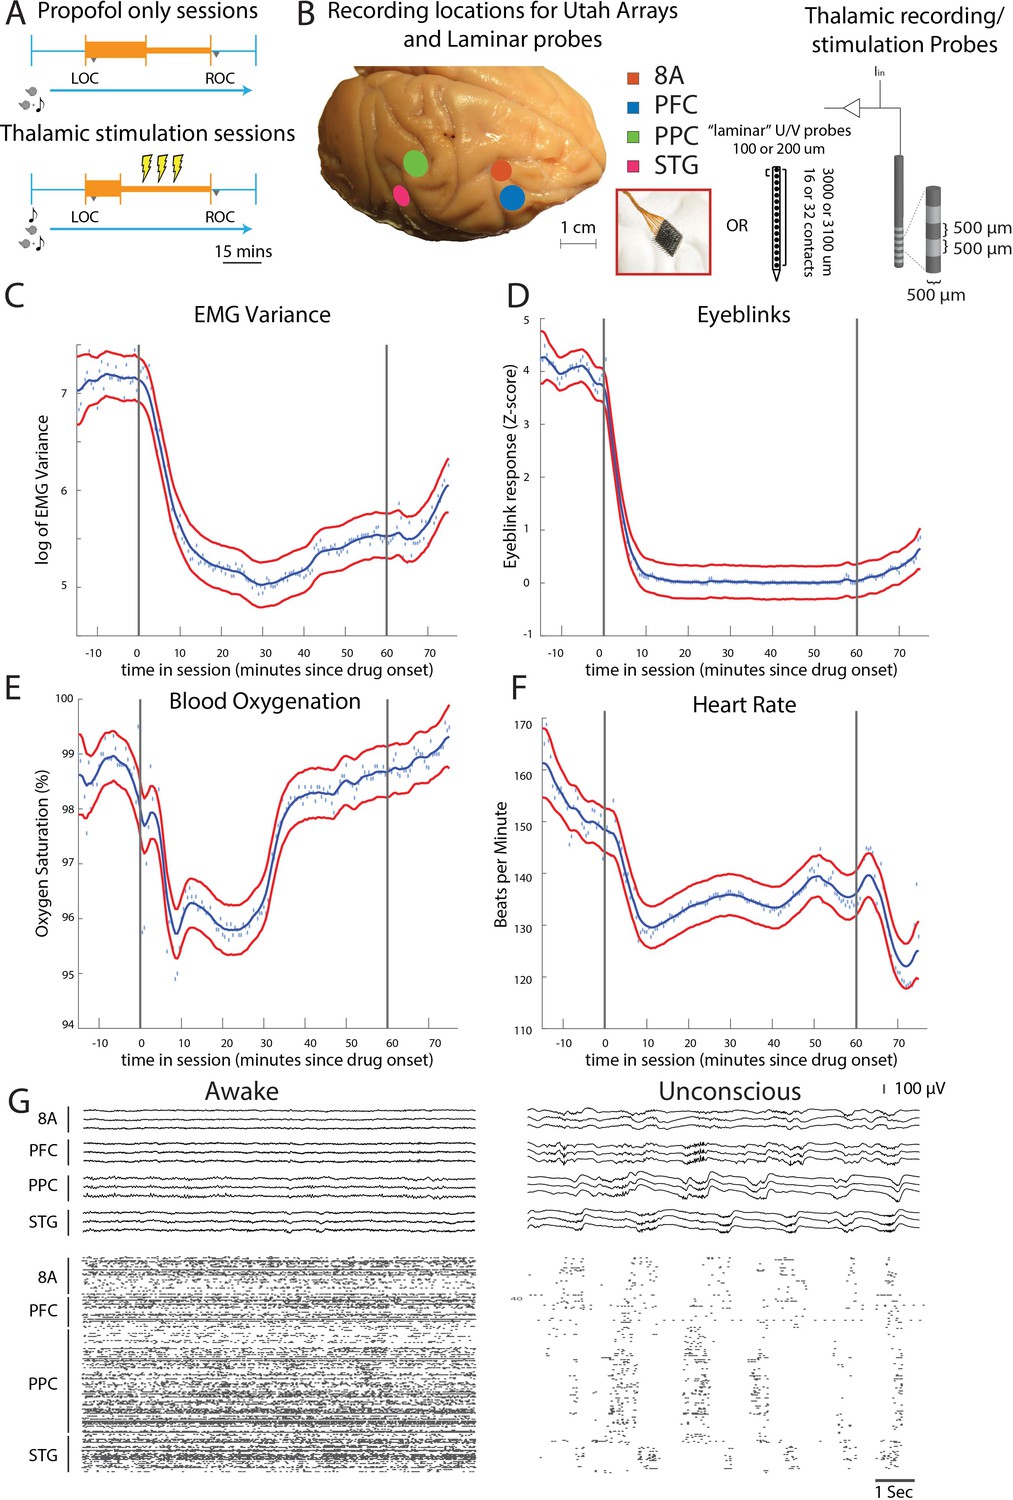
Propofol anesthesia paradigm and physiological indices of LOC.
(A) Session paradigm. Two sets of sessions were performed. For propofol-only sessions (upper subplot), there was an initial 30 min infusion (fast rate, thick orange bar) covering Awake (pre-LOC) and Unconscious states, before switching to a halved rate propofol infusion for the maintenance phase of experiment (narrow orange bar). For the thalamic stimulation sessions (N = 22), the initial infusion was for 20 min, followed by a halved rate propofol infusion for the rest of the session. Periodically, 28.5 s trials with electrical stimulation in the thalamus (yellow bolts) occur during lower-dosed maintenance phase of propofol infusion. LOC: loss of consciousness, ROC: recovery of consciousness. (B) (left) Cortical recording locations of each 64-channel chronic recording arrays or 16/32 channel acutely inserted laminar probe. PFC: ventrolateral prefrontal cortex; 8A: caudal lateral PFC; PPC: posterior parietal cortex area 7A/7B; STG: superior temporal gyrus; (right) ‘Laminar’ probes and thalamic electrical stimulation/LFP (Local Field Potential) recording leads. (C-F) Physiological measurements characterizing the Awake state relative to propofol administration (starting at time zero). Blue dots indicate individual time points with measurements averaged across sessions. Blue curve is a smoothed estimate and the red curves are the approximate 95% confidence intervals (see 'Methods'). (G) (upper panel) Example LFP traces from all cortical Utah arrays during the Awake (left) and Unconscious states with clear slow-frequency waves (right). (lower panel) Example spike raster over 10 s of data. Spike times are indicated with dots.
Figure 2 with 2 supplements

Changes in cortical power during the Unconscious state.
(A-D) dB change in power for each area is shown with respect to Awake. Increases in power are shown in red, decreases in blue. Significant modulation of power is shown in opaque colors and outlined in black (p<0.01, non-parametric cluster-based randomizations, corrected for multiple comparisons). Left subpanels are time locked to loss of consciousness (LOC), defined behaviorally as the moment the eyes closed and remained closed. Start of drug infusion is shown as a vertical black bar at −10 min from LOC, ± 1 SEM over sessions. Right subpanels are time locked to return of consciousness (ROC), defined behaviorally as the moment the eyes first opened. Cessation of drug infusion is shown as a vertical black bar at −8 min from ROC, ± SEM over sessions.
Figure 2—figure supplement 1
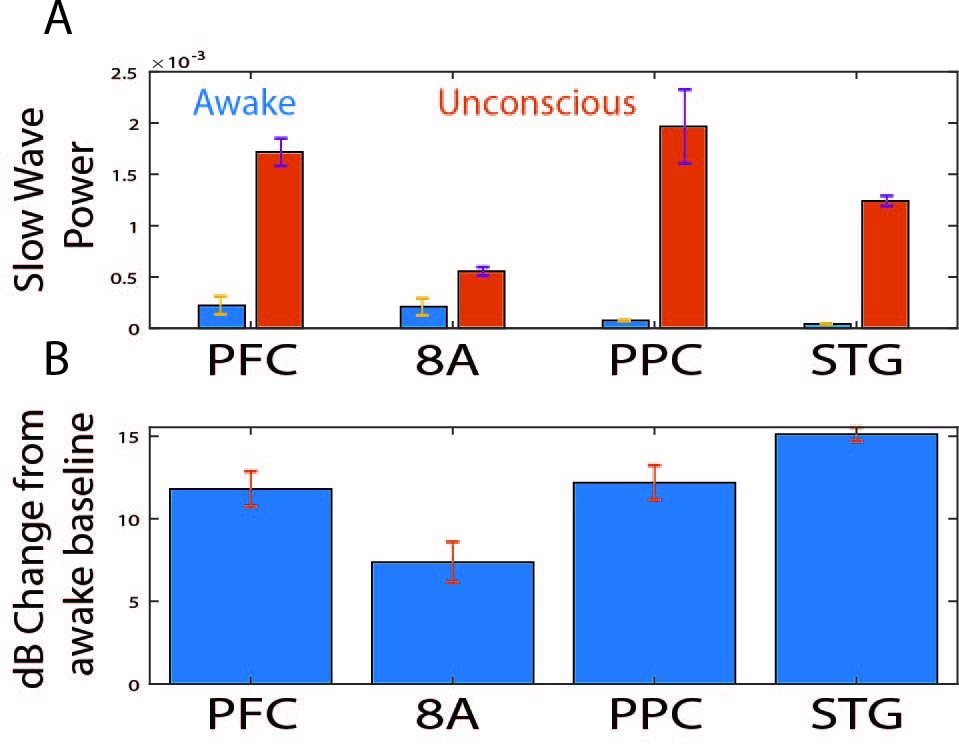
Effect sizes for change in slow frequency power during the Unconscious state.
(A) Slow frequency (SF, 0.1–2 Hz) power during the awake (blue bars) vs. unconscious (orange bars) states. Mean ± 1 SEM across sessions. (B) The dB change in SF power, averaged across all sessions. Mean ± SEM across sessions. PFC: ventrolateral prefrontal cortex; 8A: caudal lateral PFC; PPC: posterior parietal cortex area 7A/7B; STG: superior temporal gyrus.
Figure 2—figure supplement 2
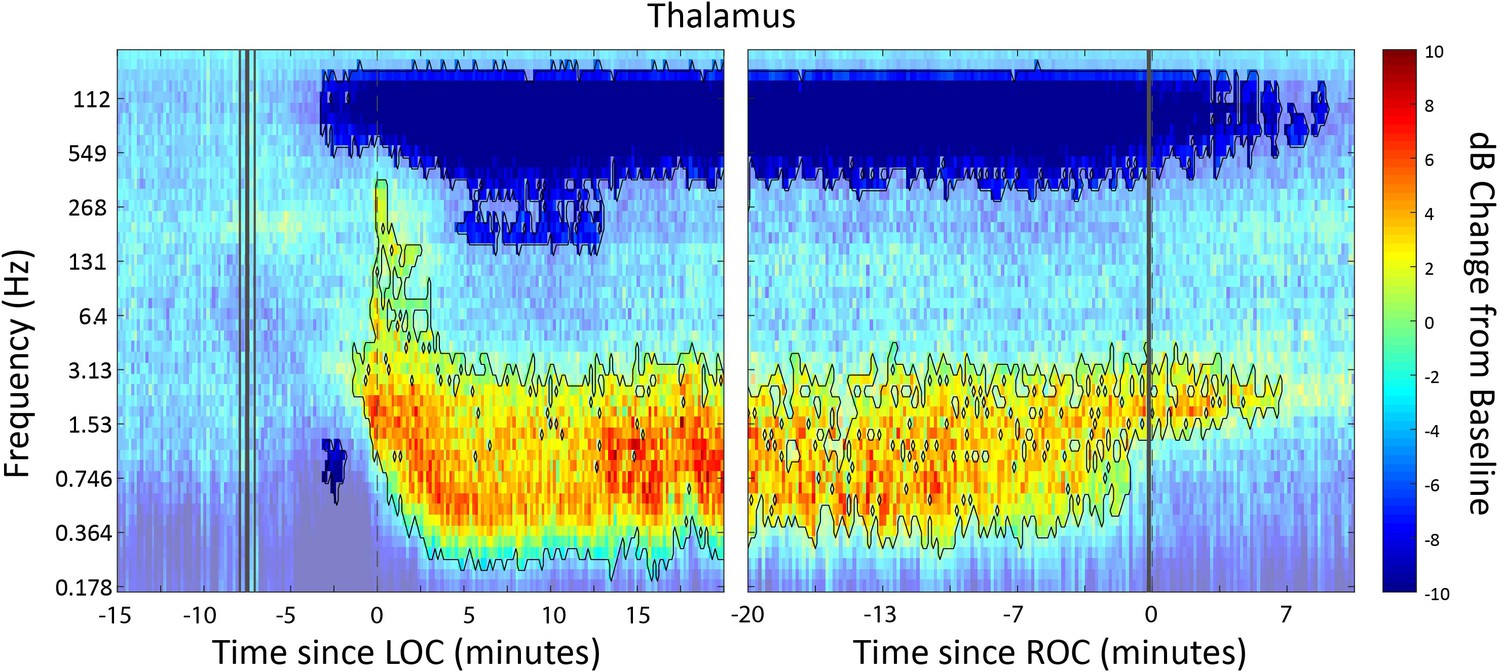
Changes in thalamic power during the Unconscious state dB change in power for thalamic sites is shown with respect to the Awake state.
Increases in power during unconsciousness are shown in red, decreases in blue. Significant modulation of power is shown in opaque colors and outlined in black (p<0.01, non-parametric cluster-based randomizations, corrected for multiple comparisons). Left subpanel is time locked from loss of consciousness (LOC). Onset of drug infusion is shown as a vertical black bar at ~8 min prior to LOC, ±1 SEM across sessions. Right subpanel is time locked from return of consciousness (ROC).
Figure 3
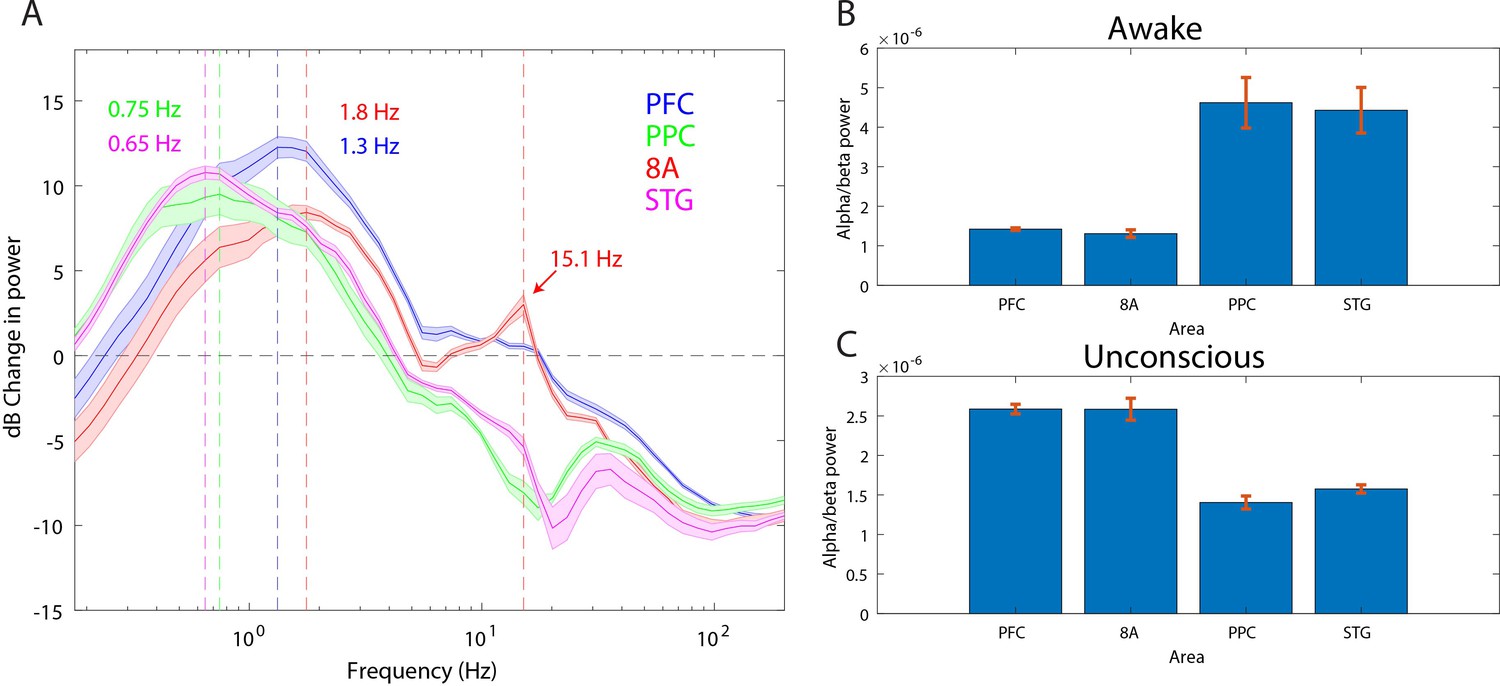
Power asymmetries between areas.
(A) dB change in power of Unconscious vs. Awake. Positive values indicate power Unconscious > Awake. For each area, the mean power difference is shown 1 SEM. Peak power modulation in the slow frequency range is highlighted for each area, and a secondary peak in the beta range (15.1 Hz) is present in area 8A. (B) Power in the beta frequency range (8–25 Hz) during the Awake state. (C) Same as B, but during the Unconscious state. Mean ±/- 1 SEM. PFC: ventrolateral prefrontal cortex; 8A: caudal lateral PFC; PPC: posterior parietal cortex area 7A/7B; STG: superior temporal gyrus.
Figure 4 with 1 supplement
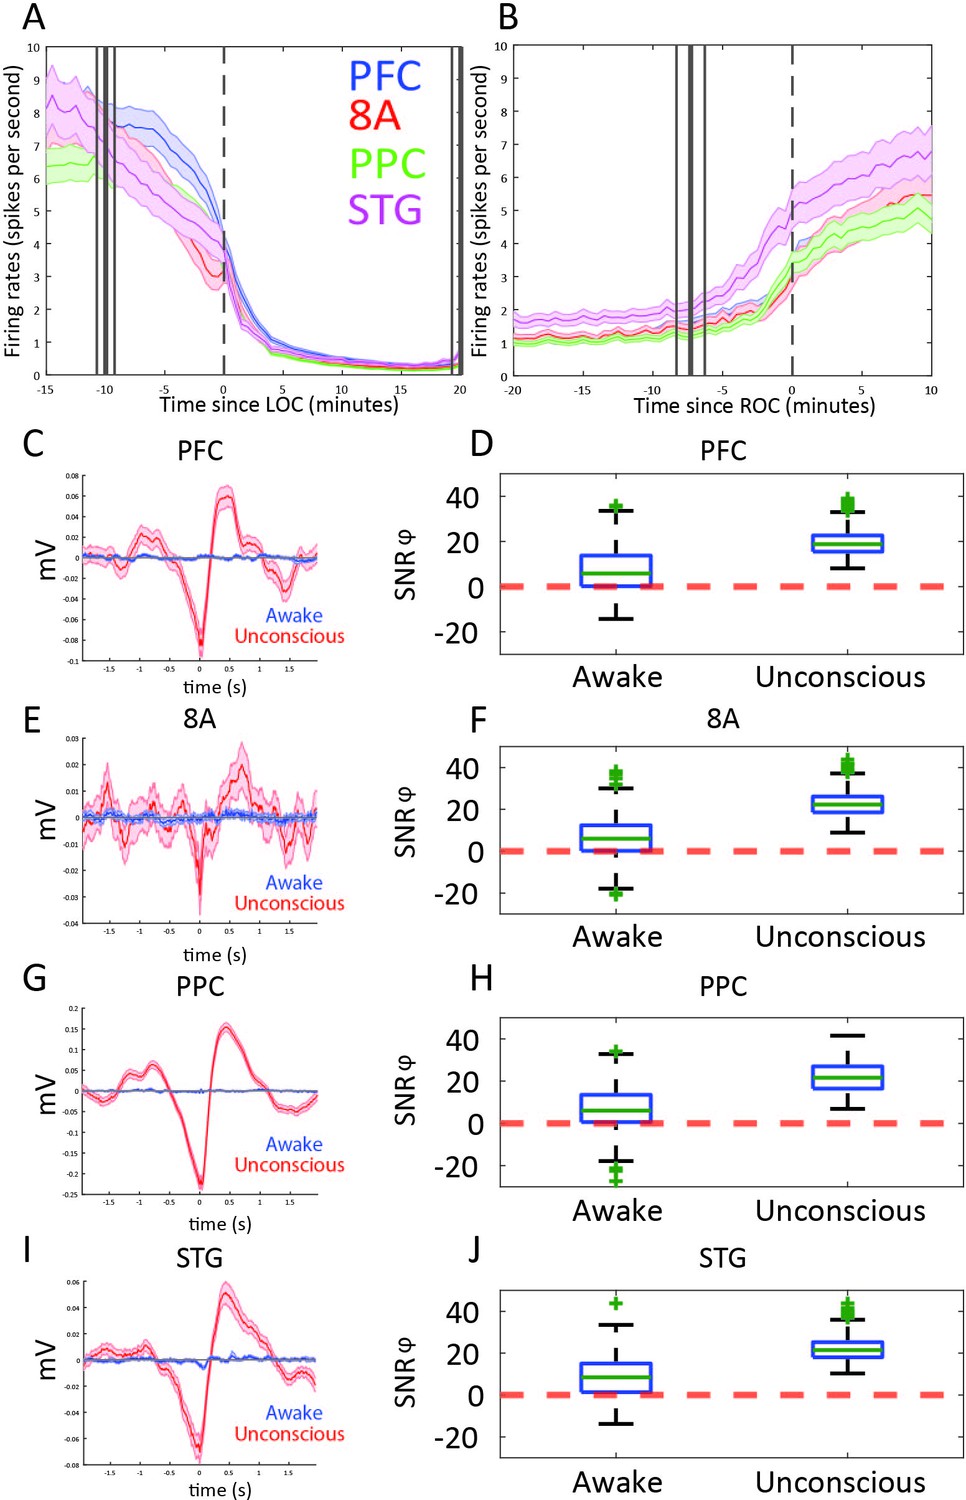
Changes in mean firing rate and spike-phase modulation during Awake vs. Unconscious states.
(A) Spike rate for all recorded areas averaged across all propofol-only recording sessions locked to loss of consciousness (LOC). (B) Same as A, but for recovery of consciousness (ROC). Mean and 99 percent confidence interval. (C/E/G/I) The spike-triggered average for all well-isolated units in a given area with respect to that area’s unfiltered LFP. Red is the Unconscious state, blue is the Awake state. (D/F/H/J) Boxplots of SNRɸ values in decibels (dB) (reflecting SF modulation of spiking, see 'Methods') for all units during the Awake and Unconscious states. PFC: prefrontal cortex; PPC: posterior parietal cortex 7A/7B; 8A: caudal lateral PFC; STG: superior temporal gyrus.
Figure 4—figure supplement 1
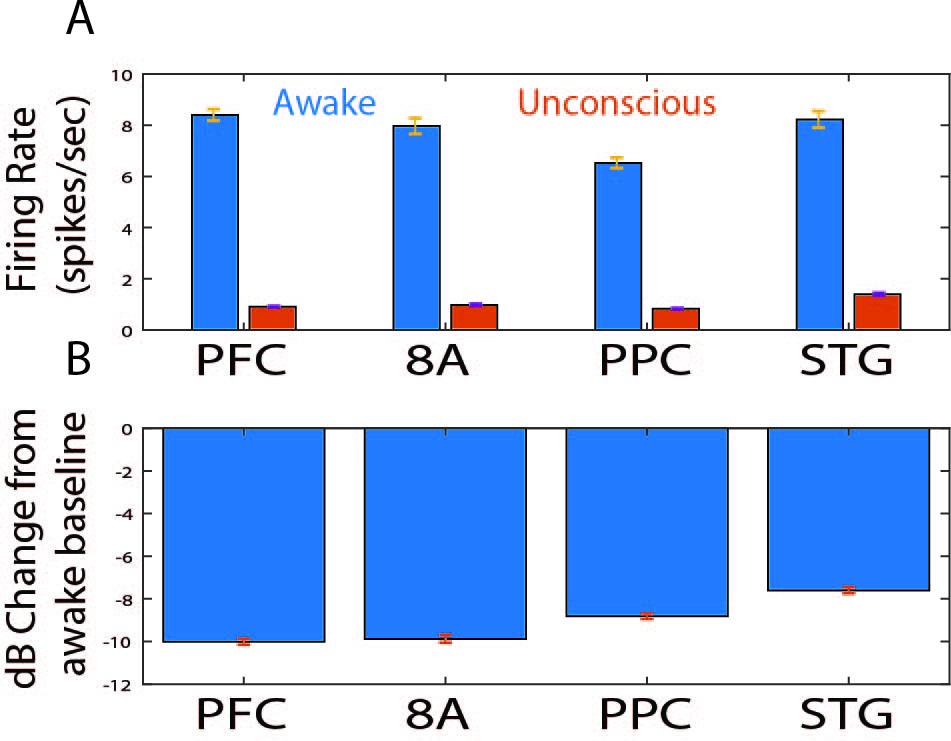
Effect sizes for change in spiking during the Unconscious state.
(A) Mean spike rates (spikes per second) during the Awake (blue bars) vs. Unconscious (orange bars) states. Mean +/- 1 SEM across all neurons. (B) The dB change in spiking, averaged across all units per area. Negative values indicate less spiking during the Unconscious state. Mean ±/- 1 SEM across all units per area. PFC: prefrontal cortex; PPC: posterior parietal cortex 7A/7B; 8A: caudal lateral PFC; STG: superior temporal gyrus.
Figure 5
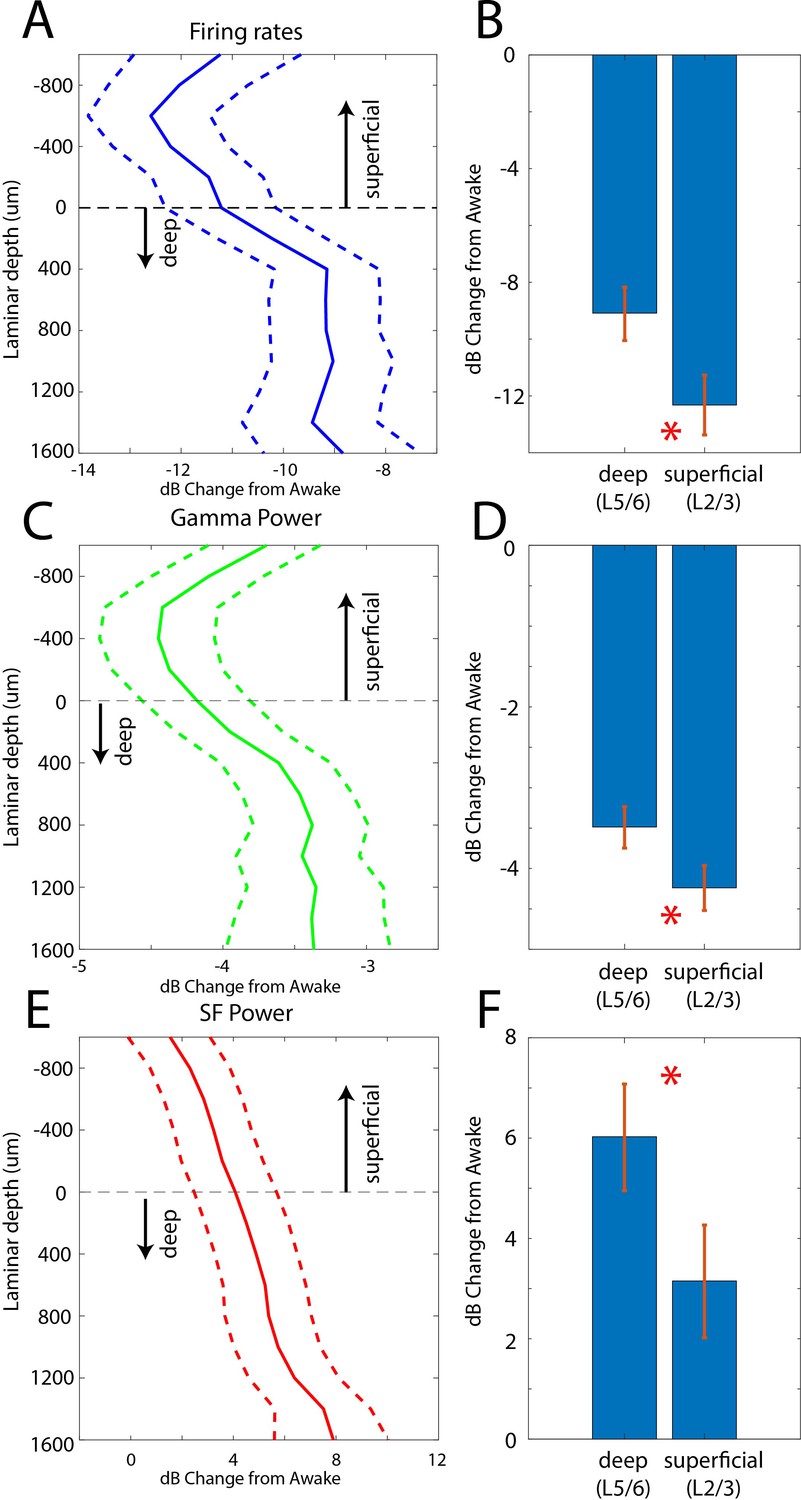
Laminar changes in spiking, gamma, and SF power during Awake vs. Unconscious states.
(A) Firing rate change from Awake to Unconscious states as a function of cortical layer. Negative values indicate less spiking during the Unconscious state. Layer 0 is the approximate location of cortical layer 4 (see 'Methods'). The horizontal dotted line at zero separates superficial layers 2/3 from deep layers 5/6. Mean and 99 percent confidence interval of the effect size across all neurons per indicated depth. (B) Mean and 99 percentconfidence interval of the effect size across all superficial (N = 287) and deep (N = 337) neurons. (C, D) Same as A, B, but for LFP power at gamma (100–200 Hz). (E, F) Same as A, B, but for SF power (0.2–1.1 Hz). Positive values indicate more power during the Unconscious state. N = 330 LFPs for superficial layers, N = 393 LFPs for deep layers. Mean and 99 confidence interval across all available LFPs in each layer.
Figure 6 with 1 supplement
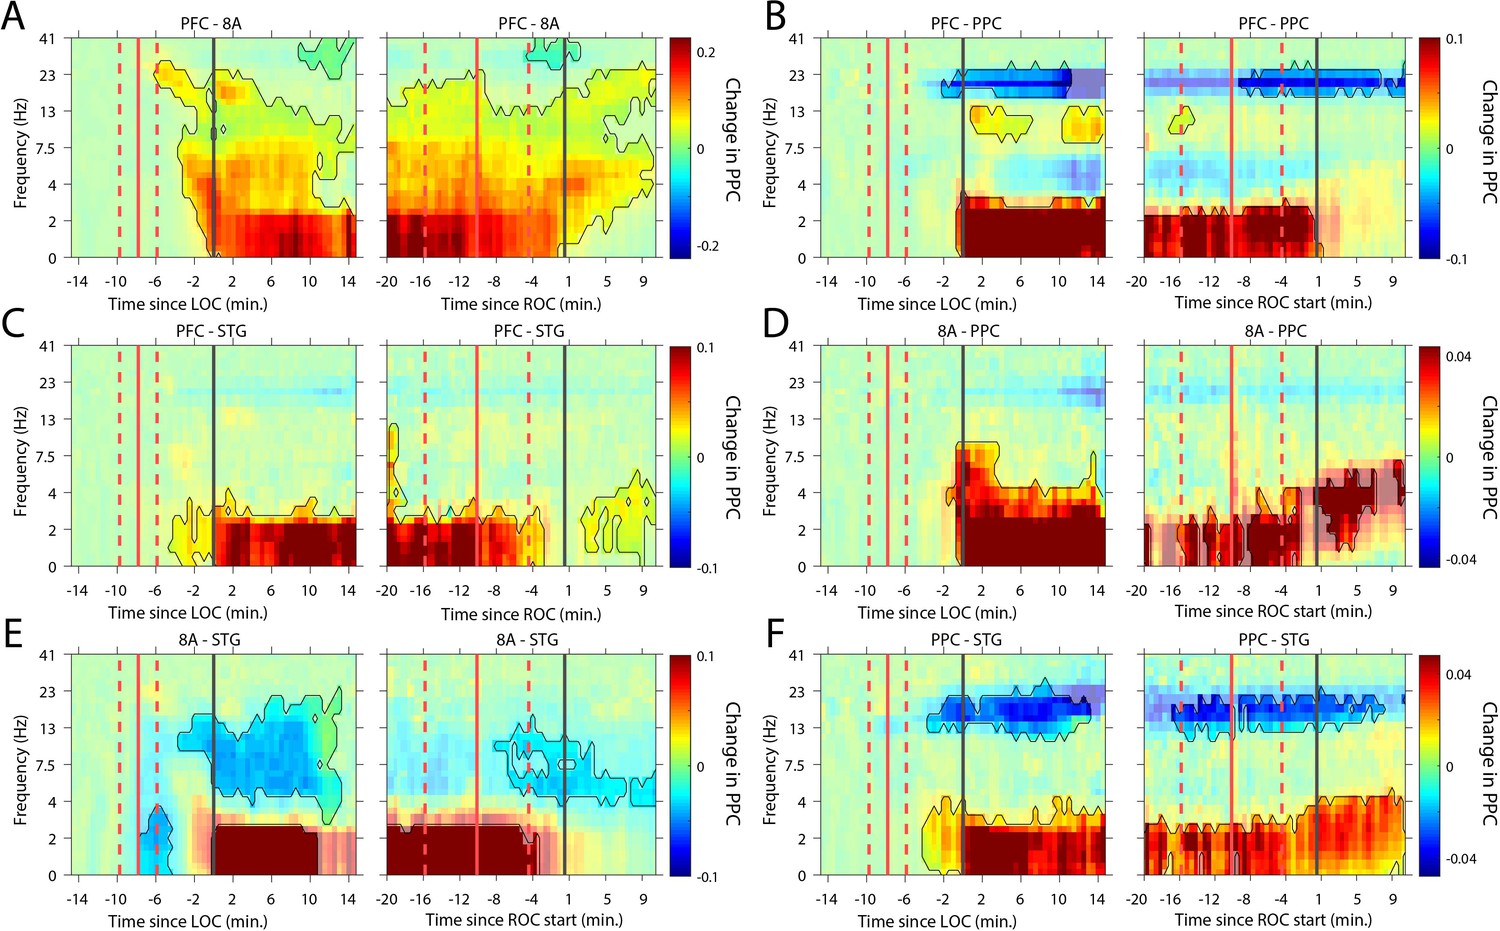
Changes in cortico-cortical LFP phase synchronization during Awake vs. Unconscious states.
(A-F) (left subpanels) Change in the pairwise phase consistency (PPC) for all time points relative to loss of consciousness (LOC) compared to the Awake state (−15 to −10 min pre-LOC). The red vertical lines indicate the average ±/- 1 standard deviation time of propofol onset. The black vertical line indicates time zero (LOC). Significant increases or decreases (p<0.01, corrected for multiple comparisons) from Awake are opaque colors and are highlighted. (right subpanels) Same as left subpanels but for recovery of consciousness (ROC). The red vertical lines indicate the average ±/- standard deviation time of propofol offset. The black vertical line indicates time zero (ROC). Significant increases or decreases from Awake are opaque colors and are highlighted.
Figure 6—figure supplement 1
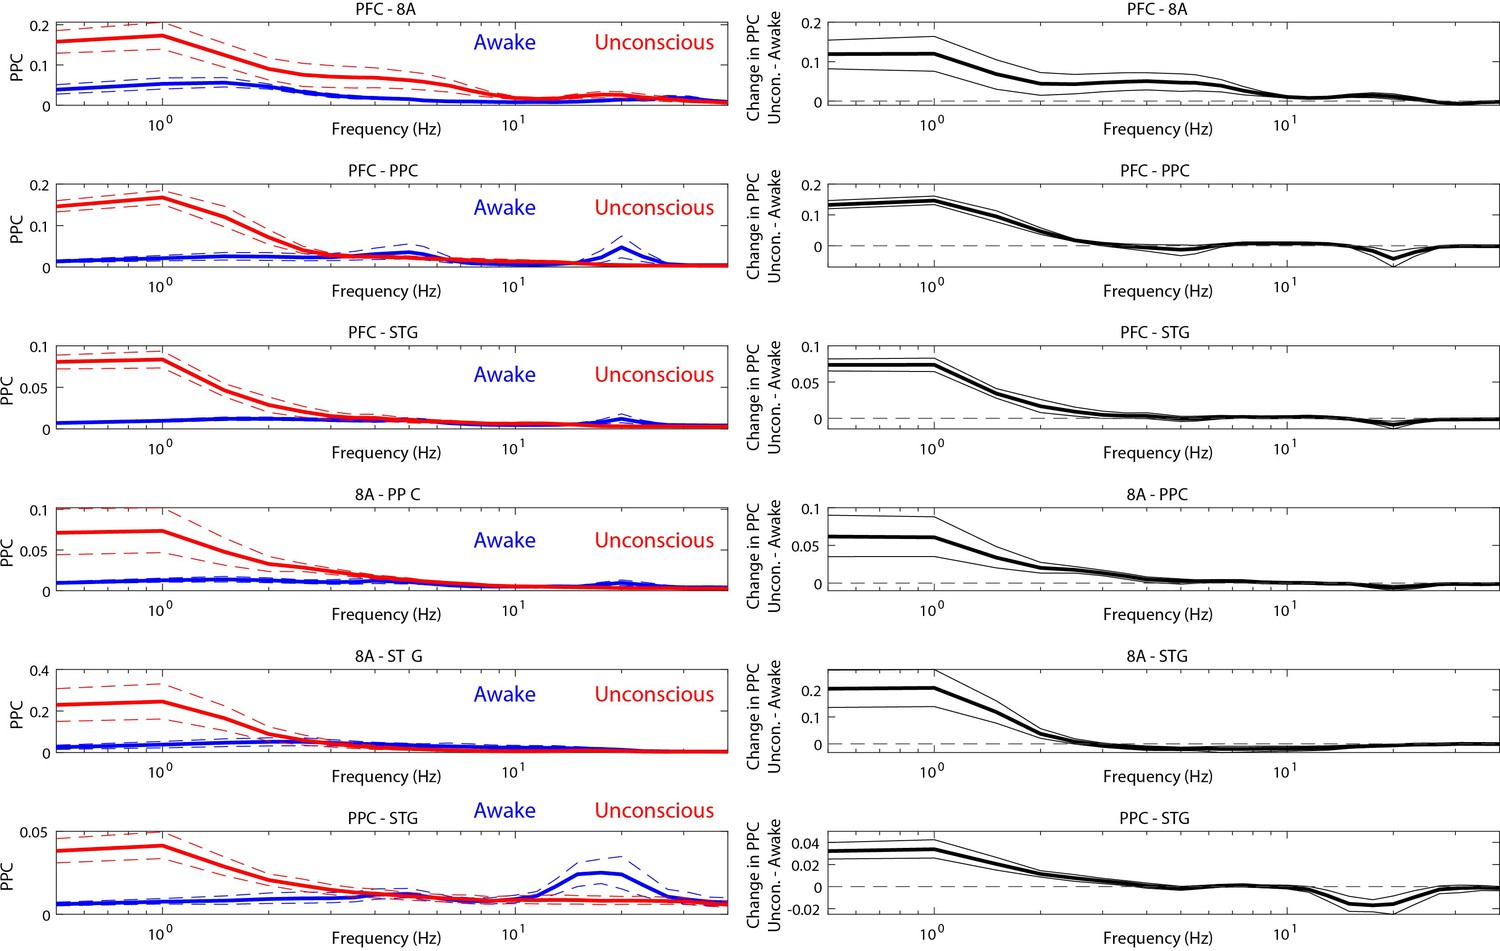
Effect sizes for change in cortico-cortical LFP phase synchronization during Awake vs. Unconscious states (left panels).
Average pairwise phase consistency (PPC) during the Awake (blue) vs. Unconscious (red) states. (right subpanels). Average PPC difference (Unconscious – Awake). Mean is displayed in bold lines and the bootstrap 99 percent confidence interval of the mean is shown in dotted lines. PFC: ventrolateral prefrontal cortex; 8A: caudal lateral PFC; PPC: posterior parietal cortex area 7A/7B; STG: superior temporal gyrus.
Figure 7 with 1 supplement
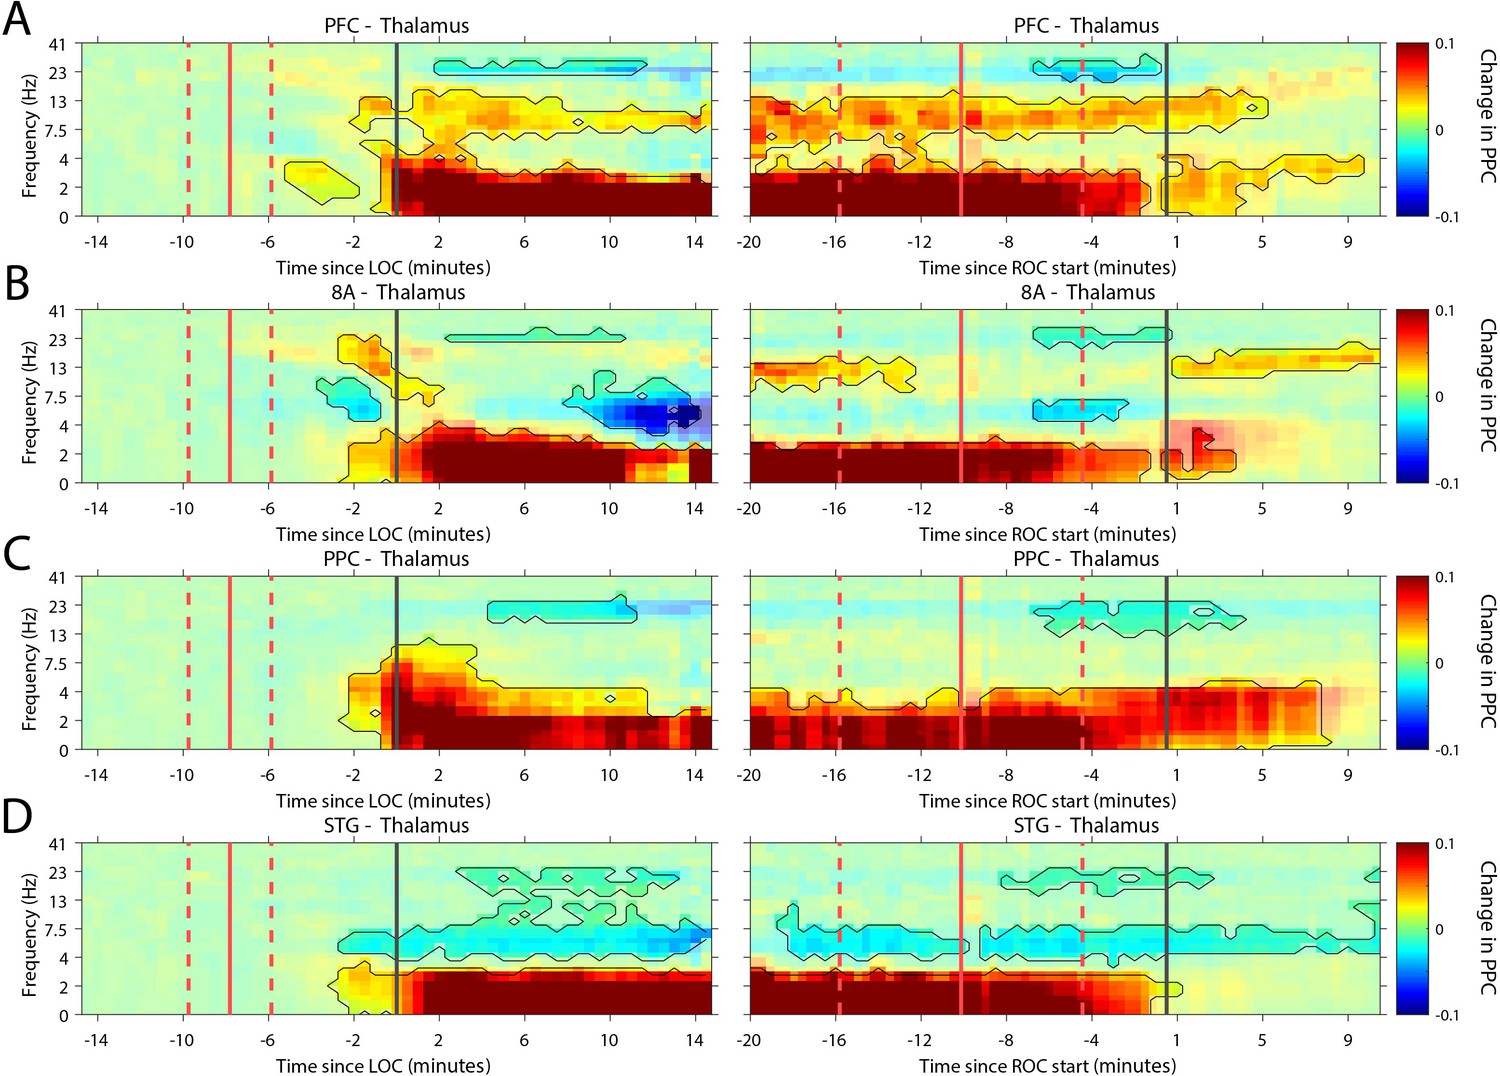
Changes in thalamo-cortical phase synchronization during Awake vs. Unconscious states.
(A-D) (Left subpanels) Change in the pairwise phase consistency (PPC) for all time points relative to loss of consciousness (LOC) compared to Awake (−15 to −10 min pre-LOC). The red vertical lines indicate the average ± 1 standard deviation time of propofol onset. The black vertical line indicates time zero (LOC). Significant increases or decreases (p<0.01, corrected for multiple comparisons) from Awake are marked with opaque colors and are highlighted. (Right subpanels) Same as left subpanels but time-locked to recovery of consciousness (ROC). The red vertical lines indicate the average ± 1 standard deviation time of propofol offset. The black vertical line indicates time zero (ROC). Significant increases or decreases from Awake are opaque colors and are highlighted. PFC: ventrolateral prefrontal cortex; 8A: caudal lateral PFC; PPC: posterior parietal cortex area 7A/7B; STG: superior temporal gyrus.
Figure 7—figure supplement 1
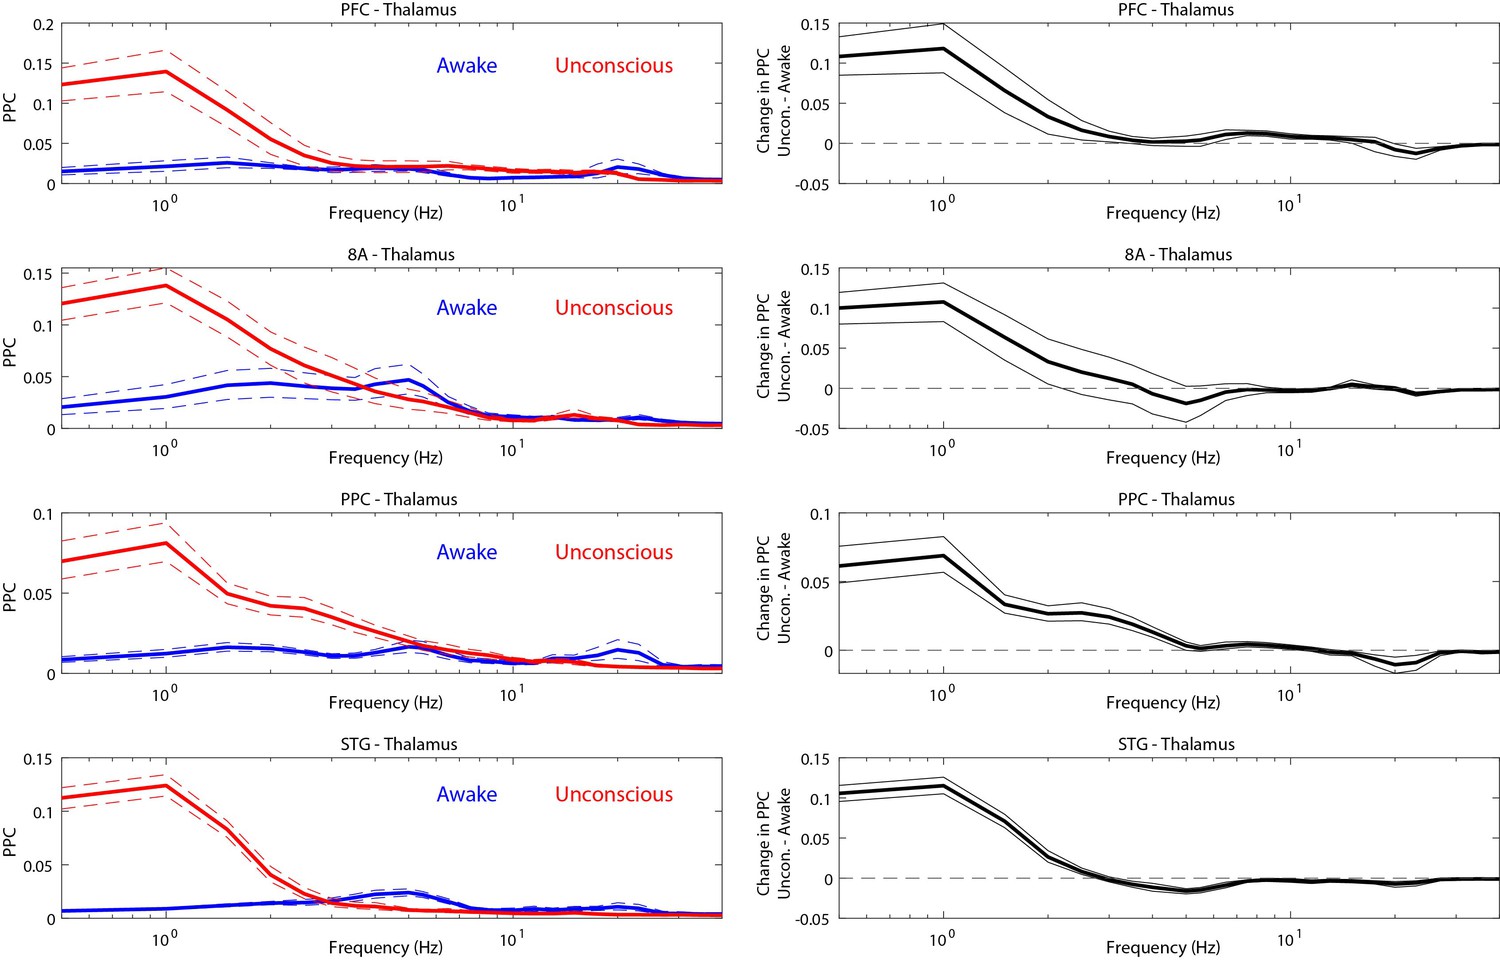
Effect sizes for change in thalamo-cortical phase synchronization during Awake vs. Unconscious states (left panels).
Average pairwise phase consistency (PPC) during the Awake (blue) vs. Unconscious (red) states. (Right subpanels) Average PPC difference (Unconscious – Awake). Mean is displayed in bold lines and the 99 percent bootstrap confidence interval of the mean is shown in dotted lines. PFC: ventrolateral prefrontal cortex; 8A: caudal lateral PFC; PPC: posterior parietal cortex area 7A/7B; STG: superior temporal gyrus.
Figure 8 with 2 supplements
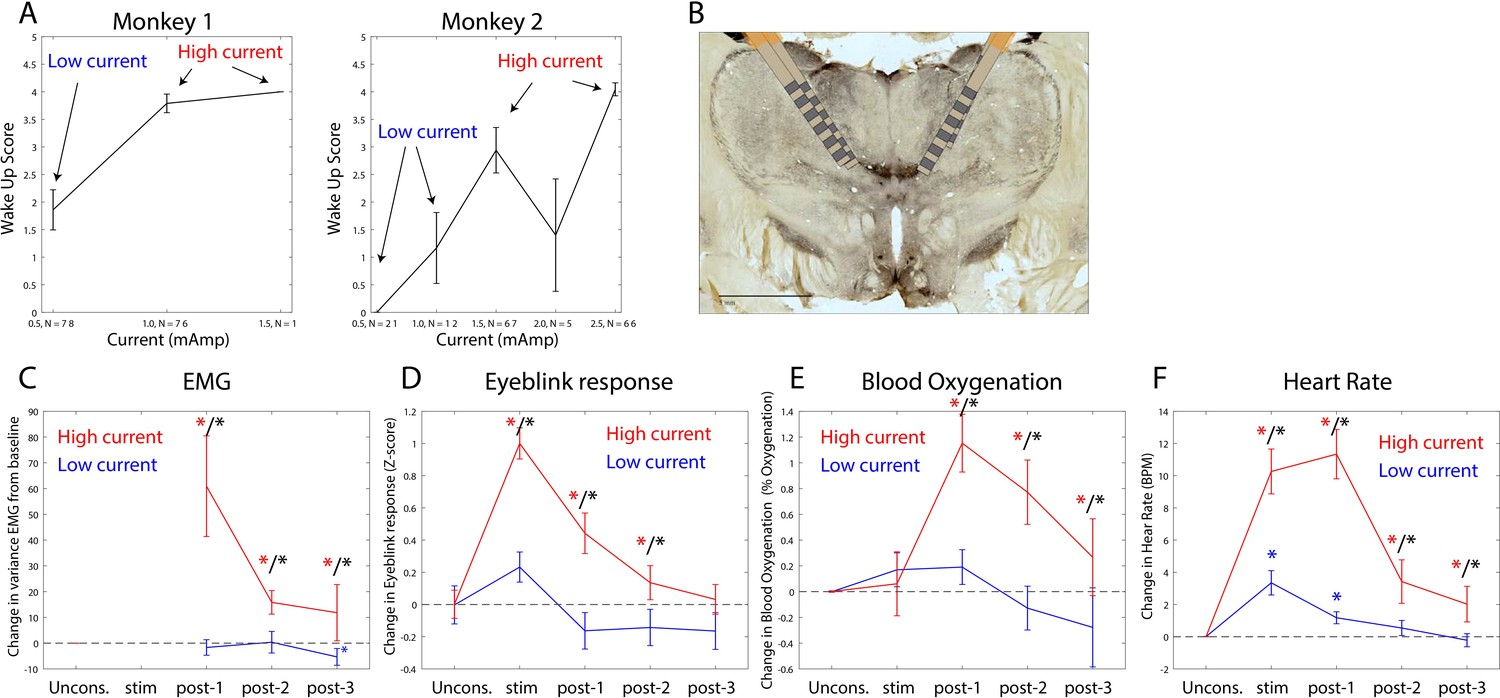
Thalamic electrical stimulation in central thalamus arouses monkeys.
(A) Behavioral wake-up score as a function of thalamic current for monkey 1 (left subplot) and monkey 2 (right subplot). Mean ±+ 1 SEM. A high-current and low-current condition was individually titrated per monkey for producing scores on average above or below a wake-up score of 2. (B) A histological image from monkey 1 showing the thalamic leads in the central thalamus. (C) Change in EMG from the pre-stimulation Unconscious baseline for high-current (red) vs. low-current (blue) conditions. Change in the physiological signal was tested for difference from Unconscious during the stimulation period (0–28.5 s with respect to electrical stimulation onset), post-1 (0–30 s with respect to electrical stimulation offset), post-2 (30–60 s with respect to electrical stimulation offset), and post-3 (60–90 s with respect to electrical stimulation offset). Significant differences from zero are indicated with red (for high current) or blue (for low current) stars. Significant differences between high vs. low current are indicated with black stars. Mean ± 1 SEM. (D) Same as C, but for eyeblink response to air puffs. (E) Same as C, but for blood oxygenation. (F) Same as C but for the heart rate response.
Figure 8—figure supplement 1
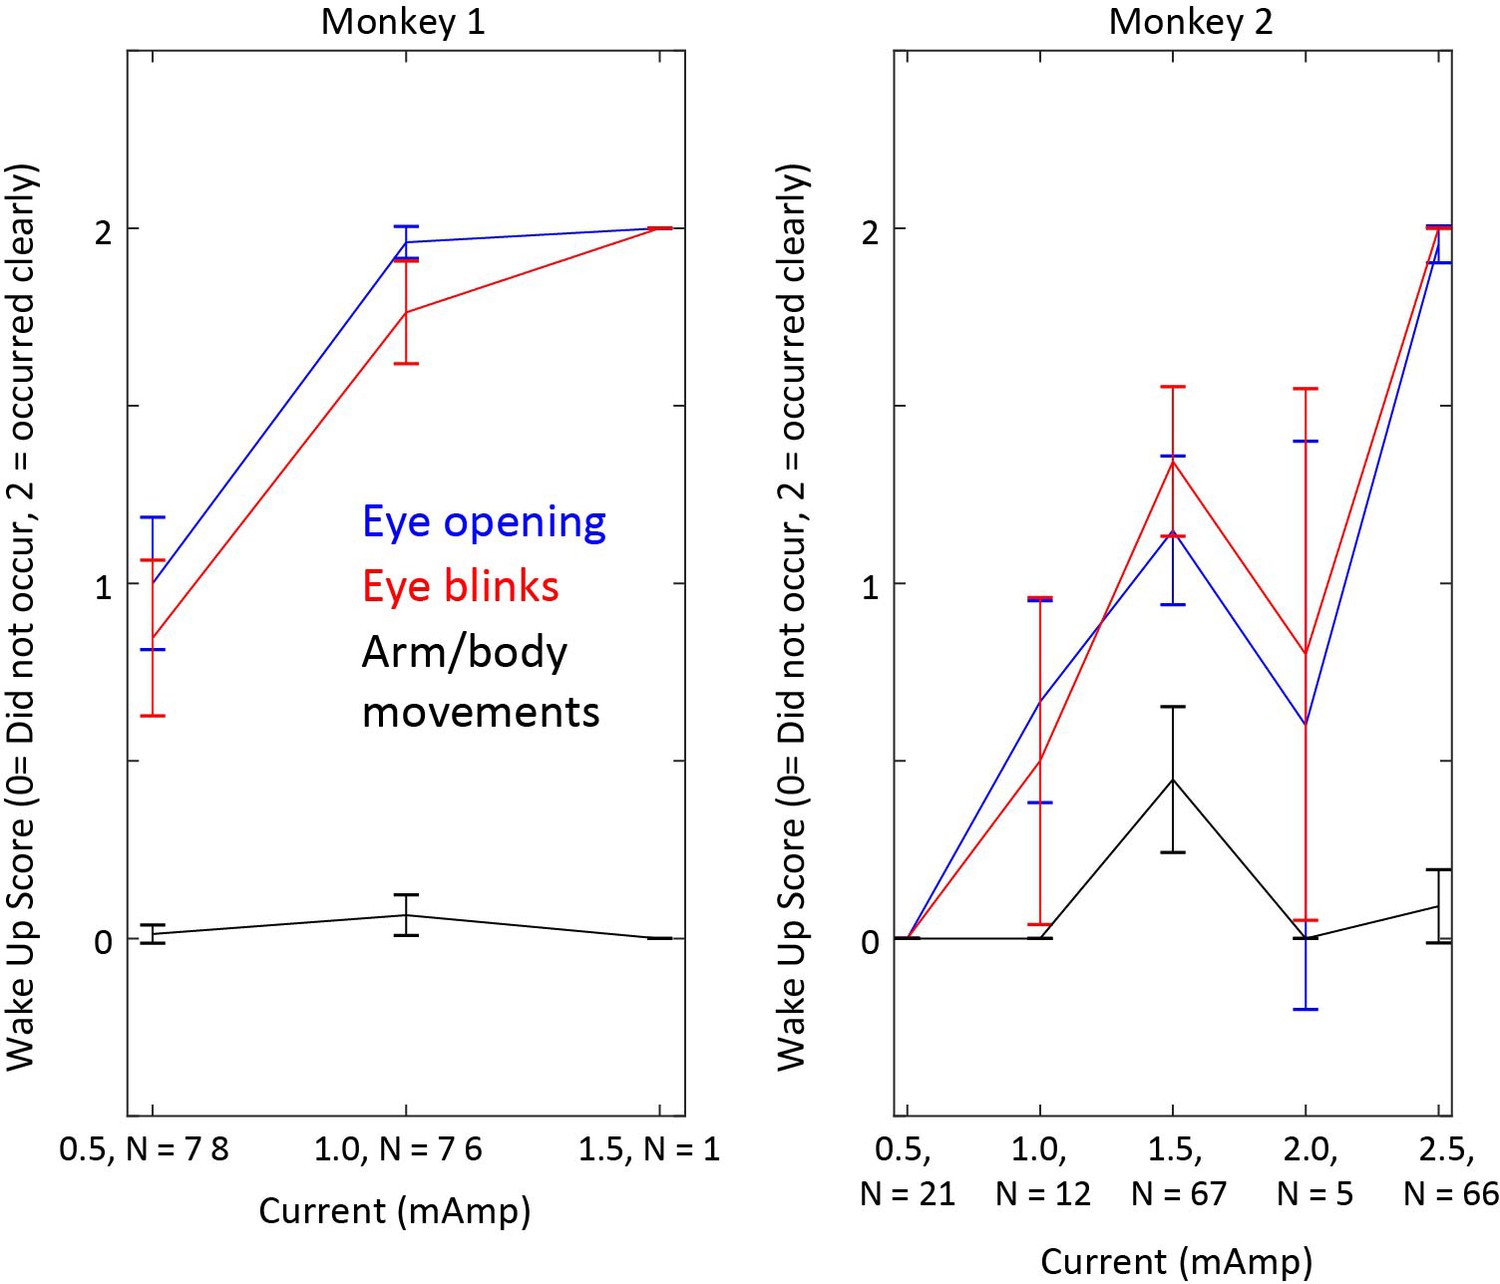
Effects of thalamic electrical stimulation on wake-up sub-scores.
Behavioral wake-up score as a function of thalamic current defined separately for eye opening (blue), puff-evoked eye blinks (red), and arm/body movements (black). For eye opening, 0 = eyes closed, 1 = one or both eyes slightly open, 2 = one or both eyes fully open. For puff-evoked eyeblinks, 0 = no response, 1 = occasional blinking not necessarily in response to puffs, 2 = clear response to airpuffs. For arm/body movements, 0 = none, 1 = some mouth/jaw movement, 2 = arm/full-body movement. Plots are mean ±/- 2 SEM.
Figure 8—figure supplement 2
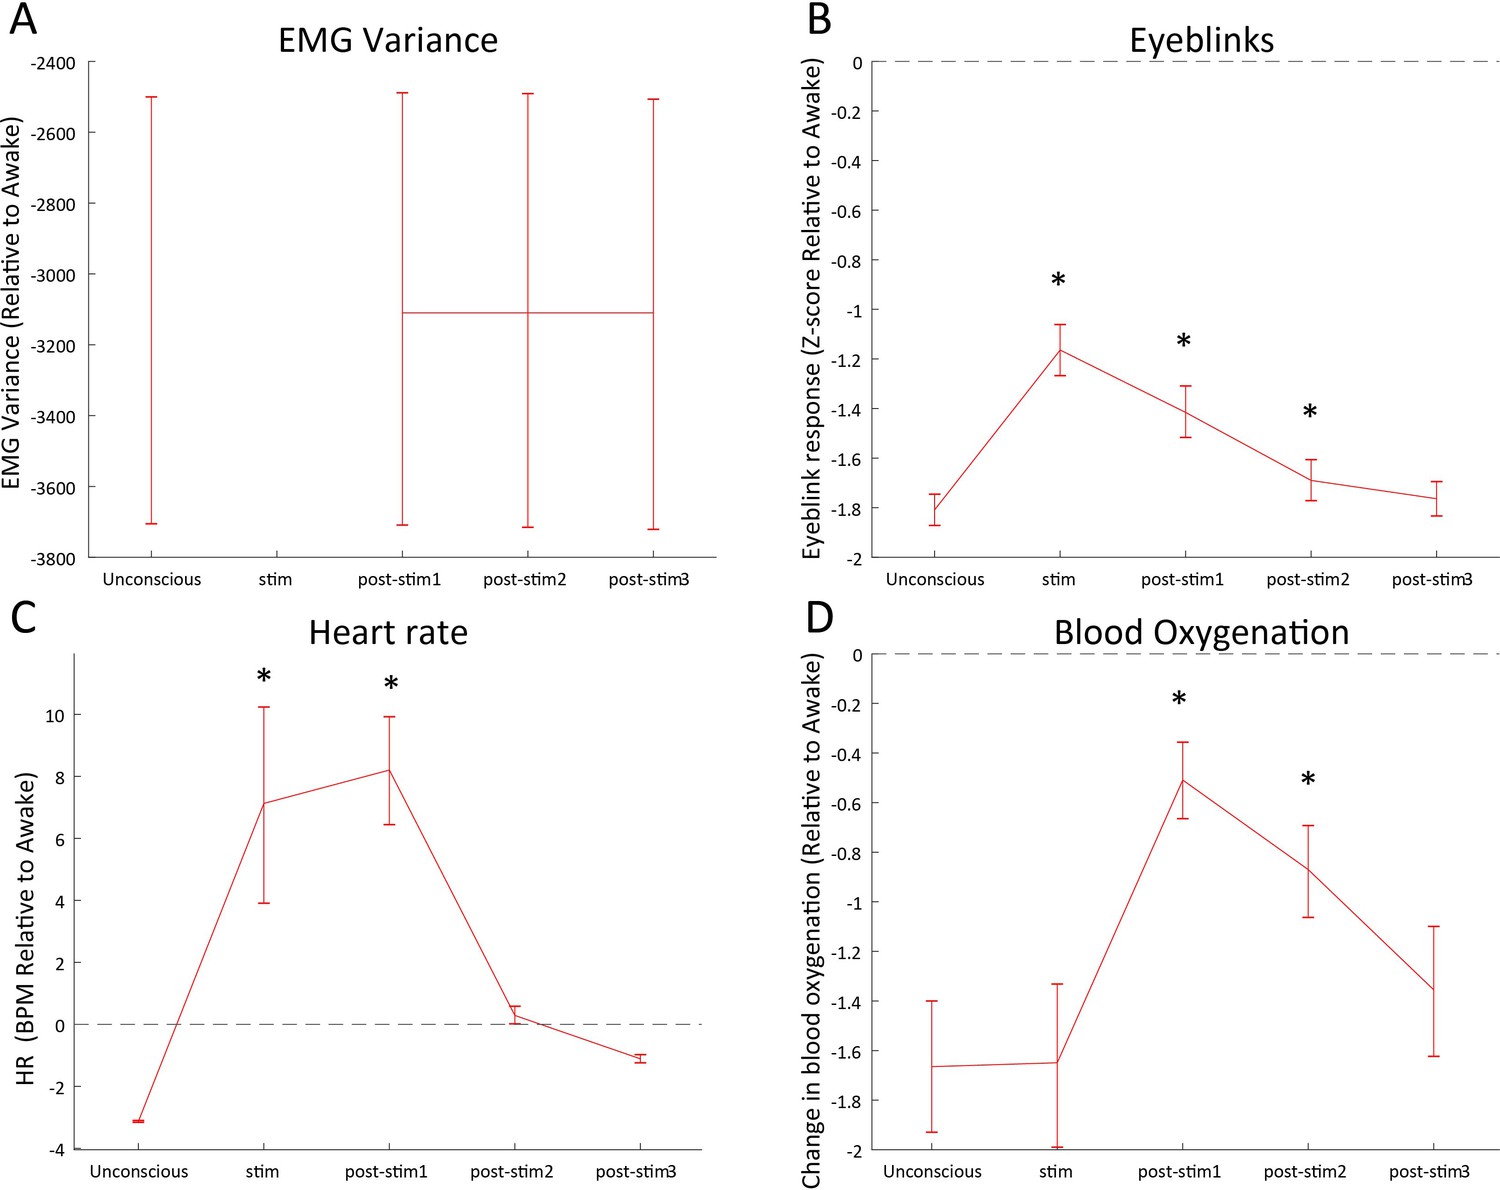
Effects of thalamic electrical stimulation on arousal relative to the Awake state.
(A) EMG relative to the Awake state during high-current thalamic stimulation. Unconscious denotes the period from 0 to 30 s prior to stimulation onset. Stim denotes the stimulation period (0–28.5 s with respect to electrical stimulation onset, not shown for EMG due to artifacts), post-1 (0–30 s with respect to electrical stimulation offset), post-2 (30–60 s with respect to electrical stimulation offset), and post-3 (60–90 s with respect to electrical stimulation offset). (B) Same as A, but for eyeblink response to air puffs. (C) Same as A, but for heart rate. (D) Same as A but blood oxygenation. Stars indicate significant differences from the pre-stimulation Unconscious state (p<0.01, non-parametric randomization test). Mean and the 99 percent bootstrap confidence interval of the mean.
Figure 9 with 8 supplements
Effects of thalamic electrical stimulation on cortical state.
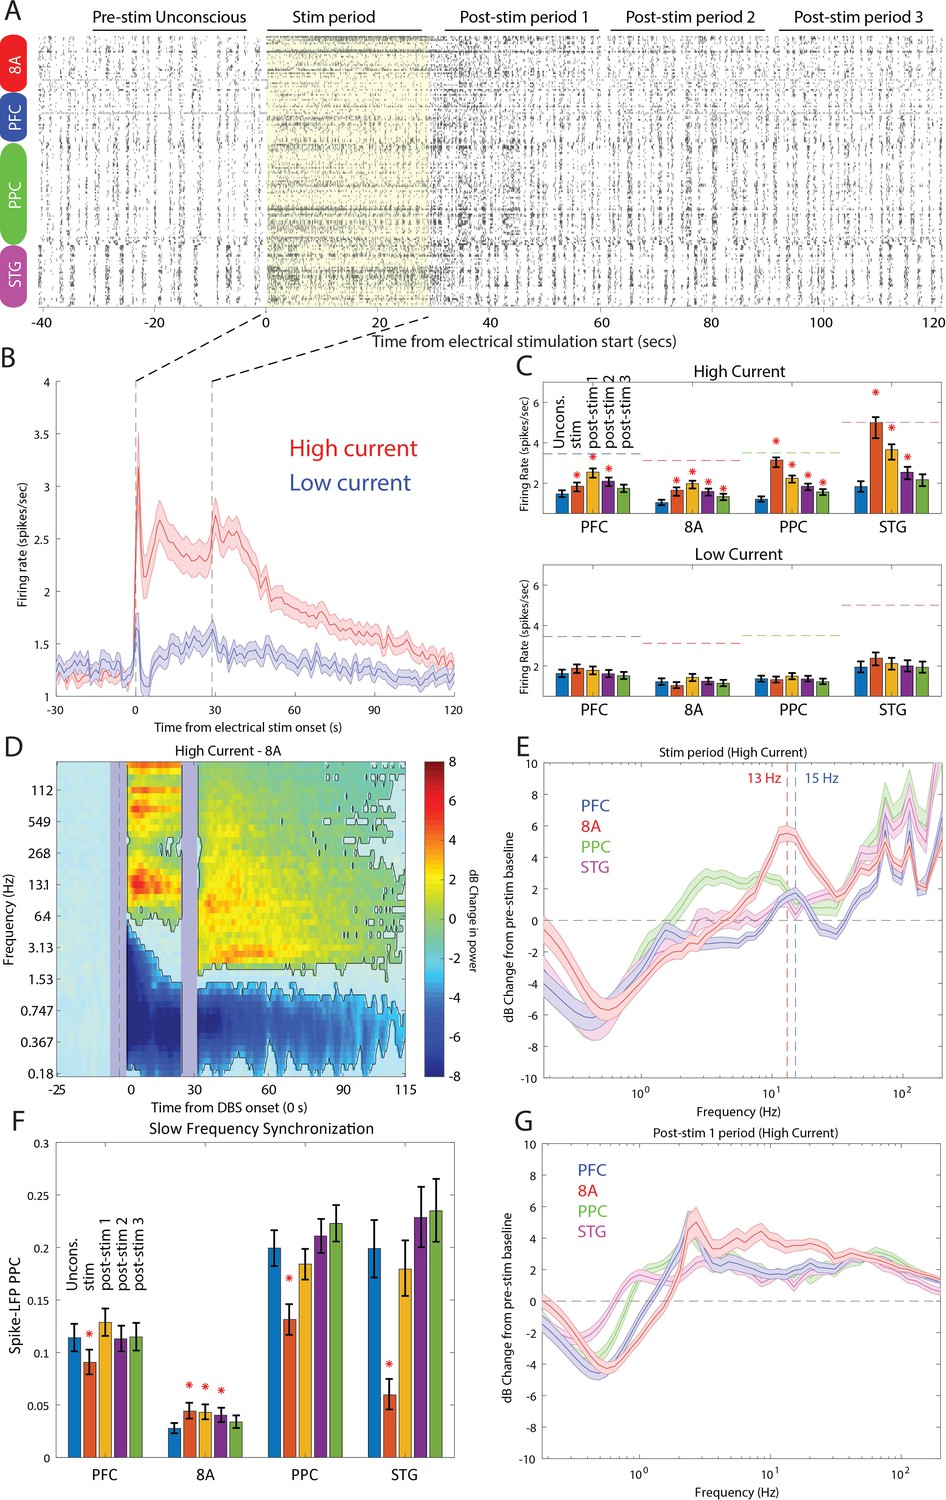
(A) An example trial. Well-isolated single units are shown before, during, and after electrical stimulation for a trial that produced a maximal wake-up score (eyes opened, muscle movement, response to air puffs). (B) The average effect on all well-isolated single units across all areas. Mean firing rates with respect to electrical stimulation onset (at time zero) and offset (28.5 s) for high (red) vs. low (blue) current. (C) (Upper panel) Mean firing rates for all single units in each area as a function of time in the trial during high-current stimulation (blue bars: pre-stim Unconscious baseline; orange bars: electrical stimulation; yellow bars: 0–30 s after electrical stimulation offset; purple bars: 30–60 s after electrical stimulation offset; green bars: 60–90 s after electrical stimulation offset). (Lower panel) Same as upper subplot, but for low-current stimulation. Mean ± the bootstrap 99 percent confidence interval of the mean across neurons. (D) Mean dB change in power as a function of time since electrical stimulation for all high-current trials in area 8A. (E) Same as D, but highlighting spectral modulation during the period of electrical stimulation (0–28.5 s). Mean ± 1 SEM. The vertical dotted lines indicate the peak frequencies of beta power modulation in PFC and 8A. (F) Mean pairwise phase consistency (PPC) between spikes and fields within each cortical area. Significant changes relative to the pre-stimulation Unconscious state are indicated with asterisks (p<0.01, non-parametric randomization test). Mean and the bootstrap 99 percent confidence interval of the mean across neurons. (G) Same as D, but highlighting spectral modulation during the post-1 period of electrical stimulation (0–30 s post electrical stimulation offset). Mean ±/- 1 SEM. PFC: prefrontal cortex; PPC: posterior parietal cortex 7A/7B; 8A: caudal lateral PFC; STG: superior temporal gyrus.
Figure 9—figure supplement 1
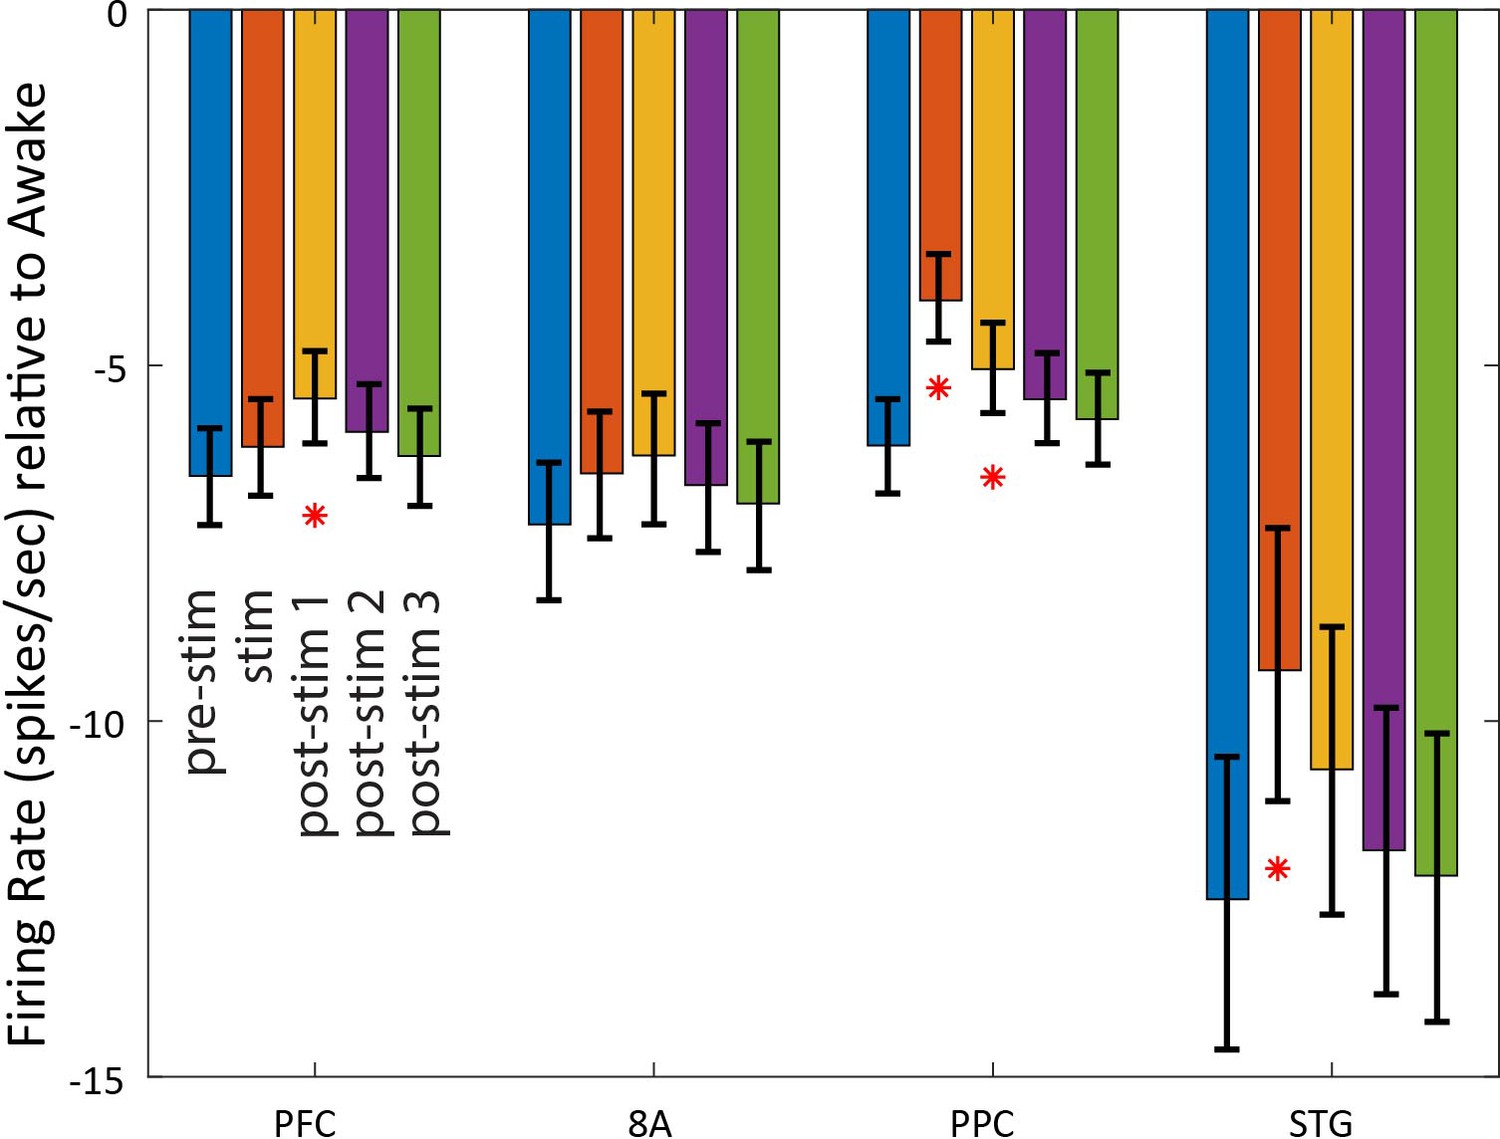
Effects of high-current thalamic electrical stimulation on cortical firing rates relative to the Awake state.
Mean firing rates (spikes/s) for indicated cortical areas relative to Awake. Negative values indicate decreased firing rates relative to Awake. Unconscious is the state immediately before stimulation (0–30 s prior to stimulation, blue bars), stim is the duration of electrical stimulation (orange bars), post-stim1 is 0–30 s after electrical stimulation offset (yellow bars), post-stim2 is 30–60 s after electrical stimulation offset (purple bars), and post-stim3 is 60–90 s after electrical stimulation offset (green bars). Significant changes relative to the pre-stim Unconscious state are indicated with asterisks (p<0.01, non-parametric randomization test). Mean ±/- the bootstrap 99 percent confidence interval of the mean across neurons. PFC: prefrontal cortex; PPC: posterior parietal cortex 7A/7B; 8A: caudal lateral PFC; STG: superior temporal gyrus.
Figure 9—figure supplement 2
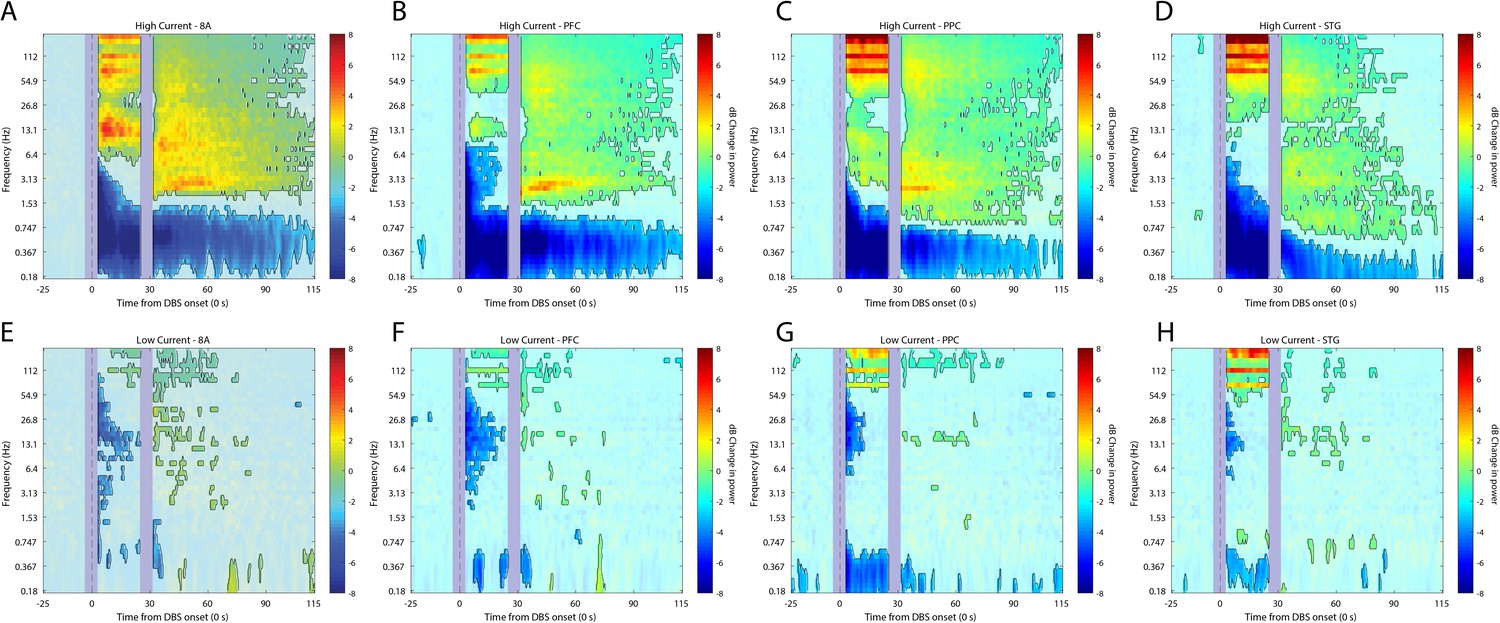
Effects of thalamic electrical stimulation on cortical power.
(A-D) Mean dB change in power from the pre-stimulation Unconscious state as a function of time since electrical stimulation for all high-current trials in areas 8A, PFC, PPC, and STG, respectively. (E-H) Same as A-D, but for low current. Significant increases or decreases from the pre-stimulation Unconscious state are marked with opaque colors and are highlighted. PFC: prefrontal cortex; PPC: posterior parietal cortex 7A/7B; 8A: caudal lateral PFC; STG: superior temporal gyrus.
Figure 9—figure supplement 3
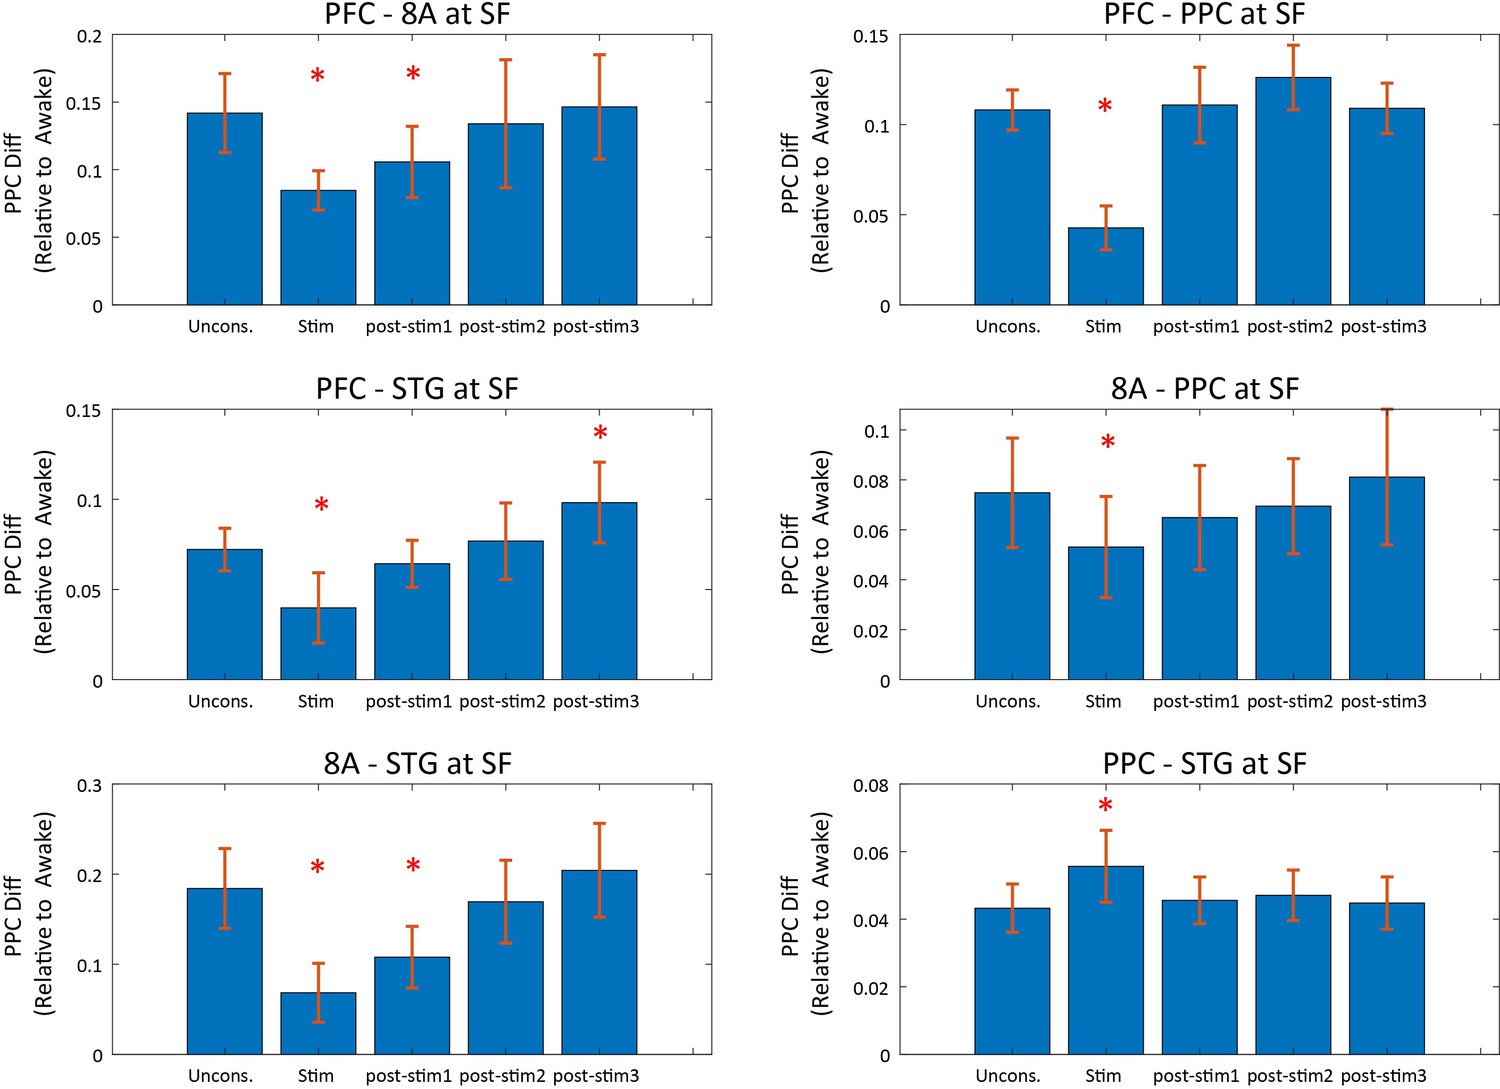
Effects of high-current thalamic electrical stimulation on cortico-cortical synchronization relative to the Awake state.
Mean pairwise phase consistency (PPC) for indicated cortico-cortical interactions relative to the pre-drug Awake state in the slow frequency (0.1–2 Hz) band. Positive values indicate increases in synchronization relative to the Awake state. Unconscious (0–30 s prior to stimulation), Stimulation (duration of stimulation): post-stim1 (0–30 s after electrical stimulation offset), post-stim2 (30–60 s after electrical stimulation offset), and post-stim3 (60–90 s after electrical stimulation offset). Mean ±/- 2 SEM across sessions. Significant changes relative to the pre-stim Unconscious state are indicated with asterisks (p<0.01, non-parametric randomization test). PFC: prefrontal cortex; PPC: posterior parietal cortex 7A/7B; 8A: caudal lateral PFC; STG: superior temporal gyrus; SF: slow frequency.
Figure 9—figure supplement 4
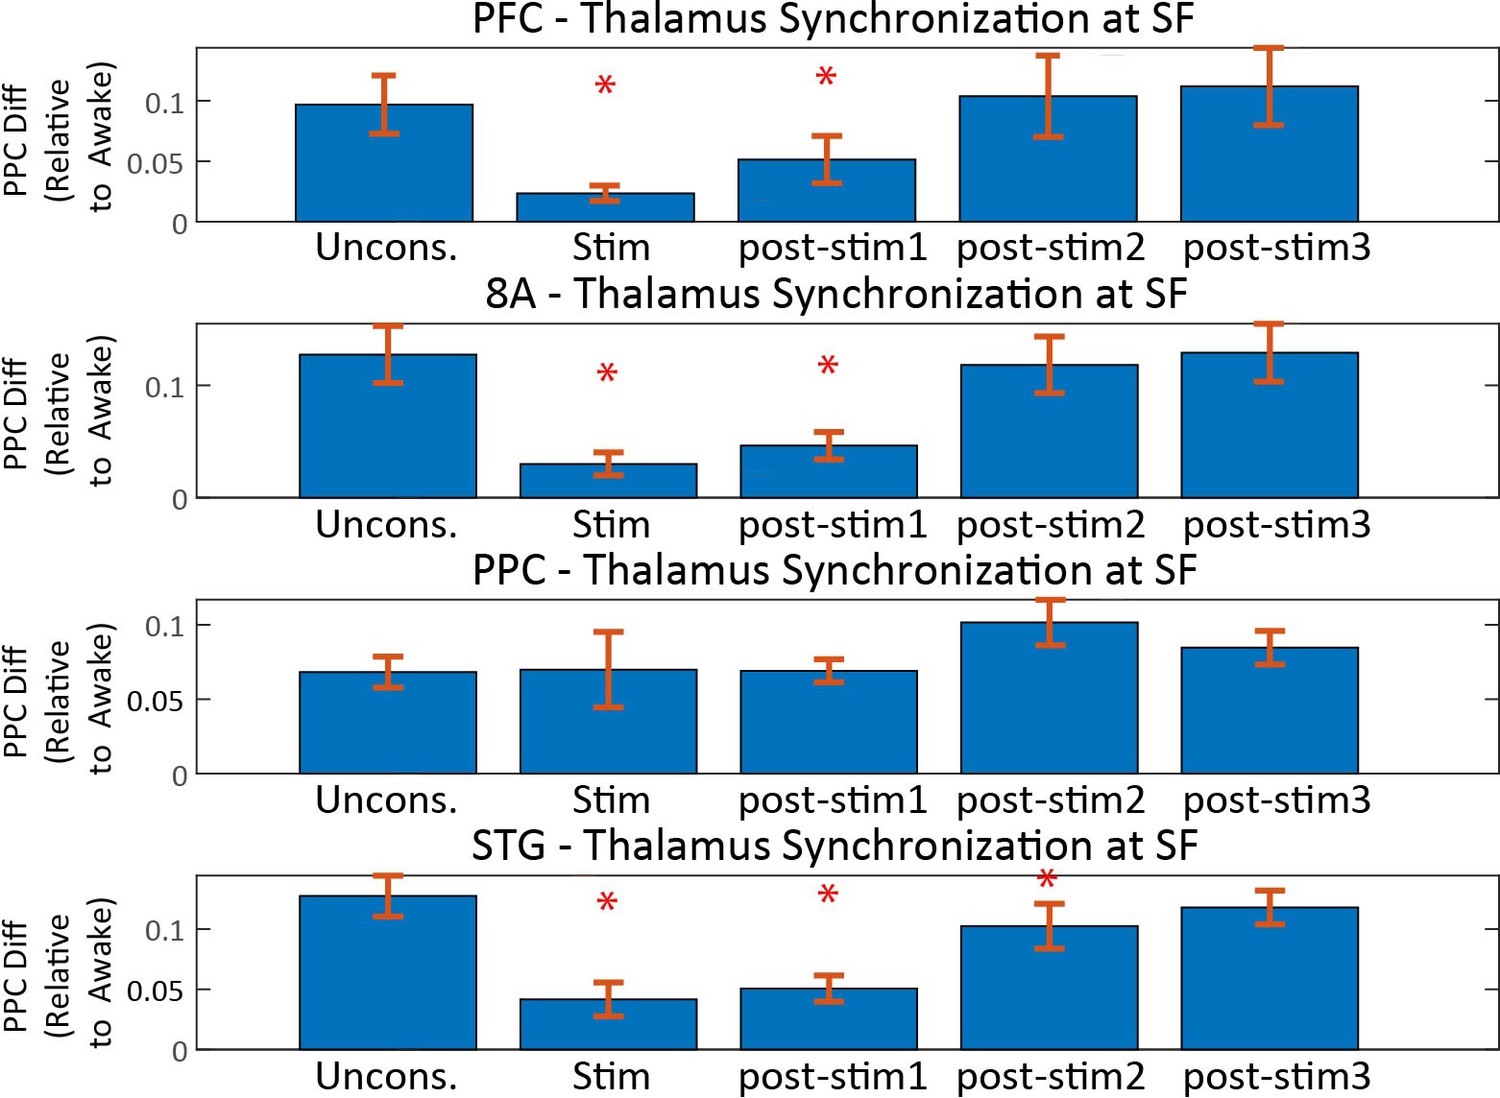
Effects of high-current thalamic electrical stimulation on thalamo-cortical synchronization relative to the Awake state.
Mean pairwise phase consistency (PPC) for indicated thalamo-cortical interactions relative to the pre-drug Awake state. Positive values indicate increases in synchronization relative to the Awake state. Unconscious (0–30 s prior to stimulation), Stimulation (duration of stimulation), post-stim1 (0–30 s after electrical stimulation offset), post-stim2 (30–60 s after electrical stimulation offset), and post-stim3 (60–90 s after electrical stimulation offset). Mean ±/- 2 SEM across sessions. Significant changes relative to the pre-stim Unconscious state are indicated with asterisks p<0.01, non-parametric randomization test). PFC: prefrontal cortex; PPC: posterior parietal cortex 7A/7B; 8A: caudal lateral PFC; STG: superior temporal gyrus; SF: slow frequency.
Figure 9—figure supplement 5
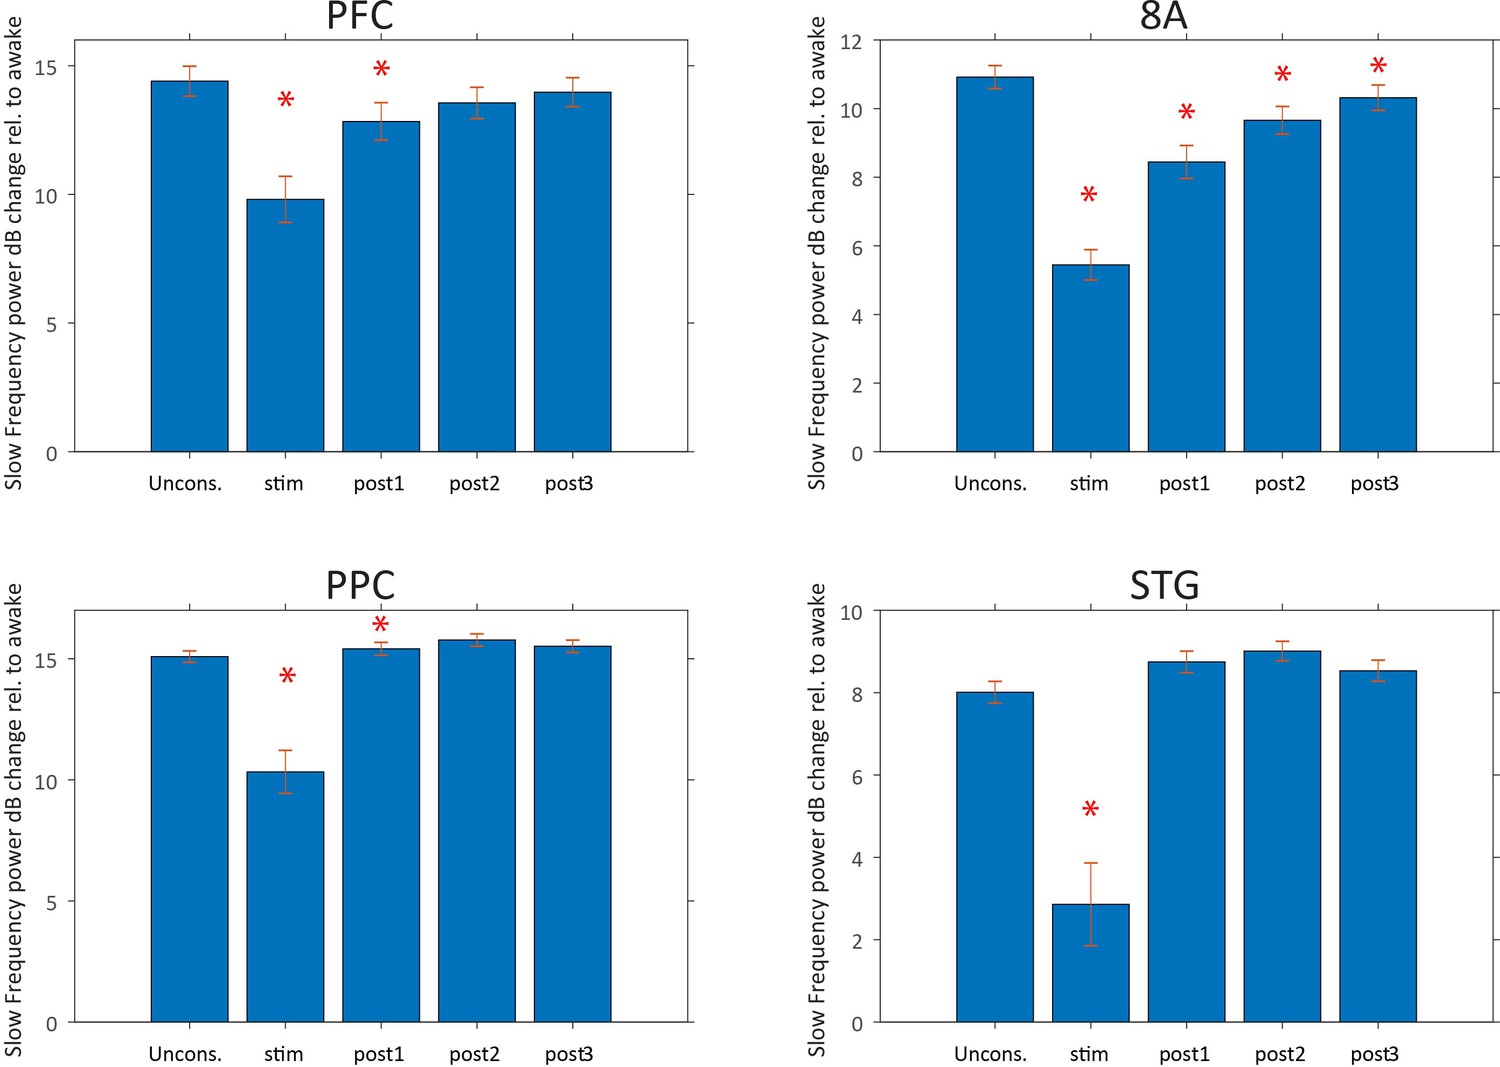
Effects of high-current thalamic electrical stimulation on SF power relative to the Awake state.
dB Change in slow frequency (SF, 0.1–2 Hz) power for indicated cortical areas relative to the pre-drug Awake state. Positive values indicate increases in power relative to the Awake state. Unconscious (0–30 s prior to stimulation), Stimulation (duration of stimulation), post-stim1 (0–30 s after electrical stimulation offset), post-stim2 (30–60 s after electrical stimulation offset), and post-stim3 (60–90 s after electrical stimulation offset). Mean ±/- 2 SEM across sessions. Significant changes relative to the pre-stim Unconscious state are indicated with asterisks (p<0.01, non-parametric randomization test). PFC: prefrontal cortex; PPC: posterior parietal cortex 7A/7B; 8A: caudal lateral PFC; STG: superior temporal gyrus.
Figure 9—figure supplement 6
Effects of high-current thalamic electrical stimulation on SF spike-LFP synchronization relative to the Awake state.
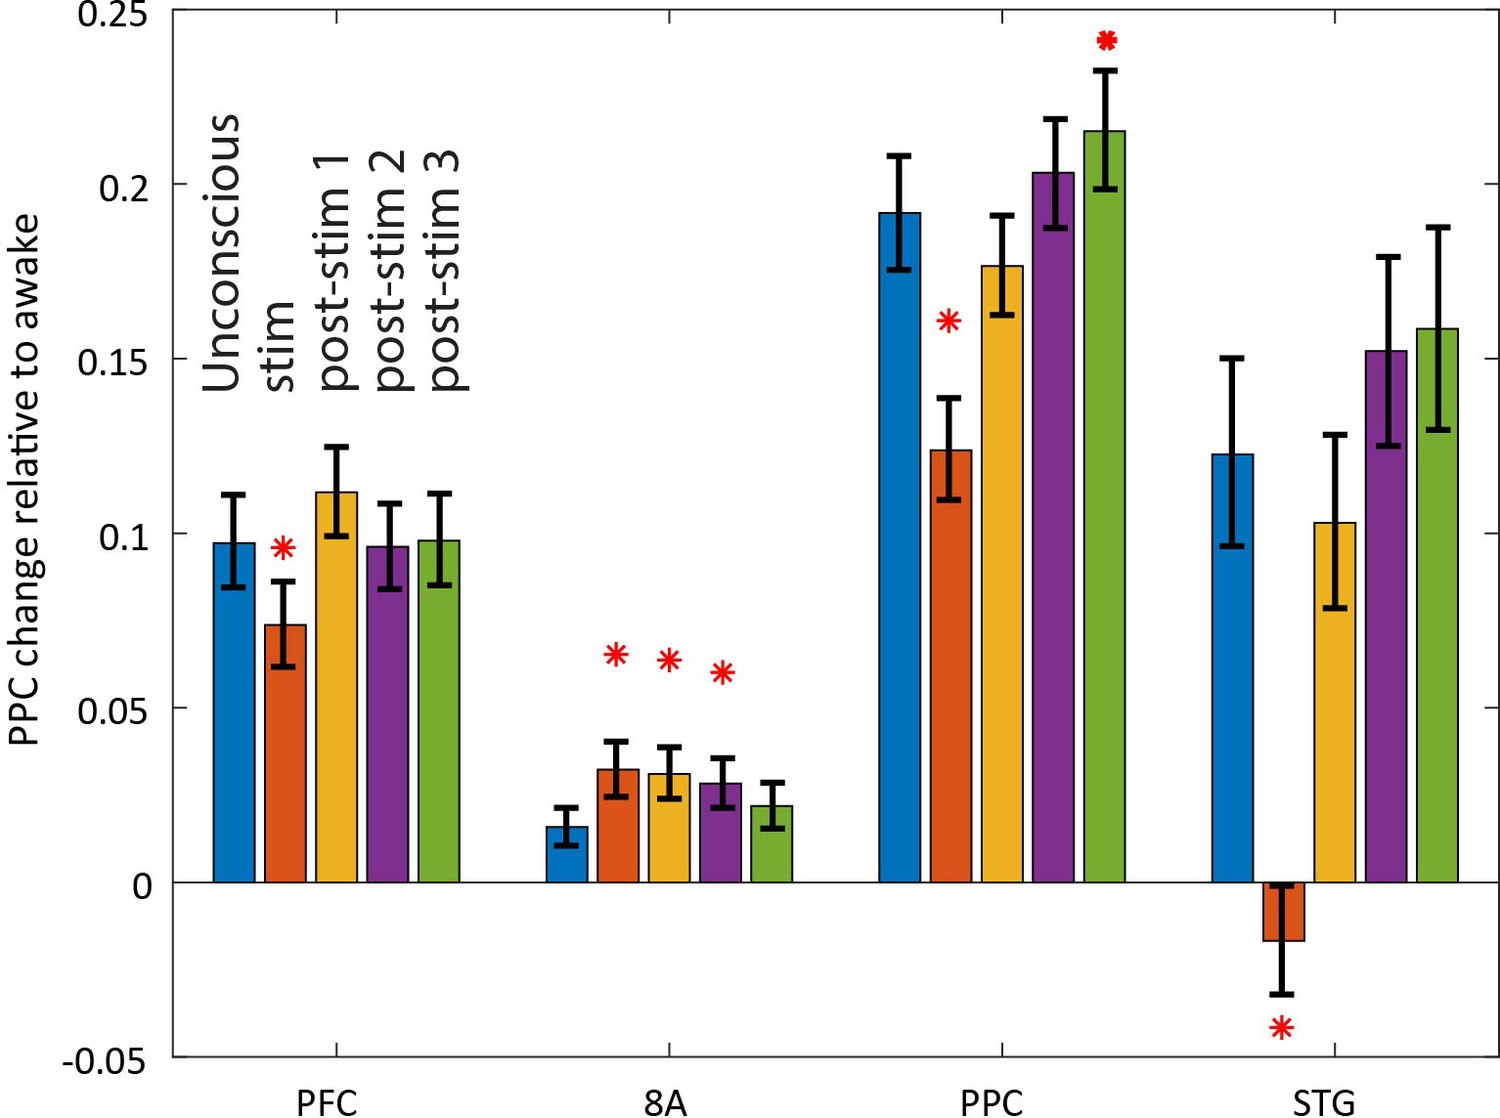
Mean pairwise phase consistency (PPC) between spikes and fields within each cortical area relative to the pre-drug Awake state. Positive values indicate increases in spike-LFP synchronization relative to the Awake state. Unconscious (blue bars, 0–30 s prior to stimulation), Stimulation (orange bars, duration of stimulation), post-stim1 (yellow bars, 0–30 s after electrical stimulation offset), post-stim2 (purple bars, 30–60 s after electrical stimulation offset), and post-stim3 (green bars, 60–90 s after electrical stimulation offset). Significant changes relative to Unconscious are indicated with asterisks (p<0.01, non-parametric randomization test). Mean and the bootstrap 99 percent confidence interval of the mean across neurons. PFC: prefrontal cortex; PPC: posterior parietal cortex 7A/7B; 8A: caudal lateral PFC; STG: superior temporal gyrus.
Figure 9—figure supplement 7
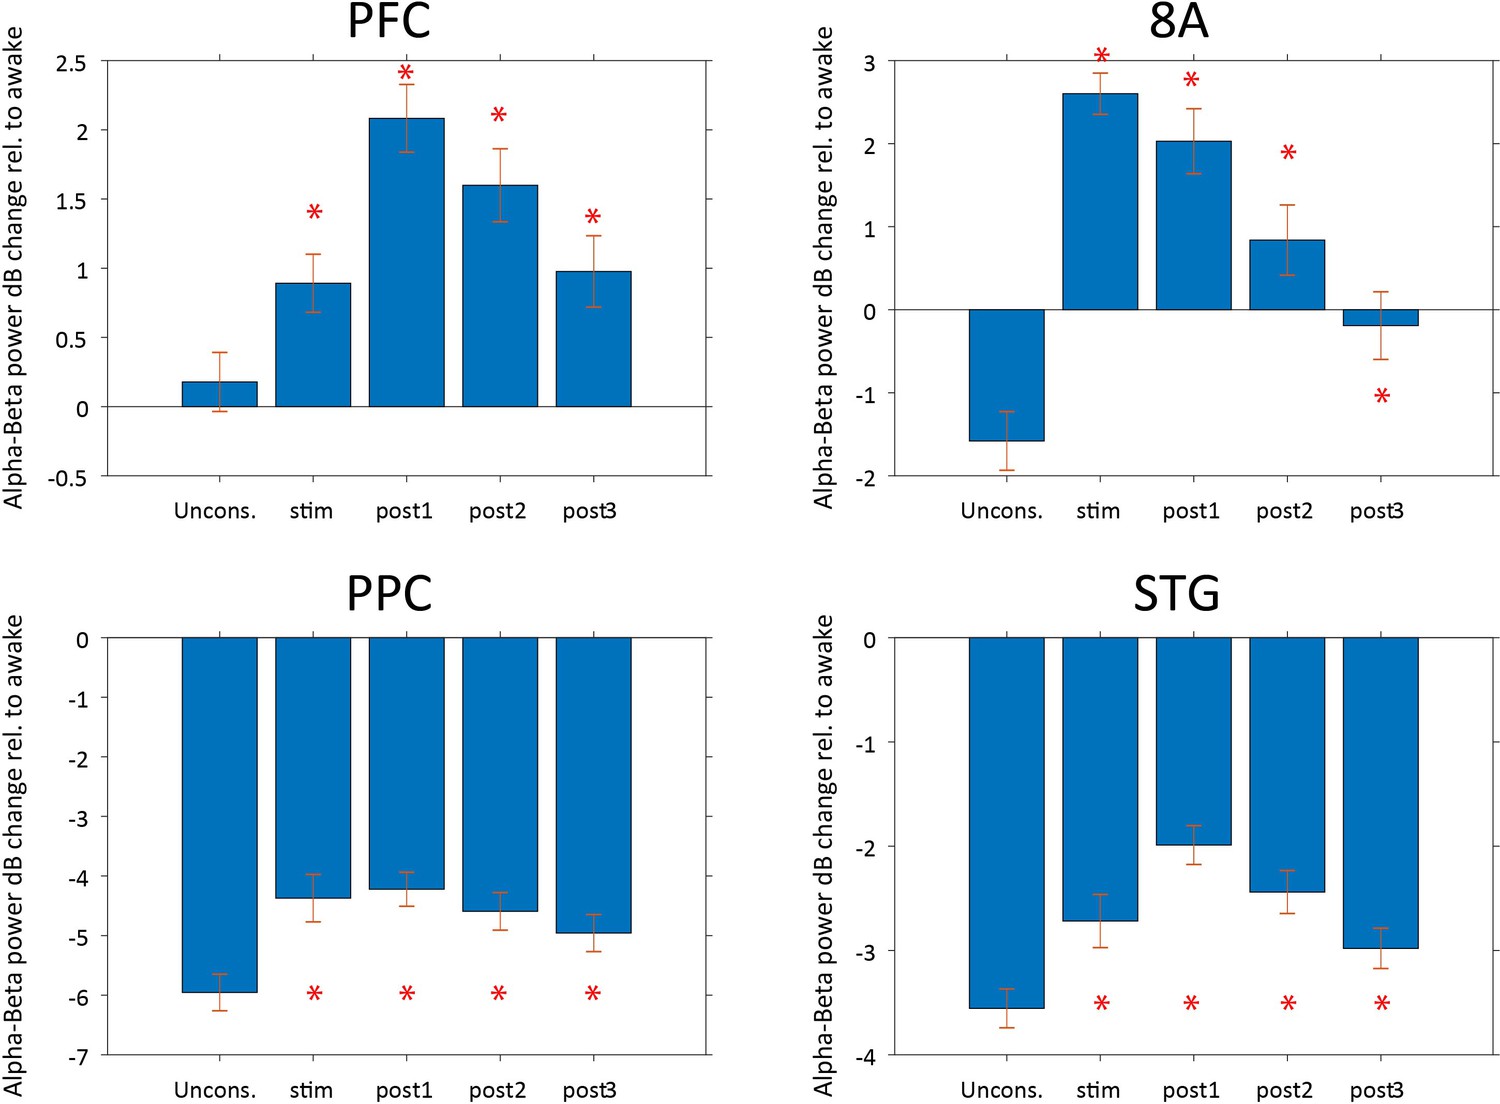
Effects of high-current thalamic electrical stimulation on alpha-beta power relative to the Awake state.
dB Change in alpha-beta power (8–25 Hz) for indicated cortical areas relative to the pre-drug Awake state. Positive values indicate increases in power relative to the Awake state. Negative values indicate decreases in power relative to the Awake state. Unconscious (0–30 s prior to stimulation), Stimulation (duration of stimulation), post-stim1 (0–30 s after electrical stimulation offset), post-stim2 (30–60 s after electrical stimulation offset), and post-stim3 (60–90 s after electrical stimulation offset). Mean ±/- 2 SEM across sessions. Significant changes relative to the pre-stim Unconscious state are indicated with asterisks (p<0.01, non-parametric randomization test). PFC: prefrontal cortex; PPC: posterior parietal cortex 7A/7B; 8A: caudal lateral PFC; STG: superior temporal gyrus.
Figure 9—figure supplement 8
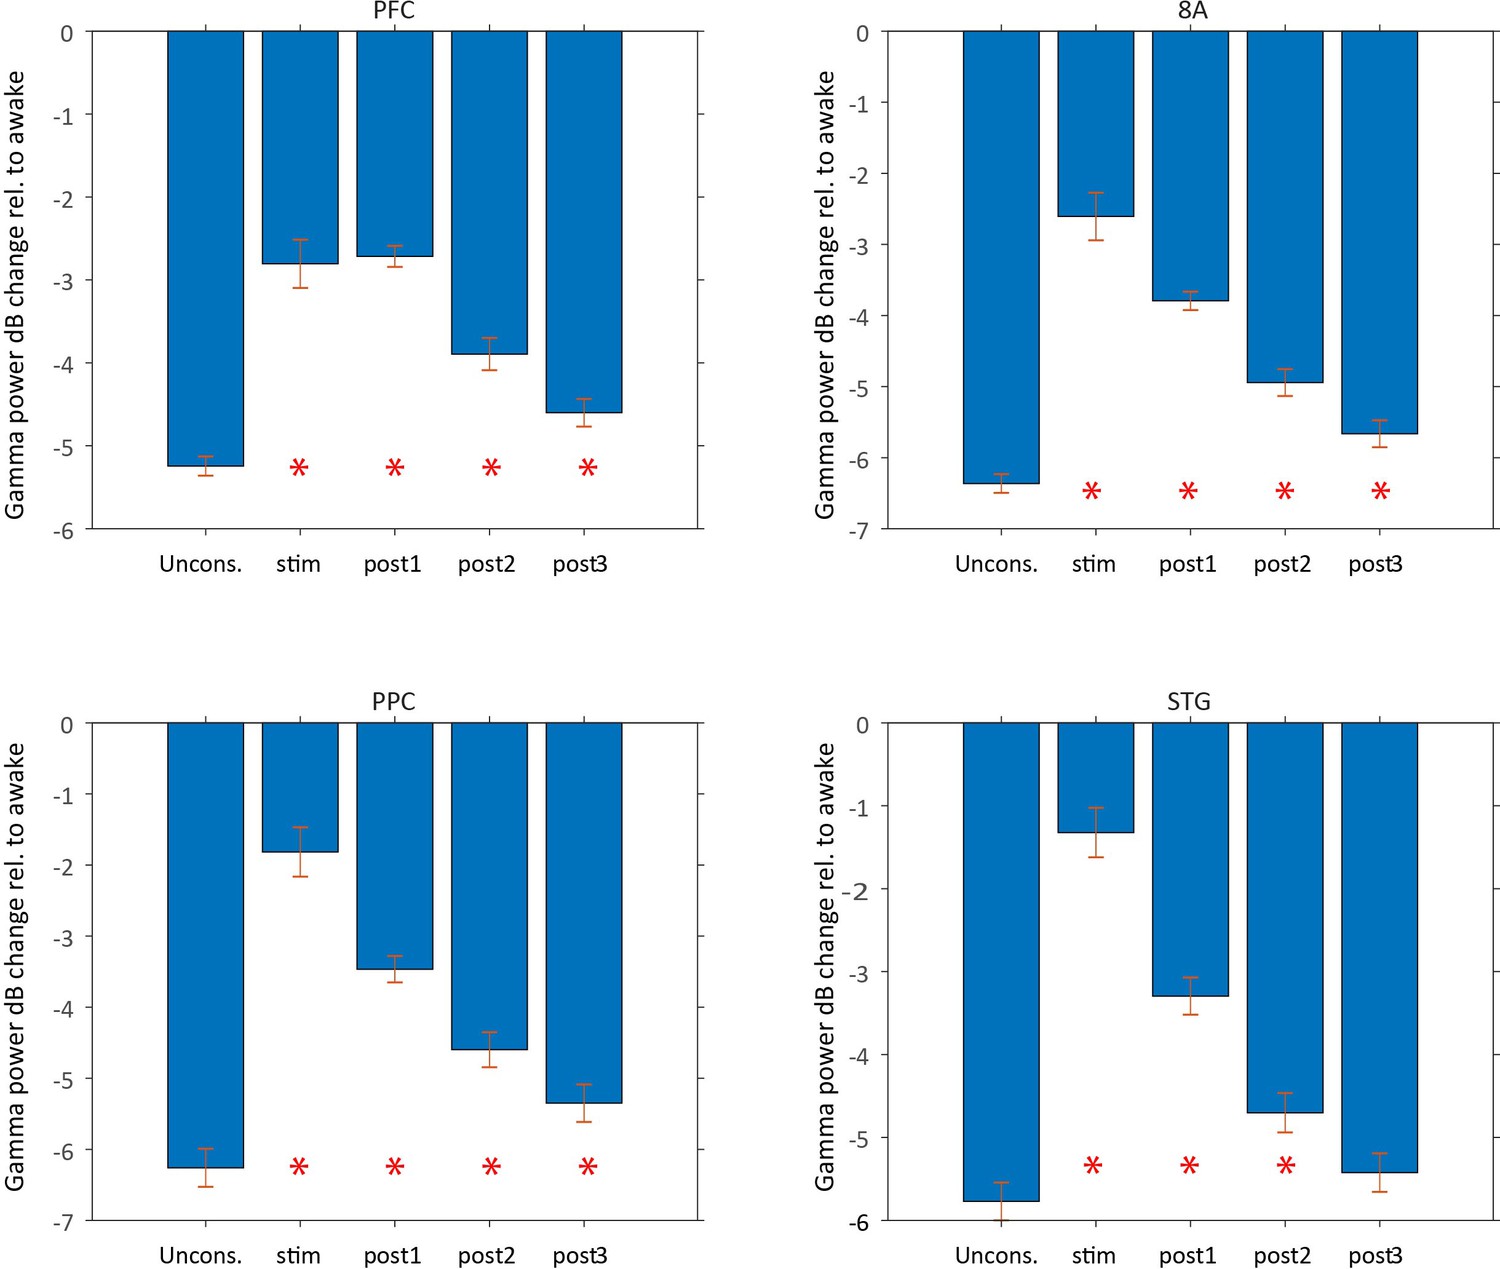
Effects of high-current thalamic electrical stimulation on gamma power relative to the Awake state.
dB Change in gamma power (40–100 Hz) for indicated cortical areas relative to the pre-drug Awake state. Negative values indicate decreases in power relative to the Awake state. Unconscious (0–30 s prior to stimulation), Stimulation (duration of stimulation), post-stim1 (0–30 s after electrical stimulation offset), post-stim2 (30–60 s after electrical stimulation offset), and post-stim3 (60–90 s after electrical stimulation offset). Mean ±/- 2 SEM across sessions. Significant changes relative to the pre-stim Unconscious state are indicated with asterisks (p<0.01, non-parametric randomization test). PFC: prefrontal cortex; PPC: posterior parietal cortex 7A/7B; 8A: caudal lateral PFC; STG: superior temporal gyrus.
Tables
Table 1
Return to Wakefulness (RTW) scores for effects of high-current thalamic stimulation on physiological measures of arousal, firing rates, and cortical power.
| Measure | Awake | Pre-stim unconscious | Stim | Post-stim1 | Post-stim2 | Post-stim3 |
|---|---|---|---|---|---|---|
| EMG variance | −100% | 0% | −2% (ns) | 0% (ns) | 0% (ns) | 0% (ns) |
| Eyeblinks | −100% | 0% | −36% (*) | −32% (*) | −7% (ns) | −2% (ns) |
| Blood oxygenation | −100% | 0% | −1% (ns) | −69% (*) | −48% (*) | −19% (ns) |
| Heart rate | −100% | 0% | −328% (*) | −362% (*) | −109% (ns) | −64% (ns) |
| Firing rate (PFC) | −100% | 0% | −6% (ns) | −16% (*) | −9% (ns) | −4% (ns) |
| Firing rate (8A) | −100% | 0% | −10% (ns) | −13% (ns) | −8% (ns) | −4% (ns) |
| Firing rate (PPC) | −100% | 0% | −33% (*) | −18% (*) | −11% (ns) | −6% (ns) |
| Firing rate (STG) | −100% | 0% | −26% (*) | −15% (ns) | −6% (ns) | −3% (ns) |
| Slow frequency power (PFC) | −100% | 0% | −45% (*) | −19% (*) | −11% (ns) | −6% (ns) |
| Slow frequency power(8A) | −100% | 0% | −65% (*) | −31% (*) | −18% (*) | −10% (*) |
| Slow frequency power (PPC) | −100% | 0% | −44% (*) | −7% (*) | −1% (ns) | −1% (ns) |
| Slow frequency power (STG) | −100% | 0% | −89% (*) | −8% (ns) | 2% (ns) | 1% (ns) |
| Beta power (PFC) | −100% | 0% | 400% (*) | 1071% (*) | 799% (*) | 449% (*) |
| Beta power (8A) | −100% | 0% | −265% (*) | −228% (*) | −153% (*) | −88% (*) |
| Beta power (PPC) | −100% | 0% | −27% (*) | −29% (*) | −23% (*) | −17% (*) |
| Beta power (STG) | −100% | 0% | −24% (*) | −44% (*) | −31% (*) | −16% (*) |
| Gamma power (PFC) | −100% | 0% | −47% (*) | −48% (*) | −26% (*) | −12% (*) |
| Gamma power (8A) | −100% | 0% | −59% (*) | −40% (*) | −22% (*) | −11% (*) |
| Gamma power (PPC) | −100% | 0% | −71% (*) | −45% (*) | −27% (*) | −15% (*) |
| Gamma power (STG) | −100% | 0% | −77% (*) | −43% (*) | −19% (*) | −6% (ns) |
-
Asterisks denote significant (p<0.01) changes from the Unconscious state.
PFC: prefrontal cortex; PPC: posterior parietal cortex 7A/7B; 8A: caudal lateral PFC; STG: superior temporal gyrus.
Table 2
Return to Wakefulness (RTW) scores for effects of high-current thalamic stimulation on LFP-LFP and spike-LFP slow-frequency phase synchronization.
| Measure | Awake | Pre-stim unconscious | Stim | Post-stim1 | Post-stim2 | Post-stim3 |
|---|---|---|---|---|---|---|
| Spike-LFP (PFC) | −100% | 0% | −24% (*) | 15% (ns) | −1% (ns) | 1% (ns) |
| Spike-LFP (8A) | −100% | 0% | 103% (*) | 96% (*) | 79% (*) | 38% (ns) |
| Spike-LFP (PPC) | −100% | 0% | −35% (*) | −8% (ns) | 6% (ns) | 12% (*) |
| Spike-LFP (STG) | −100% | 0% | −113% (*) | −16% (ns) | 24% (ns) | 29% (ns) |
| LFP-LFP (PFC-thalamus) | −100% | 0% | −77% (*) | −58% (*) | −7% (ns) | 8% (ns) |
| LFP-LFP (8A-thalamus) | −100% | 0% | −77% (*) | −71% (*) | −16% (ns) | −4% (ns) |
| LFP-LFP (PPC-thalamus) | −100% | 0% | −10% (ns) | −19% (ns) | 30% (ns) | 15% (ns) |
| LFP-LFP (STG-thalamus) | −100% | 0% | −71% (*) | −68% (*) | −27% (*) | −12% (ns) |
| LFP-LFP (PFC-8A) | −100% | 0% | −40% (*) | −25% (*) | −6% (ns) | 3% (ns) |
| LFP-LFP (PFC-PPC) | −100% | 0% | −60% (*) | 3% (ns) | 17% (ns) | 1% (ns) |
| LFP-LFP (PFC-STG) | −100% | 0% | −45% (*) | −11% (ns) | 6% (ns) | 36% (*) |
| LFP-LFP (8A-PPC) | −100% | 0% | −29% (*) | −13% (ns) | −7% (ns) | 8% (ns) |
| LFP-LFP (8A-STG) | −100% | 0% | −63% (*) | −41% (*) | −8% (ns) | 11% (ns) |
| LFP-LFP (PPC-STG) | −100% | 0% | 29% (*) | 5% (ns) | 9% (ns) | 4% (ns) |
-
Asterisks denote significant (p<0.01) changes from the Unconscious state.
PFC: prefrontal cortex; PPC: posterior parietal cortex 7A/7B; 8A: caudal lateral PFC; STG: superior temporal gyrus; LFP: local field potentials.
Additional files
Download links
A two-part list of links to download the article, or parts of the article, in various formats.
Downloads (link to download the article as PDF)
Open citations (links to open the citations from this article in various online reference manager services)
Cite this article (links to download the citations from this article in formats compatible with various reference manager tools)
Neural effects of propofol-induced unconsciousness and its reversal using thalamic stimulation
eLife 10:e60824.
https://doi.org/10.7554/eLife.60824


