Modulation of sleep-courtship balance by nutritional status in Drosophila
- Department of Neuroscience, Farber Institute for Neurosciences, Thomas Jefferson University, United States
- Life and Health Sciences Research Institute (ICVS), School of Health Sciences, University of Minho, Portugal
- ICVS/3B’s, PT Government Associate Laboratory, Portugal
Figures
Figure 1 with 3 supplements
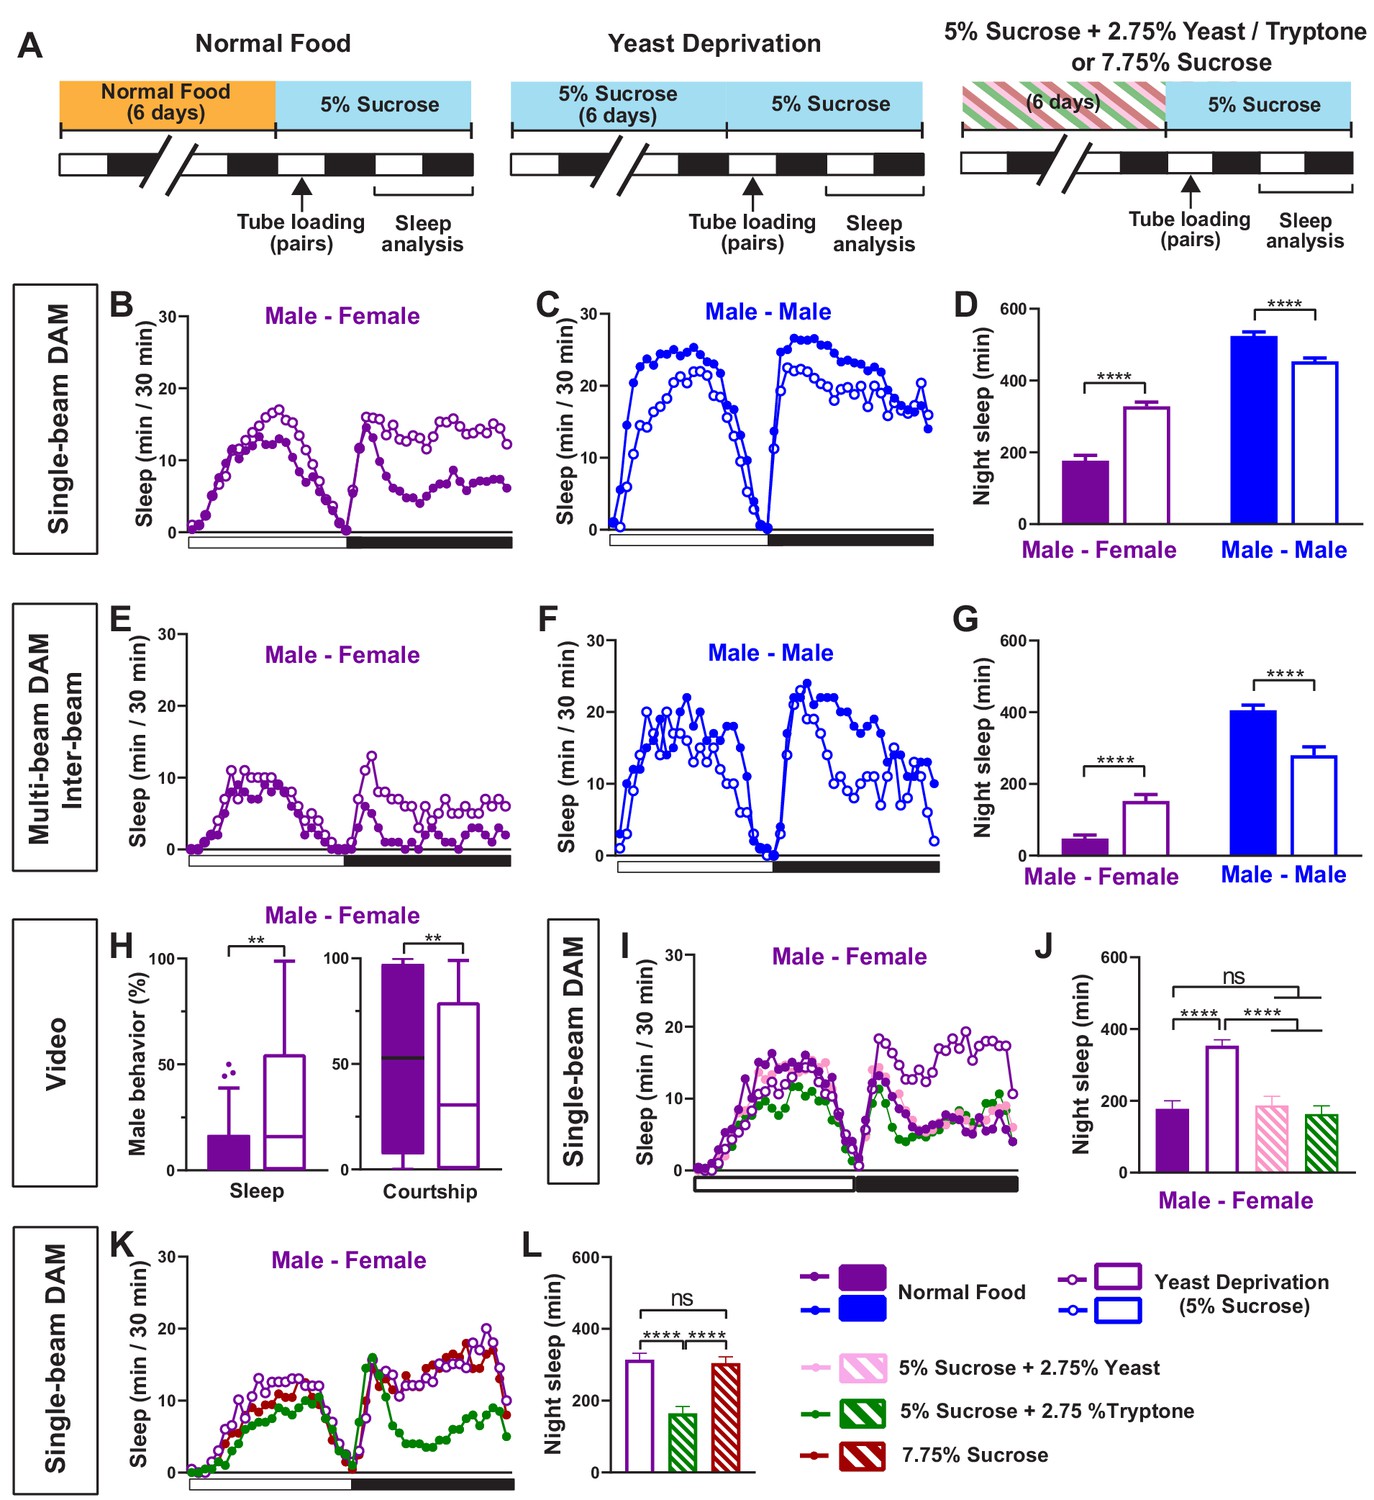
Yeast deprivation modulates the balance between sleep and courtship.
(A) Schematic diagram of the experimental design. After 6 days in varying nutritional conditions as indicated, flies were loaded into tubes containing 5% sucrose in male-male (MM) or male-female (MF) pairs. (B–C) Sleep profile in 30 min intervals for MF (B) or MM (C) pairs in the normal food or yeast deprivation condition measured using single-beam monitors. N = 82–90. (D) Nighttime sleep for flies shown in (B) and (C). (E–F) Sleep profile in 30 min intervals for MF (E) or MM (F) pairs in the normal food or yeast deprivation condition measured using multi-beam monitors. Sleep was computed based on inter-beam movements, that is, movements between adjacent beams. N = 13–32. (G) Nighttime sleep for flies shown in (E) and (F). (H) Percent of time spent sleeping or courting for males in the normal food or yeast-deprived condition. Both groups of males were paired with normally fed females. The first 5 min of every h between Zeitgeber time (ZT) 18–24 were manually scored from videos. Tuckey’s method is used for boxplots; boxes extend from the 25th to 75th percentiles, and whiskers extend from the lowest to the highest value within ±1.5 times the interquartile range. Data points above the whiskers are drawn as individual dots. N = 49–50. (I) Sleep profile of MF pairs in the normal food, 5% sucrose (yeast deprivation), 5% sucrose + 2.75% yeast, and 5% sucrose + 2.75% tryptone conditions. The single-beam DAM system was used to measure sleep. N = 45–48. (J) Nighttime sleep for flies shown in (I). (K) Sleep profile of MF pairs in 5% sucrose (yeast deprivation), 5% sucrose + 2.75% tryptone (tryptone supplemented), and 7.75% sucrose conditions. The tryptone supplemented and 7.75% sucrose conditions are equivalent in caloric content. The single-beam DAM system was used to measure sleep. N = 60–64. (L) Nighttime sleep for flies shown in (K). Iso31 flies were used in all panels. In (B–D), MM and MF pairs were composed of flies from the same nutritional condition. In (E–L) and subsequent figures, 4- to 5-day-old normally fed males and females were used as partners for males from different nutritional conditions. In this and subsequent figures, bar graphs represent mean ± SEM and the white and black bars in the experimental design and below the x-axis in sleep profile graphs indicate light and dark periods, respectively. **p<0.01, ***p<0.001, ****p<0.0001 and ns: not significant, two-way ANOVA, p<0.0001 for the interaction between sex and nutritional condition, followed by Sidak post-hoc test (D, G); Mann-Whitney test (H); one-way ANOVA followed by Tukey post-hoc test (J, L).
Figure 1—figure supplement 1
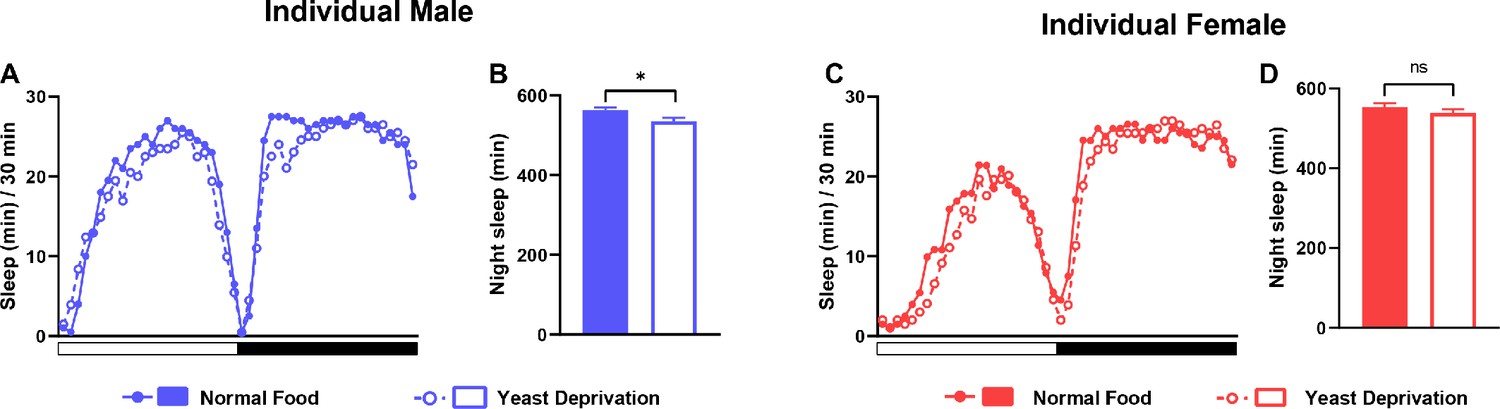
Yeast deprivation does not promote sleep in individual flies.
(A) Sleep profile in 30 min intervals for individual males from the normal food or yeast deprivation condition (see Figure 1A). N = 62. (B) Nighttime sleep for the flies shown in (A). (C) Sleep profile in 30 min intervals for individual females from the normal food or yeast deprivation condition. N = 61. (D) Nighttime sleep for the flies shown in (C). *p<0.05, ns: not significant, unpaired t test.
Figure 1—figure supplement 2
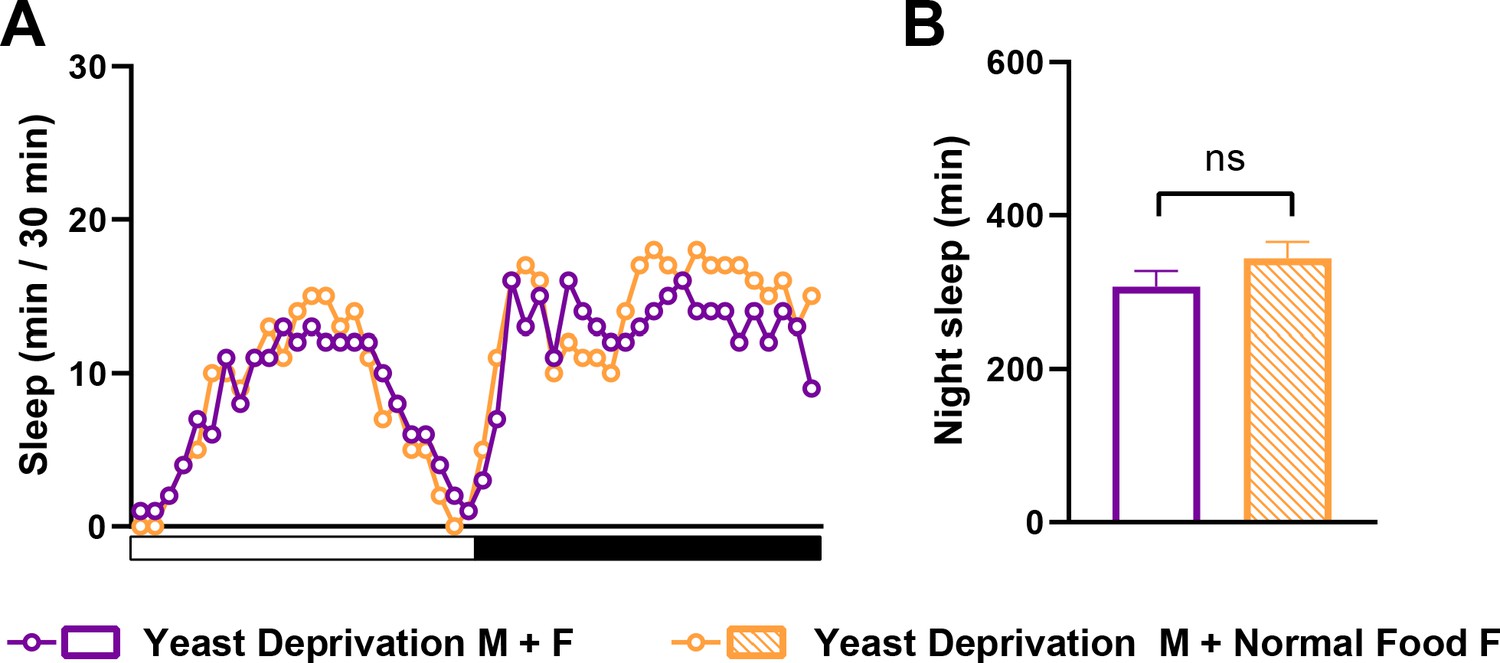
Yeast deprivation effects on sleep in MF pairs are independent of the nutritional condition of the female.
(A) Sleep profile in 30 min intervals for MF pairs in which yeast-deprived males were paired with either yeast-deprived females (Yeast Deprivation M + F) or normally fed females (Yeast Deprivation M + Normal Food F). N = 24–25. (B) Nighttime sleep for the flies shown in (A). ns: not significant, unpaired t test.
Figure 1—figure supplement 3
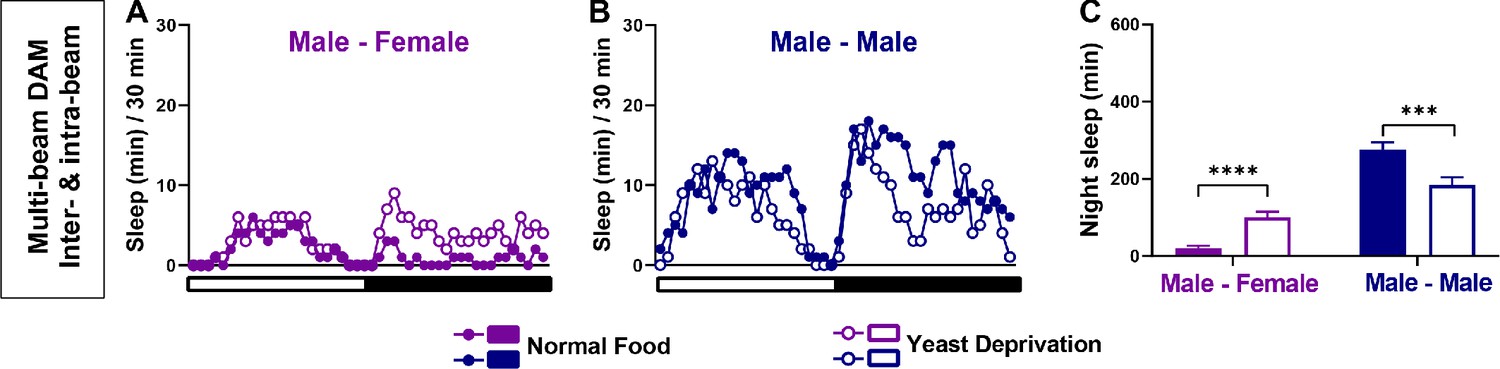
Yeast deprivation modulates the balance between sleep and courtship: multi-beam data including local movements.
(A–B) Sleep profile in 30 min intervals for MF (A) or MM (B) pairs in the normal food or yeast deprivation condition shown in Figure 1E–F. Sleep was analyzed based on combined inter-beam (movement across beams) and intra-beam movements (local movements within a single beam) using multi-beam monitors. (C) Nighttime sleep for flies shown in (A) and (B). ***p<0.001, ****p<0.0001, two-way ANOVA, p<0.0001 for the interaction between sex and nutritional condition, followed by Sidak post-hoc test.
Figure 2
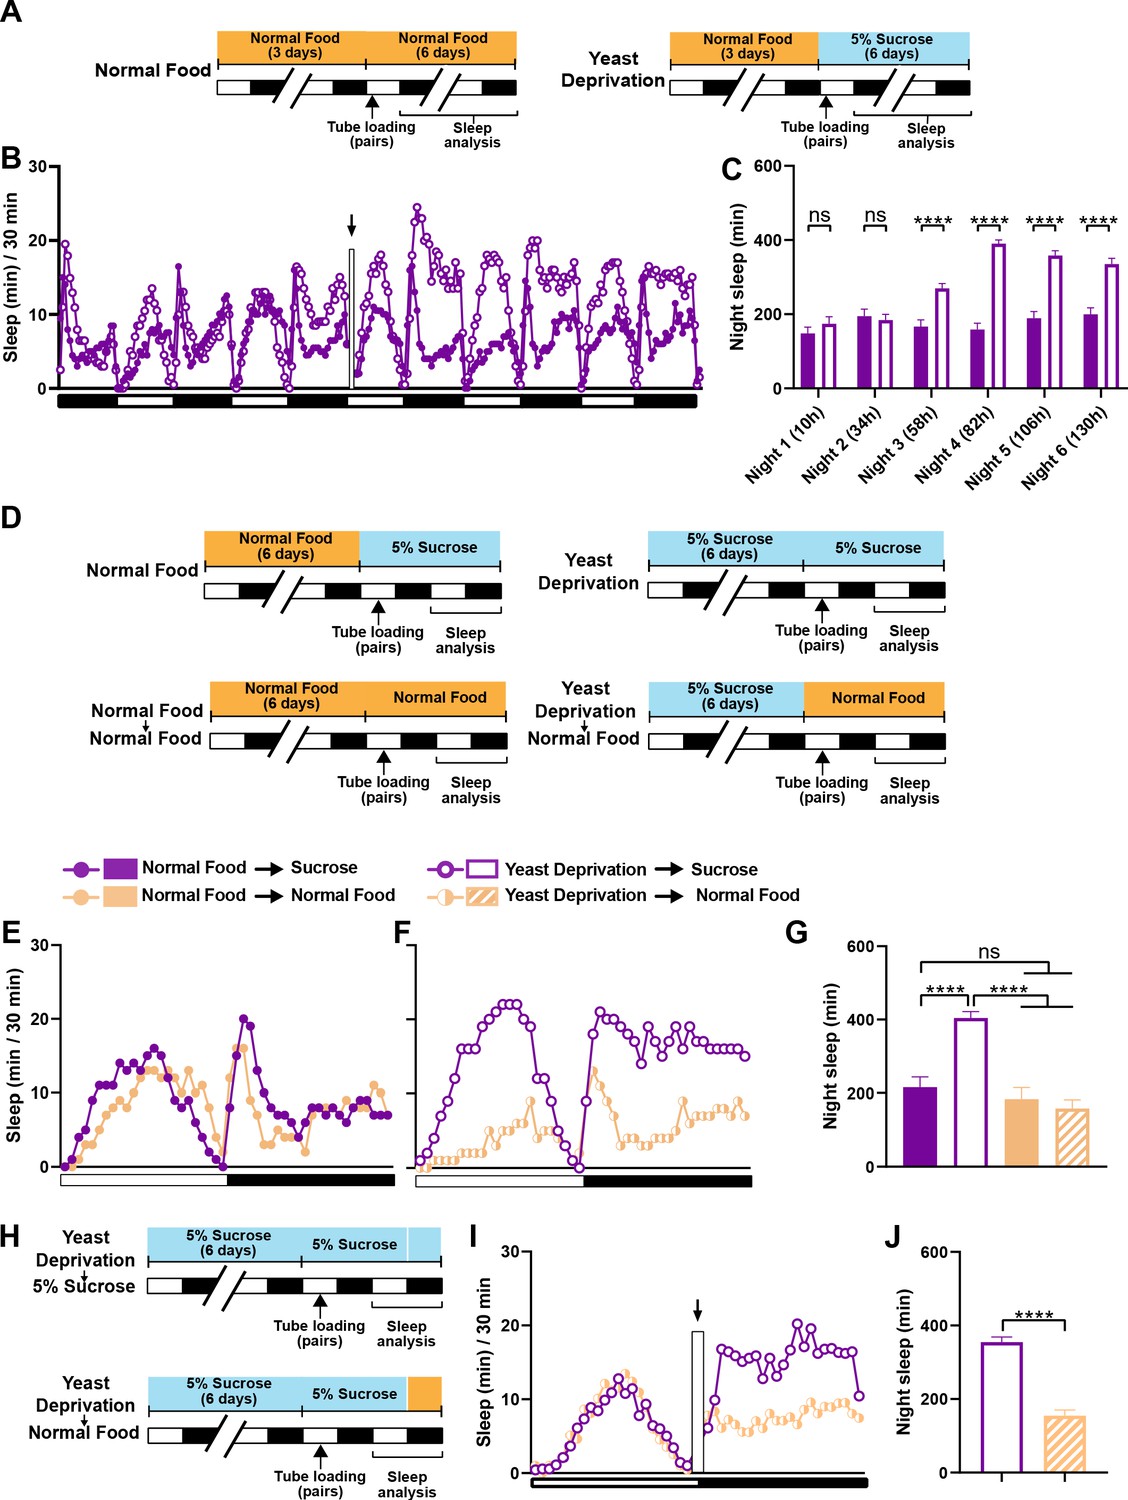
The effects of yeast deprivation on male sleep develop over multiple days but can be reversed within a few hours.
(A) Schematic diagram of the experimental design for (B) and (C). Normally fed MF pairs were loaded into tubes containing 5% sucrose or normal food between ZT 1–2, and sleep was assayed for six nights, starting at ZT 12 on the loading day. (B) Sleep profile in 30 min intervals for normally fed MF pairs loaded into tubes containing either 5% sucrose food or normal food. Flies were transferred to new tubes after 3 days to circumvent the potential problem of larval movements interfering with sleep measurements. The rectangle and arrow indicate the time of transfer. N = 59–60. (C) Nighttime sleep for the flies shown in (B) Time from loading until the begining of each night is indicated in parentheses. (D) Schematic diagram of the experimental design for (E), (F) and (G). After 6 days in the indicated nutritional conditions, MF pairs were loaded into tubes containing either 5% sucrose or normal food. (E) Sleep profile in 30 min intervals for MF pairs in the normal food condition loaded into tubes containing either 5% sucrose food or normal food. (F) Sleep profile in 30 min intervals for MF pairs in the yeast deprivation condition loaded into tubes containing either 5% sucrose food or normal food. N = 31–32. (G) Nighttime sleep for the flies shown in (E) and (F). (H) Schematic diagram of the experimental design for (I) and (J). MF pairs yeast-deprived for 6 days were loaded into tubes containing 5% sucrose. Flies were transferred to tubes containing either 5% sucrose or normal food at ZT 12 on the following day. (I) Sleep profile in 30 min intervals for yeast-deprived MF pairs transferred into tubes containing either 5% sucrose food or normal food. The rectangle and arrow indicate the time of transfer. N = 51–54. (J) Nighttime sleep for the flies shown in (I). Iso31 flies were used in all panels. ****p<0.0001 and ns: not significant, two-way ANOVA followed by Sidak post hoc test (C), one-way ANOVA followed by Tukey post hoc test (G), unpaired t-test (J).
Figure 3

Yeast deprivation does not impair the ability of male flies to perform reproductive behaviors.
(A) Schematic diagram of the experimental design. After 7 days in indicated nutritional conditions, males were paired with virgin females in an arena containing 5% sucrose. (B–D) Courtship index (B), latency to court (C), and latency to copulation (D) in males in the normal food or yeast deprivation condition. N = 19–21. Courtship/mating assay was performed between ZT 1–4. Iso31 flies were used in all panels. ns: not significant, unpaired t-test (B); log-rank test (C, D).
Figure 4

Yeast deprivation and inhibition of dopamine signaling impairs the wake-promoting effects of P1 activation, and trans-Tango tracing identifies potential downstream targets of P1 neurons.
(A) Schematic diagram of the experimental design for (B) and (C). (B) Sleep profiles in 30 min intervals for experimental (P1 >TrpA1) and parental control (P1-spG4 / + and UAS-TrpA1 / +) males in normal food or yeast deprivation conditions, loaded into tubes containing normal food or 5% sucrose, respectively. N = 29–32. TrpA1 was activated by raising the temperature from 22°C to 29°C. (C) Daytime and nighttime sleep change (sleep at 29°C – baseline sleep at 22°C) for flies shown in (B). (D) Confocal projection of an adult male brain in which trans-Tango was driven by P1 split Gal4 (spG4). Presynaptic P1 neurons express myrGFP (green) and postsynaptic targets express mtdTomato (red). Right image shows a magnification of the PB region, with postsynaptic neurons that innervate the PB. Arrows indicate descending projections used to identify DA-PB neurons. Scale bar represents 50 μm. (E) Sleep profiles in 30 min intervals for experimental (P1 >TrpA1) and parental control (P1-spG4 / + and UAS-TrpA1 / +) male flies. Flies were raised on normal food and individually loaded into tubes containing 5% sucrose supplemented with vehicle (propionic acid) or 3IY (inhibitor of dopamine synthesis). N = 40–48. TrpA1 was activated by raising the temperature from 22°C to 28°C. (G) Daytime and nighttime sleep change (sleep at 28°C – baseline sleep at 22°C) for flies shown in (F). ***p<0.001, ****p<0.0001, ns: not significant, two-way ANOVA, followed by Tukey post-hoc test (C) and (G); p<0.0001 for the interaction between genotype and nutritional condition (C); p<0.0001 for the interaction between genotype and drug condition (G).
Figure 5 with 1 supplement
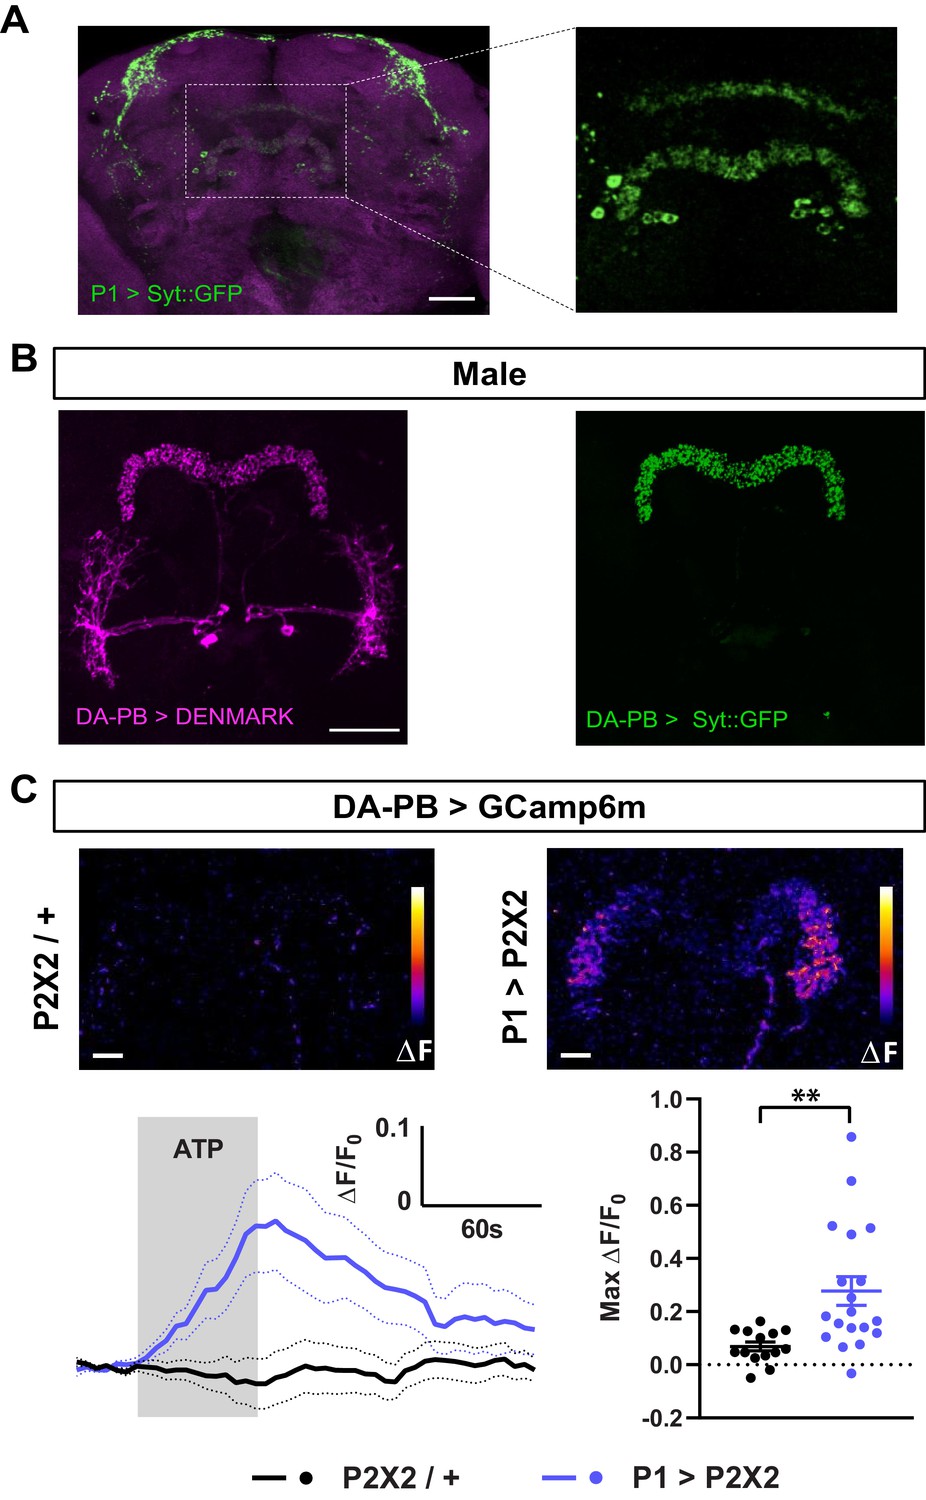
Dopaminergic neurons projecting to the protocerebral bridge (DA-PB) act downstream of male-specific P1 neurons.
(A) Confocal projection of an adult male brain in which Syt::GFP was driven by P1-spG4. Anti-Bruchpilot (BRP, magenta) was used to localize neuropil regions. The image on the right shows a magnification of the PB region, which contains presynaptic terminals from P1 neurons. (B) Confocal projection of an adult male brain in which DenMark (postsynaptic marker, left) and Syt::GFP (presynaptic marker, right) are expressed in DA-PB neurons. Both postsynaptic and presynaptic makers are expressed in the PB region. (C) Increase in GCaMP6m signal (ΔF) in the PB projections of DA-PB neurons upon perfusion with ATP of a male brain expressing P2X2 in P1 neurons (P1 >P2X2, top right) or a genetic control (P2X2/+, top left). Fluorescence traces (bottom left) and peak responses (bottom right) for normalized GCaMP6m response (ΔF/F0) in the PB projections of DA-PB neurons in response to P1 activation (blue, P1 >P2X2) compared with the genetic control (black, P2X2/+). R71G01-lexA was used to express P2X2 in P1 neurons and SS52578 spG4 was used to express GCaMP6m in DA-PB neurons. Grey rectangle indicates 2.5 mM ATP perfusion. N = 14–19. Scale bars represent 50 μm in (A–B) and 10 μm in (C). **p<0.01, unpaired t-test with Welch’s correction for unequal variances.
Figure 5—figure supplement 1
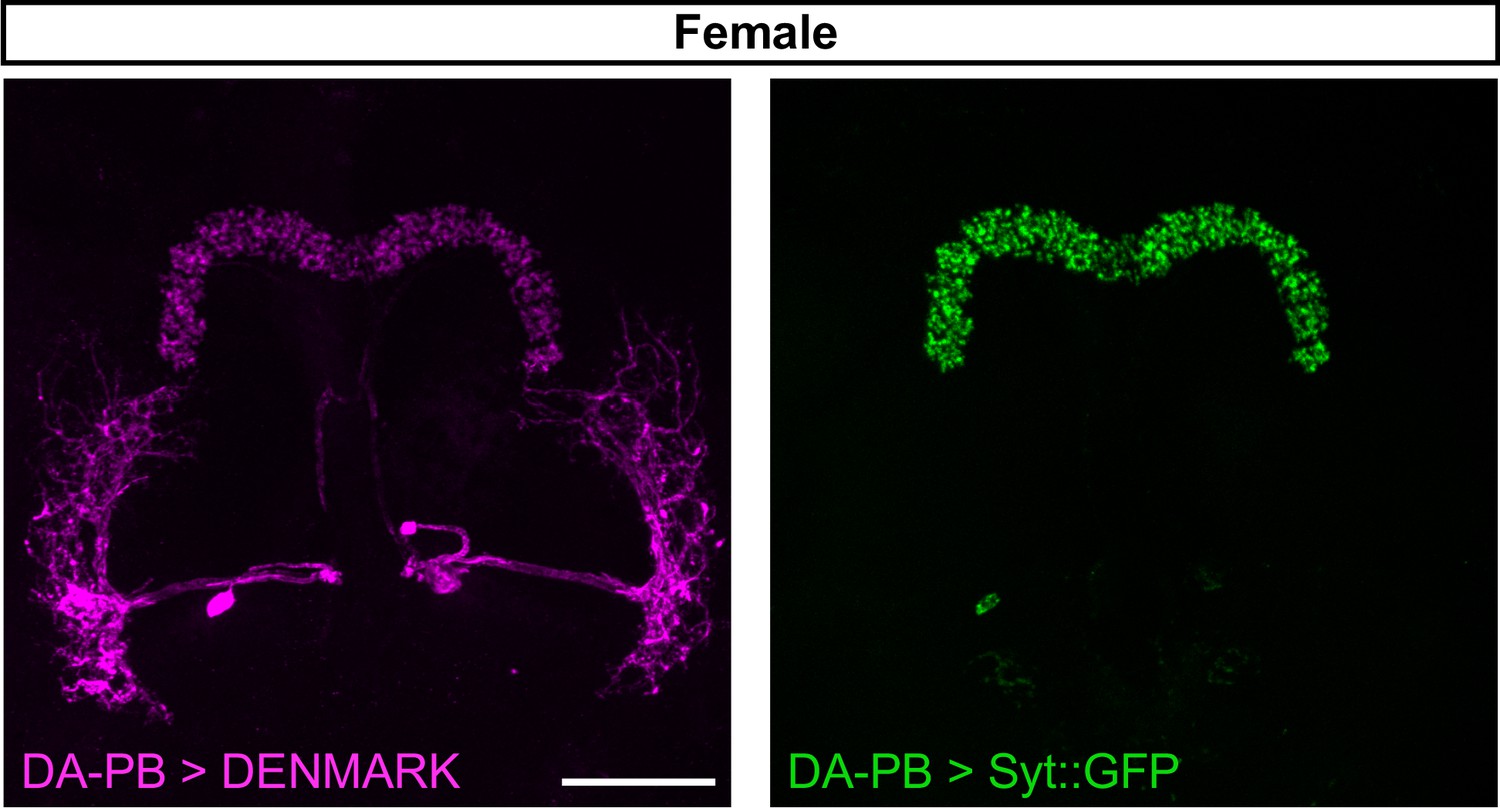
Female DA-PB neurons show similar projection patterns as male counterparts.
Confocal projection of an adult female brain in which DenMark (postsynaptic marker, left) and Syt::GFP (presynaptic marker, right) are expressed in DA-PB neurons. Both postsynaptic and presynaptic makers are expressed in the PB region. Scale bars represent 50 μm.
Figure 6
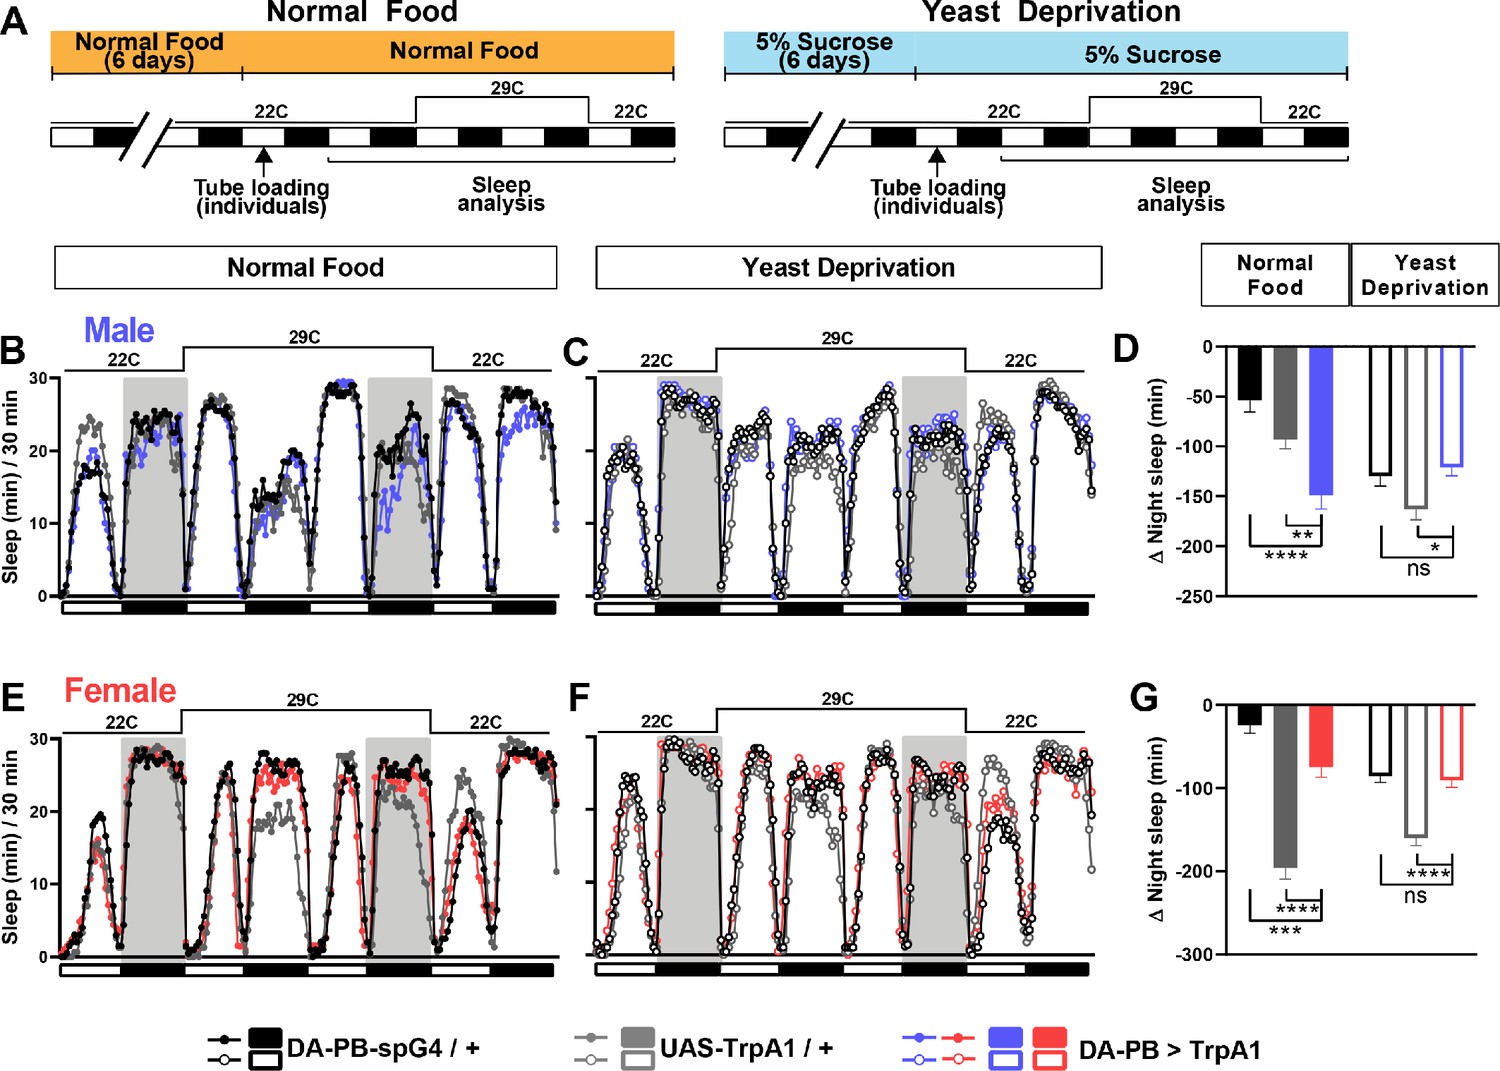
DA-PB neurons regulate male sleep in a nutrition-dependent manner.
(A) Schematic diagram of the experimental design. After 6 days in vials containing normal food or 5% sucrose food, male and female flies were loaded individually into tubes. (B–C) Sleep profiles in 30 min intervals for experimental (DA-PB >TrpA1) and parental control (DA-PB-spG4 / + and UAS-TrpA1 / +) male flies in the normal food (B) or yeast deprivation (C) condition. N = 59–62. TrpA1 was activated by raising the temperature from 22°C to 29°C. (D) Nighttime sleep change (sleep during the second night at 29°C – baseline night sleep at 22°C) for the flies shown in (B) and (C). (E–F). Sleep profiles in 30 min intervals of experimental (DA-PB >TrpA1) and parental control (DA-PB-spG4 / + and UAS-TrpA1 / +) female flies in the normal food (E) and yeast deprivation (F) condition. N = 48–56. (G) Nighttime sleep change for the flies shown in (E) and (F). ***p<0.001, ****p<0.0001 and ns: not significant, two-way ANOVA, p<0.0001 for the interaction between genotype and nutritional condition, followed by Tukey post-hoc test (C–F).
Figure 7 with 1 supplement
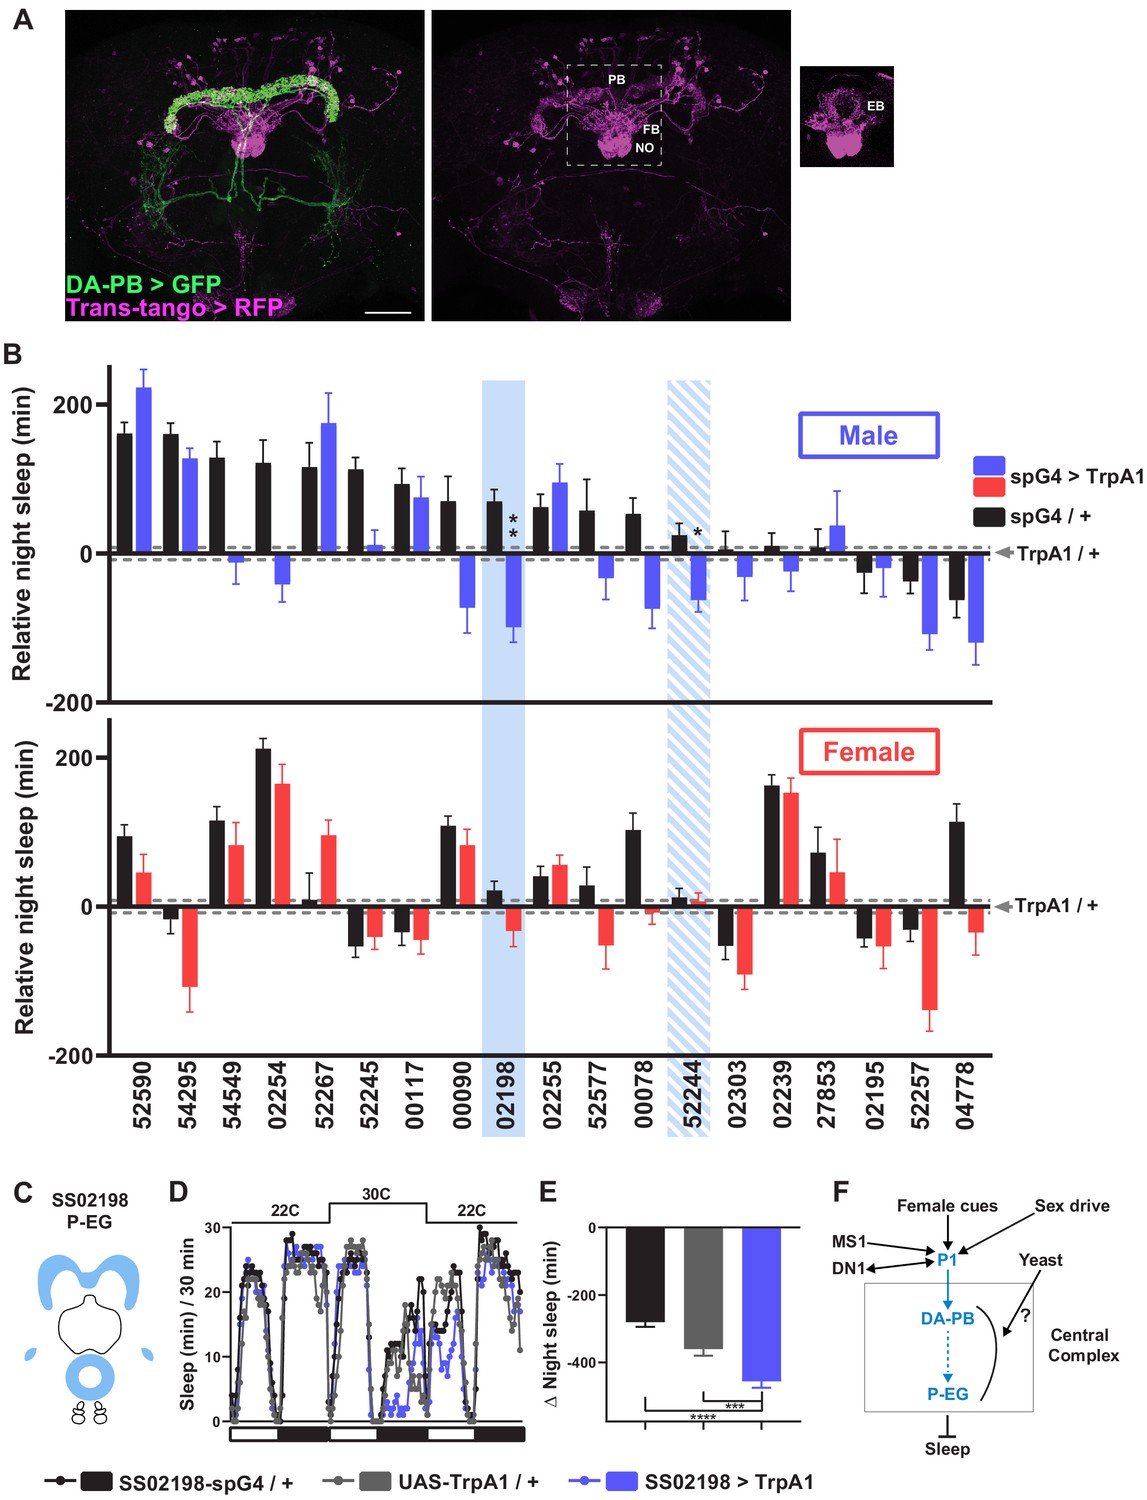
A screen identifies additional PB-projecting neurons that regulate sleep.
(A) Confocal projection of an adult male brain in which trans-Tango was driven by the SS52578 DA-PB spG4 driver. Presynaptic DA-PB neurons express MyrGFP (green) and postsynaptic targets express mtdTomato (red). Postsynaptic targets were detected in the PB, FB, and NO (middle panel) as well as in the EB (right panel; since expression in the EB was masked in the full projection, only two image slices were included in the projection). Scale bar: 50 μm. (B) Nighttime sleep in individual, normally fed males (top) and females (bottom) in response to activation of various neuronal groups projecting to the PB. TrpA1 was activated by raising the temperature from 22°C to 30°C. Labels on the X-axis refer to the identity of the SS spG4 lines from the Rubin lab spG4 collection. The difference in nighttime sleep for each spG4 line with respect to the UAS-TrpA1 control is plotted. Blue and red bars represent male and female experimental groups (spG4 >TrpA1), respectively, and black bars represent the Gal4 control (spG4 / +). Dashed grey lines indicate the SEM of the UAS-TrpA1 / + control. N = 144–148 for UAS-TrpA1 / + controls, and N = 15–52 for experimental groups and Gal4 / + controls. Blue rectangles highlight spG4 lines associated with significant sleep changes in males relative to both controls. The solid rectangle represents a spG4 line confirmed in a re-test, whereas the striped rectangle represents a line not confirmed in a re-test. None of the sleep changes in females were significant relative to both controls. For simplicity, non-significant differences are not indicated. (C) Schematic diagrams of the expression pattern of the SS02198 spG4 driver (based on Wolff and Rubin, 2018). (D) Sleep profiles in 30 min intervals for experimental (SS02198 >TrpA1) and parental control (SS02198-spG4 / + and UAS-TrpA1 / +) males. Normally fed flies were loaded into tubes with 5% sucrose. TrpA1 was activated by raising the temperature from 22°C to 30°C. N = 27–32. (E) Nighttime sleep change (sleep at 30°C – baseline sleep at 22°C) for the flies shown in (D). *p<0.05, **p<0.01, ***p<0.001, Brown-Forsythe and Welch ANOVA for unequal variances followed by Dunnett T3 post hoc test (B), one-way ANOVA followed by Dunnet post hoc test (D). (F) A working model of the neural mechanisms integrating sleep drive, sex drive, and yeast hunger in Drosophila males. Previous studies have shown that P1 neurons integrate female and male pheromonal cues from multiple FruM-expressing neuronal clusters (Kohatsu et al., 2011; Stockinger et al., 2005), octopaminergic arousal signal from MS1 neurons (Machado et al., 2017), and circadian information from DN1 clock neurons (Chen et al., 2017). Current work suggests that DA-PB neurons act downstream of P1 neurons and upstream of P-EG neurons to promote wakefulness in a male-specific and nutrition-dependent manner.
Figure 7—figure supplement 1
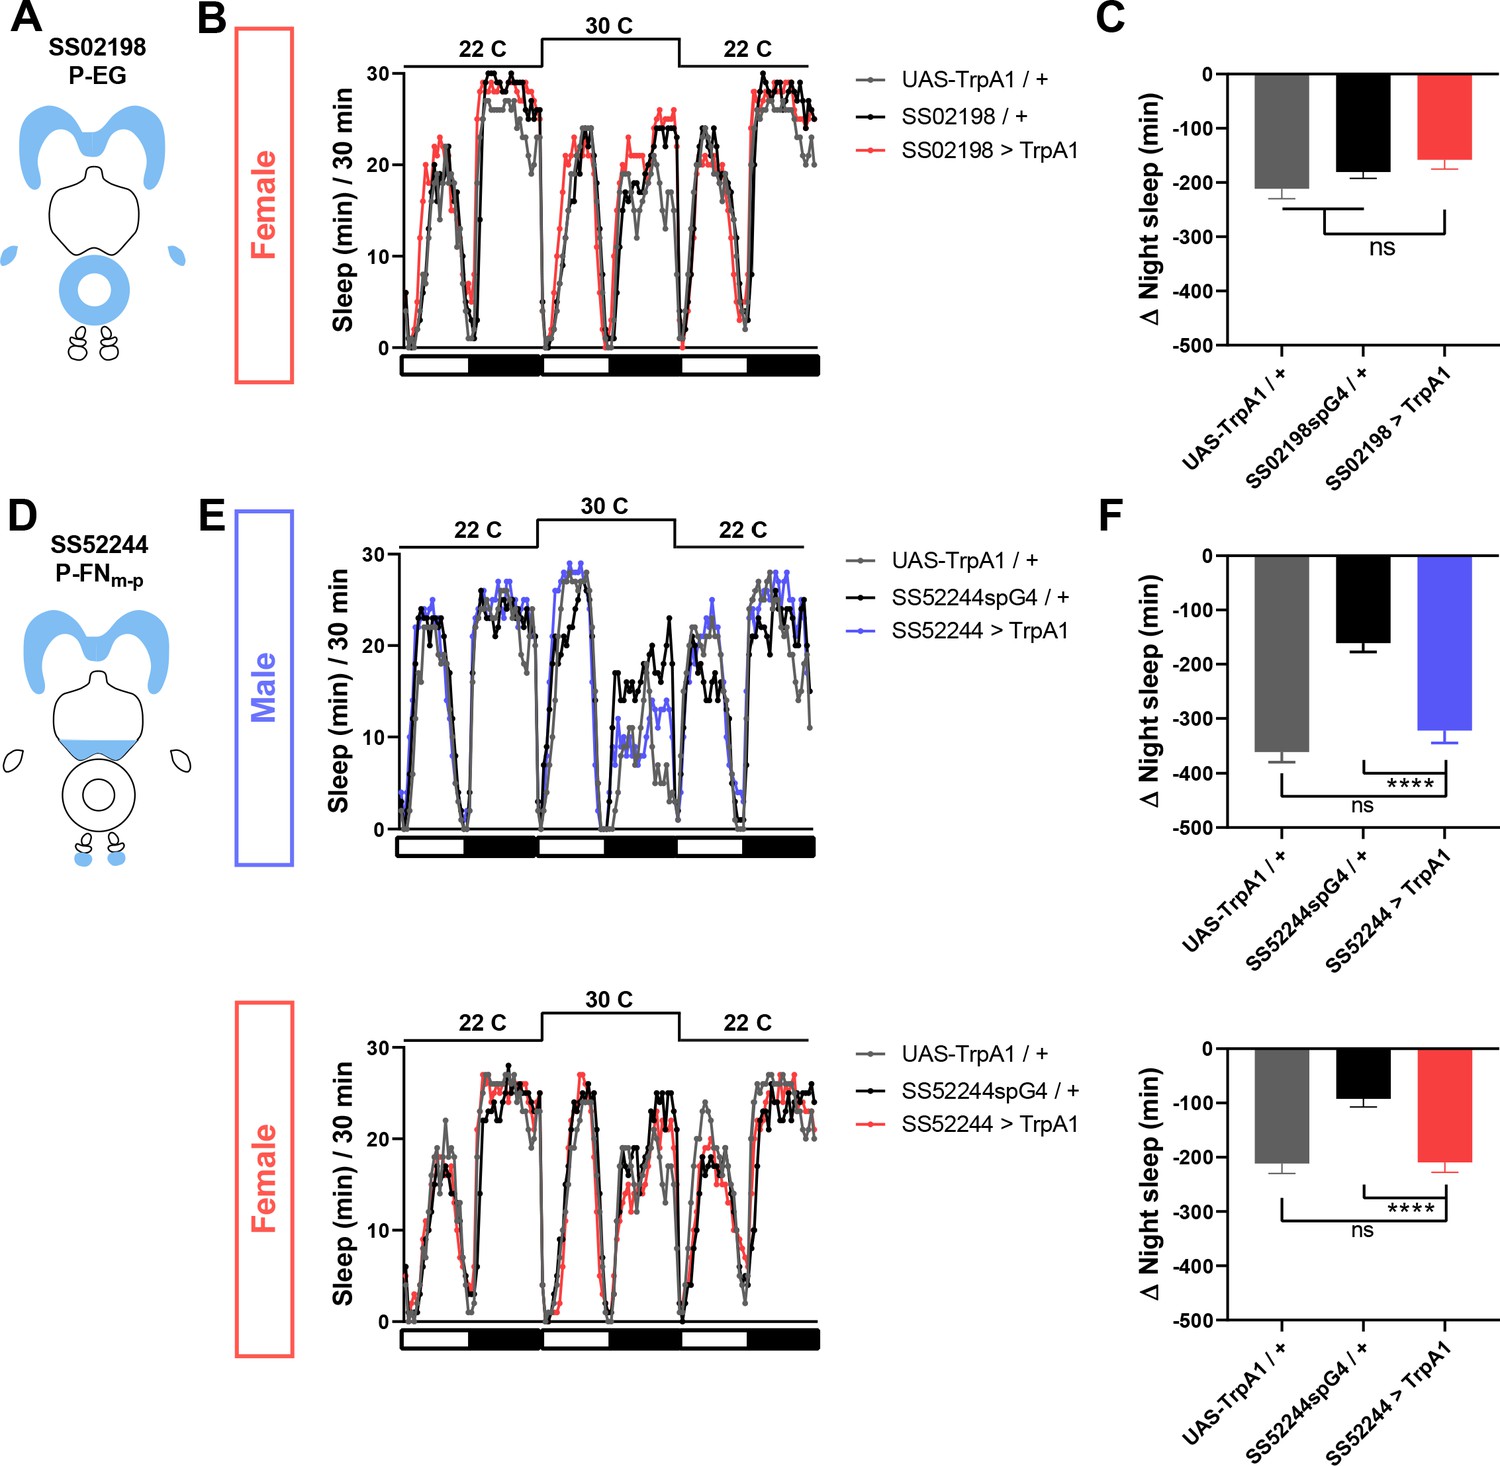
P-EG activation does not affect female sleep, and P-FNm-p activation has little effect on sleep in males and females.
(A) Schematic diagrams of the expression pattern of the SS02198 spG4 driver. (B) Sleep profiles in 30 min intervals for experimental (SS02198 >TrpA1) and parental control (SS02198-spG4 / + and UAS-TrpA1 / +) female flies. Normally fed flies were loaded into tubes with 5% sucrose. TrpA1 was activated by raising the temperature from 22°C to 30°C. N = 31. (C) Nighttime sleep change (sleep at 30°C – baseline sleep at 22°C) for the flies shown in (B). (D) Schematic diagrams of the expression pattern of the SS52244 spG4 driver. (E) Sleep profiles in 30 min intervals for experimental (SS52244 >TrpA1) and parental control (SS52244-spG4 / + and UAS-TrpA1 / +) flies. TrpA1 was activated by raising the temperature from 22°C to 30°C. N = 30–32 for males and 20–32 for females. (F) Nighttime sleep change (sleep at 30°C – baseline sleep at 22°C) for the flies shown in (E). ns: not significant, one-way ANOVA followed by Dunnet post-hoc test.
Videos
Video 1
Male-female pairs at ZT 20 under infrared light.
Normally fed or yeast-deprived iso31 males were paired with normally fed female partners. While most normally fed males were courting, the majority of yeast-deprived males were inactive.
Tables
Key resources table
| Reagent type (species) or resource | Designation | Source or reference | Identifiers | Additional information |
|---|---|---|---|---|
| Genetic reagent (D. melanogaster) | GMR71G01-LexA | Bloomington Drosophila Stock Center | BDSC #54733 | |
| Genetic reagent (D. melanogaster) | UAS-TrpA1 | Bloomington Drosophila Stock Center | BDSC #26263 | |
| Genetic reagent (D. melanogaster) | lexAop-P2X2 | Bloomington Drosophila Stock Center | BDSC #76030 | |
| Genetic reagent (D. melanogaster) | UAS-GCaMP6m | Bloomington Drosophila Stock Center | BDSC #42750 | |
| Genetic reagent (D. melanogaster) | UAS-Syt::GFP | Bloomington Drosophila Stock Center | BDSC #6925 | |
| Genetic reagent (D. melanogaster) | UAS-Denmark | Bloomington Drosophila Stock Center | BDSC #33061 | |
| Genetic reagent (D. melanogaster) | trans-Tango;UAS-myrGFP,QUAS-mtdTomato-3xHA | Bloomington Drosophila Stock Center | BDSC #77124 | |
| Genetic reagent (D. melanogaster) | Iso31 (w1118) | Bloomington Drosophila Stock Center | BDSC #3605 | |
| Genetic reagent (D. melanogaster) | P1-split Gal4 | David Anderson | Inagaki et al., 2014 | |
| Genetic reagent (D. melanogaster) | PB Split-Gal4 line, SS52578 | Janelia Research Campus | Wolff and Rubin, 2018 | |
| Genetic reagent (D. melanogaster) | PB Split-Gal4 line, SS54295 | Janelia Research Campus | Wolff and Rubin, 2018 | |
| Genetic reagent (D. melanogaster) | PB Split-Gal4 line, SS52590 | Janelia Research Campus | Wolff and Rubin, 2018 | |
| Genetic reagent (D. melanogaster) | PB Split-Gal4 line, SS52245 | Janelia Research Campus | Wolff and Rubin, 2018 | |
| Genetic reagent (D. melanogaster) | PB Split-Gal4 line, SS02254 | Janelia Research Campus | Wolff and Rubin, 2018 | |
| Genetic reagent (D. melanogaster) | PB Split-Gal4 line, SS52267 | Janelia Research Campus | Wolff and Rubin, 2018 | |
| Genetic reagent (D. melanogaster) | PB Split-Gal4 line, SS02255 | Janelia Research Campus | Wolff and Rubin, 2018 | |
| Genetic reagent (D. melanogaster) | PB Split-Gal4 line, SS00117 | Janelia Research Campus | Wolff and Rubin, 2018 | |
| Genetic reagent (D. melanogaster) | PB Split-Gal4 line, SS00090 | Janelia Research Campus | Wolff and Rubin, 2018 | |
| Genetic reagent (D. melanogaster) | PB Split-Gal4 line, SS02198 | Janelia Research Campus | Wolff and Rubin, 2018 | |
| Genetic reagent (D. melanogaster) | PB Split-Gal4 line, SS54549 | Janelia Research Campus | Wolff and Rubin, 2018 | |
| Genetic reagent (D. melanogaster) | PB Split-Gal4 line, SS52577 | Janelia Research Campus | Wolff and Rubin, 2018 | |
| Genetic reagent (D. melanogaster) | PB Split-Gal4 line, SS02239 | Janelia Research Campus | Wolff and Rubin, 2018 | |
| Genetic reagent (D. melanogaster) | PB Split-Gal4 line, SS27583 | Janelia Research Campus | Wolff and Rubin, 2018 | |
| Genetic reagent (D. melanogaster) | PB Split-Gal4 line, SS02303 | Janelia Research Campus | Wolff and Rubin, 2018 | |
| Genetic reagent (D. melanogaster) | PB Split-Gal4 line, SS00078 | Janelia Research Campus | Wolff and Rubin, 2018 | |
| Genetic reagent (D. melanogaster) | PB Split-Gal4 line, SS52257 | Janelia Research Campus | Wolff and Rubin, 2018 | |
| Genetic reagent (D. melanogaster) | PB Split-Gal4 line, SS02195 | Janelia Research Campus | Wolff and Rubin, 2018 | |
| Genetic reagent (D. melanogaster) | PB Split-Gal4 line, SS52244 | Janelia Research Campus | Wolff and Rubin, 2018 | |
| Genetic reagent (D. melanogaster) | PB Split-Gal4 line, SS04778 | Janelia Research Campus | Wolff and Rubin, 2018 | |
| Antibody | Anti-GFP (rabbit polyclonal) | Molecular Probes | Cat# A-21312, RRID:AB_221478 | (1:500) |
| Antibody | Anti-GFP (mouse monoclonal) | Thermo Fisher Scientific | Cat# A-11120, RRID:AB_221568 | (1:500) |
| Antibody | Anti-RFP (rabbit polyclonal) | Rockland | Cat # 600-401-379, RRID:AB_2209751 | (1:500) |
| Antibody | anti-BRP (mouse monoclonal) | DSHB | Cat# nc82, RRID:AB_2314866 | (1:150) |
| Antibody | Alexa Fluor 488 anti-rabbit (goat polyclonal) | Thermo Fisher Scientific | Cat# A11008, RRID:AB143165 | (1:1000) |
| Antibody | Alexa Fluor 568 anti-rabbit (goat polyclonal) | Thermo Fisher Scientific | Cat# A11011, RRID:AB_143157 | (1:1000) |
| Antibody | Cy5 anti-mouse (goat polyclonal) | Thermo Fisher Scientific | Cat# A10524, RRID:AB_2534033 | (1:1000) |
| Chemical compound, drug | Tryptone | VWR | 97063–386 | |
| Chemical compound, drug | 3-Iodo-L-tyrosine (3IY) | Sigma | I8250-5G | |
| Software, algorithm | SleepLab | William Joiner | MATLAB-based software | |
| Software, algorithm | FIJI | FIJI | ||
| Software, algorithm | Prism 8 | GraphPad | ||
| Other | USB webcam | LOGITECH | Logitech Webcam Pro 9000 | |
| Other | Drosophila Activity Monitoring (DAM) System | Trikinetics, Waltham, MA |
Additional files
Download links
A two-part list of links to download the article, or parts of the article, in various formats.
Downloads (link to download the article as PDF)
Open citations (links to open the citations from this article in various online reference manager services)
Cite this article (links to download the citations from this article in formats compatible with various reference manager tools)
Modulation of sleep-courtship balance by nutritional status in Drosophila
eLife 9:e60853.
https://doi.org/10.7554/eLife.60853


