Defining the function of OmpA in the Rcs stress response
- WELBIO, Belgium
- de Duve Institute, Université catholique de Louvain (UCLouvain), Belgium
- Univ. Grenoble Alpes, CNRS, CEA, France
- Institut de Pharmacologie et de Biologie Structurale, IPBS, Université de Toulouse, CNRS, Université Paul Sabatier, France
- Institut de la Matière Condensée et des Nanosciences (IMCN), Molecular Chemistry, Materials and Catalysis (MOST), Université catholique de Louvain (UCLouvain), Belgium
- Université Paris-Saclay, CNRS UPR 2301, Institut de Chimie des Substances Naturelles, France
Figures
Figure 1 with 2 supplements
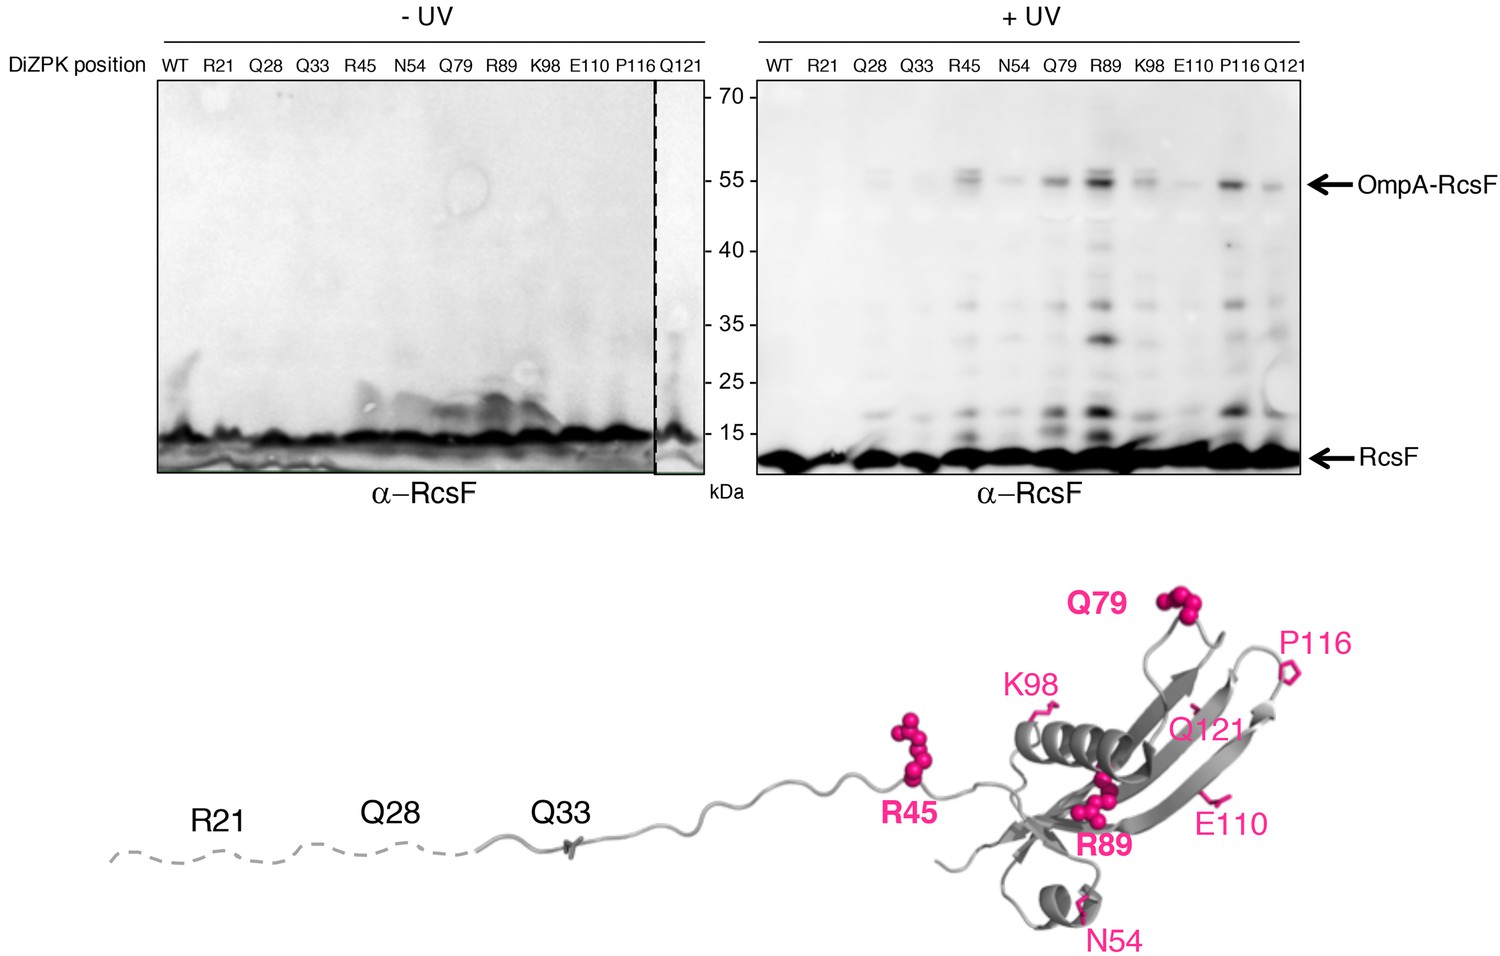
Defining the binding interface of RcsF on OmpA using in vivo site-specific photo-crosslinking.
Upper panel: ∆rcsF cells expressing wild-type (WT) RcsF or DiZPK-containing RcsF variants (from pSC253) were irradiated with UV light (+) or not (-), and protein samples were immunoblotted with an anti-RcsF antibody. A 55 kDa band, corresponding to the size of the OmpA-RcsF complex, was observed for eight of the mutants (R45, N54, Q79, R89, K98, E110, P116, Q121). Lower panel: residues of RcsF were replaced by DiZPK to map the zone of interaction with OmpA. In this cartoon of the NMR structure of RcsF (PDB: 2L8Y), the truncated N-terminal portion of the protein is shown as a dashed line and the residues that were found to interact with OmpA appear in magenta. The side chains of the residues that were selected for further experiments are shown as spheres, and other side chains are represented as sticks.
Figure 1—figure supplement 1
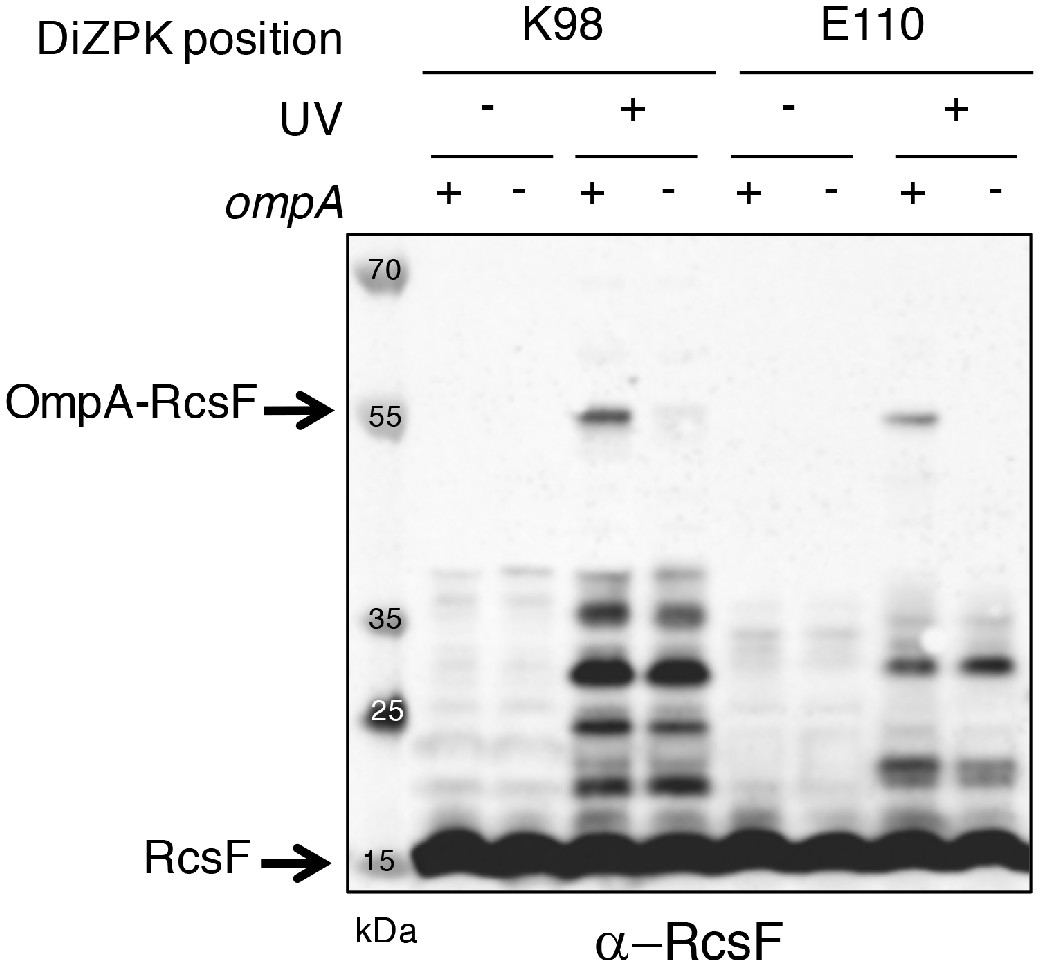
The UV-dependent 55 kDa band is the OmpA-RcsF complex.
To confirm the identification of the 55 kDa band as OmpA-RcsF, two DiZPK-containing RcsF variants (K98 and E110) were expressed from pSC253 in ∆rcsF and ∆rcsF∆ompA cells. Following UV exposure, the 55 kDa band only formed in cells in which OmpA was produced. Protein samples were immunoblotted with an anti-RcsF antibody.
Figure 1—figure supplement 2

The band migrating above the OmpA-RcsF complex is the OmpC/F-RcsF complex.
A band migrating slightly higher than OmpA-RcsF was observed with the RcsFR89X variant expressed from pSC253 in ∆rcsF cells following UV exposure. This band corresponds to the OmpC/F-RcsF complex because it did not form in cells lacking ompR, a transcription factor required for the production of OmpC and OmpF. The unknown band marked by * migrates lower than OmpA-RcsF.
Figure 2
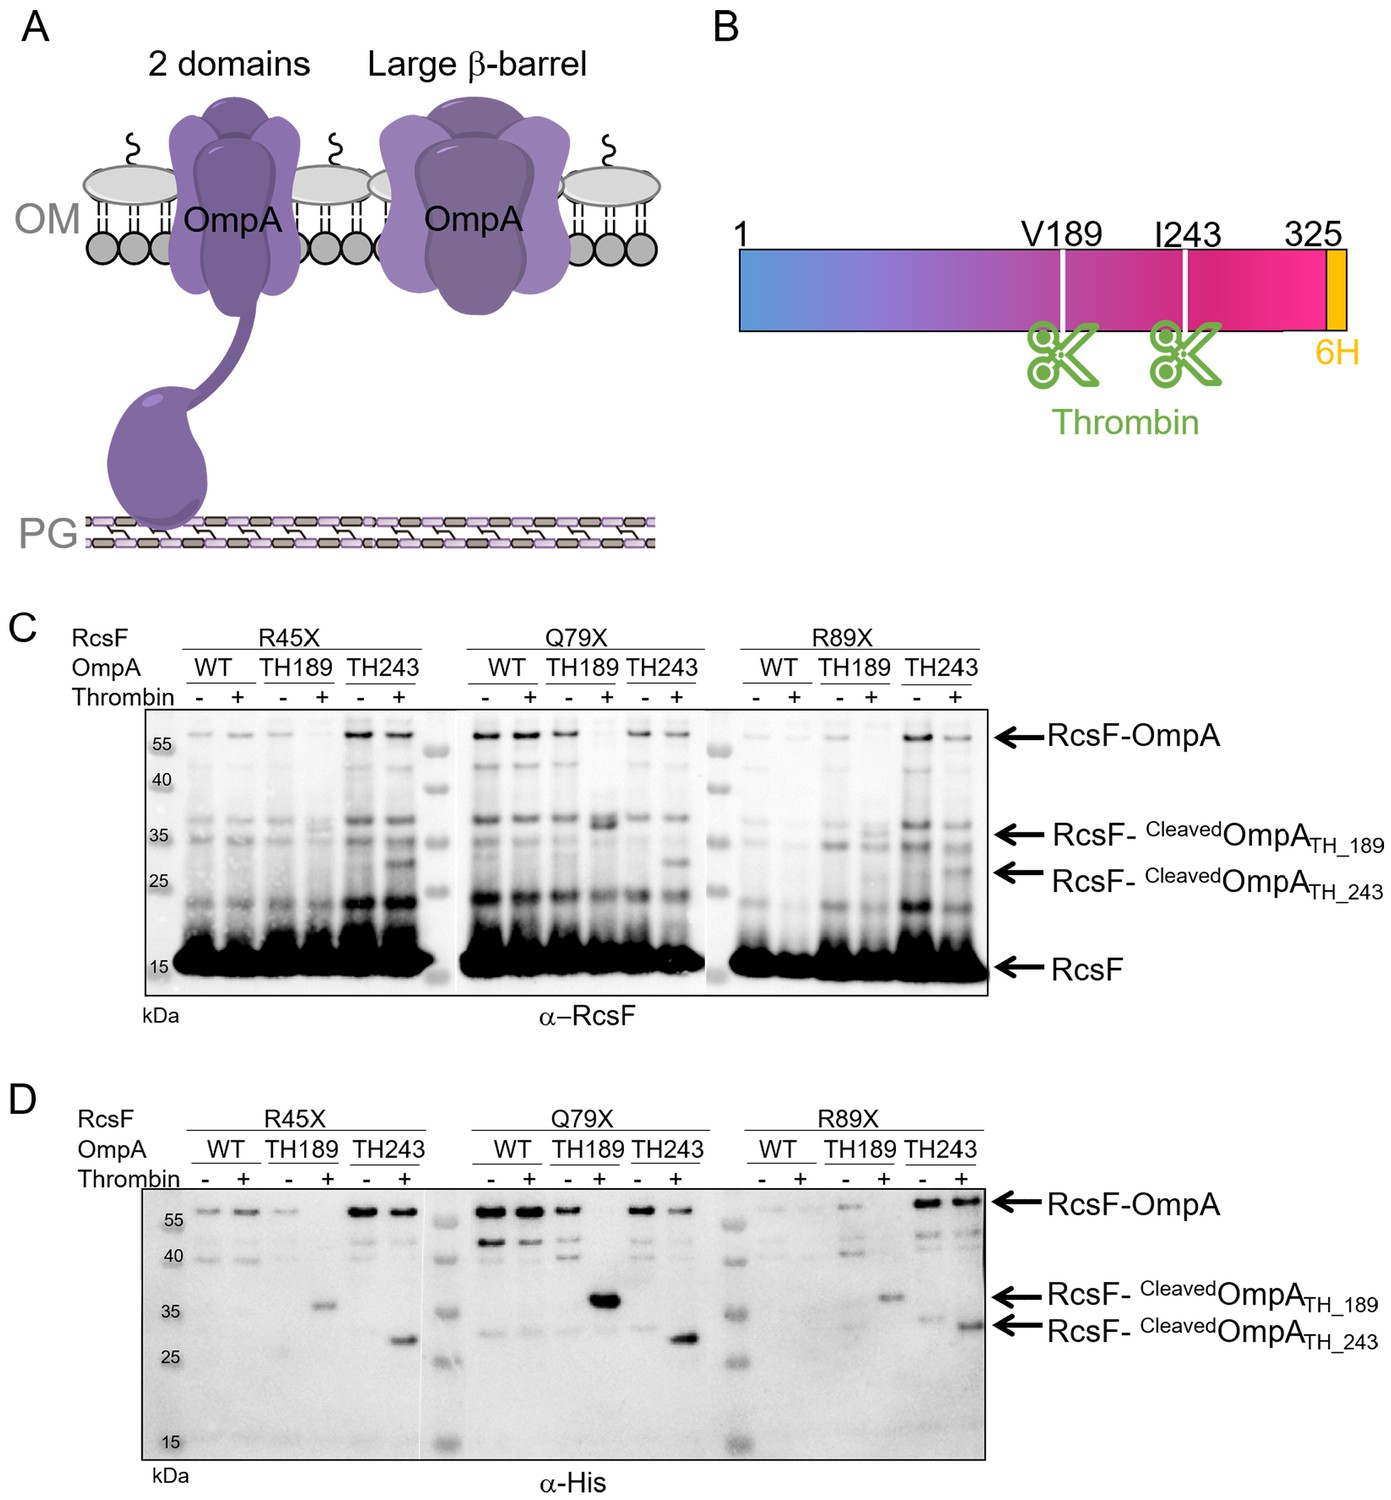
RcsF interacts with the C-terminal portion of OmpA in vivo.
(A) Schematic of the two conformations of OmpA. Left: the predominant view is that OmpA adopts a two-domain structure, with an N-terminal β-barrel embedded in the OM and a C-terminal periplasmic domain binding the peptidoglycan. Right: an alternative conformation in which OmpA folds into a large β-barrel has also been proposed (Singh et al., 2003; Stathopoulos, 1996). (B) Schematic of OmpA variants containing a thrombin-specific cleavage site (scissors at positions V189 and I243) and a 6x-histidine tag (orange) at the C-terminus. (C–D) In vivo site-specific photo-crosslinking of RcsF. ∆rcsF cells co-expressing one of the DiZPK-containing RcsF variant (R45X, Q79X, or R89X) together with OmpA (wild-type, or with a thrombin site inserted at V189 or I243) were UV-irradiated. The RcsF variants were expressed from pSC253; OmpA, OmpATH_189, and OmpATH_243 were expressed from the chromosome. After immunoprecipitation with anti-RcsF, protein samples were incubated (+) or not (-) with thrombin and immunoblotted with an anti-RcsF (C) or an anti-His-tag antibody (D). At least partial digestion of the ~55 kDa complex corresponding to OmpA-RcsF occurred with all three DiZPK-containing RcsF variants, yielding a band (RcsF-CleavedOmpATH_189 or RcsF-cleavedOmpATH_243) migrating at lower molecular weights that was detected by both antibodies.
Figure 3 with 2 supplements

The periplasmic domain of OmpA is necessary and sufficient for the interaction with RcsF in vivo.
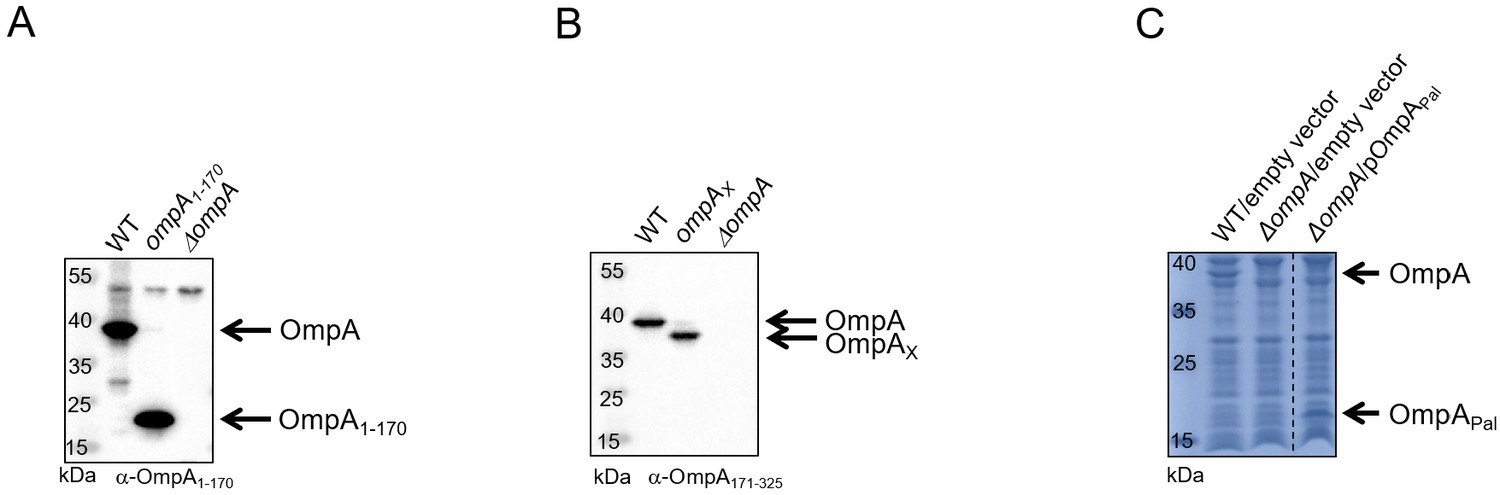
(A) Upper panel: Schematic of the truncated OmpA variant corresponding to the 8-stranded ß-barrel domain (OmpA1-170). Middle panel: In vivo chemical crosslinking of RcsF to OmpA and OmpA1-170. WT, ΔompA and ΔompA::ompA1-170 DH300 cells were incubated with or without 3,3’-dithio-bis[sulfosuccinimidylpropionate] (DTSSP). Proteins were immunoblotted with anti-RcsF (same for the middle panel in B and C). The OmpA-RcsF complex was detected in WT cells but not in cells expressing OmpA1-170. Lower panel: ß-galactosidase (ß-gal) activity was measured using the transcriptional rprA-lacZ fusion on the chromosome (Majdalani et al., 2002) using the same DH300 strains as in the middle panel (same for the lower panel in B and C). Deleting ompA induces Rcs, expression of OmpA1-170 does not restore basal Rcs activity. (B) Upper panel: Schematic of the hybrid protein consisting of a fusion between the 8-stranded ß-barrel OmpX and the periplasmic domain of OmpA (OmpA171-325) (OmpAX). Middle panel: In vivo chemical crosslinking of RcsF to OmpA and OmpAX. WT, ΔompA and ΔompA::ompAX cells were incubated with or without DTSSP. The RcsF-OmpA complex was detected in WT cells as well as in cells expressing OmpAX (RcsF-OmpAX). Lower panel: Deleting ompA induces Rcs, expression of OmpAX restores basal Rcs activity. (C) Upper panel: Schematic of the C-terminal domain of OmpA (OmpA171-325) fused to the signal sequence and lipobox of the OM lipoprotein Pal (OmpAPal). Middle panel: In vivo chemical crosslinking of RcsF to OmpA and OmpAPal. WT and ΔompA harboring pDSW204, an empty vector, used as control, and ΔompA cells harboring pKiD22, expressing OmpAPal from an IPTG-inducible promoter, were incubated with or without DTSSP. The OmpA-RcsF complex was detected in WT cells as well as in cells expressing OmpAPal (OmpAPal-RcsF). Lower panel: Deleting ompA induces Rcs, expression of OmpAPal substantially decreases Rcs activity. See Figure 3—source data 1 for details and statistics of middle panels. Mean (n = 3) and standard deviation (error bars) are shown. Differences were evaluated with Student’s t test (ns, not significant; *p<0.05; ***p<0.001).
-
Figure 3—source data 1
Raw source data for middle panels of Figure 3A,B,C.
- https://cdn.elifesciences.org/articles/60861/elife-60861-fig3-data1-v2.xlsx
Figure 3—figure supplement 1
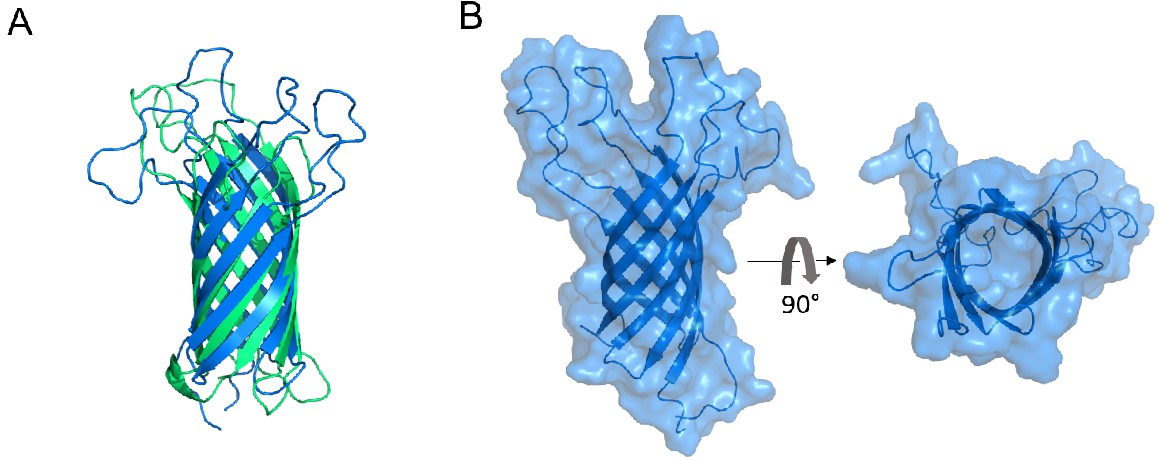
The eight-stranded ß-barrels of OmpA and OmpX are structurally similar and do not display an open channel through the membrane.
(A) Superimposition of the structures of the membrane-embedded β-barrels of OmpA (blue; PDB: 1QJP; residues 1–170) and OmpX (green; PDB: 2M07). The two ß-barrels, which have no sequence homology, can be superimposed with an RMSD of 2.49 Å. (B) Surface representation of the ß-barrel domain of OmpA (PDB: 1QJP; residues 1–170). The right panel is rotated 90° around the horizontal axis from the left panel. In this conformation, OmpA does not display an open channel.
Figure 3—figure supplement 2
The expression levels of the OmpA variants are similar to those of wild-type OmpA.
(A,B) Cells expressing OmpA1-170 (A) and OmpAX (B) from the chromosome were harvested at mid-log phase (OD600 = 0.4–0.6) and immunoblotted with antibodies specific for the periplasmic domain of OmpA (anti-OmpA186-325) or the β-barrel domain (anti-OmpA1-170) (Materials and methods). (C) Cells harboring pKiD22 were harvested at mid-log phase (OD600 = 0.4–0.6). Expression of OmpAPal was induced with IPTG (20 µM). The membrane fraction was analyzed by SDS-PAGE and proteins stained with Coomassie Blue.
Figure 4
RcsF interacts with the periplasmic domain of OmpA in vitro.
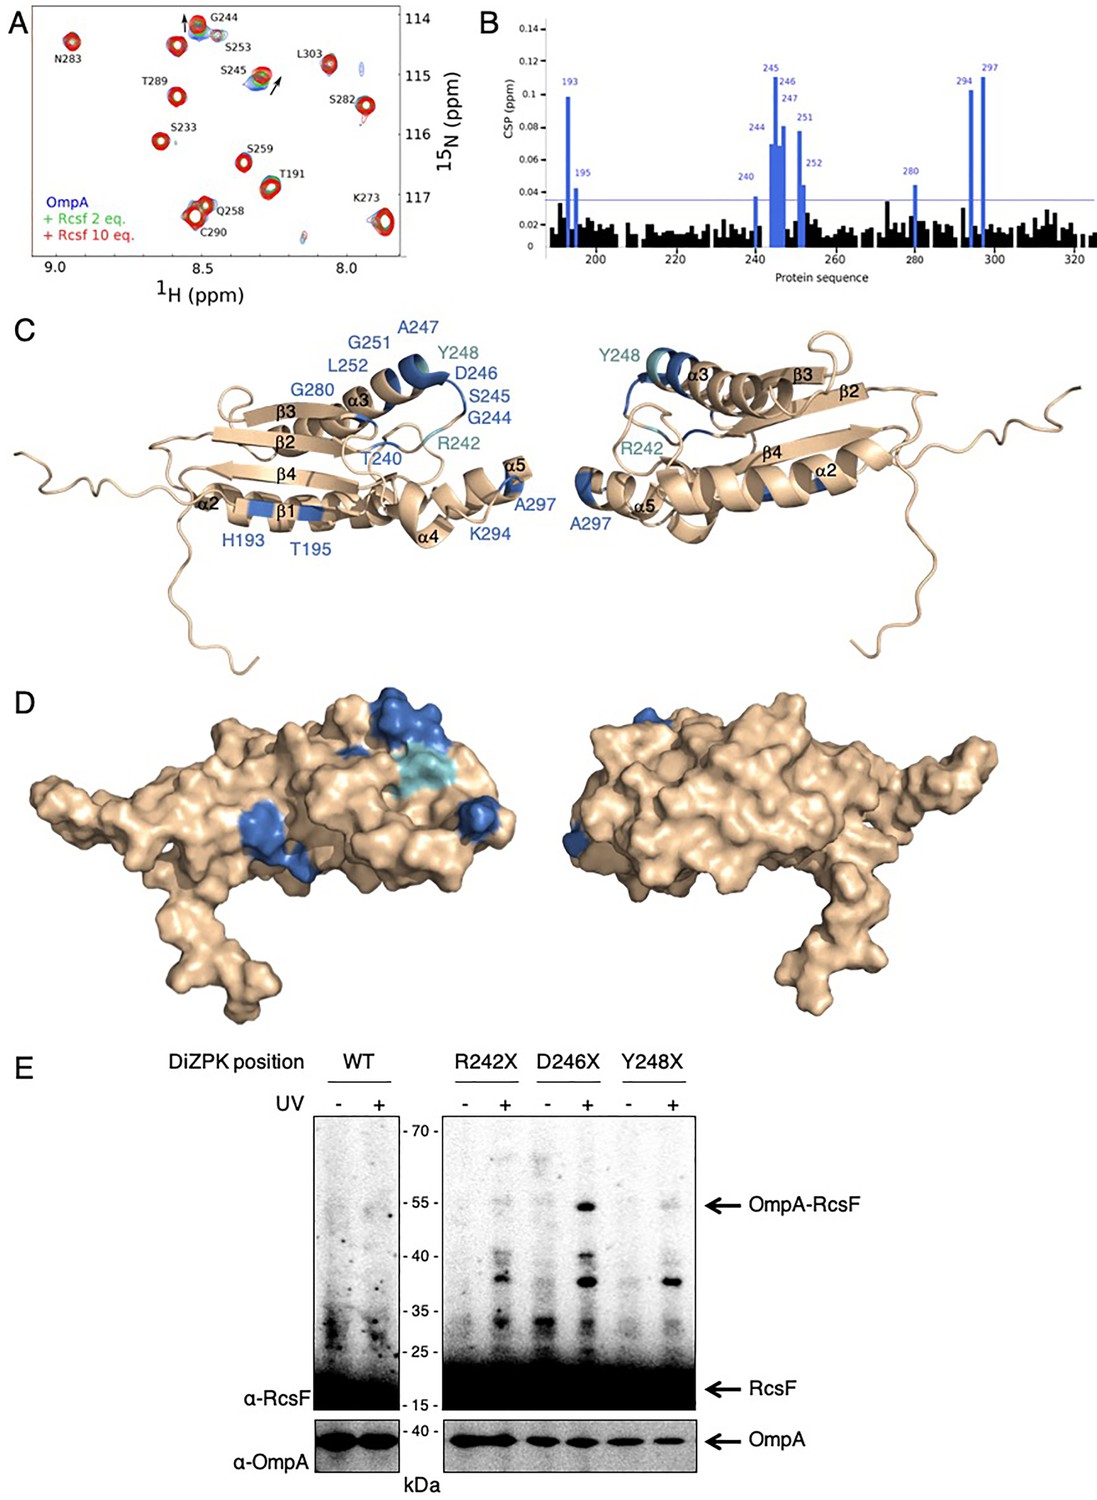
(A) An expanded region of the HSQC titration spectra of 15N-labeled OmpA186-325 with RcsF. Several residues in the 1H/15N BEST-TROSY-HSQC spectrum of OmpA (blue) show chemical shift perturbations (CSP) upon addition of RcsF at molar ratios of RcsF to OmpA of 2 (green) and 10 (red). Arrows indicate the direction of the chemical shift changes upon addition of RcsF to OmpA. (B) CSPs induced by the addition of RcsF to 15N-labeled OmpA186-325. Residues that showed CSP larger than two standard deviation are colored in blue. Cartoon (C) and surface (D) view of OmpA186-325 (PDB: 2MQE): top view (on the left) and bottom view (on the right). The residues in OmpA that undergo a CSP larger than two standard deviation (as in panel B) appear as dark blue and are labeled. Most of these residues are located between β-strand 2 and α-helix 3. The residues R242 and Y248 that do not interact well with RcsF in (E) are colored in light blue. (E) To confirm the importance of the loop between β-strand 2 and α-helix 3 of OmpA for the interaction with RcsF, we used site-specific photo-crosslinking. ΔompA rcsF+ cells expressing wild-type (WT) OmpA or three DiZPK-containing OmpA variants (OmpAR242X, OmpAD246X, and OmpAY248X) from pPR21 were irradiated with UV light (+) or not (-), and protein samples were immunoblotted with an anti-RcsF antibody. A strong 55 kDa band, corresponding to the size of the OmpA-RcsF complex, was observed with the OmpAD246X variant, confirming the NMR data. Weak complex formation was also observed with OmpAR242X and OmpAY248X. The expression levels of the OmpA variants were verified by immunoblotting (lower panel).
-
Figure 4—source data 1
Raw source data for Figure 4A,B: the HSQC titration spectra of 15N-labeled OmpA186-325 with RcsF.
- https://cdn.elifesciences.org/articles/60861/elife-60861-fig4-data1-v2.xlsx
Figure 5 with 1 supplement
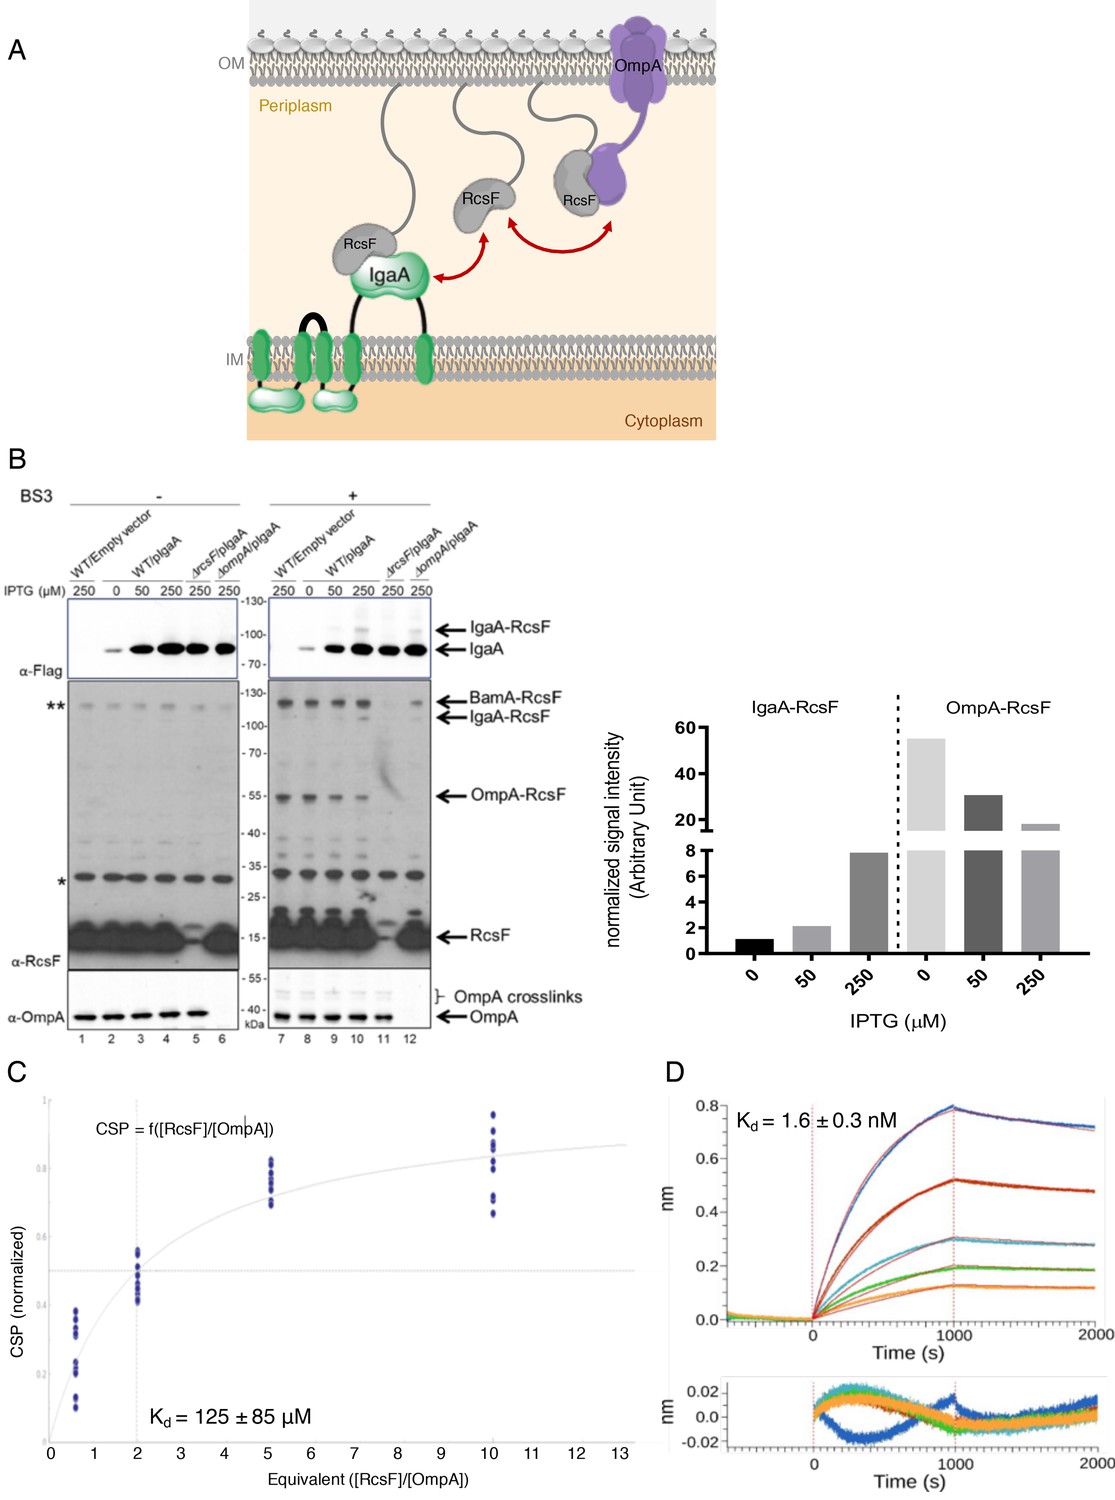
OmpA likely competes with the IM protein IgaA for RcsF.
(A) Cartoon of the E. coli cell envelope, with IgaA in the IM and RcsF and OmpA in the OM. RcsF, an OM lipoprotein, interacts with OmpA. When in complex with RcsF, OmpA adopts its two-domain conformation, with an N-terminal β-barrel embedded in the OM and a C-terminal domain soluble in the periplasm. The periplasmic domain of OmpA interacts with RcsF, likely competing with IgaA for RcsF binding. Copy numbers are from Li et al., 2014. (B) Impact of over-expressing IgaA on the OmpA-RcsF complex (left). Cells harboring pSC231, an empty vector used as control, or pIgaA (pSC237, expressing IgaA-Flag3 from an IPTG-inducible promoter) were harvested at mid-log phase and incubated without (lanes 1–6) or with (lanes 7–12) BS3. Protein samples were immunoblotted with α-Flag (upper panel), α-RcsF (middle panel), or α-OmpA171-325 (lower panel) antibodies. IgaA-Flag3 was expressed in WT (lanes 2–4 and 8–10), ∆rcsF (lanes 5 and 11), and ∆ompA cells (lanes 6 and 12) with the indicated IPTG concentrations. Quantitation (see Figure 5—source data 1 for details) of the IgaA-RcsF and OmpA-RcsF complexes detected by the anti-RcsF antibodies is shown (right panel).* and **, non-specific bands detected by the polyclonal α-RcsF antibody. (C) Plot of the chemical shift perturbation (CSP) measured on OmpA resonances as a function of the RcsF:OmpA ratio. Only the residues with significant CSP (colored in blue in Figure 4B) are plotted and used to fit the KD. (D) The interaction between RcsF and the periplasmic domain of IgaA was probed by biolayer interferometry (BLI). Sensortips carrying immobilized RcsF were dipped into increasing concentrations of IgaA (5.9, 8.9, 13.3, 20, 30 nM) from 0 to 1000s then into buffer (1000–2000s). Association and dissociation phases were fitted (red lines) to extract a KD value. Residuals from the fits are shown at the bottom of the panel (see Figure 5—source data 2 for statistics).
-
Figure 5—source data 1
Raw source data for Figure 5B.
- https://cdn.elifesciences.org/articles/60861/elife-60861-fig5-data1-v2.xlsx
-
Figure 5—source data 2
Raw source data for Figure 5D.
- https://cdn.elifesciences.org/articles/60861/elife-60861-fig5-data2-v2.xlsx
Figure 5—figure supplement 1
Estimation of the concentrations of IgaA and OmpA in the cell envelope.
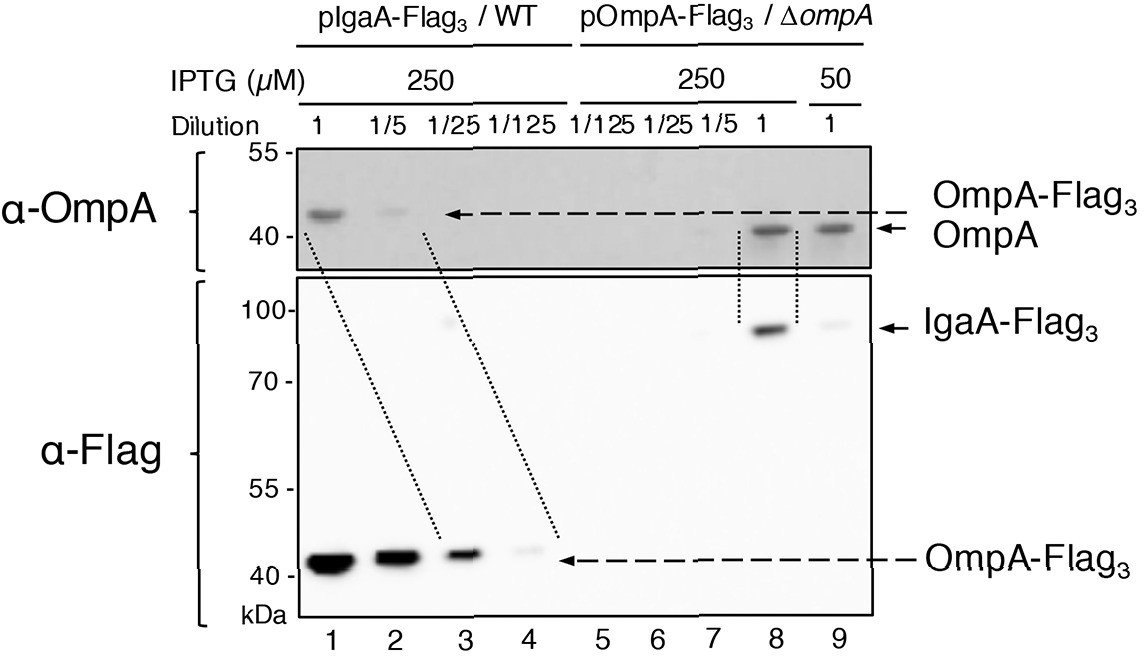
OmpA-Flag3 was expressed from pOmpA-Flag3 (pPR4) with 50 or 250 µM IPTG in ∆ompA cells. IgaA-Flag3 was expressed from pIgaA-Flag3 (pSC237) with 250 µM IPTG in wild-type (WT) cells. Samples were serially diluted as indicated before SDS-PAGE. OmpA-Flag3 (lanes 1–4) and OmpA (lanes 5–9) were detected with anti-OmpA (upper panel); OmpA-Flag3 (lanes 1–4) and IgaA-Flag3 (lanes 5–9) were detected with anti-Flag (lower panel). Images are representative of experiments made in biological triplicate.
Figure 6 with 2 supplements
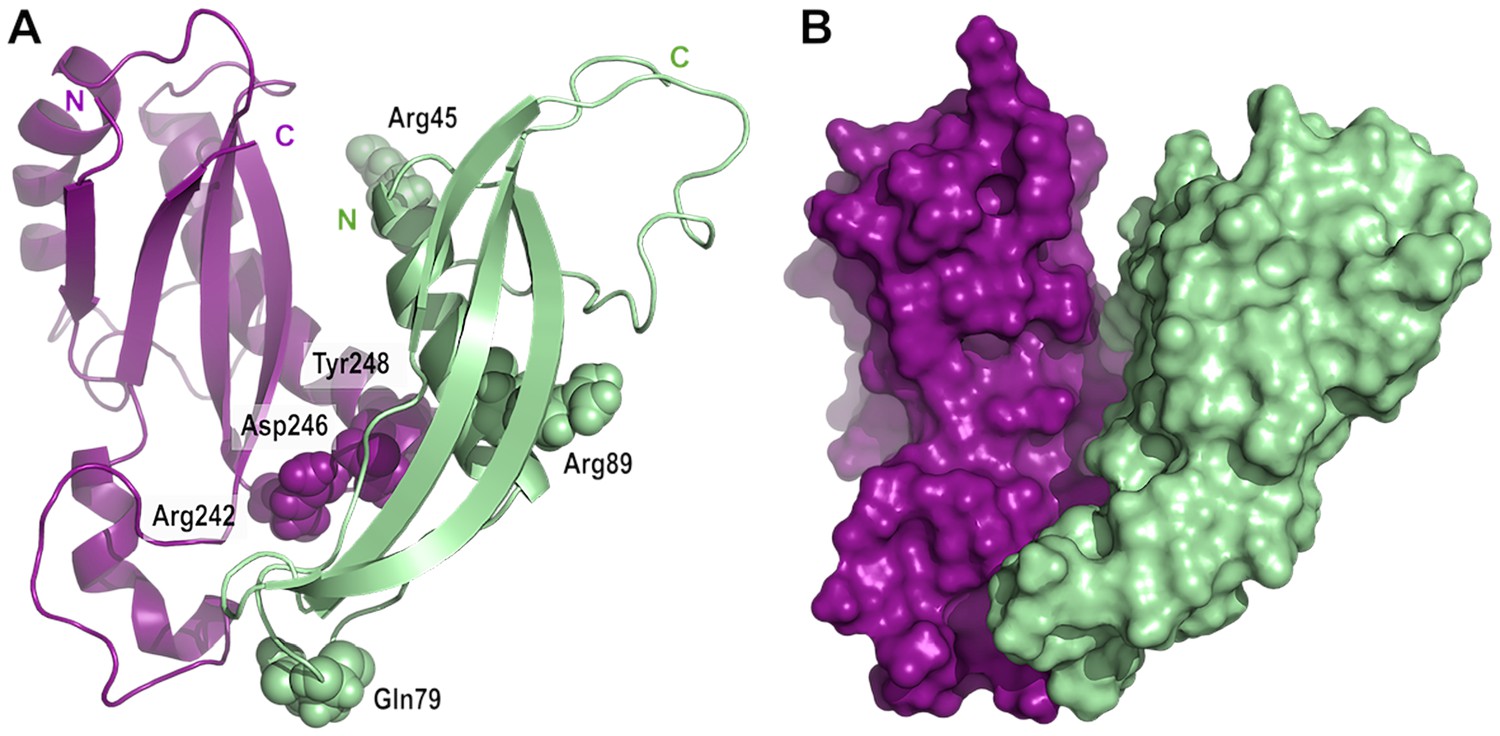
Model of the complex between RcsF and the C-terminal domain of OmpA.
(A) Cartoon and (B) surface representation of a complex between RcsF (residues 44–134, colored in light green) and OmpA (residues 190–315, colored in purple). The atoms from the six residues mutated to DiZPK (RcsFR45X, RcsFQ79X, RcsFR89X, OmpAR242X, OmpAD246X, and OmpAY248X) are represented as spheres with the van der Waals radius. This model, which shows a good surface complementarity between the two proteins, was obtained by protein-protein docking with constraints from the crosslinking experiments and further refined by all-atom molecular dynamics (50 ns). The N-terminal residue of RcsF points out in the same direction as the extremities of the periplasmic domain of OmpA, that is toward the OM, and this binding mode is compatible with the interaction of the periplasmic domain of OmpA with the peptidoglycan.
Figure 6—figure supplement 1
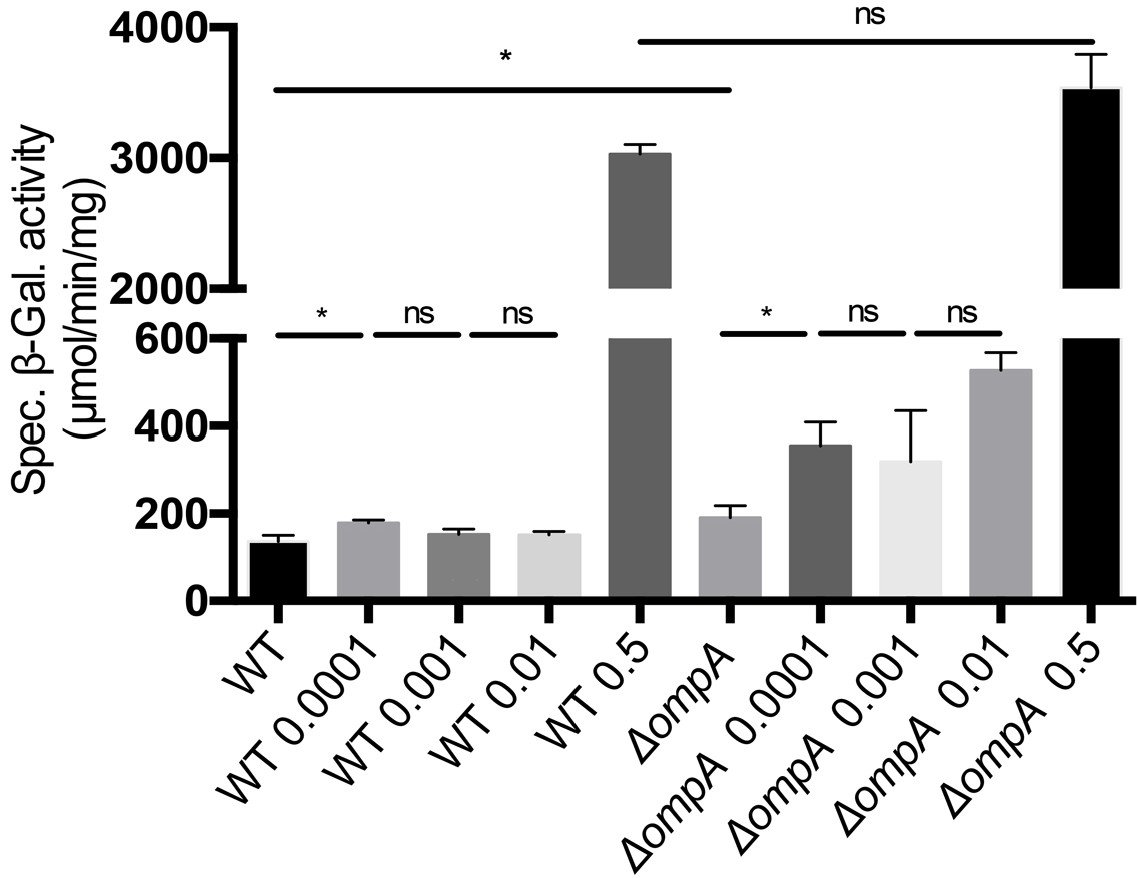
The Rcs system responds to polymyxin exposure in cells lacking OmpA.
Wild-type (WT; DH300, a MG1655 derivative Majdalani et al., 2002) and ∆ompA cells were treated with increasing concentrations of polymyxin B (0.0001–0.001 – 0.01–0.5 µg/mL) when they reached an OD600 of 0.4. Rcs activity was measured by a chromosomal rprA::lacZ fusion. Treatment with polymyxin B activated Rcs both in the WT and in the ∆ompA mutant. Mean (n = 3) and standard deviation (error bars) are shown. See Figure 6—figure supplement 1—source data 1 for statistics. Differences were evaluated with Student’s t test (ns, not significant; *p<0.05).
-
Figure 6—figure supplement 1—source data 1
Raw source data for Figure 6—figure supplement 1.
- https://cdn.elifesciences.org/articles/60861/elife-60861-fig6-figsupp1-data1-v2.xlsx
Figure 6—figure supplement 2
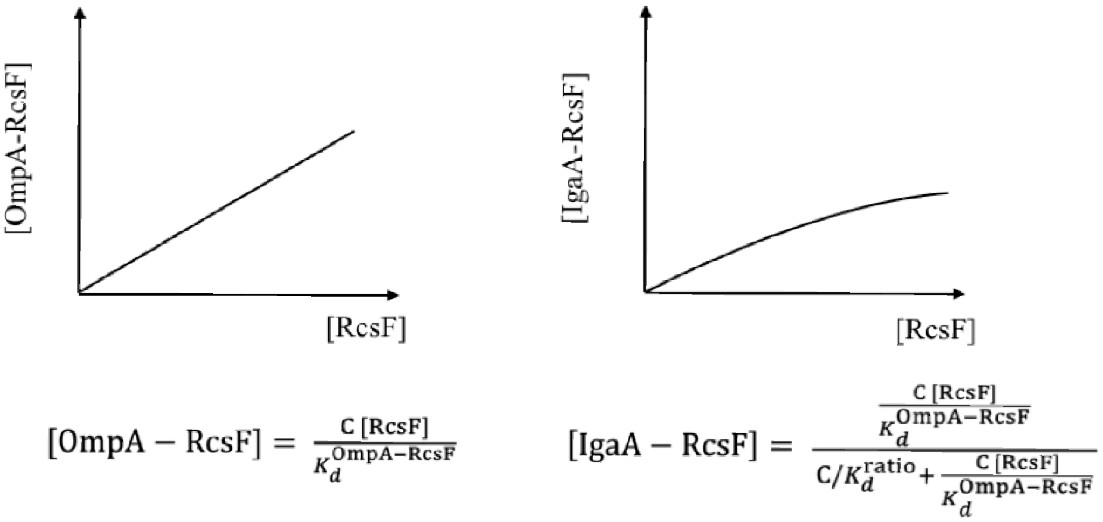
OmpA functions as a buffer for RcsF.
The concentration of (OmpA [OmpA] is high (1000 µM) and can therefore be considered constant ([OmpA]=C in the equations above)). Left panel: the concentration of the OmpA-RcsF complex [OmpA-RcsF] increases linearly with the concentration of RcsF in the periplasm. Right panel: the concentration of IgaA-RcsF [IgaA-RcsF] increases as a function of [RcsF] in the periplasm, but, in this case, the increase is decelerated and follows a hyperbolic curve. Thus, OmpA functions as a buffer for RcsF. See the Materials and methods for more information.
Author response image 1
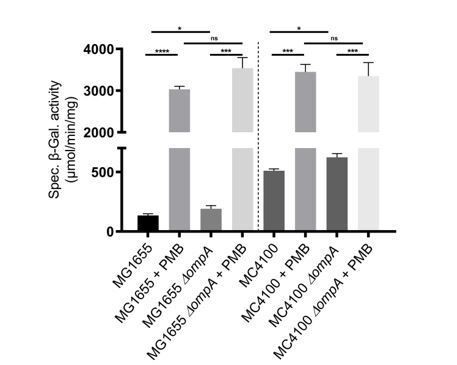
Rcs induction by polymyxin B in MC4100 and MG1655.
Wild-type and ∆ompA cells were treated with polymyxin B (PMB; 0.5 µg/ml) when they reached an OD600 of 0.4. Rcs activity was measured by a chromosomal rprA::lacZ fusion. Treatment with polymyxin B activated Rcs in the wild type and in the ∆ompA mutant, both in MG1655 and MC4100. Mean (n=3) and standard deviation (error bars) are shown. Differences were evaluated with Student’s t test (ns, not significant; * p<0.05, *** p<0,001).
Additional files
-
Supplementary file 1
Strains used in this study.
- https://cdn.elifesciences.org/articles/60861/elife-60861-supp1-v2.docx
-
Supplementary file 2
Primers used in this study.
- https://cdn.elifesciences.org/articles/60861/elife-60861-supp2-v2.docx
-
Supplementary file 3
Plasmids used in this study.
- https://cdn.elifesciences.org/articles/60861/elife-60861-supp3-v2.docx
-
Transparent reporting form
- https://cdn.elifesciences.org/articles/60861/elife-60861-transrepform-v2.pdf
Download links
A two-part list of links to download the article, or parts of the article, in various formats.
Downloads (link to download the article as PDF)
Open citations (links to open the citations from this article in various online reference manager services)
Cite this article (links to download the citations from this article in formats compatible with various reference manager tools)
Defining the function of OmpA in the Rcs stress response
eLife 9:e60861.
https://doi.org/10.7554/eLife.60861


