Reassessment of the involvement of Snord115 in the serotonin 2c receptor pathway in a genetically relevant mouse model
- Laboratoire de Biologie Moléculaire Eucaryote, Centre de Biologie Intégrative, Université de Toulouse, CNRS, UPS, France
- Institut National de la Santé et de la Recherche Médicale (INSERM), U1048, Institut National de la Santé et de la Recherche Médicale (INSERM), France Institut des Maladies Métaboliques et Cardiovasculaires (I2MC), Université de Toulouse Université Paul Sabatier, France
- Institut de Pharmacologie et de Biologie Structurale (IPBS), Centre National de la Recherche Scientifique UMR5089, France
- Department of Cellular and Molecular Medicine, University of Copenhagen, Denmark
- LBCMCP, Centre de Biologie Intégrative (CBI), CNRS, Université de Toulouse, France
- IGH (CNRS and University of Montpellier), France
- Centre de Recherches sur la Cognition Animale (CRCA), Centre de Biologie Intégrative (CBI), Centre National de la Recherche Scientifique, Université de Toulouse, France
Figures
Figure 1 with 1 supplement
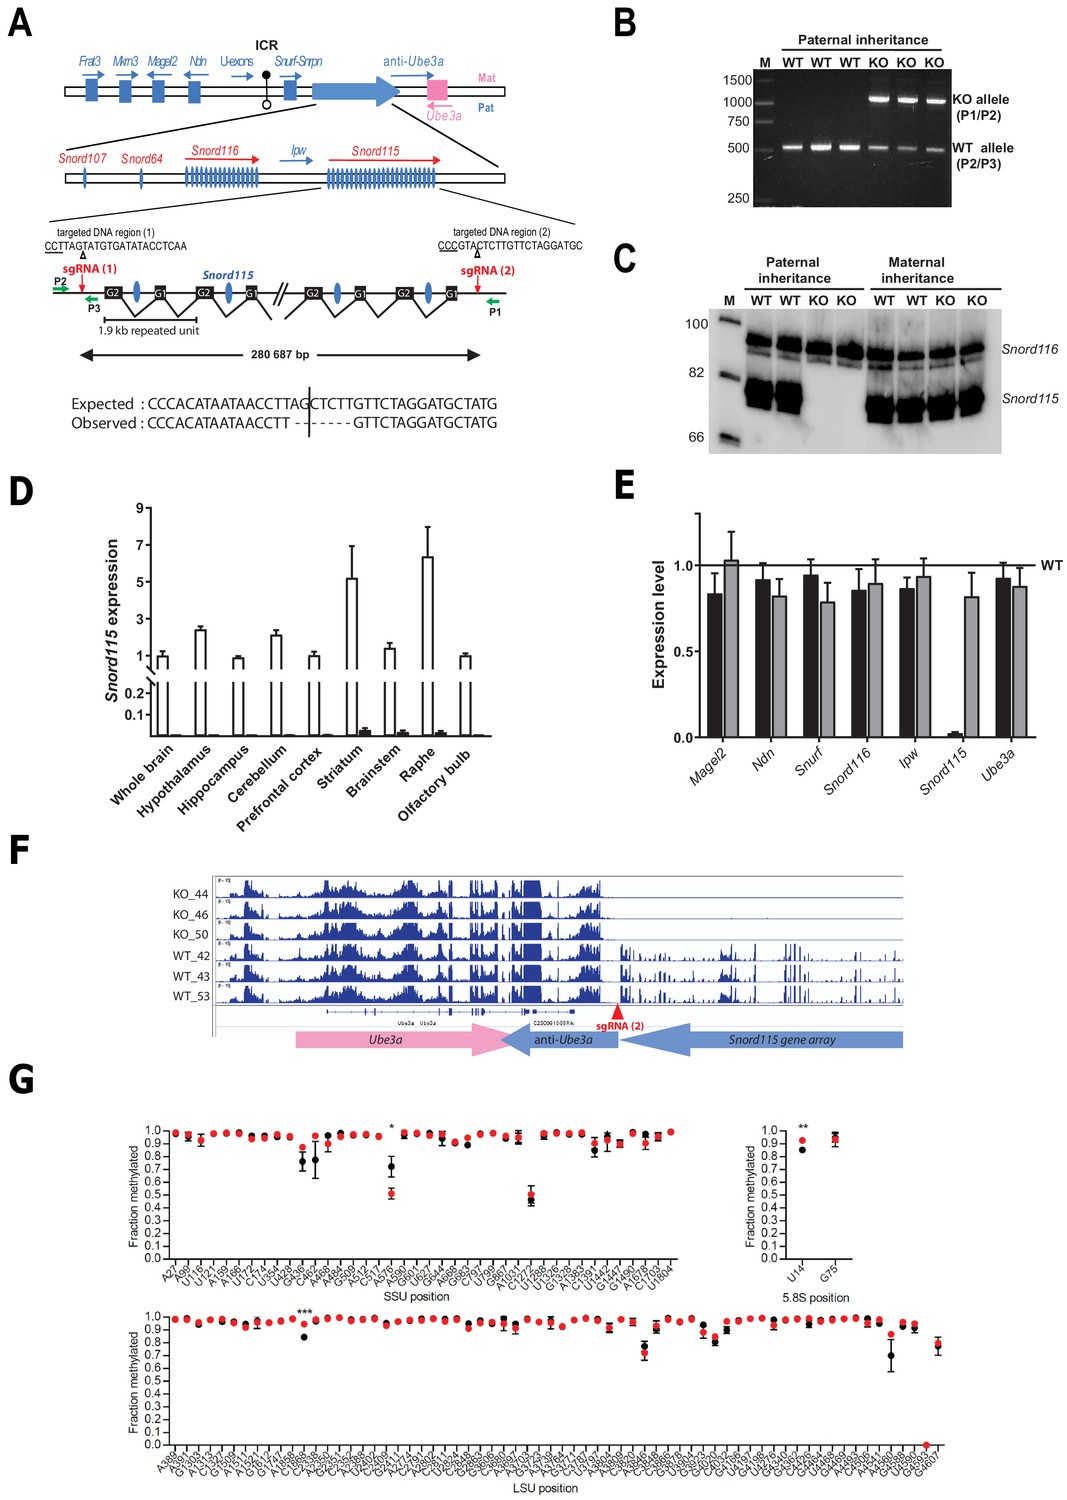
Targeted deletion of the paternally expressed Snord115 genes.
(A) Schematic representation of the imprinted Snurf-Snrpn region on mouse chromosome 7 c, also commonly known as the imprinted PWS region at human 15q11q13. Paternally expressed and maternally expressed protein-coding genes are symbolized by blue and pink rectangles, respectively. The paternally expressed SNORD gene array composed of Snord107, Snord64 and the tandemly repeated Snord116 and Snord115 gene families is depicted by a large, horizontal blue arrow while poorly defined noncoding transcript (U-exons, anti-Ube3A and Ipw) are denoted with thin arrows. SNORD gene copies are denoted as vertical blue ovals. The Imprinting Centre Region (ICR) that controls imprinted expression over the domain is represented by filled and open lollipops (methylated and un-methylated alleles, respectively). Each Snord115 gene copy is intron-encoded within a ~ 1.9 kb tandemly- repeated unit spreading over a ~ 280 kb-long noncoding DNA region. The two targeted DNA sequences by sgRNA(1) and sgRNA(2), as well as the theoretical and observed editing events at the deletion junction, are shown. The PAM sequence is underlined and the position of the predicted cleavage sites are indicated (positions 17 and 18 of the sgRNA). The genomic coordinates of the expected deletion is mm10 chr7:59,340,581–59,621,267. Green arrows represent the relative positions of P1, P2, and P3 primers used for PCR genotyping. Scale is not respected. (B) PCR genotyping of WT and mutant mice carrying a paternally-inherited deletion using a mixture of P1, P2, and P3 primers. (C) Expression of Snord115 and Snord116 was assayed (northern blot) in whole brains from heterozygous mice having a paternally- or maternally-transmitted deletion and WT littermates (n = 2 individuals per genotype). (D) Black and white bars represent Snord115 expression (RT-qPCR relative to Gapdh) in several brain areas dissected from mice bearing a paternally inherited deletion and WT littermates, respectively (n = 8–12 per genotype). (E) Black and gray bars represent expression levels (RT-qPCR relative to Gapdh) of flanking imprinted genes in the whole brain of mice bearing a paternally and maternally inherited deletion, respectively (n = 4–6 per genotype). Expression levels of WT were arbitrarily set to 1. (F) IGV screenshot showing that a targeted deletion of Snord115 gene array does not perturb the expression at the Ube3A/anti-Ube3A gene locus (mRNA-seq datasets generated from hypothalamus; supplementary file 3). (G) Methylation levels (RiboMeth-seq) at 2’-O-methylated rRNA sites in WT (black circles) and Snord115-deficient (red circles) adult brain (n = 3 per genotype). Nucleotide numbering is according to human rRNA (Krogh et al., 2016). Asterisks indicate statistical significance levels.
Figure 1—figure supplement 1
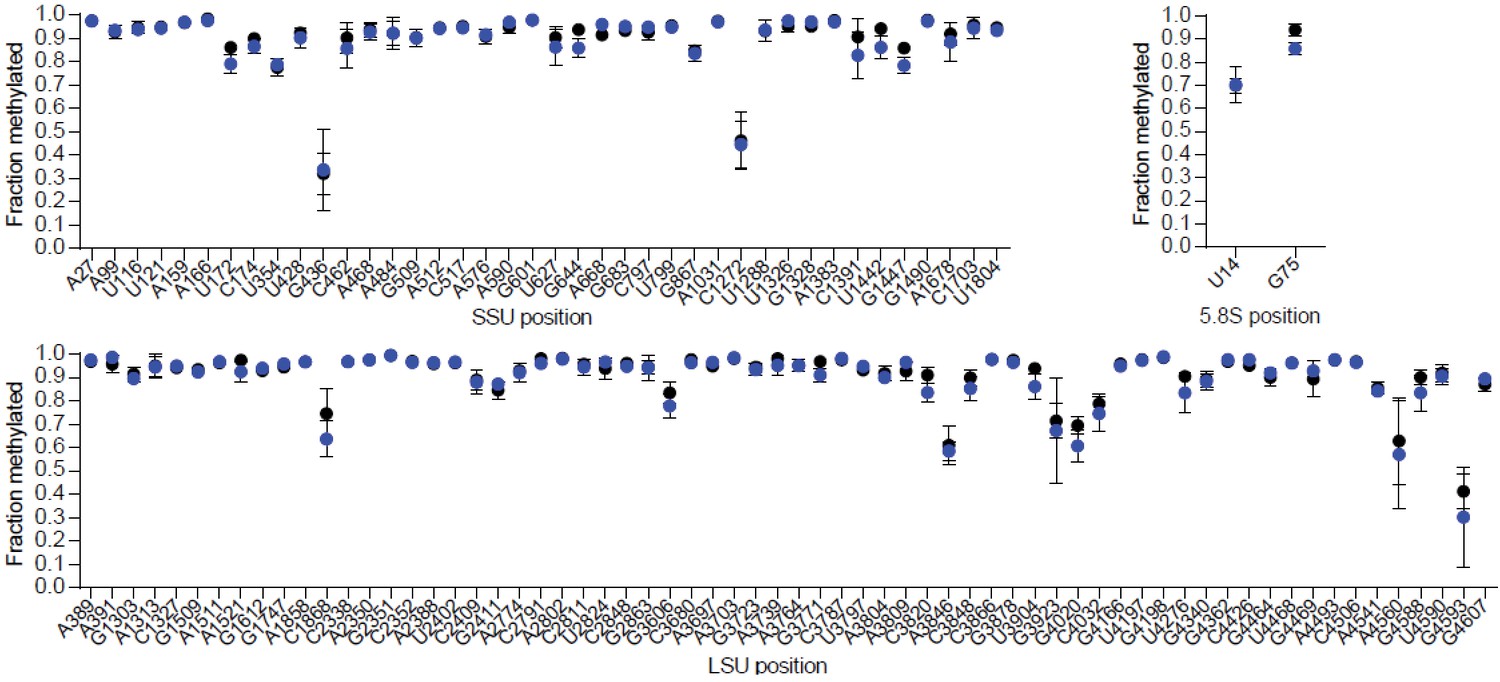
Loss of Snord116 and Snord115 does not impact on rRNA methylation profiles in the adult brain.
Methylation levels at 2’-O-methylated rRNA sites in adult brains of SNORD116-115-deficient mice (blue circles) and WT littermates (black circles) (n = 3 per genotype), as judged by RiboMeth-seq. Nucleotide numbering is according to human rRNA (Krogh et al., 2016). The SNORD116-115-deficient mouse line will be described elsewhere.
Figure 2
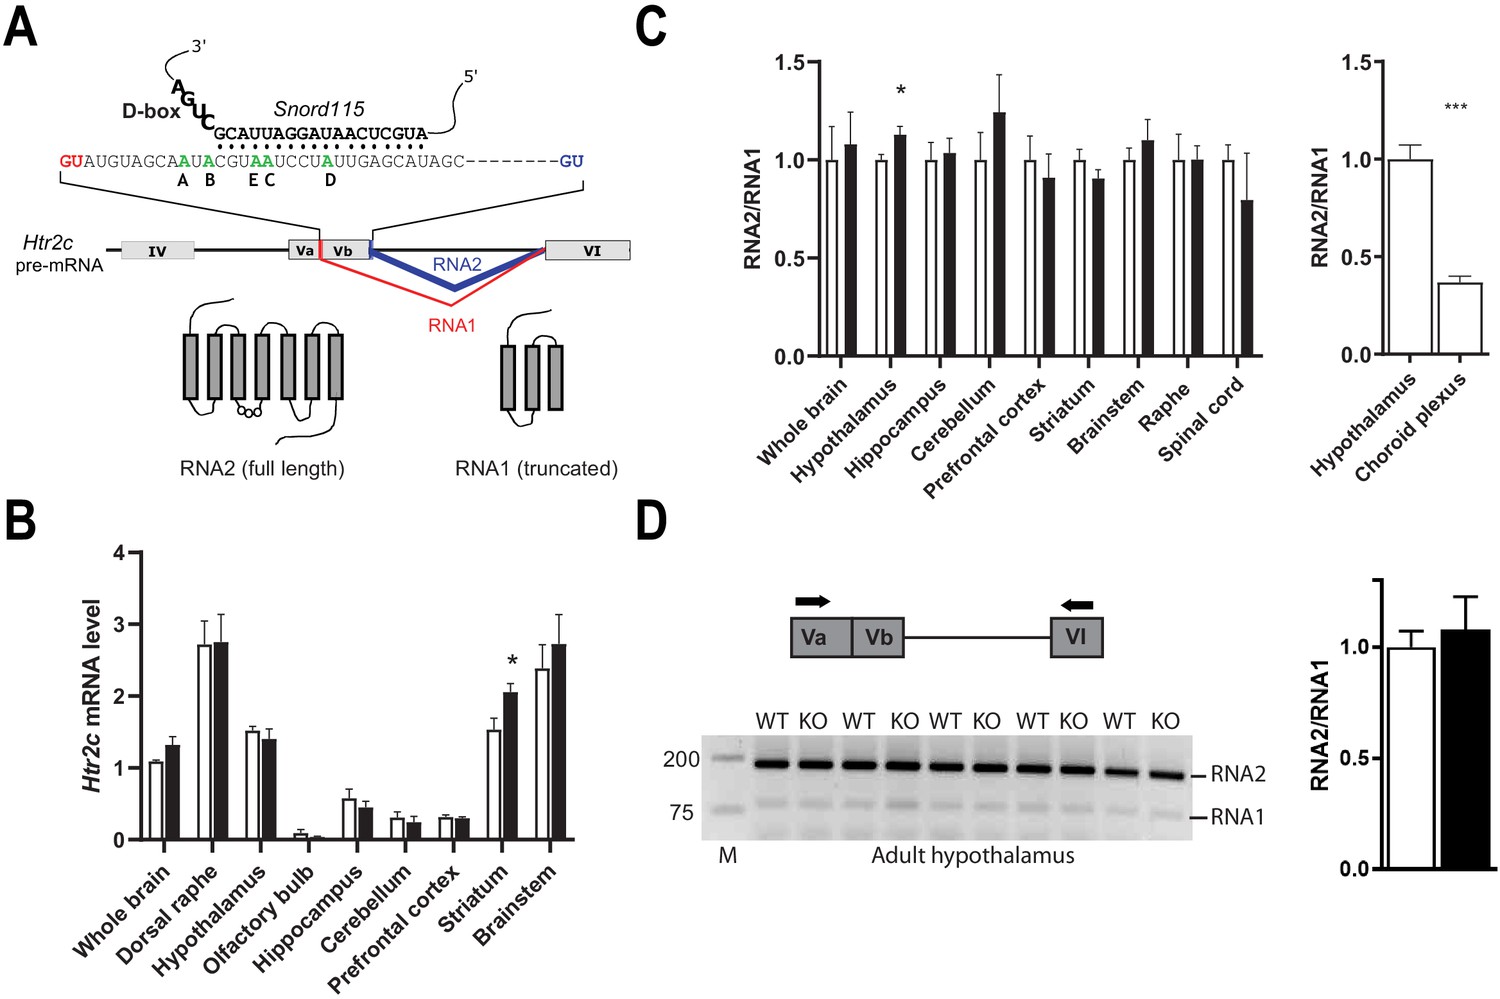
Alternative RNA splicing of Htr2c pre-mRNA remains unaffected in Snord115-deficient brains.
(A) Through the use of regular (blue) and alternative (red) 5’ splice sites, RNA splicing of Htr2c pre-mRNA generates RNA2 and RNA1 transcripts that encode full length and truncated HTR2C receptor, respectively. Htr2c pre-mRNA undergoes A-to-I RNA editing at five adenosines (green), denoted as the A, B, C, D, and E editing sites. Snord115 has the potential to target the C-site for 2’-O-methylation, that is the position paired to the fifth nucleotide upstream of the D-box (CUGA). (B) Black and white bars represent Htr2c mRNA expression levels (RT-qPCR relative to Gapdh) in whole brain and manually dissected brain regions of Snord115-deficient mice and WT littermates, respectively (n = 5–8 per genotype). (C) Left: Black and white bars show the RNA2-to-RNA1 ratio (RT-qPCR) in whole brain and manually dissected brain regions of adult Snord115-deficient mice and WT littermates, respectively (n = 6 per genotype). RNA2-to-RNA1 ratios in WT were set to 1. Right: Histograms show the RNA2-to-RNA1 ratio (RT-qPCR) in hypothalamus and choroid plexus of adult WT mice, respectively (n = 5–6 per tissue). The RNA2-to-RNA1 ratio in hypothalamus was set to 1 (D) Left: Ethidium bromide staining of RT-PCR products obtained in hypothalamus of Snord115-deficient and WT littermates using a pair of primers (horizontal black arrows) that simultaneously detect RNA2 and RNA1, as illustrated above the gel. M, Marker (bp). Right: intensity of PCR signals was quantified and RNA2-to-RNA1 in WT was set to 1.
Figure 3 with 1 supplement
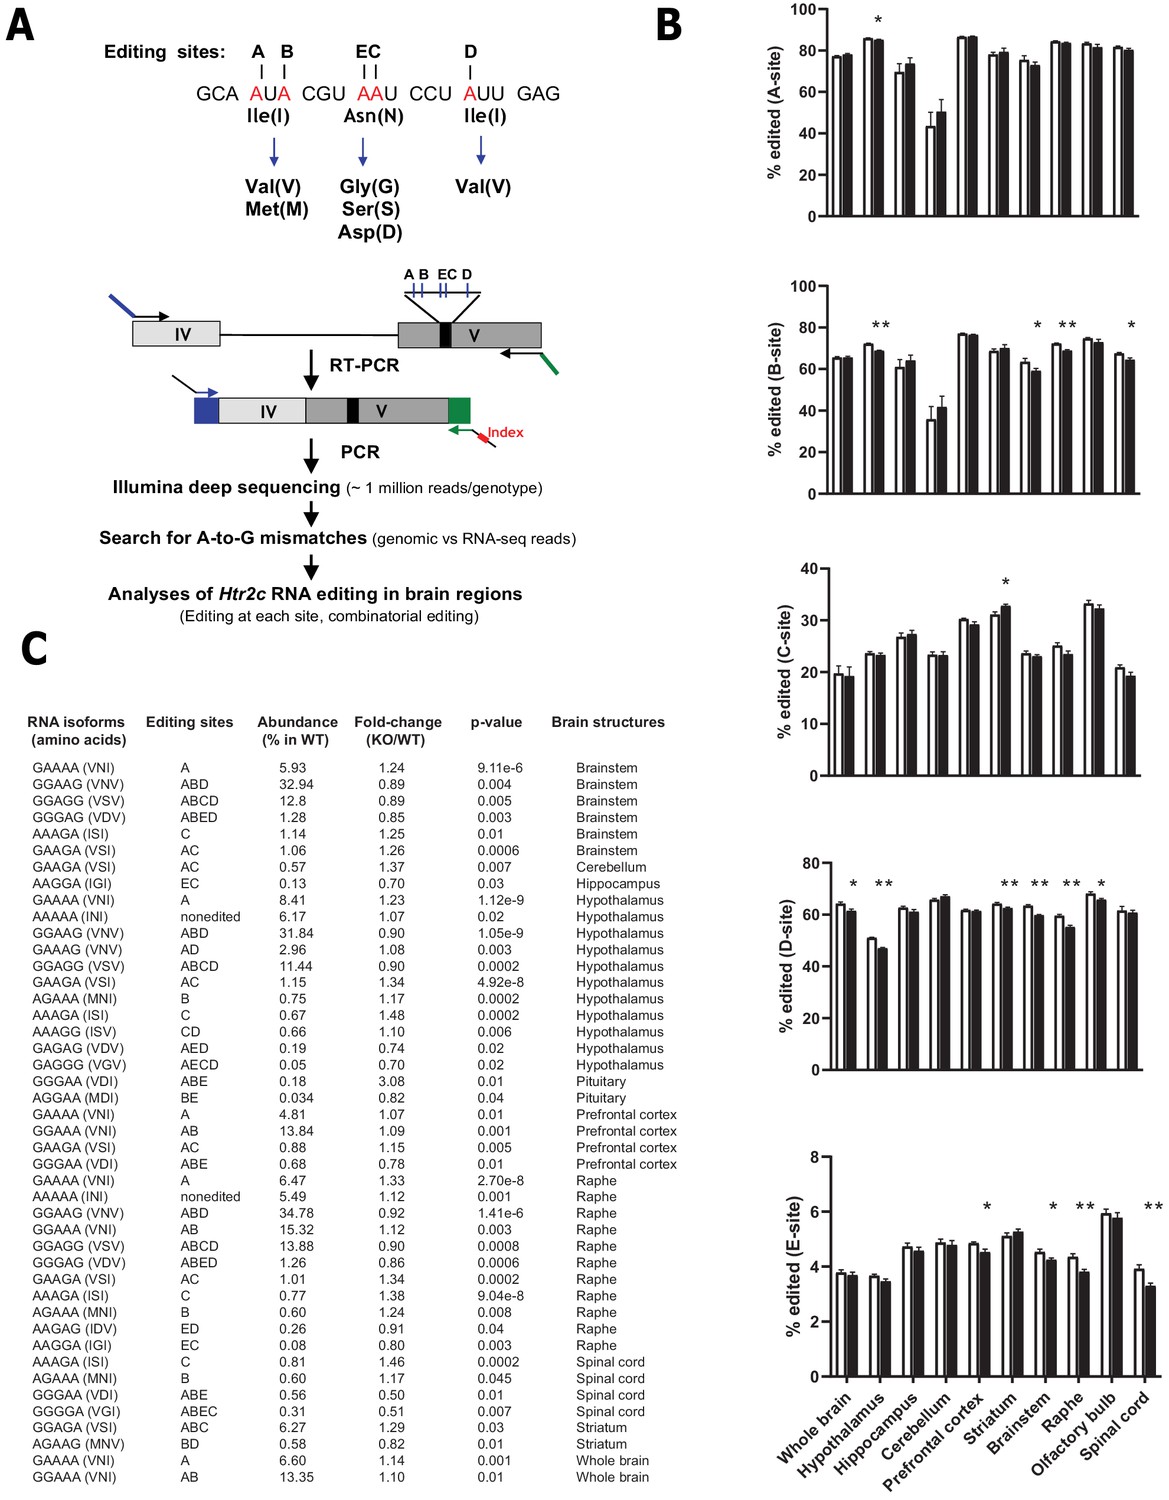
Loss of Snord115 has a mild influence on Htr2c RNA editing profiles.
(A) Upper part: sequence-specific A-to-I RNA editing alters the genetic information embedded in exon V of Htr2c mRNA. Lower part: High-throughput sequencing method to measure RNA editing of Htr2c mRNA. (B) Percentage of RNA editing at each individual site in whole brain, spinal cord as well as in eight manually dissected brain regions of Snord115-deficient (black bars) mice and WT littermates (white bars; n = 9–12 per genotype). (C) The table lists significant changes (p<0.05) in the proportion of Htr2c isoforms in Snord115-deficient brain regions as indicated by the KO-to-WT ratio. The relative abundance of differentially expressed Htr2c isoforms, as measured in WT, is also indicated (%).
Figure 3—figure supplement 1
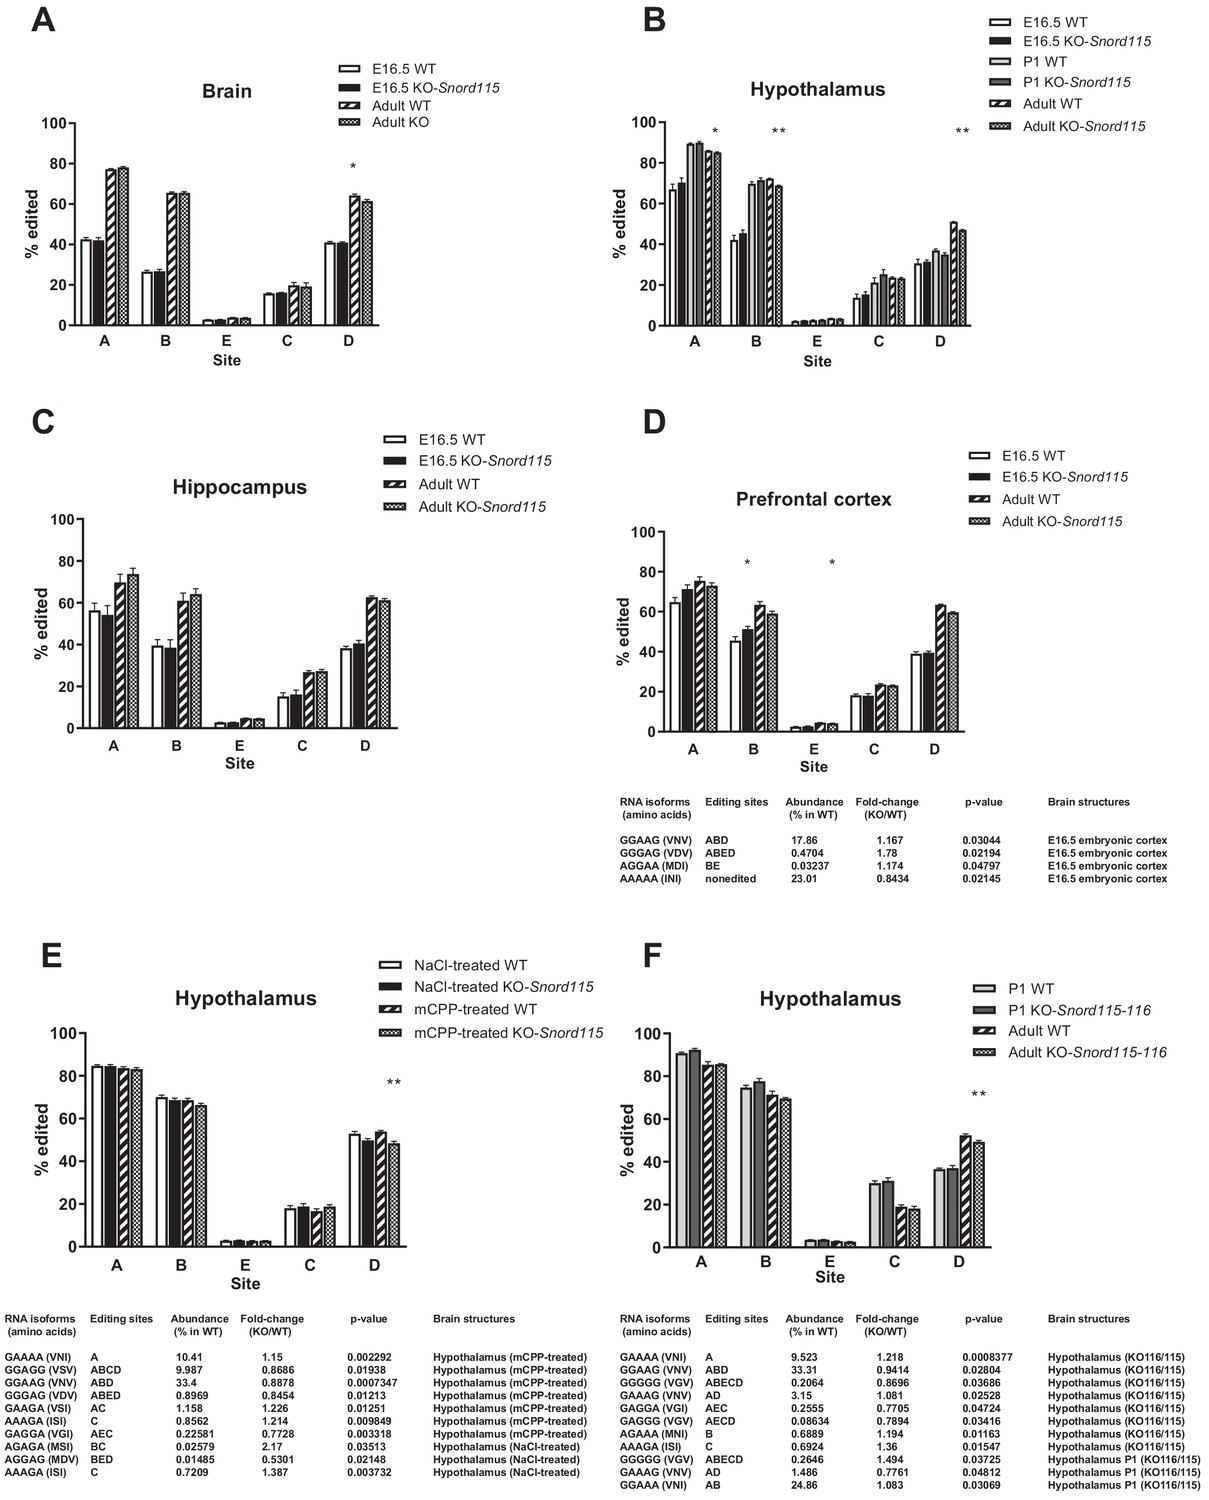
Loss of Snord115 and/or Snord116 has a mild impact on Htr2c RNA editing during development or after chronic mCPP treatment.
(A-D) Loss of Snord115 has a weak impact on Htr2c RNA editing profiles in developing (E16.5 or P1) brain. (A) Histograms show the percentage of RNA editing at each individual site in the developing brain (A), hypothalamus (B), hippocampus (C) and prefrontal cortex (D) of Snord115-deficient embryos and their WT littermates. Histograms showing RNA editing in the adult (see also Figure 3) are also shown for comparison. A four-way ANOVA shows that RNA editing rates increase during development (p<2 × 10⁻¹⁶), it depends on the brain area (p<2 × 10⁻¹⁶) and the editing site being considered (p<2 × 10⁻¹⁶), but there is no significant effect of genotype (WT vs. KO; p=0.3671). (E) Loss of Snord115 has a weak impact on Htr2c RNA editing in the adult hypothalamus after chronic mCPP treatment. Histograms show the percentage of RNA editing at each individual site in the hypothalamus of adult Snord115-deficient mice and WT littermates treated with mCPP or saline (0.9% NaCl) solutions (twice a day for 5 consecutive days; i.p. 5 mg/kg; n = 7–5 per genotype). Note that changes in RNA editing isoforms in control mice treated with saline solution differs from those observed with home-cage mice (Figure 3). (F) The simultaneous loss of Snord115 and Snord116 has a weak impact on Htr2c RNA editing in P1 and adult hypothalamus. Histograms show the percentage of RNA editing at each individual site in adult and P1 hypothalamus of Snord115-116-deficient mice and their WT littermates (n = 6–8 per genotype). D-F: The tables list significant changes in the proportion of Htr2c edited isoforms. The relative abundance of these differentially expressed Htr2c spliced isoforms, as measured in WT, is indicated (%). A-F: Statistically significant differences between WT and SNORD-KO mice are indicated as *p<0.05 and **p<0.01.
Figure 4

Snord115-deficient mice do not display abnormal anxio-depressive-like phenotypes and show normal response to sociability stimuli.
Cohorts of adult Snord115-deficient males (black bars) and their WT littermates (white bars) were subjected to Open field (A), Elevated plus maze (B), Novelty supressed feeding (C), Tail suspension (D), Forced swimming (E) and Three chambers (F) tests. The number of individuals analyzed are indicated within histograms. Note that due to tracking issues, one WT individual was omitted from analysis (4F-left-panel). None of these analyses showed a significant effect of genotype (ANOVA p-values>0.05 for genotype in each panel).
Figure 5
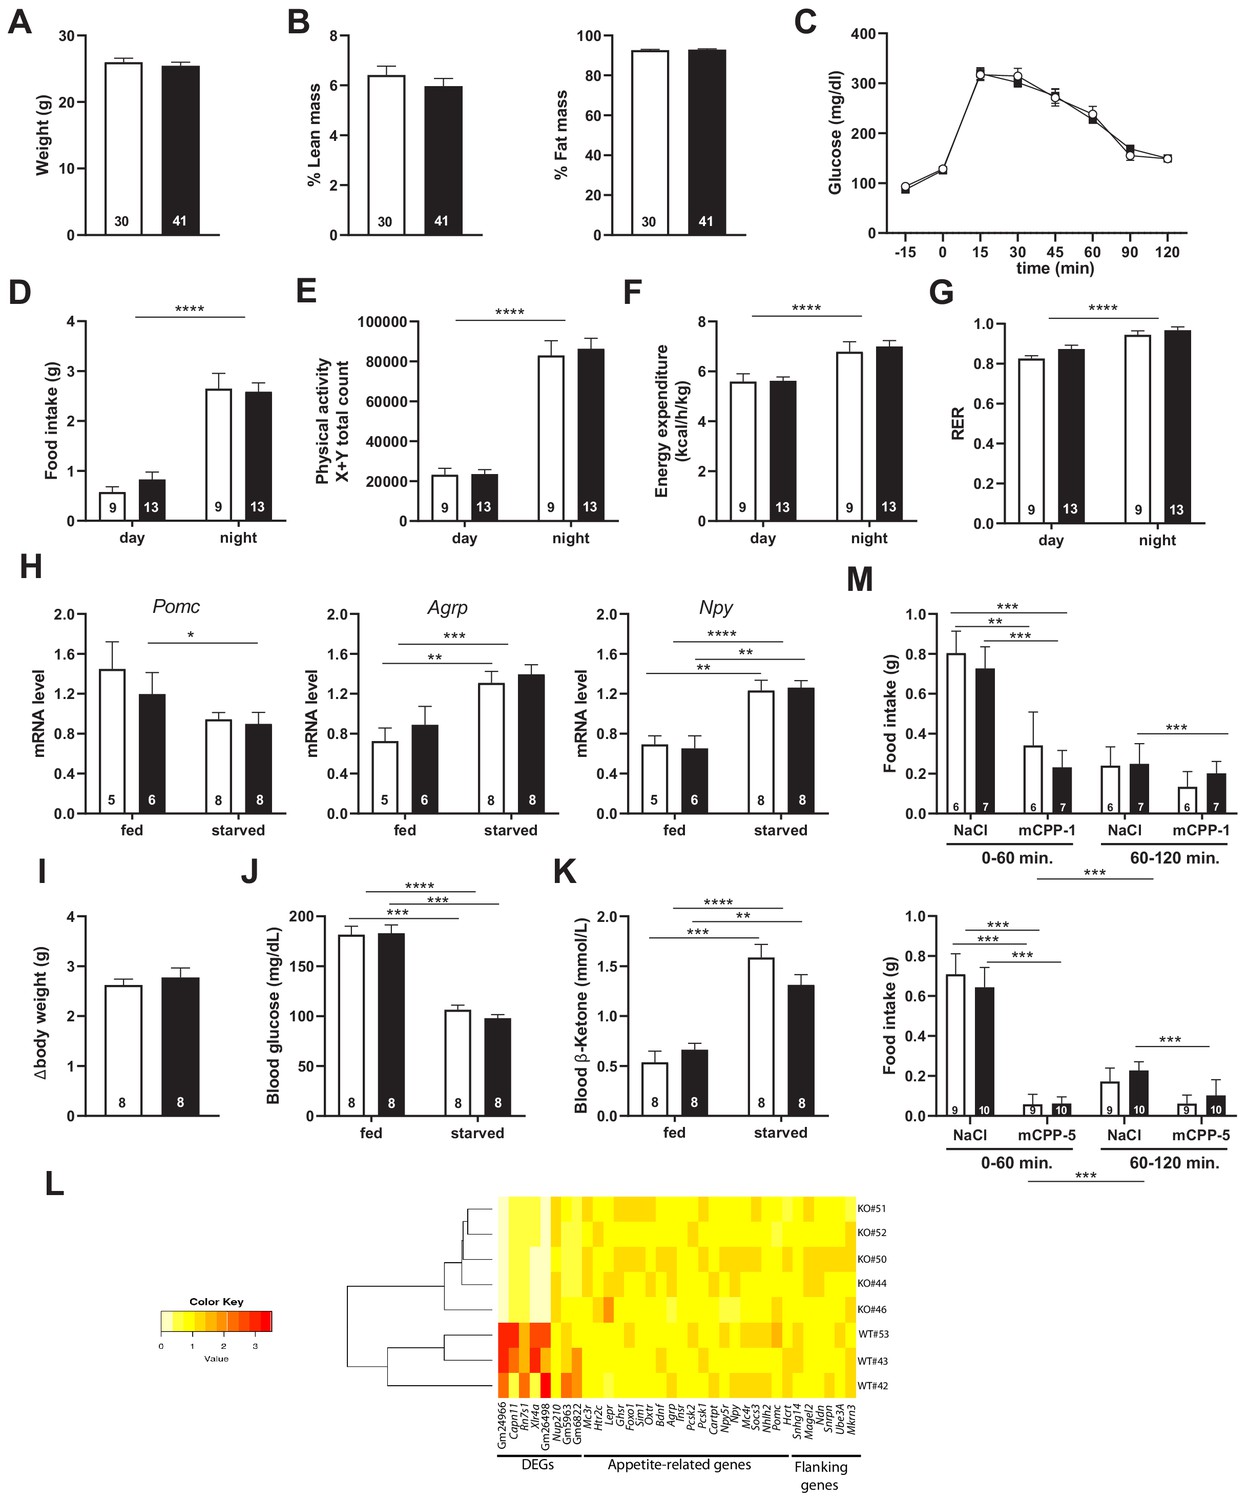
Snord115-deficient mice show regular homeotic feeding behavior and energy balance.
Body weight (A) and body composition measured by EchoMRI (B). Glucose tolerance test (GTT) of overnight (16 hr) fasted Snord115-deficient mice (n=14) and their WT littermates (n=9) (black and white squares, respectively). The graph represents the fate of glucose versus time after i.p. glucose administration (C). Food intake (D), spontaneous locomotion (E), energy expenditure (F), and respiratory exchange ratio (G) of Snord115-deficient mice and WT littermates were measured using the TSE PhenoMaster System. (H-K): Snord115-deficient mice and WT littermates were overnight (18 hr) starved. Expression levels of Pomc, Agrp and Npy mRNAs in hypothalamus were measured (RT-qPCR relative to Gapdh) (H). Weight loss after fasting (I), blood glucose (J) and ketone bodies (K) levels were measured in the fed and starved states. (L) Heatmap of the normalized mRNA-seq read counts from a list of genes of interest, as indicated below the panel. The normalized expression for each gene (column) and each genotype (row) is represented by colour code (yellow, lower value; red, higher value). Note that Gm24966 and Gm26498 match the deleted region. (M) Snord115-deficient mice and WT littermates were overnight (16 hr) starved and food intake of mCPP- and NaCl-treated mice was recorded using the TSE Phenomaster system during the first and second hour after treatment. mCPP was i.p. administered (1 mg/kg, M-top) or (5 mg/kg, M-bottom). White and black bars represent WT and Snord115-deficient mice, respectively. The number of individuals analysed are indicated within histograms. None of the analyses in panels A-K and M showed a significant effect of genotype (ANOVA p-values>0.05 for genotype in each panel).
Figure 6
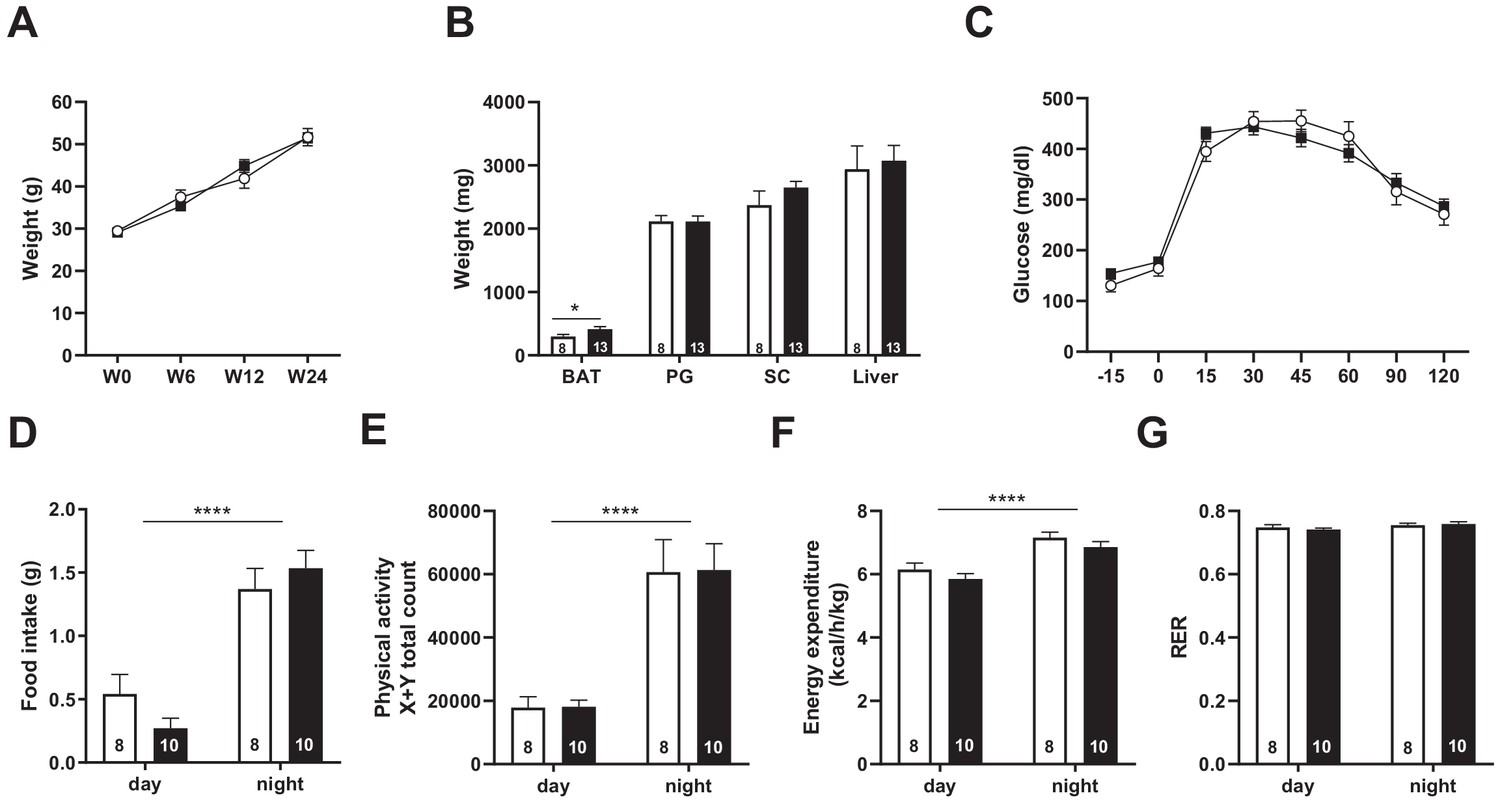
Snord115-deficient mice behave normally when fed a high-fat diet.
(A) Weight of Snord115-deficient mice and WT littermates before (W0) and after 6 (W6), 12 (W12) and 24 (W24) weeks of HFD. (B) Adiposity of Snord115-deficient mice and WT littermates after 24 weeks of HF diet as judged by the weights of brown adipose tissue (BAT), perigonadal (PG) fat, subcutaneous (SC) fat and liver. (C) Glucose tolerance test of overnight (16 hr) fasted Snord115-deficient (n=13) and WT littermates (n=8) after 12 weeks of HFD. The graph represents the fate of glucose versus time after oral glucose administration (1.5 g/kg). Food intake (D), spontaneous locomotion (E), energy expenditure (F) and respiratory exchange ratio (G) of Snord115-deficient mice and WT littermates were measured after 16 weeks of HFD (Phenomaster TSE System). White and black bars represent WT and Snord115-deficient mice, respectively. The number of individuals analyzed are indicated within histograms. None of these analyses showed a significant effect of genotype (ANOVA p-values>0.05 for genotype in each panel), except for panel B (p-value=0.04125 for genotype, with pairwise t-tests indicating a significant difference between WT and KO brown adipose tissues).
Additional files
-
Supplementary file 1
RiboMeth-seq scores and statistics.
Raw data are deposited at NCBI Gene Expression Omnibus (GEO) and accessible through GSE145159. Note that RiboMeth-seq data from WT littermates were also included in Hebras et al., 2020 RNA biol.
- https://cdn.elifesciences.org/articles/60862/elife-60862-supp1-v2.xlsx
-
Supplementary file 2
Snord115 is expressed in pro-opiomelanocortin (Pomc) neurons in the arcuate nucleus of the hypothalamus.
Coronally sectioned brain tissues of adult Pomc-eGFP transgenic mice (Pomc neurons appear green in the merge) were hybridized with Cy3-labeled DNA oligonucleotides (red signals in the merge). Bottom: Snord115 signals are detected in nuclear regions poorly stained by DAPI (white arrow), very likely representing nucleoli.
- https://cdn.elifesciences.org/articles/60862/elife-60862-supp2-v2.pdf
-
Supplementary file 3
Changes in transcript steady-state levels in the adult hypothalamus of Snord115-deficient mice relative to WT littermates (mRNA-seq).
Raw data are available on Sequence Read Archive (SRA) database under the accession number PRJNA608249.
- https://cdn.elifesciences.org/articles/60862/elife-60862-supp3-v2.xlsx
-
Supplementary file 4
Sequences of DNA oligonucleotides used in the study.
- https://cdn.elifesciences.org/articles/60862/elife-60862-supp4-v2.xlsx
-
Transparent reporting form
- https://cdn.elifesciences.org/articles/60862/elife-60862-transrepform-v2.docx
Download links
A two-part list of links to download the article, or parts of the article, in various formats.
Downloads (link to download the article as PDF)
Open citations (links to open the citations from this article in various online reference manager services)
Cite this article (links to download the citations from this article in formats compatible with various reference manager tools)
Reassessment of the involvement of Snord115 in the serotonin 2c receptor pathway in a genetically relevant mouse model
eLife 9:e60862.
https://doi.org/10.7554/eLife.60862


