DUCT reveals architectural mechanisms contributing to bile duct recovery in a mouse model for Alagille syndrome
- Department of Biosciences and Nutrition, Karolinska Institutet, Sweden
- Department of Experimental Biology, Masaryk University, Czech Republic
- CEITEC – Central European Institute of Technology, Brno University of Technology, Czech Republic
- Department of Pediatrics, Clinical Science, Intervention and Technology (CLINTEC), Karolinska Institutet and Karolinska University Hospital, Sweden
- Department of Histology and Embryology, Masaryk University, Czech Republic
- Department of Cell and Molecular Biology, Karolinska Institutet, Sweden
- Department of Laboratory Medicine, Karolinska Institutet, Sweden
- Institute of Science and Technology, Austria
Figures
Figure 1 with 12 supplements
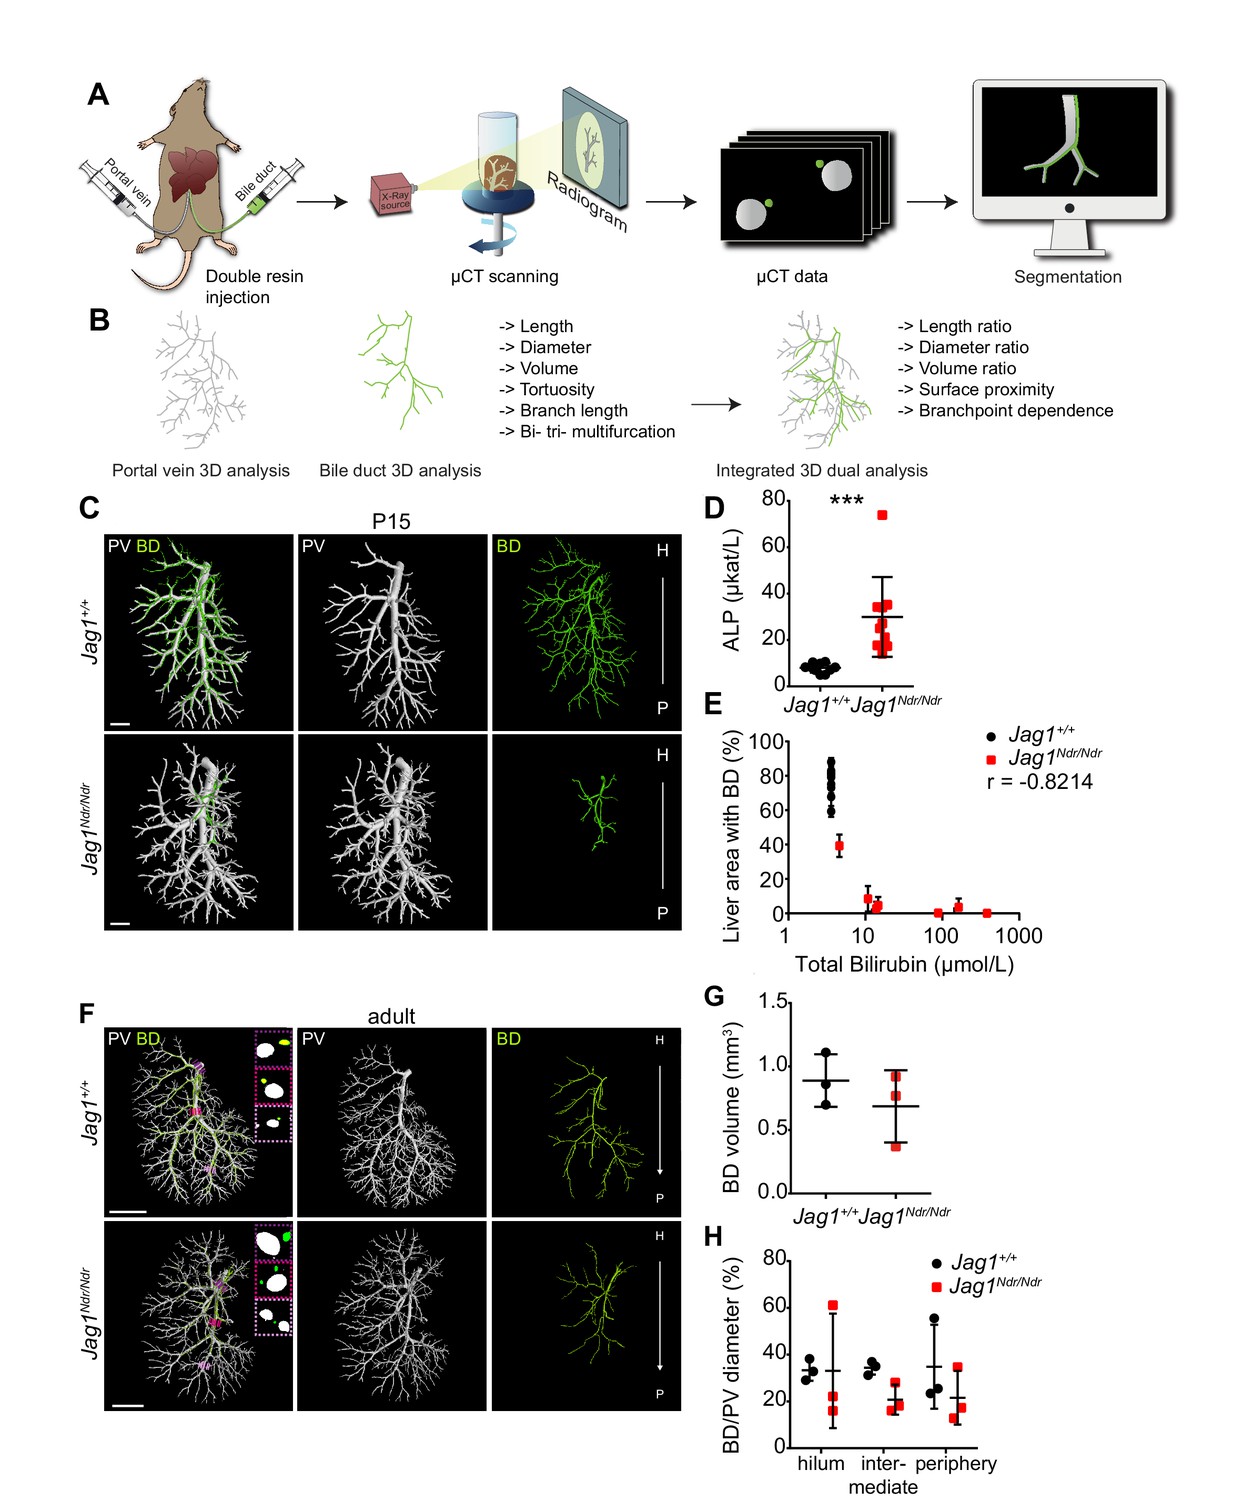
DUCT revealed that Jag1Ndr/Ndr bile ducts recover a full-volume biliary system.
(A) The DUCT pipeline encompasses resin injection into two systems (portal venous and biliary), micro computed tomography (µCT) scanning of the organ, or individual lobes, and segmentation of µCT data (tomographs) into 3D binary masks. (B) The image analysis pipeline creates 3D skeletons from the binary masks, to quantify architectural parameters in individual or combined systems. (C) 3D rendering of BD and PV structures using DUCT in postnatal day 15 (P15) Jag1+/+ (top panel) and Jag1Ndr/Ndr livers (bottom panel). Scale bar = 1 mm. (D) Alkaline phosphatase (ALP) serum levels at P15. Each dot represents one animal; lines show mean value ± standard deviation. Statistical test – unpaired t-test, p=0.0008. (E) Correlation analysis between total bilirubin levels and liver area with resin-injected BD. Each dot represents one animal; lines show mean value ± standard deviation (measured in right medial and left lateral lobe). Statistical test – non-parametric Spearman correlation, p=0.0341, r = −0.8214. (F) 3D rendering of BD and PV structures using DUCT in adult (4.5–6.5 months old) Jag1+/+ (top panel) and adult de novo generated Jag1Ndr/Ndr livers (bottom panel). Boxed regions highlight 2D sections of hilar, intermediate and peripheral regions identified with dotted lines in matched colors. Scale bar = 4 mm. (G) BD system volume is similar in adult Jag1+/+ and Jag1Ndr/Ndr mice. Each dot represents one animal; lines show mean value ± standard deviation, unpaired t-test, p=0.3730 (H) BD/PV diameter ratio in Jag1+/+ and Jag1Ndr/Ndr mice in hilar, intermediate and peripheral regions. Each dot represents one animal; lines show mean value ± standard deviation. Two-way ANOVA, p=0.2496. 3D, three dimensional; ALP, alkaline phosphatase; BD, bile duct; DUCT, double resin casting micro computed tomography; H, hilar; P, peripheral. PV, portal vein.
Figure 1—figure supplement 1
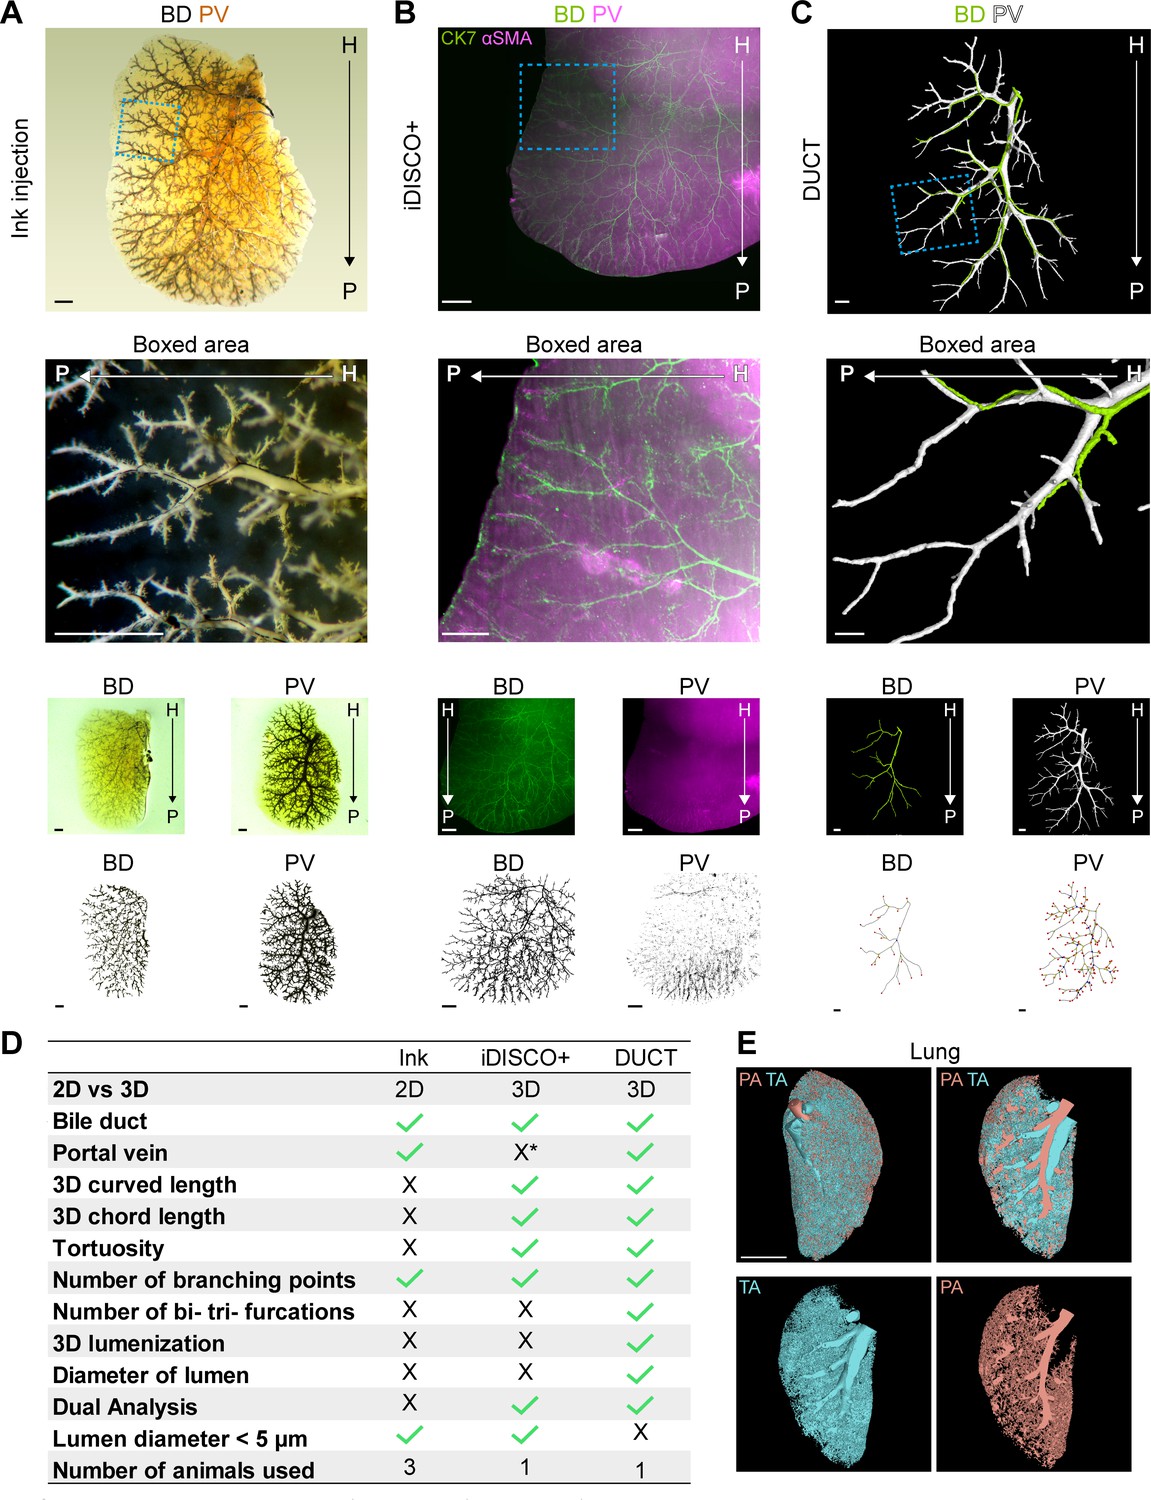
DUCT outperforms other state of the art techniques to visualize mouse liver in 3D.
(A) Whole liver ink injection into portal vein (PV, white ink) and bile duct (BD, black ink), followed by clearing, 2D imaging and filament tracing using Amira. (B) Whole mount immunofluorescence staining followed by iDISCO+ clearing shows BD labeled with cytokeratin 7 (CK7, green) and vascular smooth muscle cells (SMCs) with alpha SMC actin (αSMA, magenta). Filament tracing was done using Amira. (C) Double resin injection scanned with µ computed tomography (CT), and semi-automated segmentation of BD (green) and PV (white). BD and PV skeletonization illustrating branching nodes (bifurcations in yellow, trifurcations in blue, nodes > 3 in green and endpoints in red). (D) Table compares ink injection, whole mount immunofluorescence with iDISCO+ clearing and DUCT. * Refers to our results, in principle portal vein vasculature can be visualized. (E) DUCT applied to lung to visualize the airways (cyan, injection into trachea) and pulmonary vasculature (peach). Scale bars (A, B, C) 1 mm, (boxed area) 500 µm (E) 3 mm. Please note, the liver depicted in 1C is also depicted in the overview of all included livers, in the top panel in Figure 1—figure supplement 12B–D, and is also used to schematize the main branch in Figure 6—figure supplement 1A. BD, bile duct; PA, pulmonary artery; PV, portal vein; TA, trachea.
Figure 1—figure supplement 2
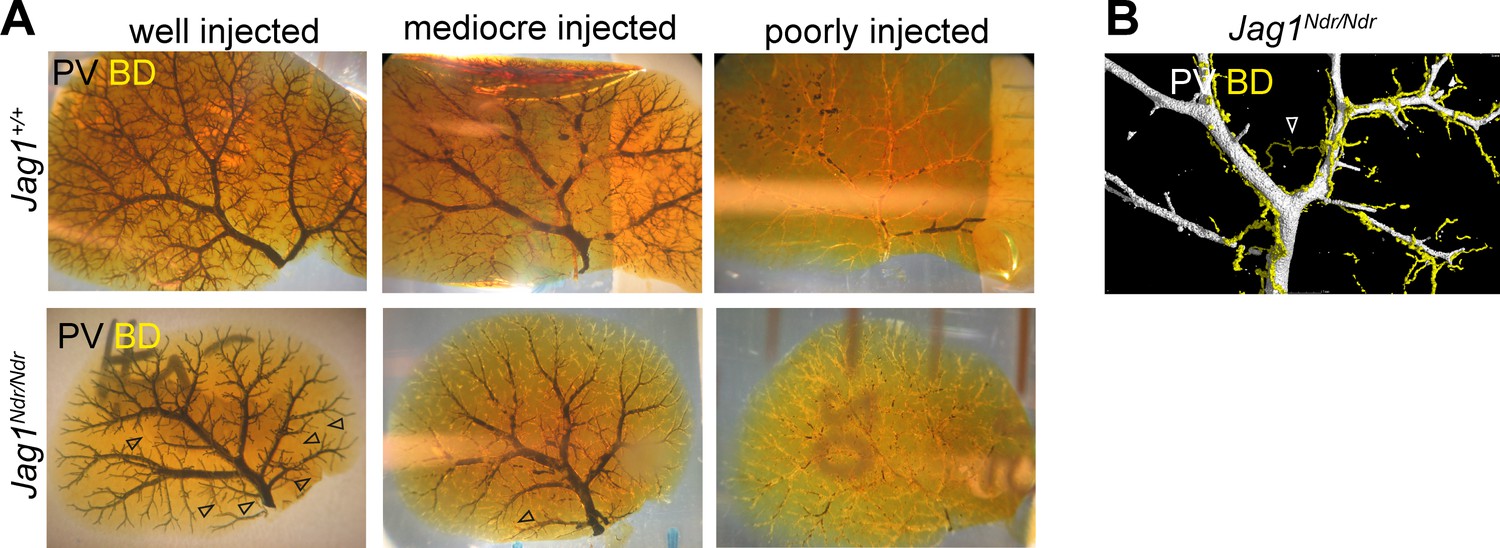
Resin injection quality control of the left lateral lobe.
(A) The left lateral lobe is cleared for quality control of injection success. Left panel is an example of a well-injected lobe suitable for scanning, middle panel of mild artifacts suitable for scanning (though with more extensive manual corrections during semi-automated segmentation), right panel of poor injections not suitable for scanning. (B) 3D reconstructed µCT scans of poorly injected liver (note very few side branches). Empty arrowheads point to a bile duct bridging between two portal veins.BD, bile duct; PV, portal vein.
Figure 1—figure supplement 3
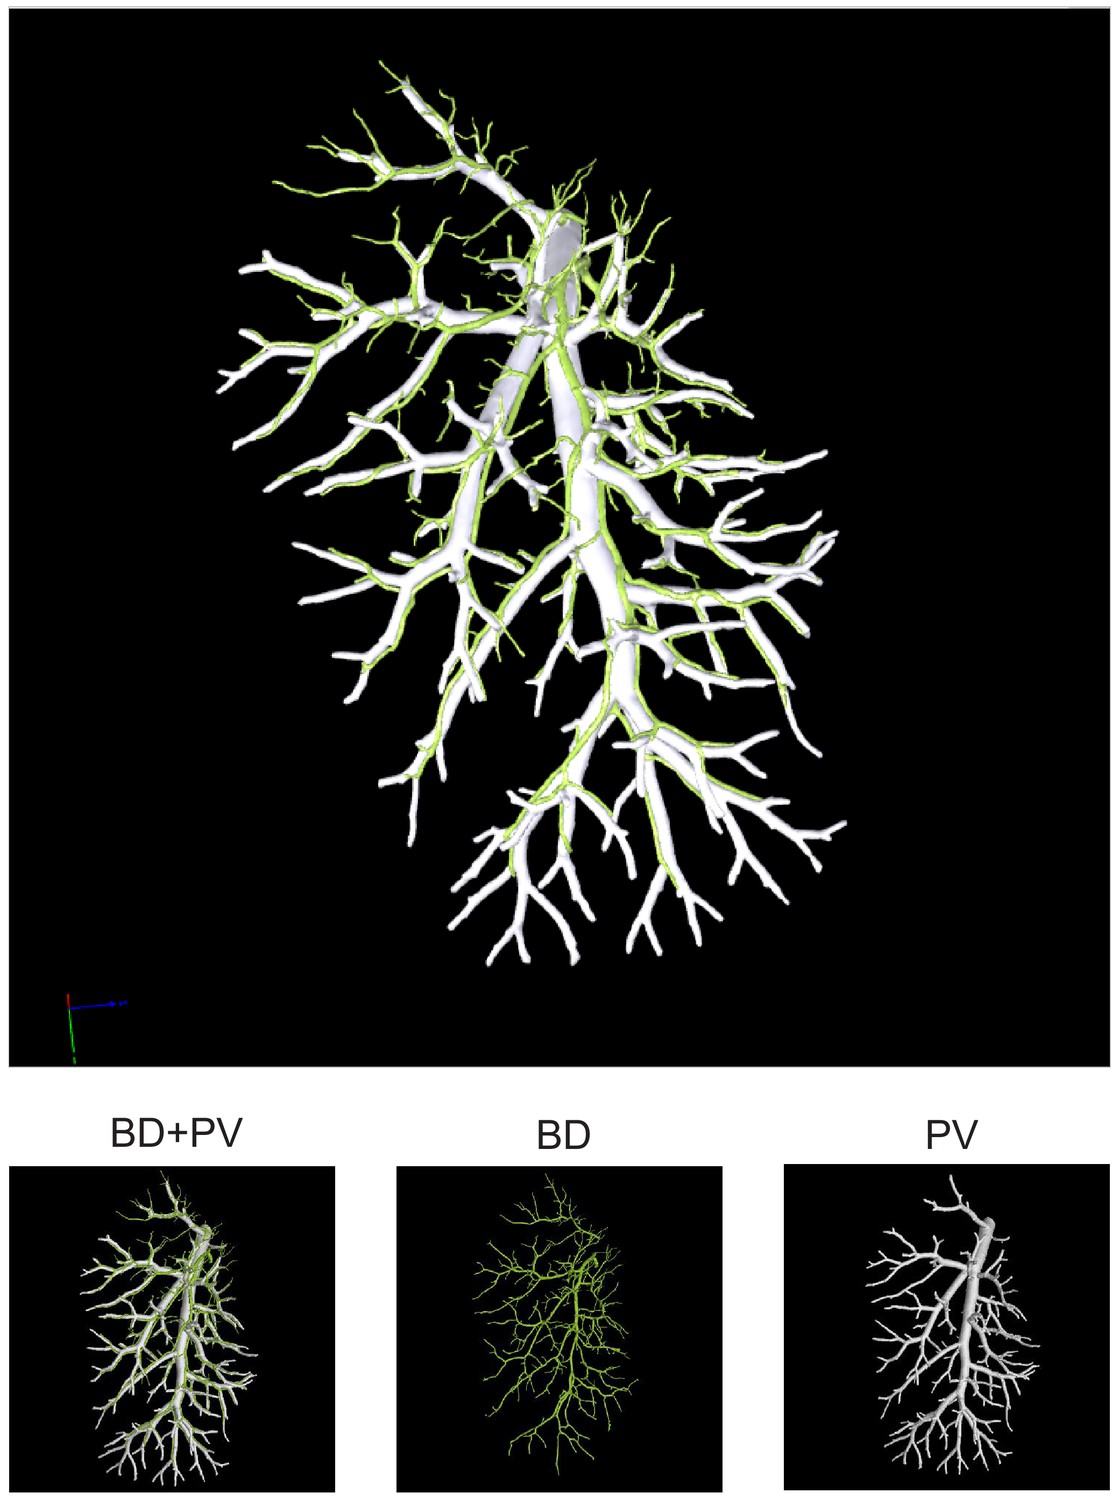
Liver cast of P15 Jag1+/+ showing bile duct (green) and portal vein (white) together (top panel) or separately (bottom panels).
Full interactive rotation available in Figure 1—figure supplement 3—source data 1.
-
Figure 1—figure supplement 3—source data 1
3D interactive liver cast shown in Figure 1—figure supplement 3.
- https://cdn.elifesciences.org/articles/60916/elife-60916-fig1-figsupp3-data1-v1.pdf
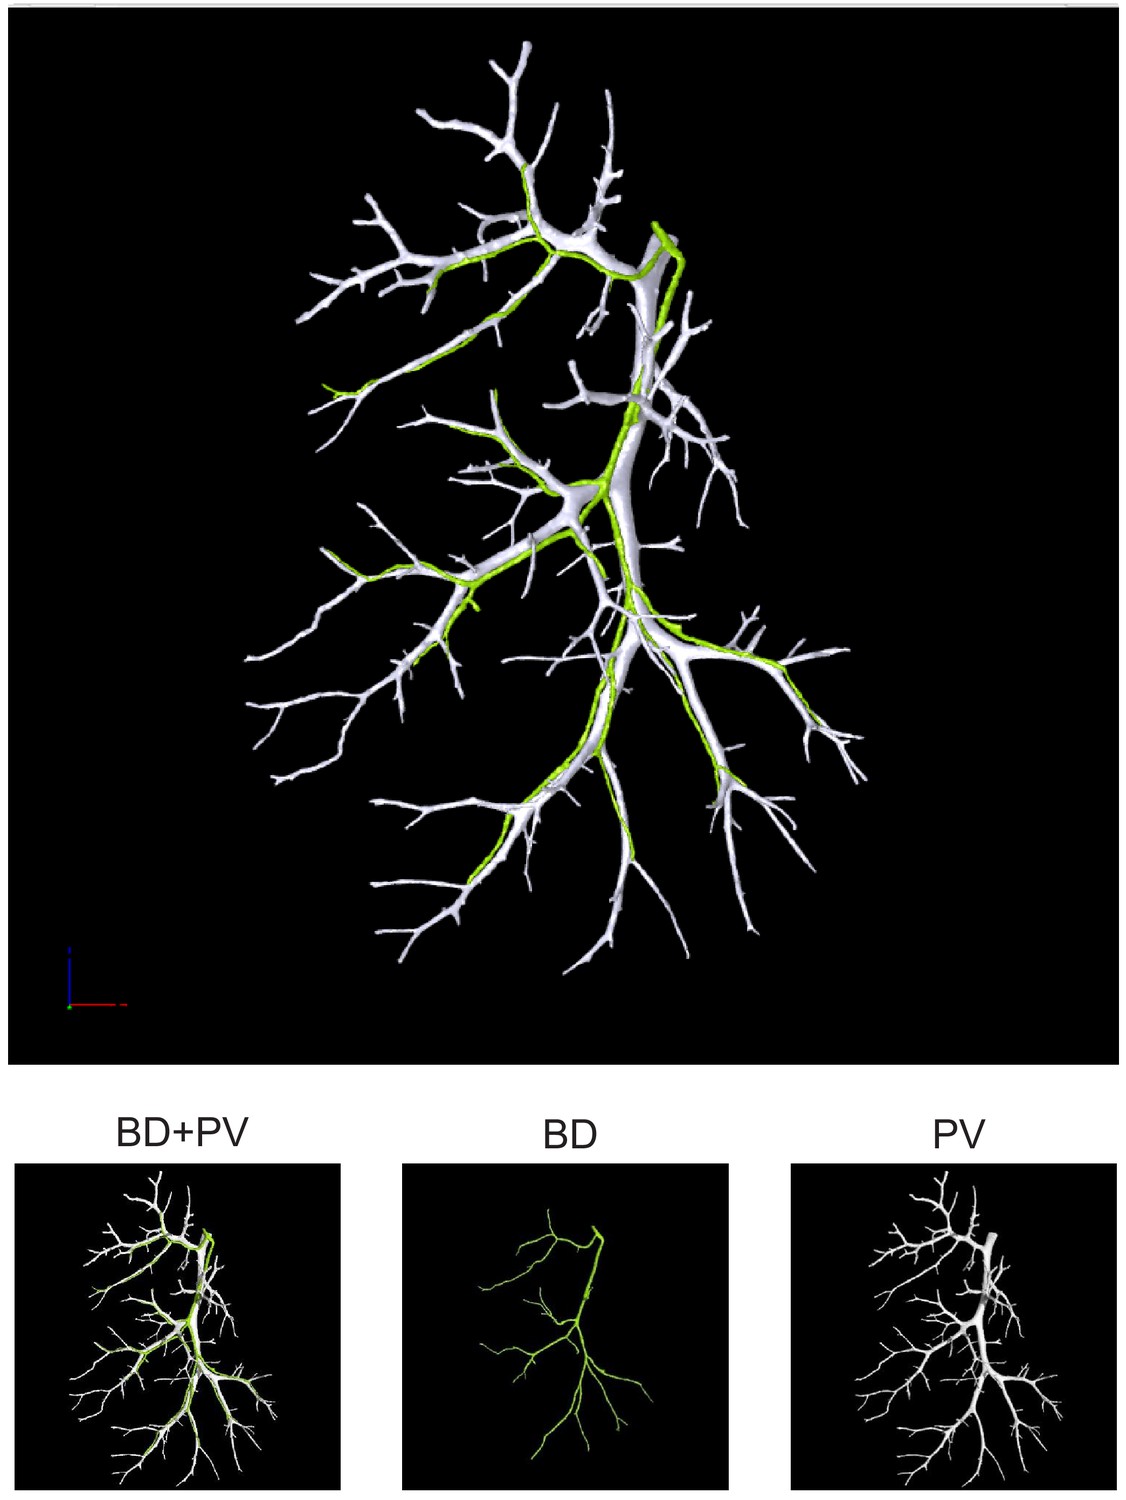
Figure 1—figure supplement 4

Liver cast of P15 Jag1Ndr/Ndr showing bile duct (green) and portal vein (white) together (top panel) or separately (bottom panels).
Full interactive rotation available in Figure 1—figure supplement 4—source data 1.
-
Figure 1—figure supplement 4—source data 1
3D interactive liver cast shown in Figure 1—figure supplement 4 .
- https://cdn.elifesciences.org/articles/60916/elife-60916-fig1-figsupp4-data1-v1.pdf
Figure 1—figure supplement 5
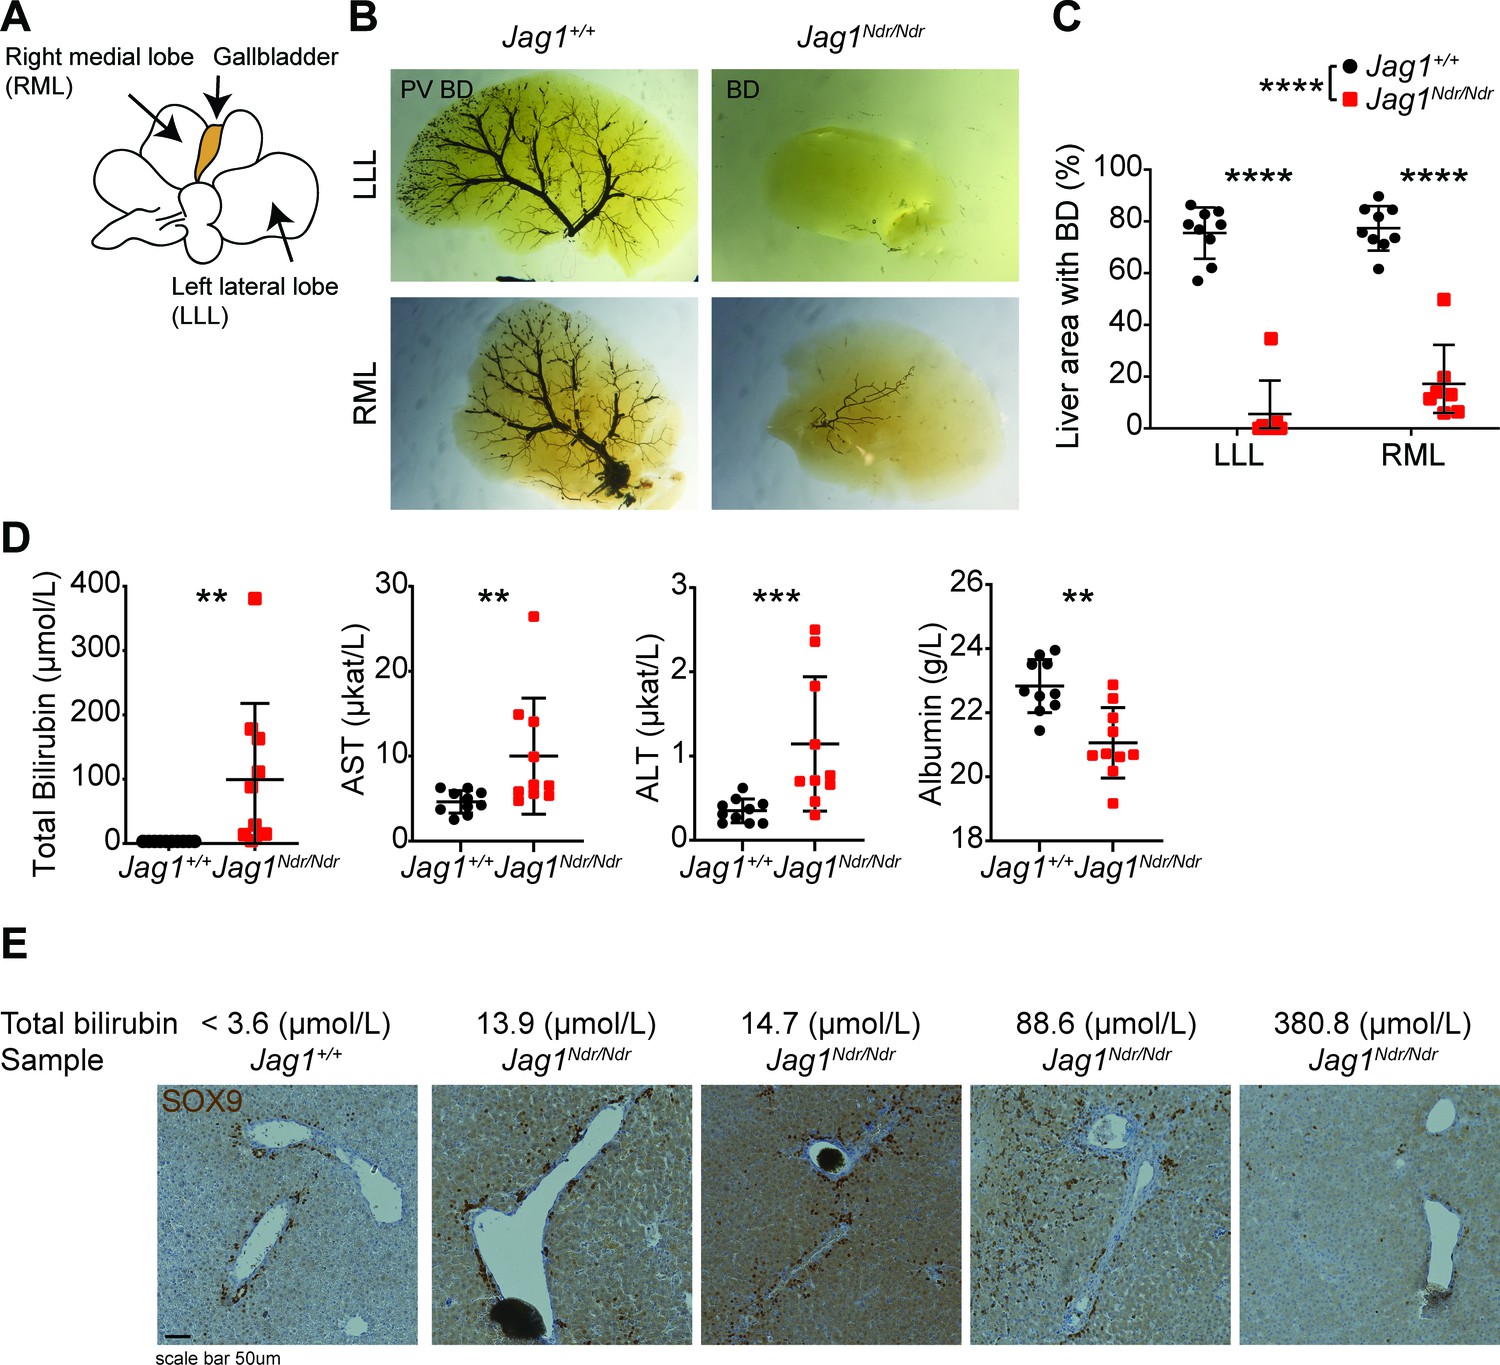
Jag1Ndr/Ndr bile ducts displayed heterogeneous de novo growth.
(A) Schematic of individual murine liver lobes, highlighting the right medial lobe (RML) next to the gallbladder and left lateral lobe (LLL). (B) Resin injected BABB cleared liver lobes revealed significant differences in the de novo growth of Jag1Ndr/Ndr BDs between LLL and RML. (C) Quantification of percentage of liver area containing resin injected BDs in the LLL and RML. Each dot represents one animal, lines show mean value ± standard deviation. Statistical test two-way ANOVA, left p<0.0001; followed by Sidak's multiple comparisons test; p<0.0001 (*****). (D) Total bilirubin serum levels. In wild-type mice, the total bilirubin levels were bellow detection (<3.6). Each dot represents one animal, lines show mean value ± standard deviation. Statistical test Wilcoxon matched-pairs signed rank test, p=0.0020. Total serum aspartate aminotransferase (AST), alanine aminotransferase (ALT) and albumin levels. Each dot represents one animal, lines show mean value ± standard deviation. Statistical test Mann-Whitney test; AST, p=0.0056; ALT, p=0.0007; albumin, p=0.0015. (E) 2D histological P15 central liver sections stained with early biliary marker SOX9. In wild type mouse (left panel) lumenized BD were detected, whereas in Jag1Ndr/Ndr no lumenized BD were observed and the number of SOX9+ cells was heterogeneous between animals. Scale bar 50 µm. BABB, benzyl alcohol, benzyl benzoate; BD, bile duct; LLL left lateral lobe; PV, portal vein; RML, right medial lobe.
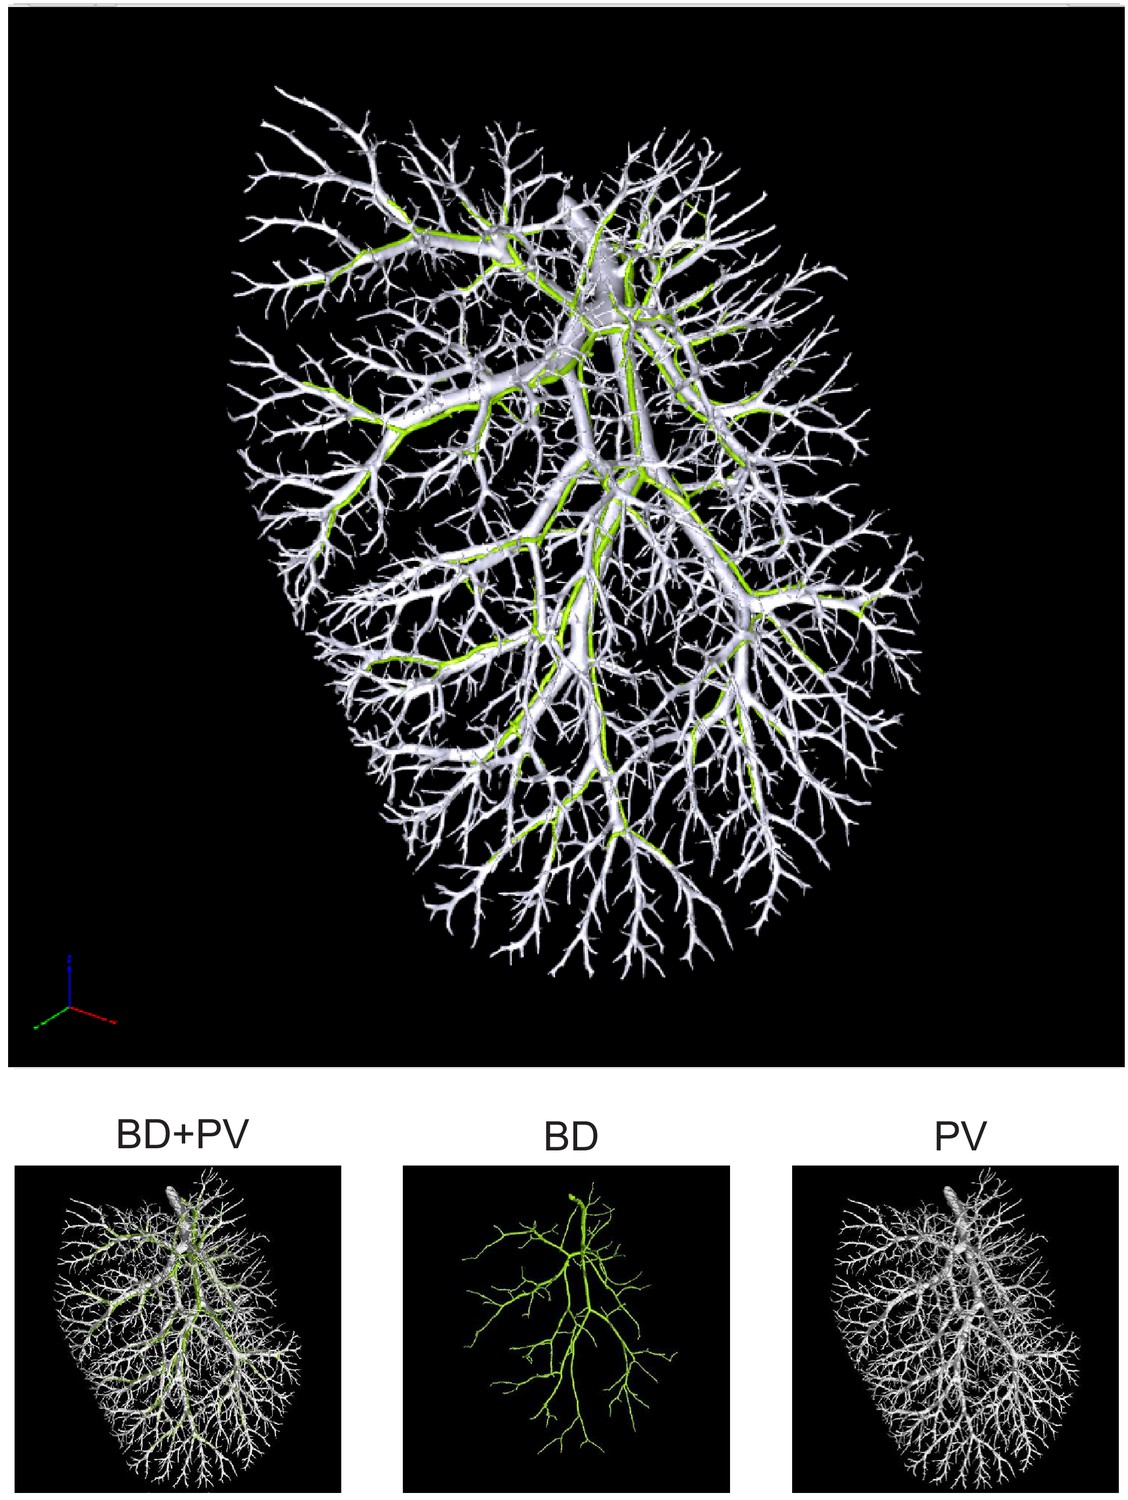
Figure 1—figure supplement 6
Liver cast of adult Jag1+/+ showing bile duct (green) and portal vein (white) together (top panel) or separately (bottom panels).
Full interactive rotation available in Figure 1—figure supplement 6—source data 1.
-
Figure 1—figure supplement 6—source data 1
3D interactive liver cast shown in Figure 1—figure supplement 6.
- https://cdn.elifesciences.org/articles/60916/elife-60916-fig1-figsupp6-data1-v1.pdf
Figure 1—figure supplement 7
Liver cast of adult Jag1+/+ showing bile duct (green) and portal vein (white) together (top panel) or separately (bottom panels).
Full interactive rotation available in Figure 1—figure supplement 7—source data 1.
-
Figure 1—figure supplement 7—source data 1
3D interactive liver cast shown in Figure 1—figure supplement 7.
- https://cdn.elifesciences.org/articles/60916/elife-60916-fig1-figsupp7-data1-v1.pdf
Figure 1—figure supplement 8
Liver cast of adult Jag1+/+ showing bile duct (green) and portal vein (white) together (top panel) or separately (bottom panels).
Full interactive rotation available in Figure 1—figure supplement 8—source data 1.
-
Figure 1—figure supplement 8—source data 1
3D interactive liver cast shown in Figure 1—figure supplement 8.
- https://cdn.elifesciences.org/articles/60916/elife-60916-fig1-figsupp8-data1-v1.pdf
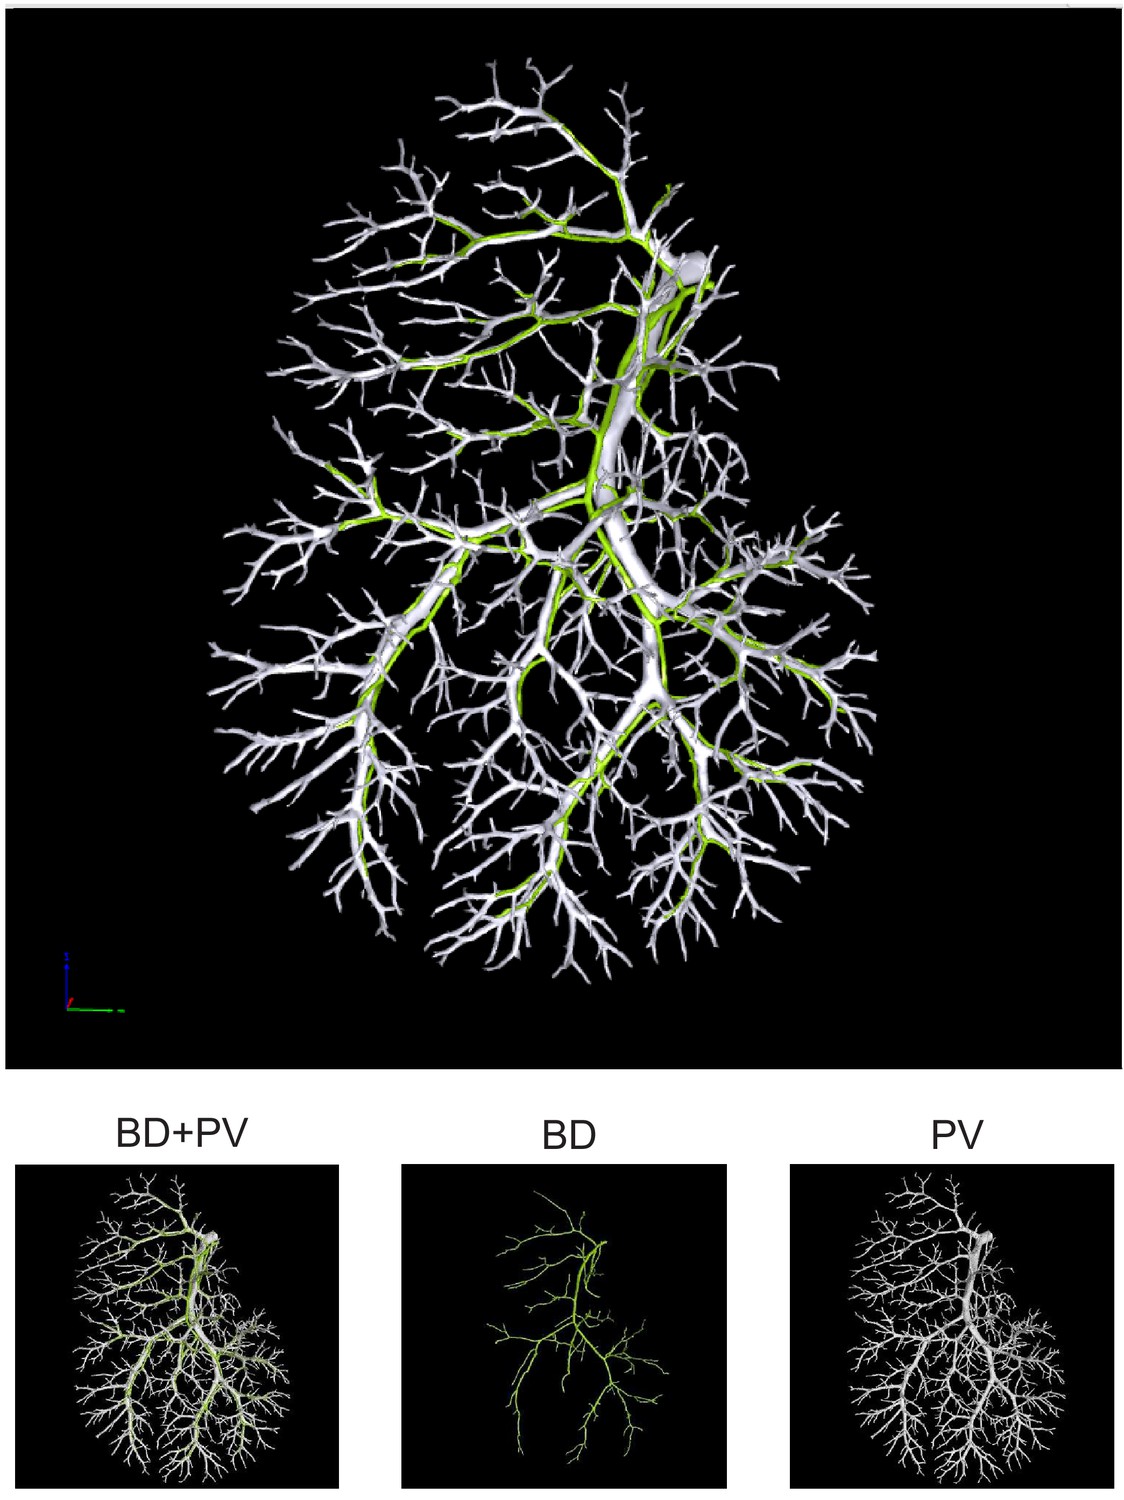
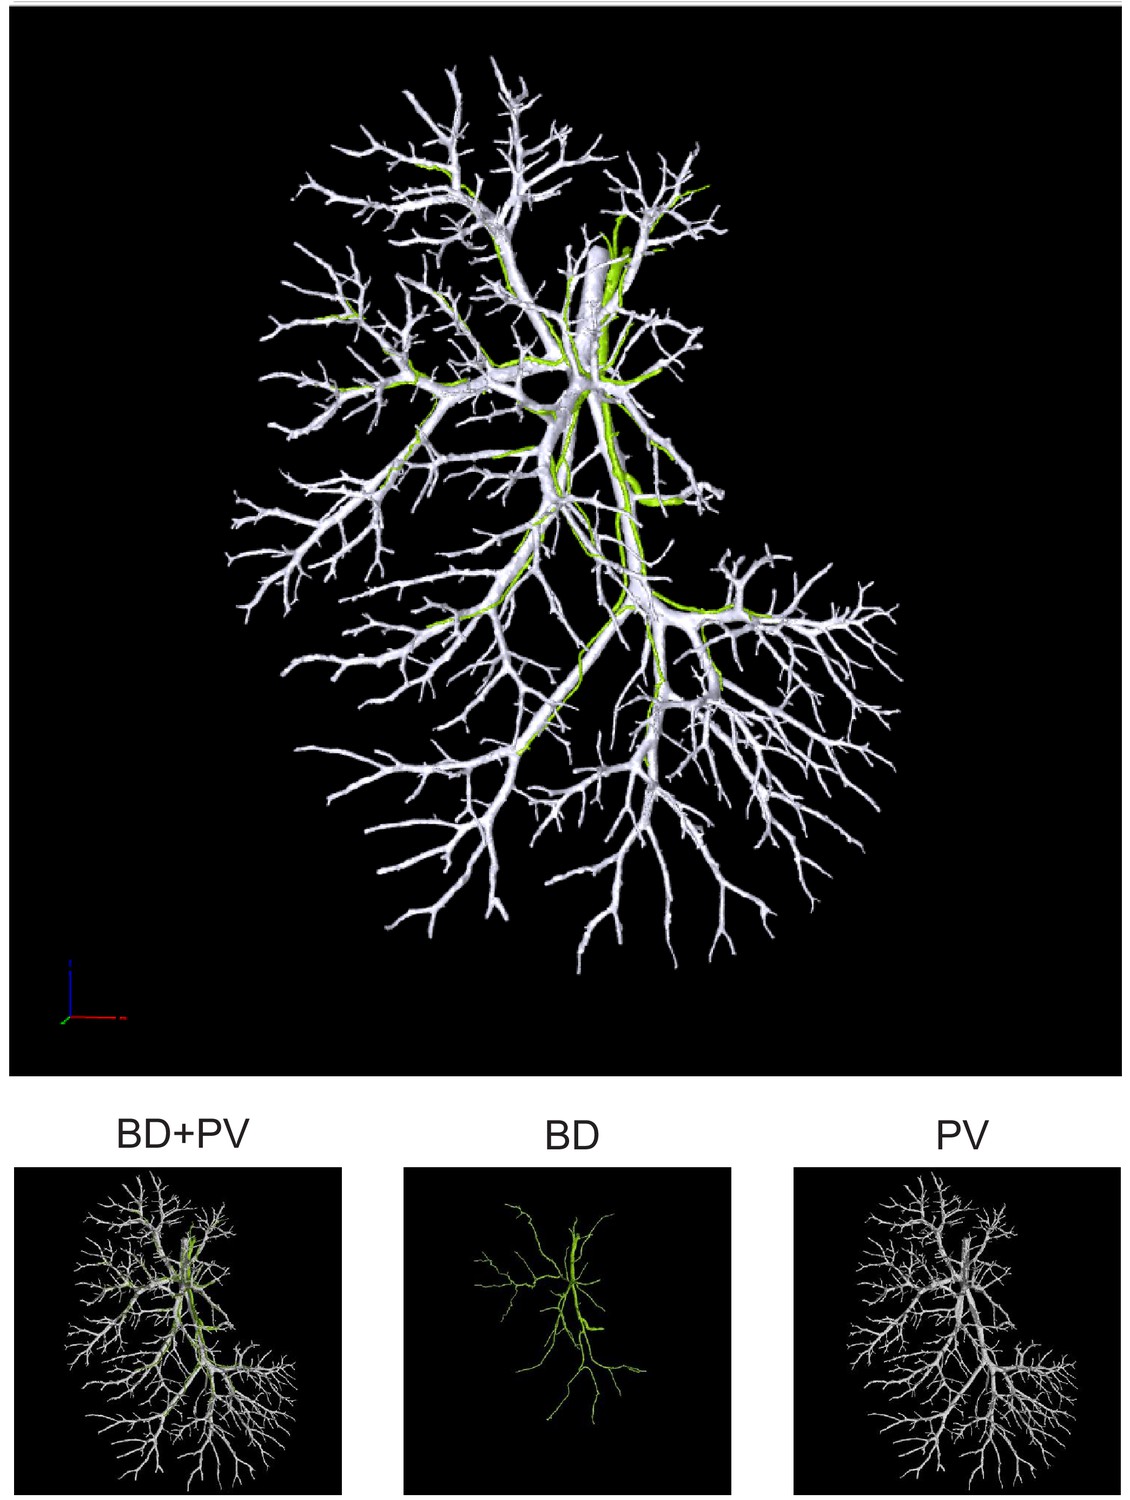
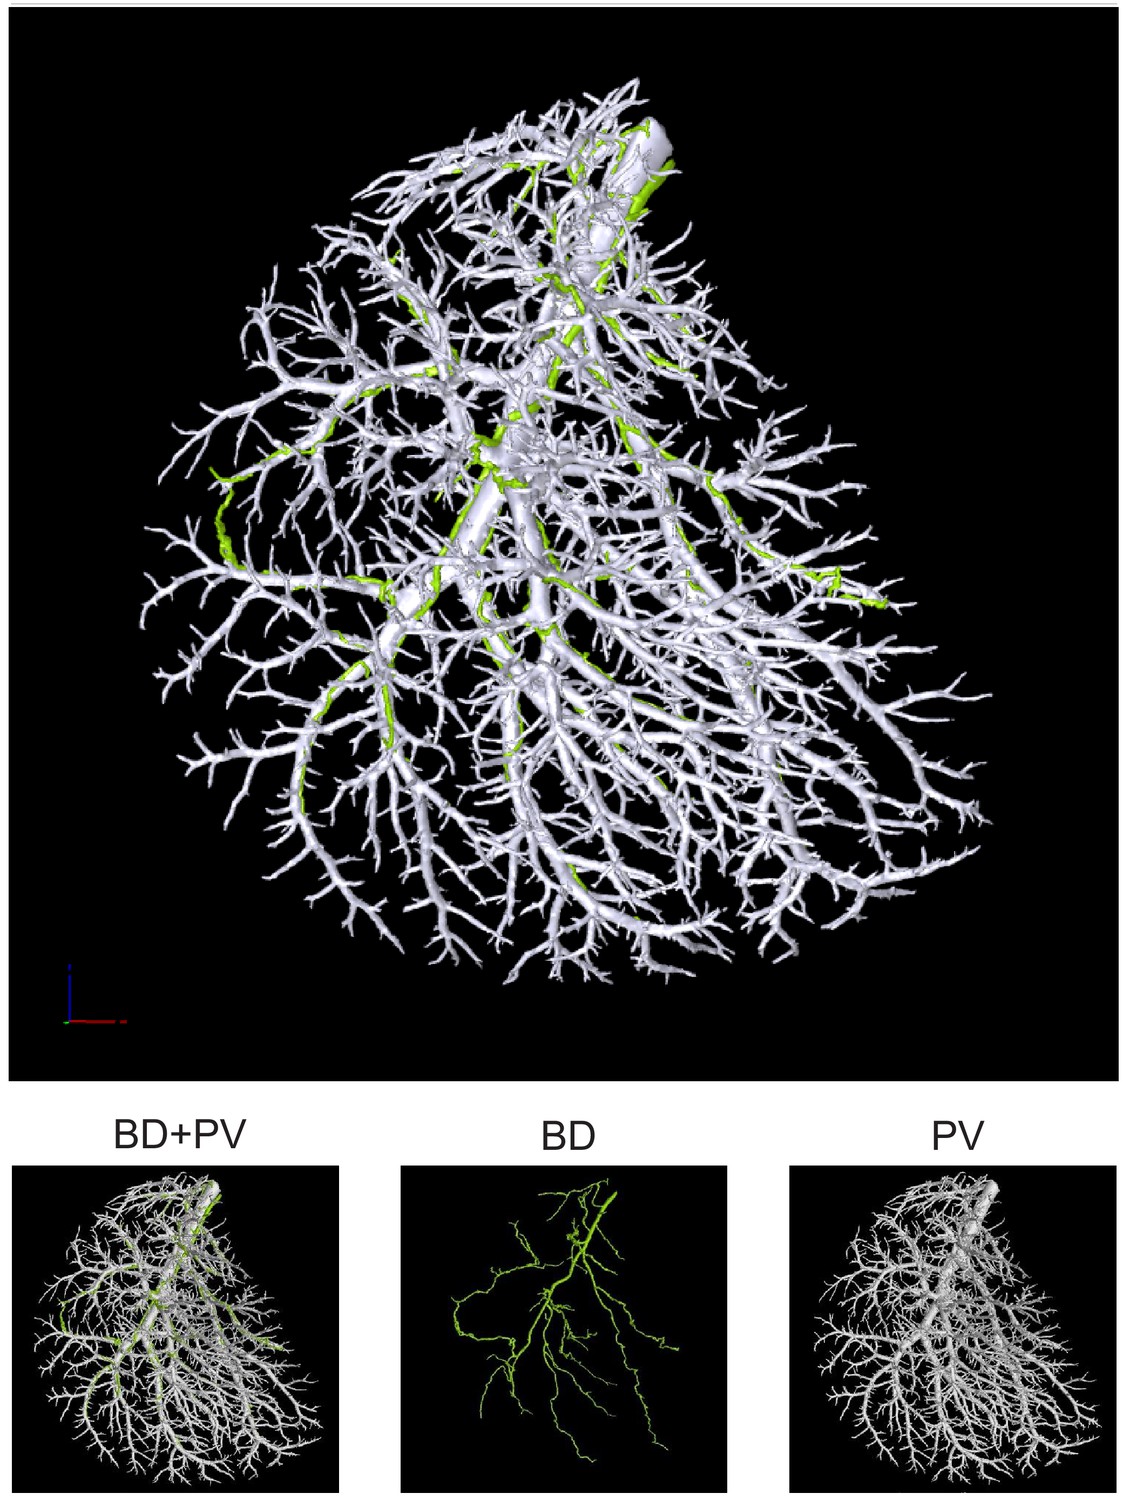
Figure 1—figure supplement 9
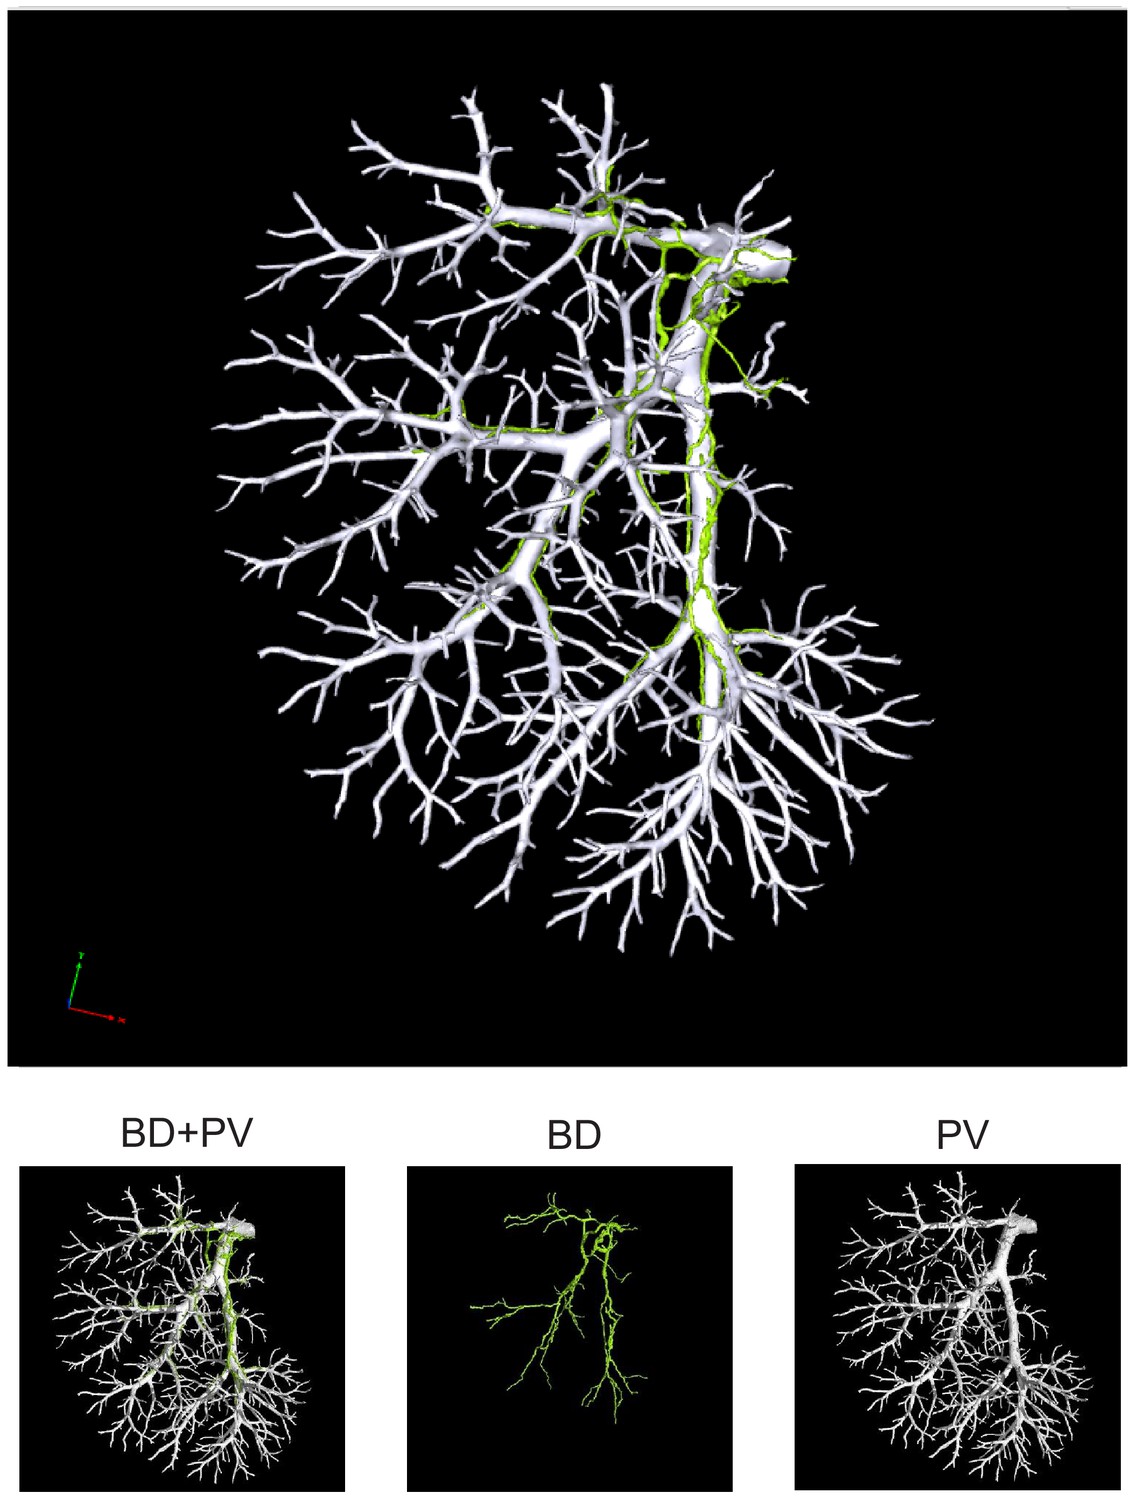
Liver cast of adult Jag1Ndr/Ndr showing bile duct (green) and portal vein (white) together (top panel) or separately (bottom panels).
Full interactive rotation available in Figure 1—figure supplement 9—source data 1.
-
Figure 1—figure supplement 9—source data 1
3D interactive liver cast shown in Figure 1—figure supplement 9.
- https://cdn.elifesciences.org/articles/60916/elife-60916-fig1-figsupp9-data1-v1.pdf
Figure 1—figure supplement 10
Liver cast of adult Jag1Ndr/Ndr showing bile duct (green) and portal vein (white) together (top panel) or separately (bottom panels).
Full interactive rotation available in Figure 1—figure supplement 10—source data 1.
-
Figure 1—figure supplement 10—source data 1
3D interactive liver cast shown in Figure 1—figure supplement 10.
- https://cdn.elifesciences.org/articles/60916/elife-60916-fig1-figsupp10-data1-v1.pdf
Figure 1—figure supplement 11
Liver cast of adult Jag1Ndr/Ndr showing bile duct (green) and portal vein (white) together (top panel) or separately (bottom panels).
Full interactive rotation available in Figure 1—figure supplement 11—source data 1.
-
Figure 1—figure supplement 11—source data 1
3D interactive liver cast shown in Figure 1—figure supplement 11.
- https://cdn.elifesciences.org/articles/60916/elife-60916-fig1-figsupp11-data1-v1.pdf
Figure 1—figure supplement 12

Overview of 3D reconstructed bile duct and portal vein systems, their branching skeletons and volume.
(A) Scheme illustrating stereotype PV branching in Jag1+/+ right medial lobe. (B) DUCT liver casts from superior and inferior views of Jag1+/+ animals (C) with overlaid color-coded portal vein branches. (D) Branching skeletons generated by DUCT pipeline. Bifurcations are depicted with yellow nodes, trifurcations in blue, nodes > 3 in green and endpoints in red. (E) DUCT liver casts from superior and inferior view of Jag1Ndr/Ndr right medial liver lobe with (F) overlaid color-coded portal vein branches demonstrating architectural variability. (G) Branching skeletons generated with DUCT pipeline. (H) Overall volume of PV system (left) and BD/PV system volume ratio (right). (I) PV and BD diameter analysis. (H, I) Each dot represents one animal; lines show mean value ± standard deviation. Statistical test (H) unpaired t-test, left panel p=0.4434, right panel p=0.0594 (I) two-way ANOVA, left panel p=0.4588, right panel p=0.3610. Please note, the livers depicted in B and E, are also used in Figures 1–6, Figure 1—figure supplement 1C and to schematize the main branch in Figure 6—figure supplement 1A. BD, bile duct; DUCT, double resin casting micro computed tomography, PV, portal vein.
Figure 2 with 1 supplement
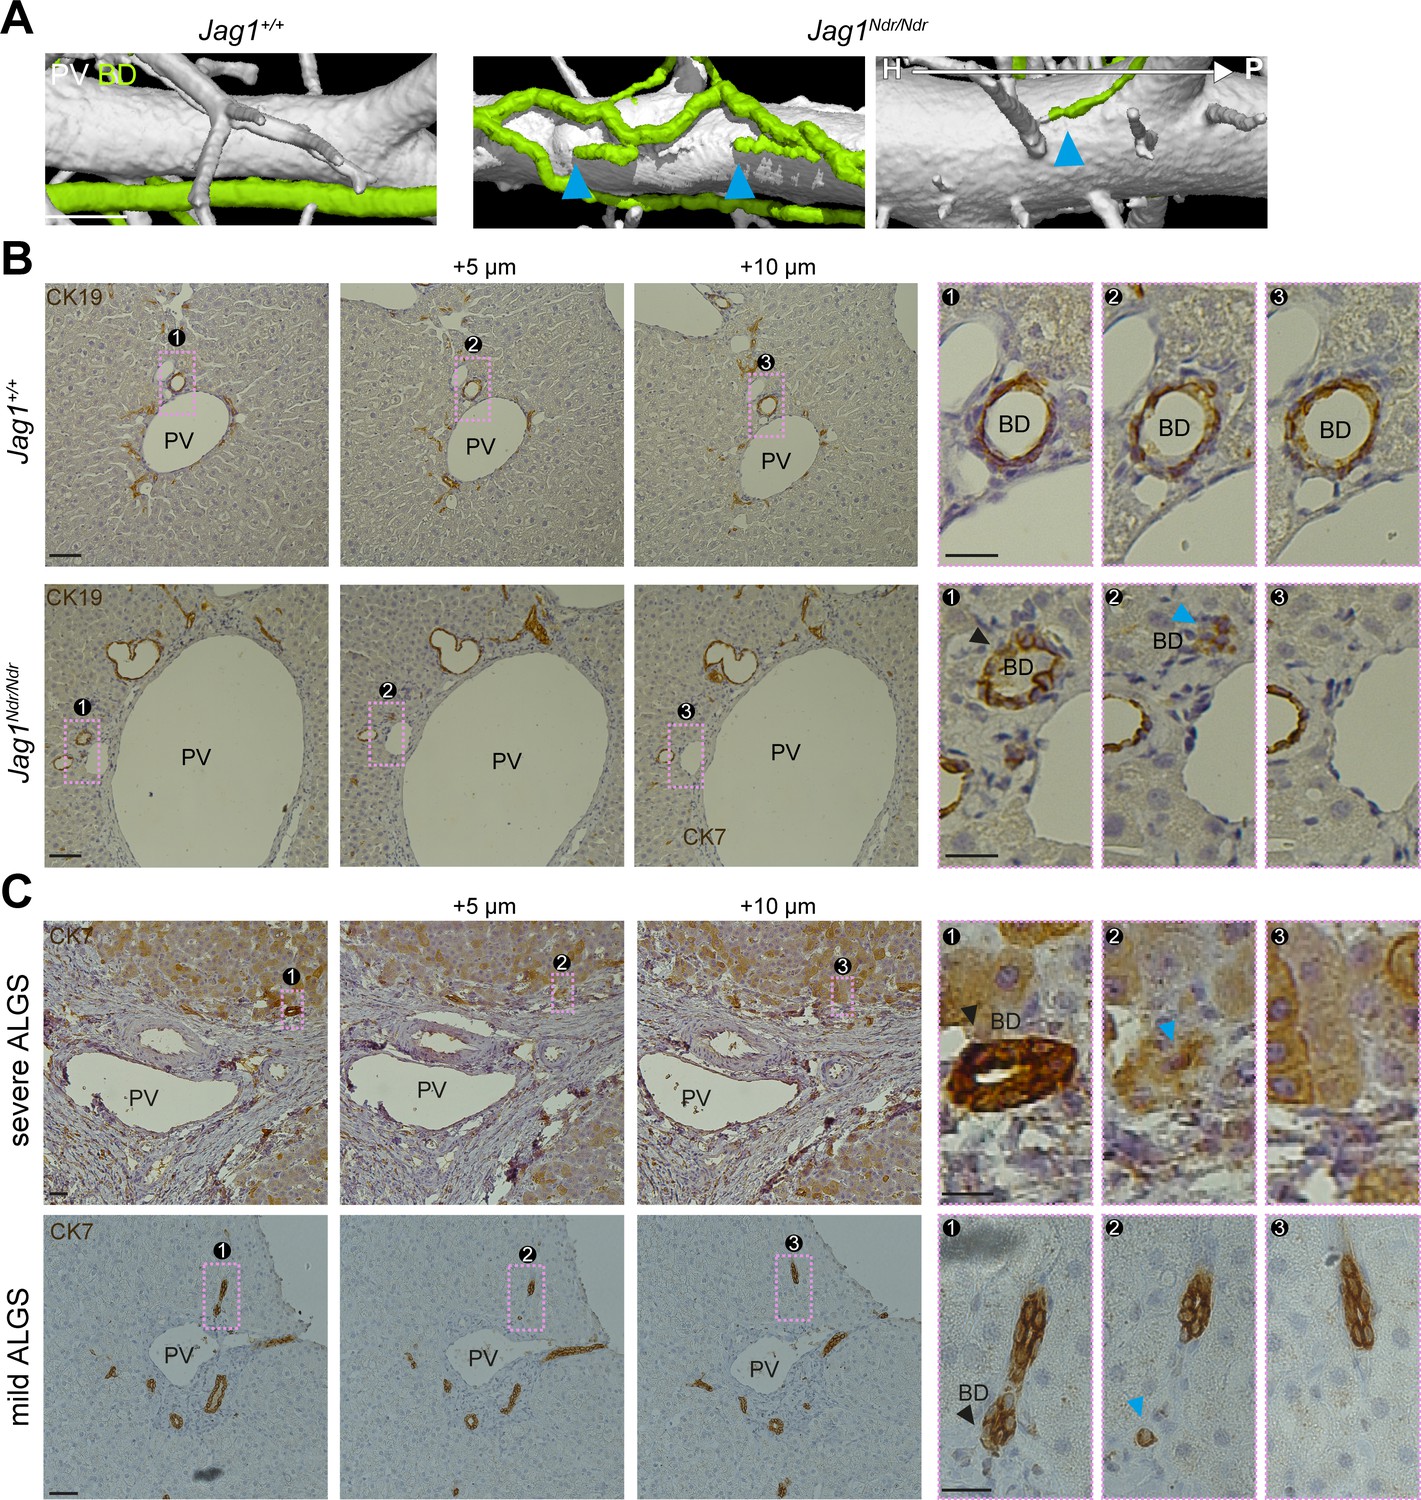
Alagille syndrome human and murine bile ducts end abruptly.
(A) Jag1Ndr/Ndr BDs (right panel) terminated randomly and facing toward the hilum (blue arrowheads). (B) 2D histological consecutive liver sections confirmed abruptly terminating BDs in Jag1Ndr/Ndr liver. Black arrowhead depicts lumenized well-formed BD that ended in the following sections (blue arrowhead). (C) BDs in patients with severe ALGS (top panel) or mild ALGS (bottom panel) terminate abruptly (blue arrowhead) in consecutive liver histological sections. Scale bars (A) 500 µm, (B left panels), (C) 50 µm, (B boxed region) 20 µm. ALGS, Alagille syndrome; BD, bile duct; CK, cytokeratin; H, hilar; P, peripheral. PV, portal vein.
Figure 2—figure supplement 1
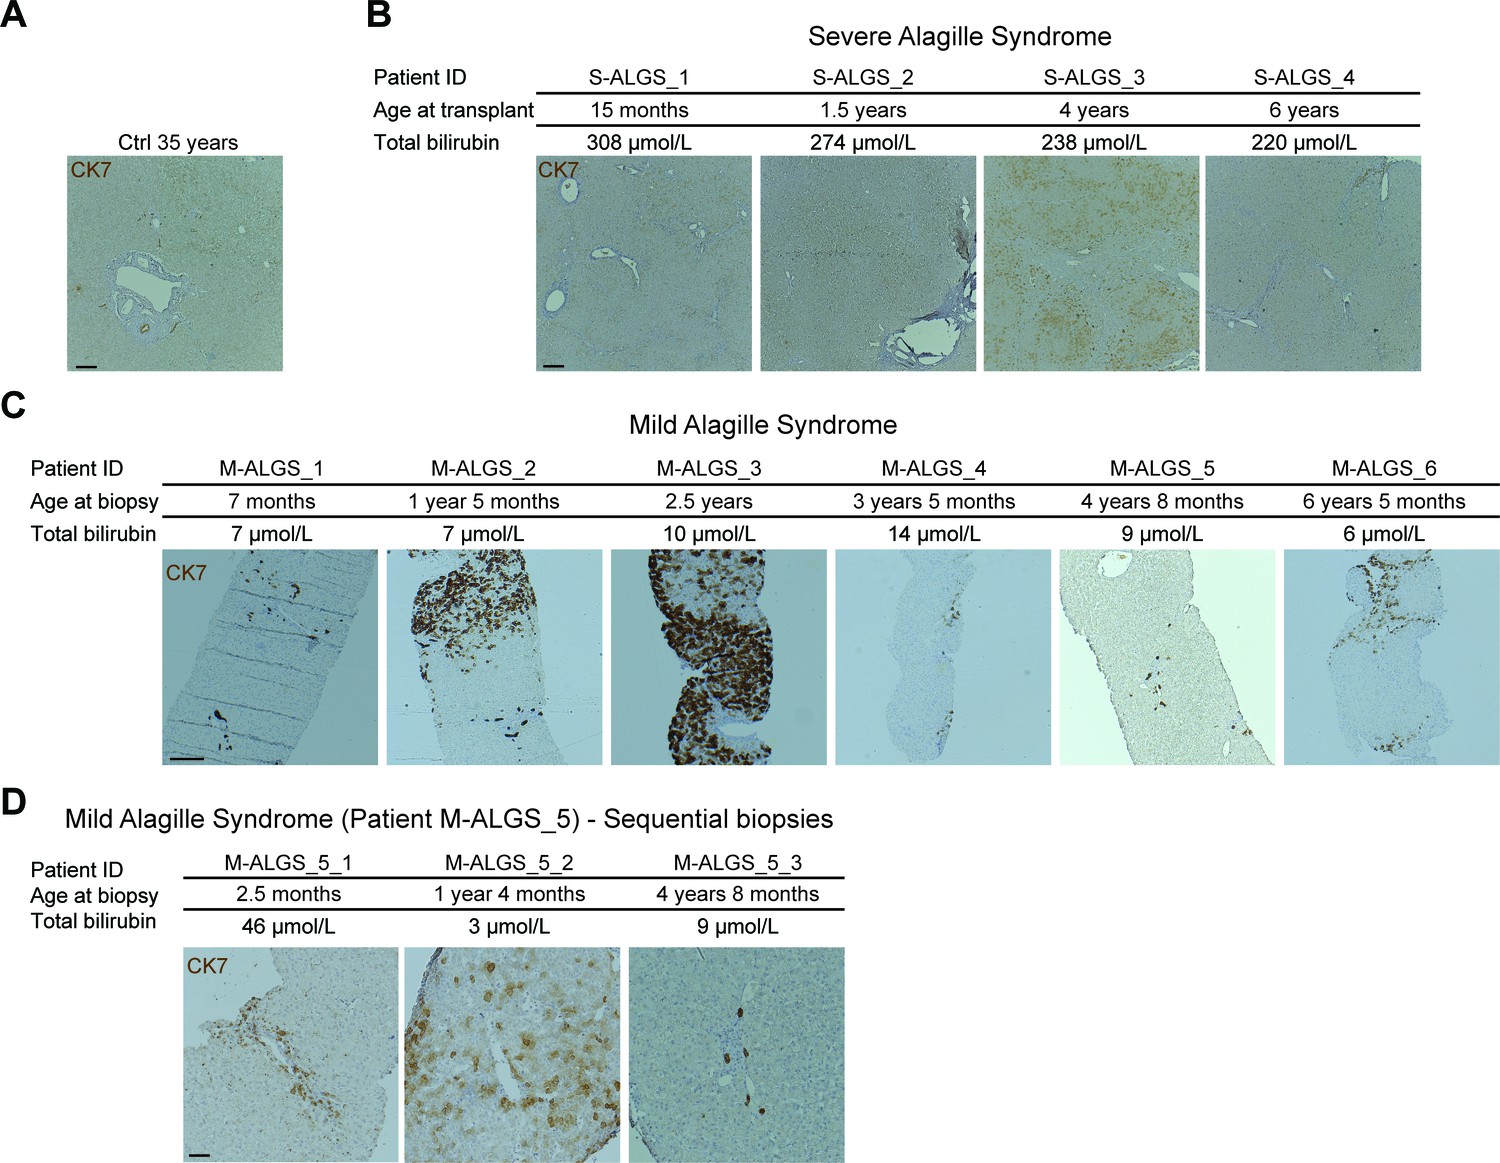
Overview of liver samples from patients with Alagille syndrome stained for CK7.
(A) 2D liver section from a healthy control shows a round lumenized BD adjacent to the portal vein. (B) Representative 2D histological sections from four patients with severe ALGS. The age at liver transplantation and total bilirubin levels are above each panel. (C) Representative 2D histological sections from six patients with mild ALGS. The age at liver biopsy and total bilirubin levels are above each panel. (D) 2D histological sections of liver biopsies from patient #5 with mild ALGS showing phenotypic recovery with no bile ducts, but some CK+ hepatocytes at 2.5 months, numerous CK7+ hepatocytes at 1 year and 4 months, and lumenized CK7+ bile ducts at 4 years and 8 months, and no more CK7+ hepatocytes. Scale bars in (A), (B), (C) 200 µm. Scale bar in (D) 50 µm. ALGS, Alagille syndrome; CK7, cytokeratin 7.
Figure 3
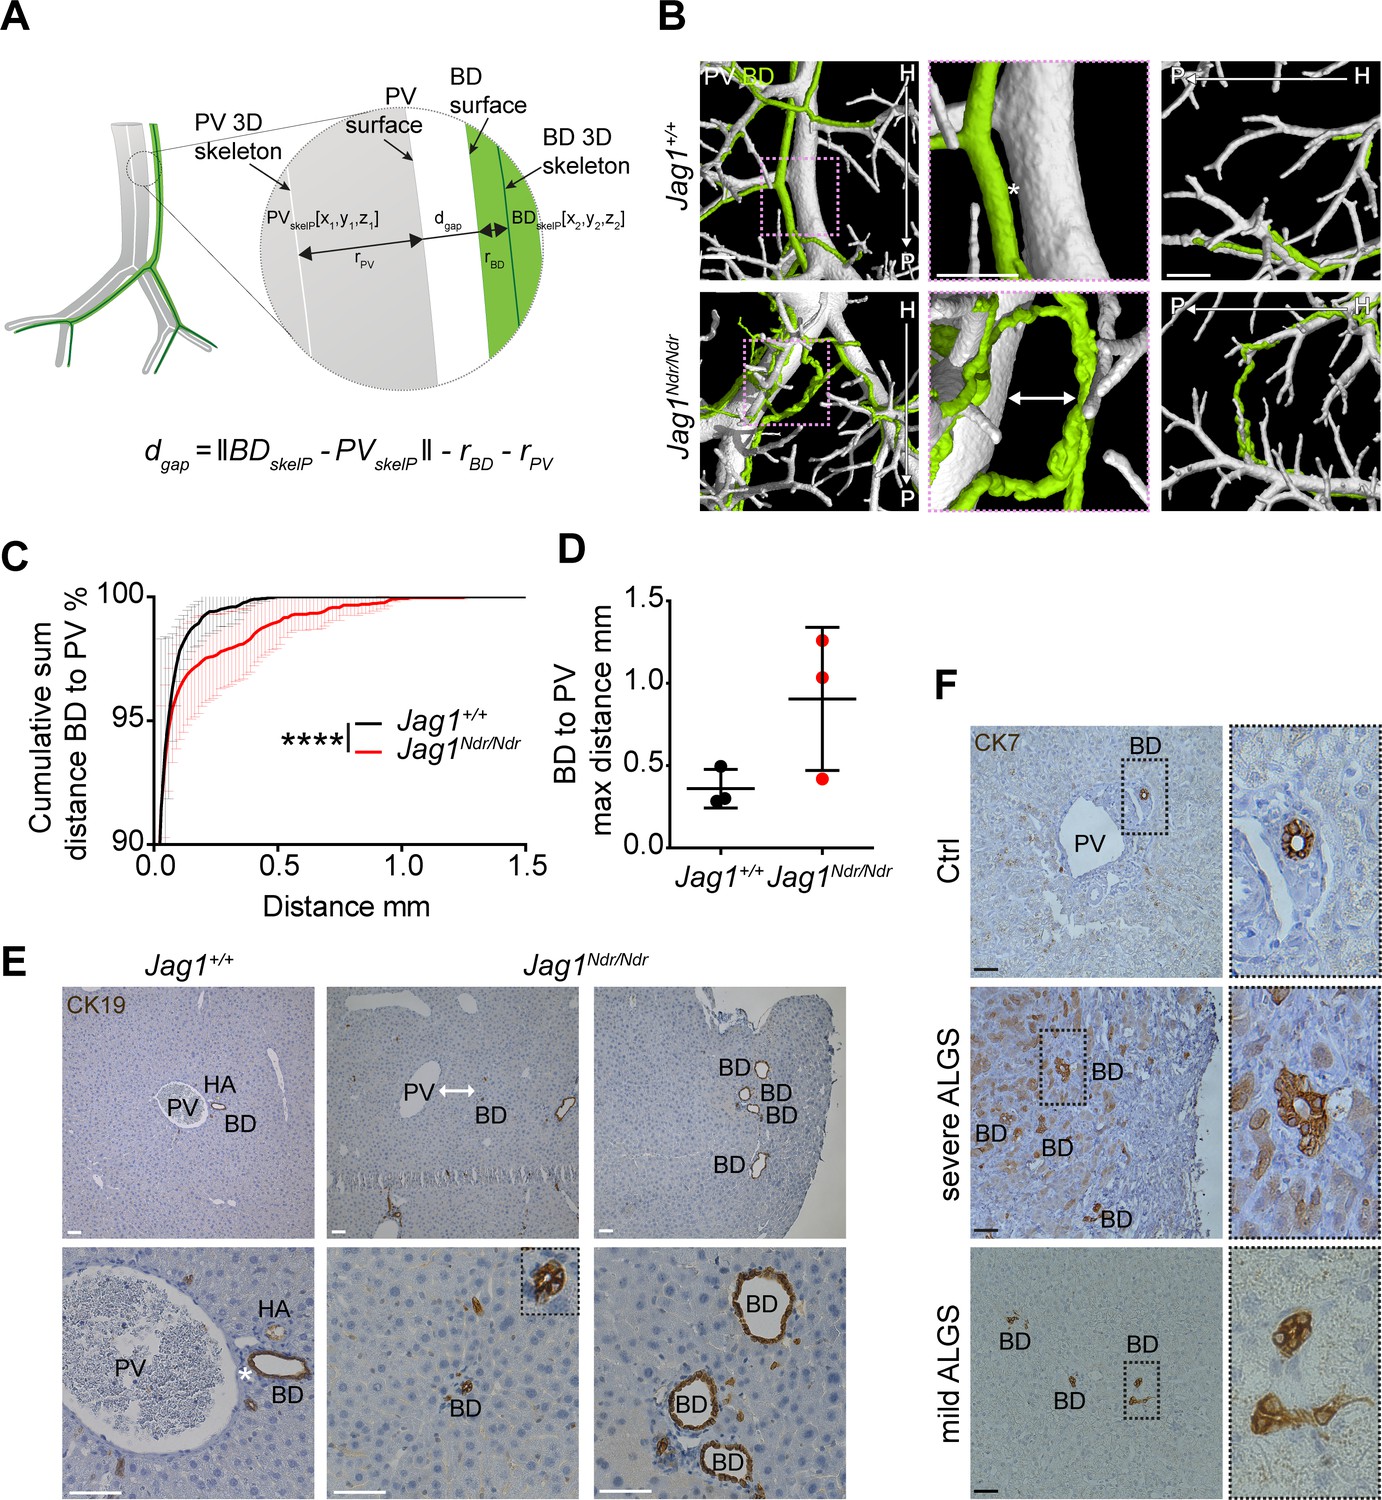
Alagille syndrome human and murine de novo generated bile ducts are further from portal veins.
(A) Scheme of BD to PV surface distance analysis. PVskelP = single point on PV skeleton, BDskelP = single point on BD skeleton, rPV = radius of PV at PVskelP (i.e. minimal distance from PVskelP to PV surface), rBD = radius of BD at BDskelP (i.e. minimal distance from BDskelP to BD surface), dgap = gap distance, which is derived by subtracting the radii from the skeleton to skeleton distance. (B) 3D rendering shows homogenous distance between a BD and PV in Jag1+/+ livers (asterisk), but a large heterogeneous distance in Jag1Ndr/Ndr liver (double-headed arrow). Right panel shows a parenchymal bile duct traversing between two PVs at the Jag1Ndr/Ndr liver edge. Scale bar 500 µm. (C) Cumulative sum of percentage of BDs at a given distance from the nearest PV. 3 Jag1+/+ and 3 Jag1Ndr/Ndr mice were used. Bars represent mean ± standard deviation, Kolmogorov - Smirnov test (on raw data), p<0.0001, (****). For individual data points see Figure 3—source data 1. (D) Maximum distance between BD and PV. Each dot represents one animal, bars are mean ± standard deviation, unpaired t-test, p=0.1041, not significant. (E) BD – PV distances confirmed in 2D histological sections. Overview in top panel and magnification in bottom panel. Jag1Ndr/Ndr PVs can be present in the parenchyma far from (middle panels), or independent of (right panels), the nearest PV. Scale bars 50 µm. (F) Healthy human liver with BD close to PV (top panel). Parenchymal CK7+ BDs in histological liver sections from a patient with severe ALGS (middle panel) and distant BDs in a patient with mild ALGS (bottom panel). Magnification shows lumenization of BDs. Scale bar 50 µm. ALGS, Alagille syndrome, BD, bile duct; CK, cytokeratin; H, hilar; HA, hepatic artery; P, peripheral; PV, portal vein.
-
Figure 3—source data 1
Raw data measuring the distance from the surface of bile duct to a portal vein surface.
- https://cdn.elifesciences.org/articles/60916/elife-60916-fig3-data1-v1.xlsx
Figure 4 with 1 supplement
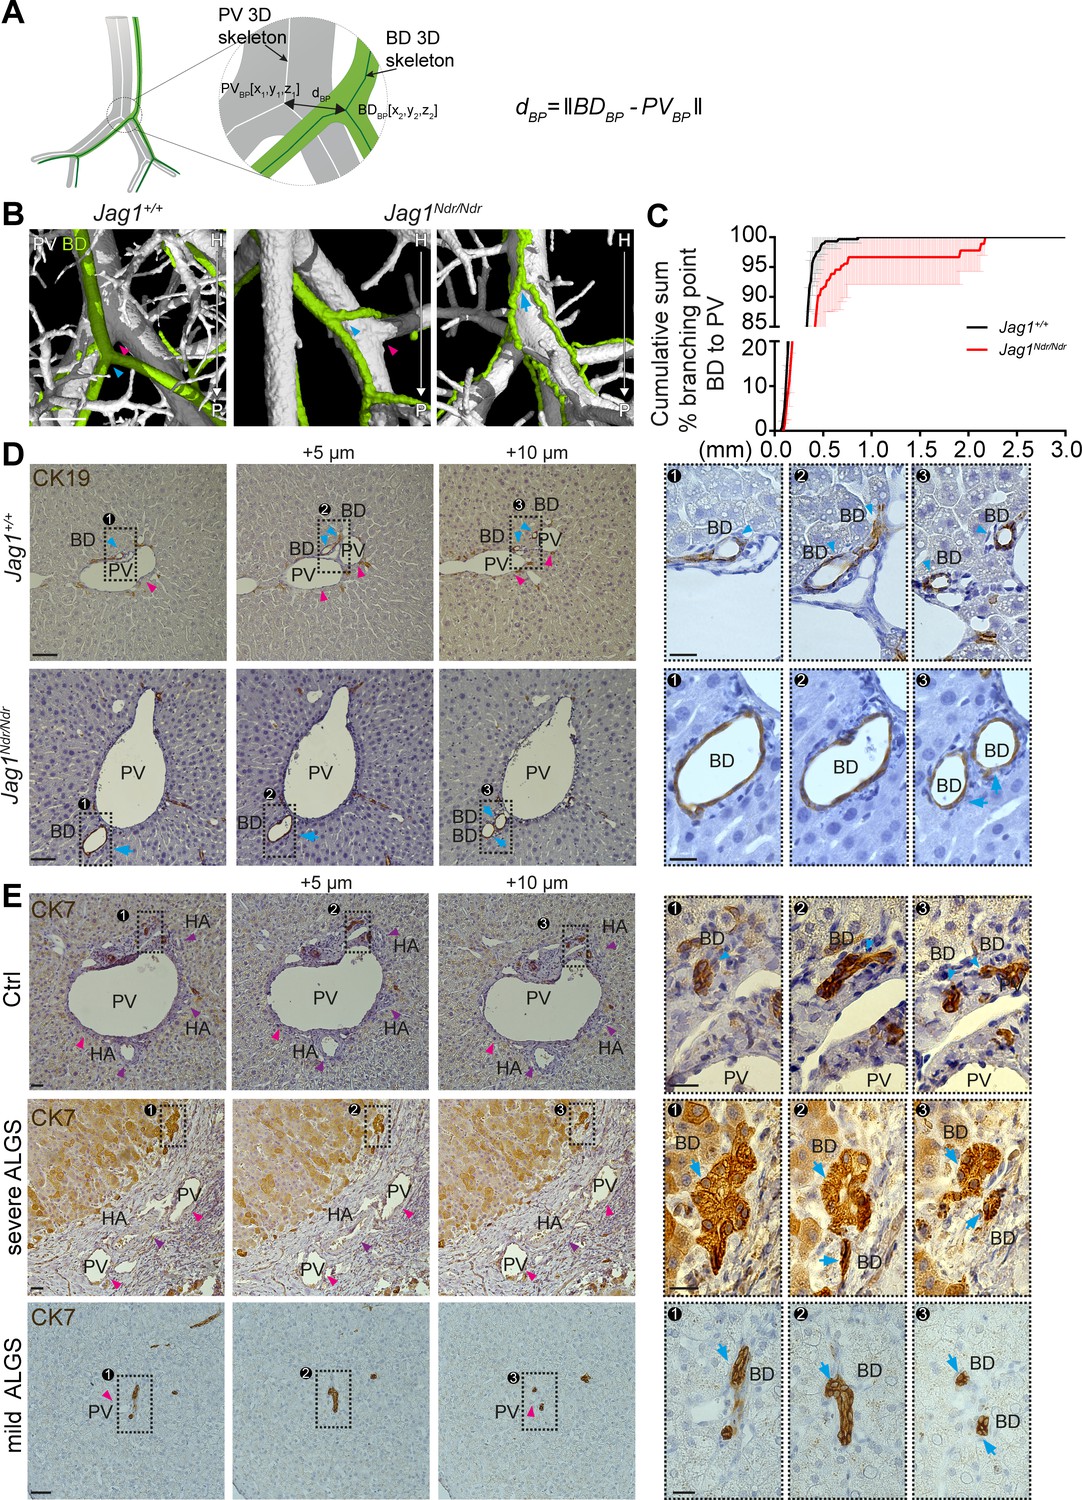
Alagille syndrome human and murine de novo generated bile ducts display branching independent of portal vein branching.
(A) Scheme representing BD to PV branch point analysis. PVBD = PV branch point, BDBD = BD branch point, dBP = Euclidean 3D distance between branch points. (B) Branching pattern in Jag1+/+ (left panel) and Jag1Ndr/Ndr liver (middle and right panel). PV branch points (pink arrowheads) were near BD branch points (blue arrowheads) in wild type mice, but further away in Jag1Ndr/Ndr mice. BD branch points in Jag1Ndr/Ndr mice also occurred in the absence of PV branching (blue arrow). Scale bar 500 µm. (C) Cumulative sum of BD branching point percentage at a given distance to the nearest PV branching point. 3 Jag1+/+ and 3 Jag1Ndr/Ndr mice were used. 100% of Jag1+/+ bile duct branchpoints were within 1 mm of a PV branchpoint, but only 95% of Jag1Ndr/Ndr branchpoints were within 1 mm. Bars represent mean ± standard deviation, Kolmogorov-Smirnov test (on raw data, p=0.9985, not significant). For individual data points see Figure 4—source data 1 (D) Branching analysis in 2D histological consecutive Jag1+/+ and Jag1Ndr/Ndr liver sections. PV branching (pink arrowheads) was present near BD branching (blue arrowheads) in wild type mice (top panels). In Jag1Ndr/Ndr mice, BDs branched ectopically in the absence of PV branching (bottom panel). Boxed regions magnified in panels at right. Scale bar 50 µm, boxed region 20 µm. (E) Branching pattern in consecutive human liver histological sections shows BD branching in association with PV (pink arrowhead) branching in controls (top panel), but BD branching in the absence of PV branching in patients with severe ALGS (middle panel) and patients with mild ALGS (bottom panel). Scale bar 50 µm, boxed region 20 µm. ALGS, Alagille syndrome; BD, bile duct; CK, cytokeratin; HA, hepatic artery; H, hilar; P, peripheral; PV, portal vein.
-
Figure 4—source data 1
Raw data measuring the distance from the bile duct branching point to a portal vein branching point.
- https://cdn.elifesciences.org/articles/60916/elife-60916-fig4-data1-v1.xlsx
Figure 4—figure supplement 1
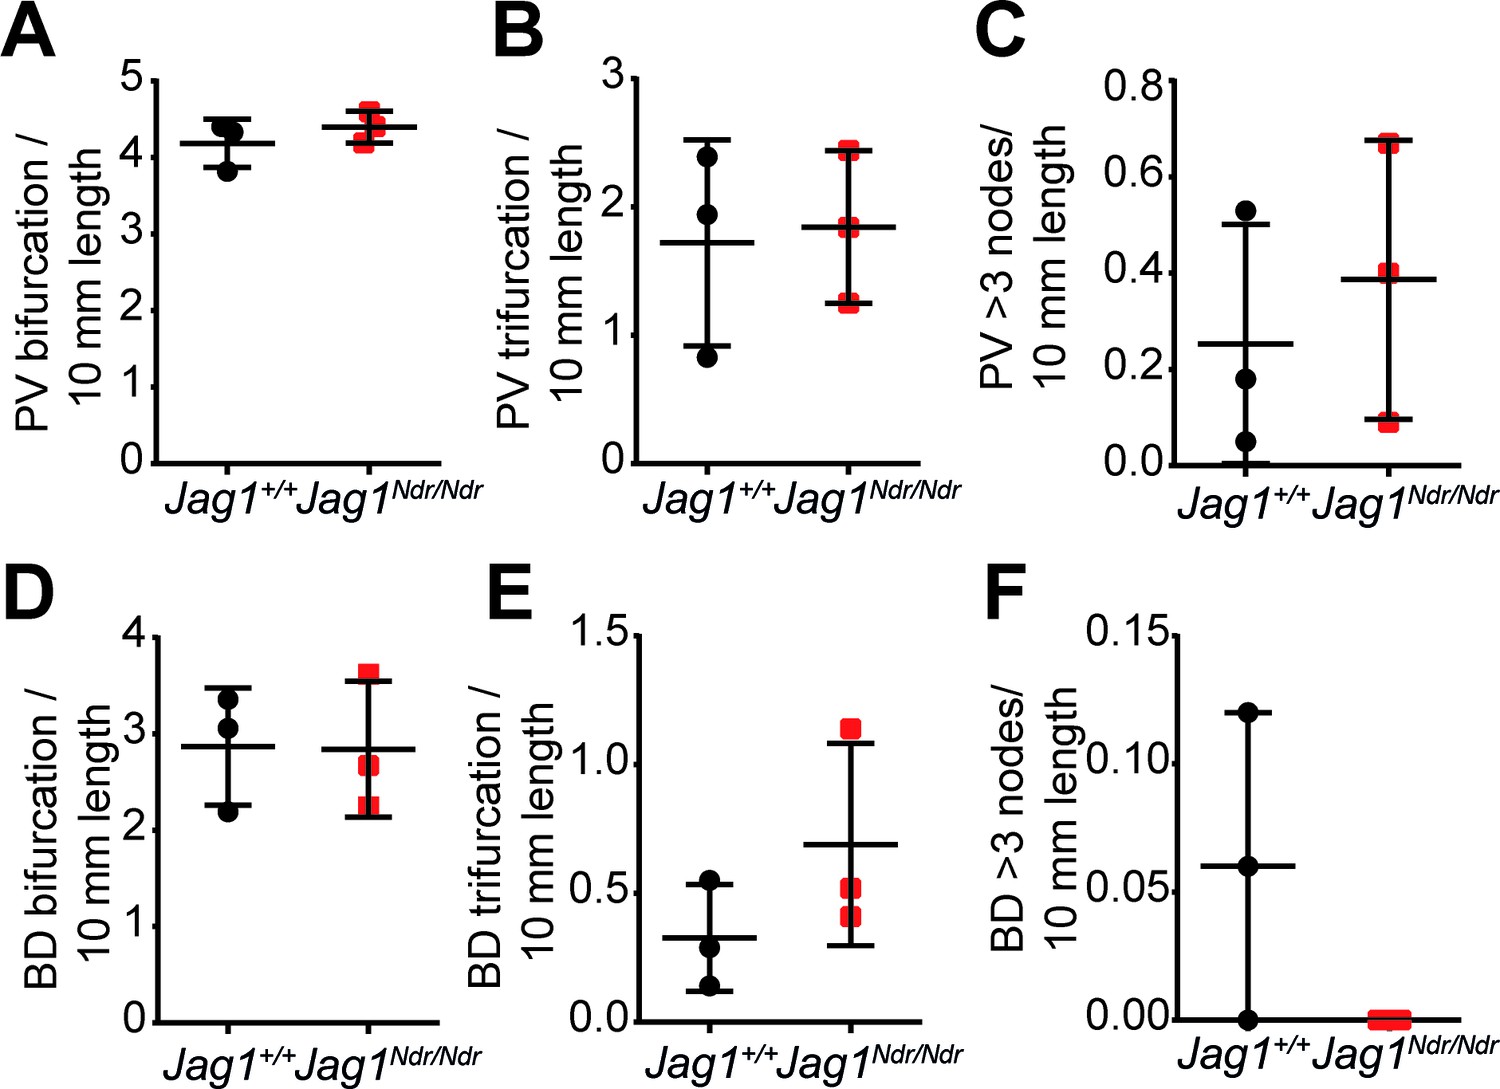
De novo grown bile ducts did not show significant differences in the numbers of bifurcations, trifurcations or nodes > 3 branches when normalized to system size.
The number of (A) bifurcations, (B) trifurcations or (C) nodes with >3 branches per 10 mm length are similar in the portal venous systems of Jag1+/+ and Jag1Ndr/Ndr livers. The number of (D) bifurcations, (E) trifurcations or (F) nodes with >3 branches per 10 mm length are similar in the biliary systems of Jag1+/+ and Jag1Ndr/Ndr livers. Each dot represents one animal. Lines in graphs show mean ± standard deviation. Statistical analysis: Mann Whitney test (A) p=0.5 (B) p>0.9999 (C) p=0.7 (D) p>0.999 (E) p=0.4 (F) p=0.4.
Figure 5 with 1 supplement
Strahler analysis of resin casts reveal excess central branching in the Jag1Ndr/Ndr de novo generated biliary system.
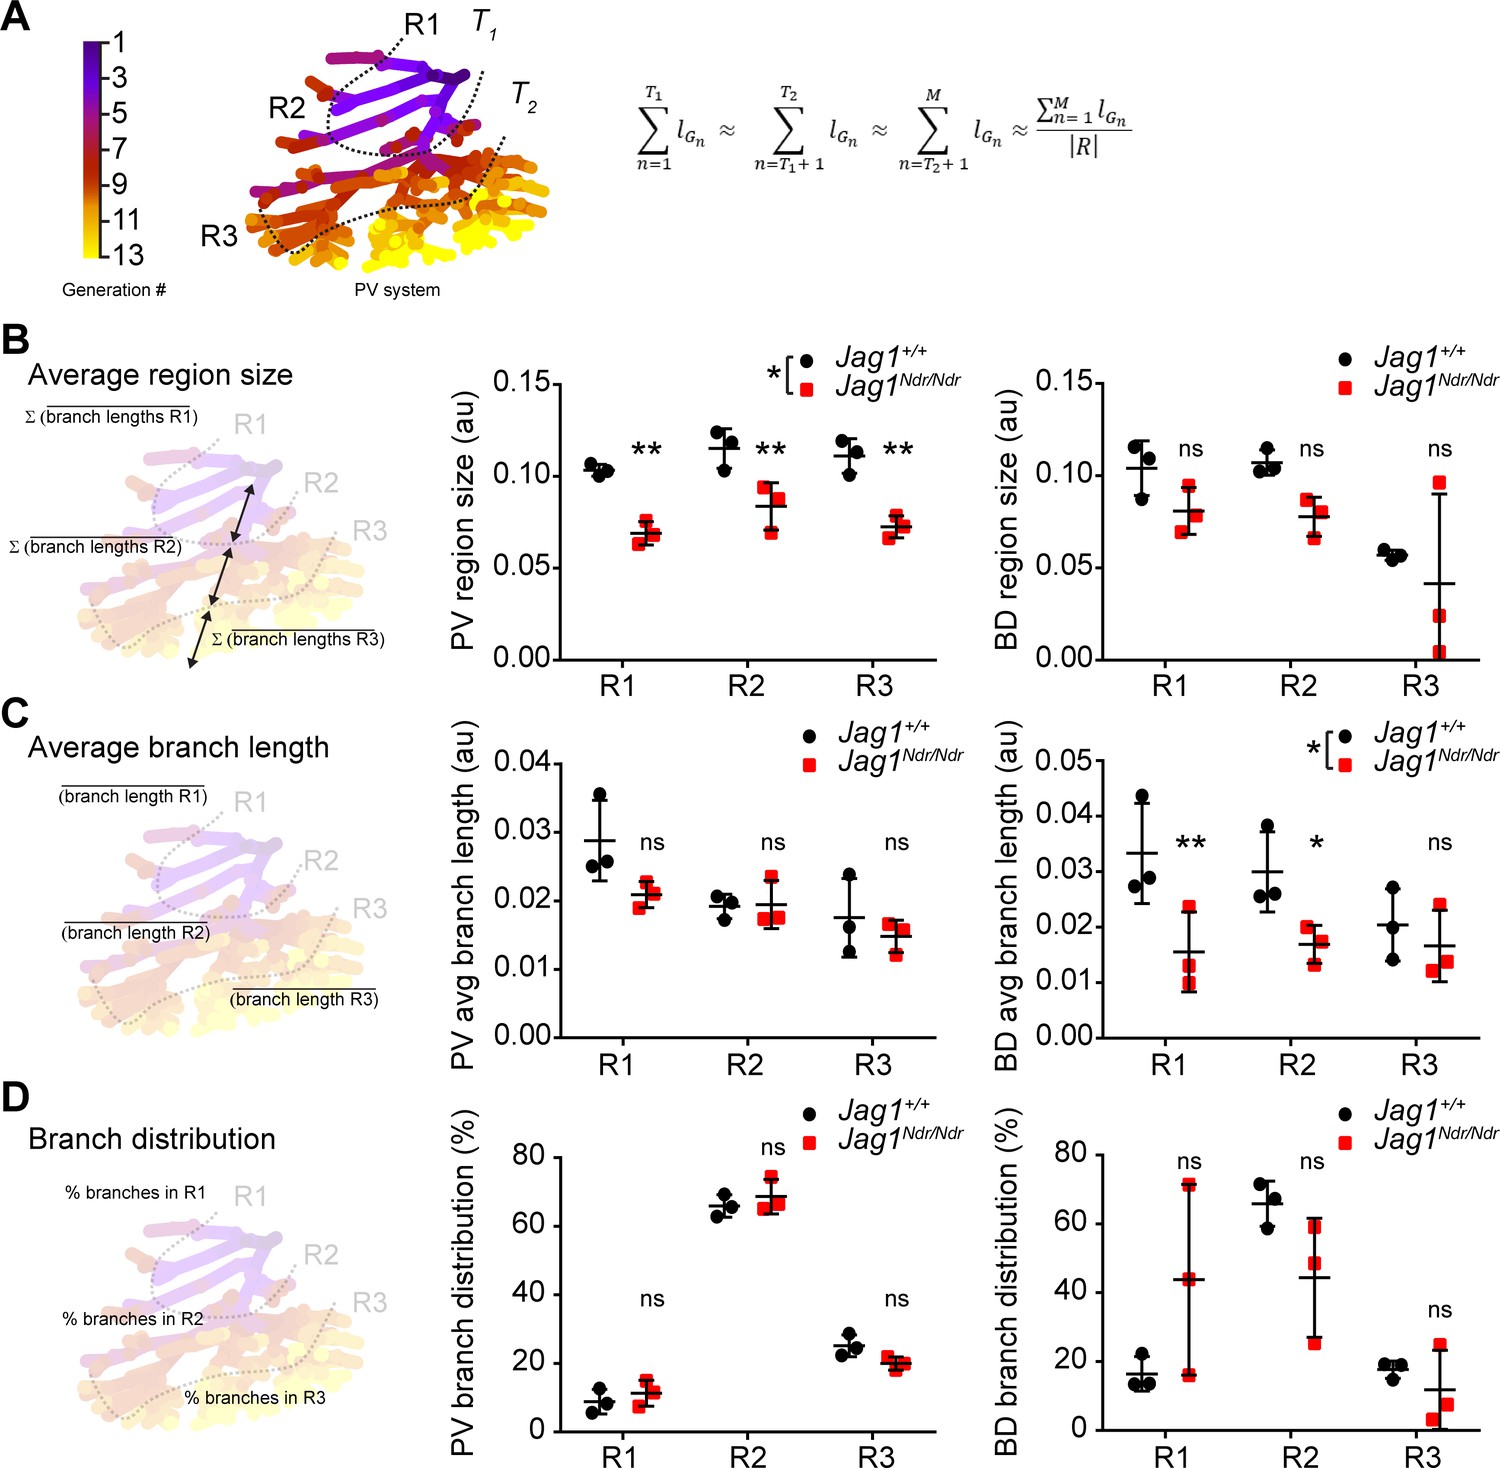
(A) 3D branching analysis based on Strahler number. The branching generations were divided into three equal regions: R1, R2 and R3 based on portal vein average branch length and generation number. Formula: R = {R1, R2, R3}; n ∈ [1, M] ⊂ ℕ; T1, T2⊂ n; R, region; G, branch generation; M, maximal branch generation number; lGn, average branch length of nth generation; T1, T2, borders between regions (specific generation number). (B) Schematic representation of region size calculation, deriving the sum of the average branch lengths within a given region (left). Liver region size for PV (middle panel) and BD (right panel). (C) Schematic representation of average branch length calculation within a region (left panel). Average branch length analysis for PV (middle panel) and BD (right panel) system. (D) Schematic representation of branch distribution, deriving the percentage of branches belonging to each region (left panel). Percentage of branches in each liver region in PV (middle panel) and BD (right panel) systems. Each dot represents one animal, bars represent mean ± standard deviation. Two-way ANOVA, (B) middle panel p = 0.0289, right panel p = 0.2029; (C) middle panel p = 0.1177, right panel p = 0.0367; (D) middle panel p = 0.4226, right panel p = 0.8845; followed by Sidak's multiple comparisons test, p < 0.05 (*), p < 0.01 (**), ns not significant. au, arbitrary units; BD, bile duct; PV, portal vein.
Figure 5—figure supplement 1
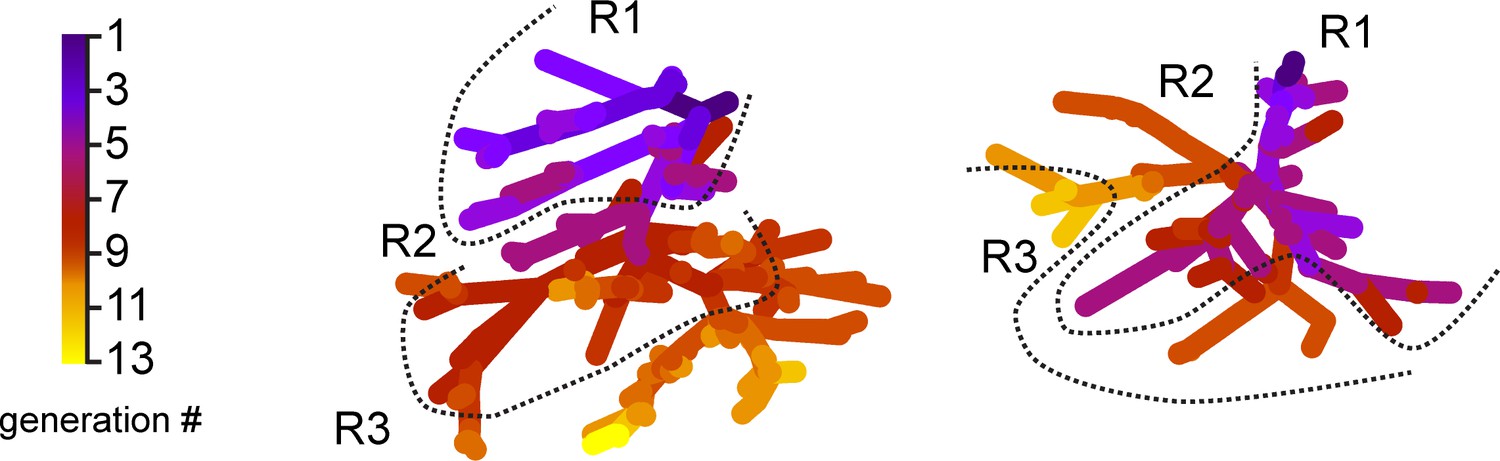
Bile duct branch distribution per region.
3D branching analysis of the biliary system based on Strahler number. The branching generations were divided into three equal regions (R) based on portal vein branching: R1, R2 and R3 (see Figure 5A). Jag1+/+ bile ducts branch with stereotype region and branch distribution. Jag1Ndr/Ndr bile ducts instead branch extensively in region 1, note the excess number of low generation (purple) branches.
Figure 6 with 1 supplement
Alagille syndrome human and murine de novo generated bile ducts are tortuous.
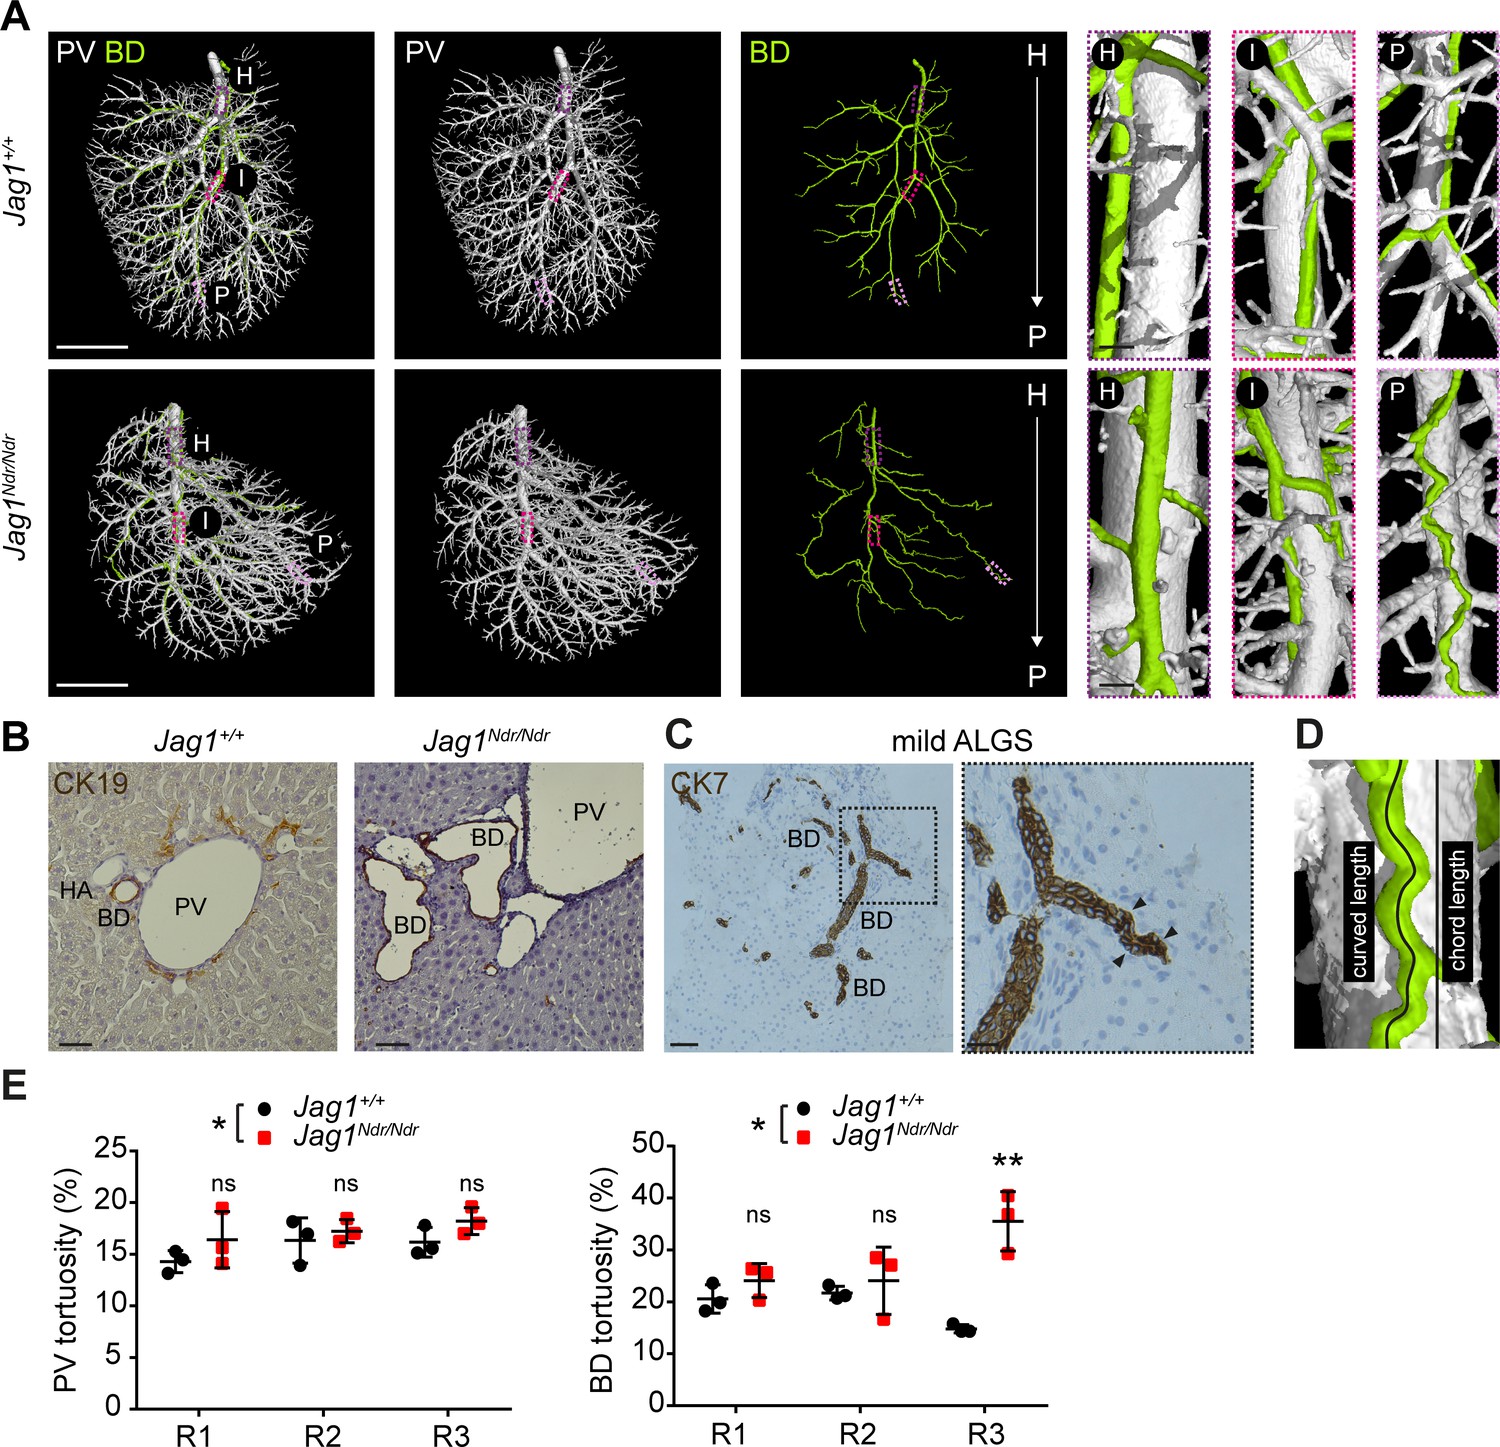
(A) DUCT 3D rendering of BD and PV structures in Jag1+/+ (top panels) and Jag1Ndr/Ndr liver (bottom panels). Boxed areas magnify the hilar (H), intermediate (I) and peripheral (P) regions. Scale bars left 4 mm, boxed regions 250 µm. (B) 2D histological liver sections, show well-formed round CK19+ BDs in Jag1+/+ liver, but aberrantly formed BDs in Jag1Ndr/Ndr liver. Scale bar 50 µm. (C) 2D liver section from patient with mild ALGS revealed tortuous misshaped BDs. Scale bar 50 µm, boxed region 20 µm. (D) Schematic representing length measurements. Percentage tortuosity was calculated by dividing curved (actual) length by chord (theoretical) length, and subtracting 100% (final value of 0% = not tortuous, perfectly straight). (E) The overall Jag1Ndr/Ndr PV (left graph) and BD (right graph) systems are more tortuous than wild types, and the Jag1Ndr/Ndr BD system is particularly tortuous in Region 3 (periphery). Each dot represents one animal, lines show mean value ± standard deviation. Statistical test: two-way ANOVA, left panel p=0.0141, right panel p=0.0251; followed by Sidak's multiple comparisons test; p<0.05 (*), p<0.01 (**). ALGS, Alagille syndrome; BD, bile duct; CK, cytokeratin; DUCT, double resin casting micro computed tomography, H, hilar; HA, hepatic artery, I, intermediate P, peripheral; PV, portal vein.
Figure 6—figure supplement 1
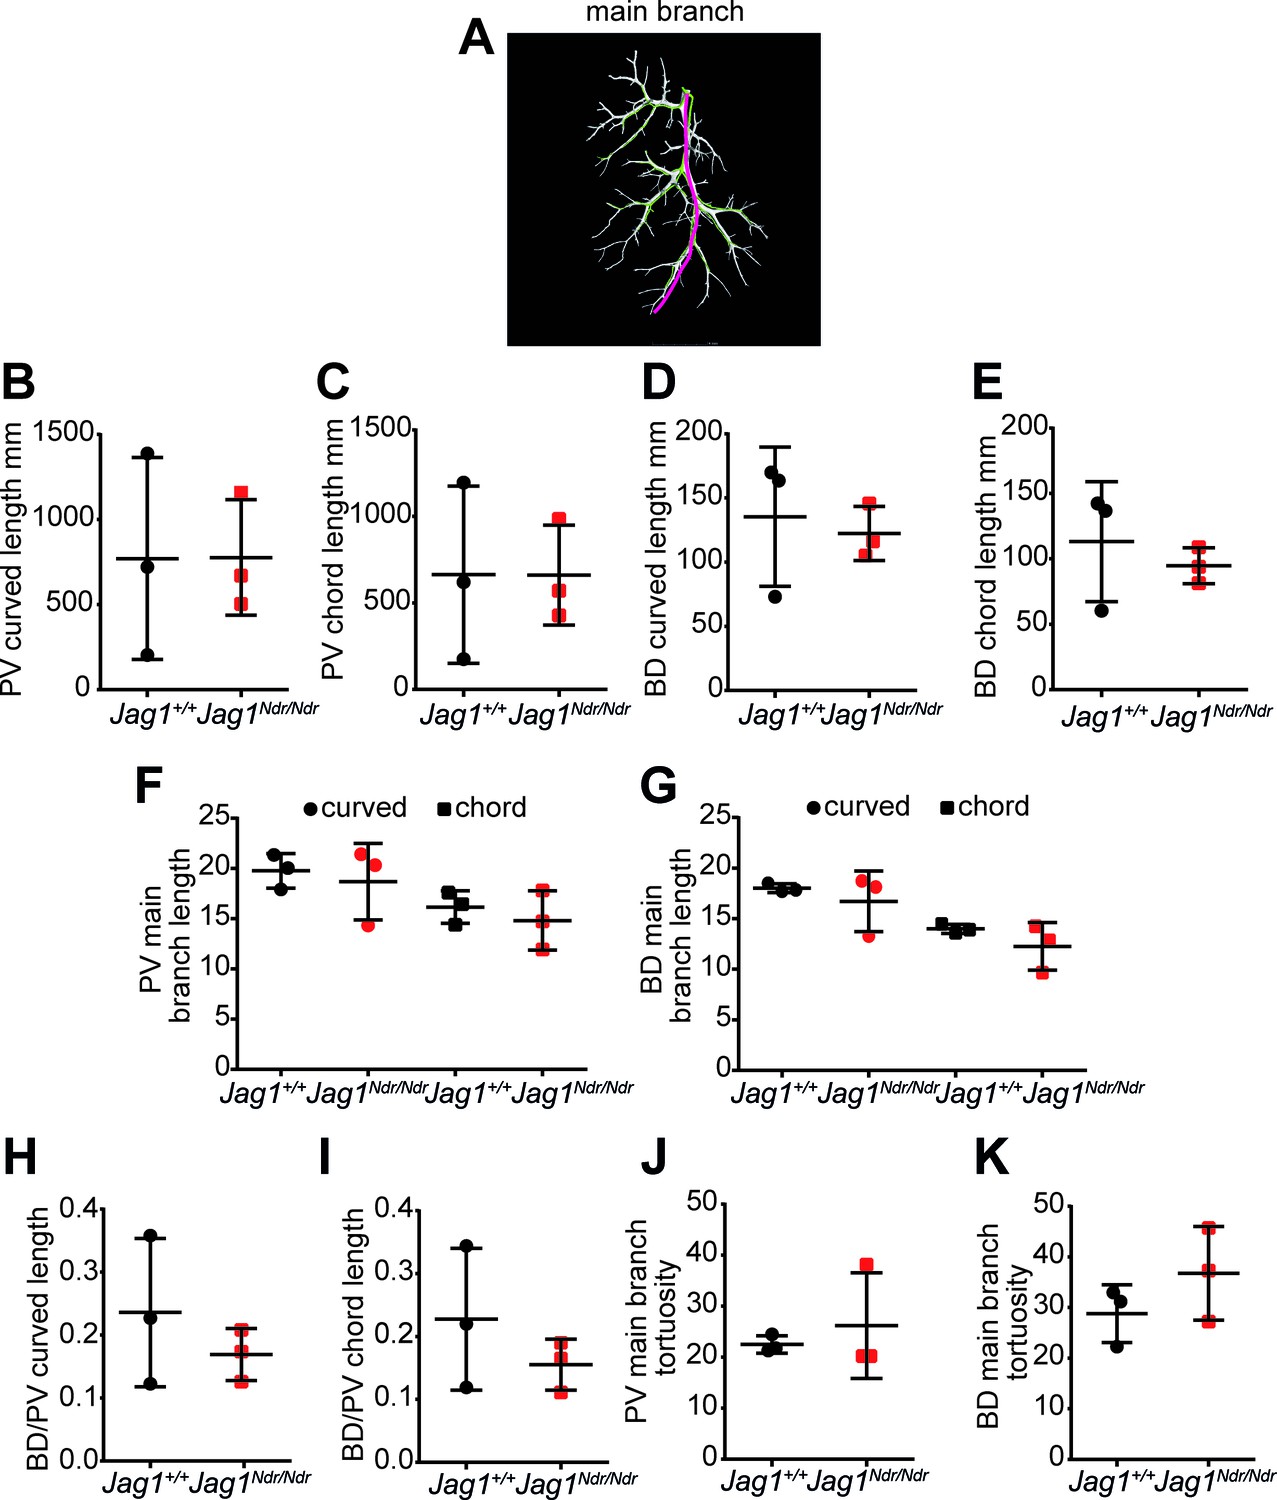
The adult de novo formed Jag1Ndr/Ndr and Jag1+/+ biliary systems are similar in length.
(A) Main branch highlighted in magenta. The same image is used in Figure 1—figure supplements 1C and 2C. The total (B) curved (actual) or (C) chord (hypothetical/straight) length of the PV systems in Jag1+/+ and Jag1Ndr/Ndr right medial lobes. The total (D) curved or (E) chord length of the biliary systems in Jag1+/+ and Jag1Ndr/Ndr right medial lobes. (F, G) PV and BD main branch curved and chord length. (H, I) BD to PV curved and chord length ratio. (J, K) PV and BD main branch tortuosity. Each dot represents one animal. Lines in graphs show mean ± standard deviation. Statistical analysis or unpaired t test (B) p=0.9880 (C) p=0.9947 (D) p=0.7155 (E) p=0.5425 (H) p=0.4090 (I) p=0.3544 (J) p=0.5761 (K) p=0.2746 and two way ANOVA (F) p=0.9360 (G) p=0.4846.
Figure 7
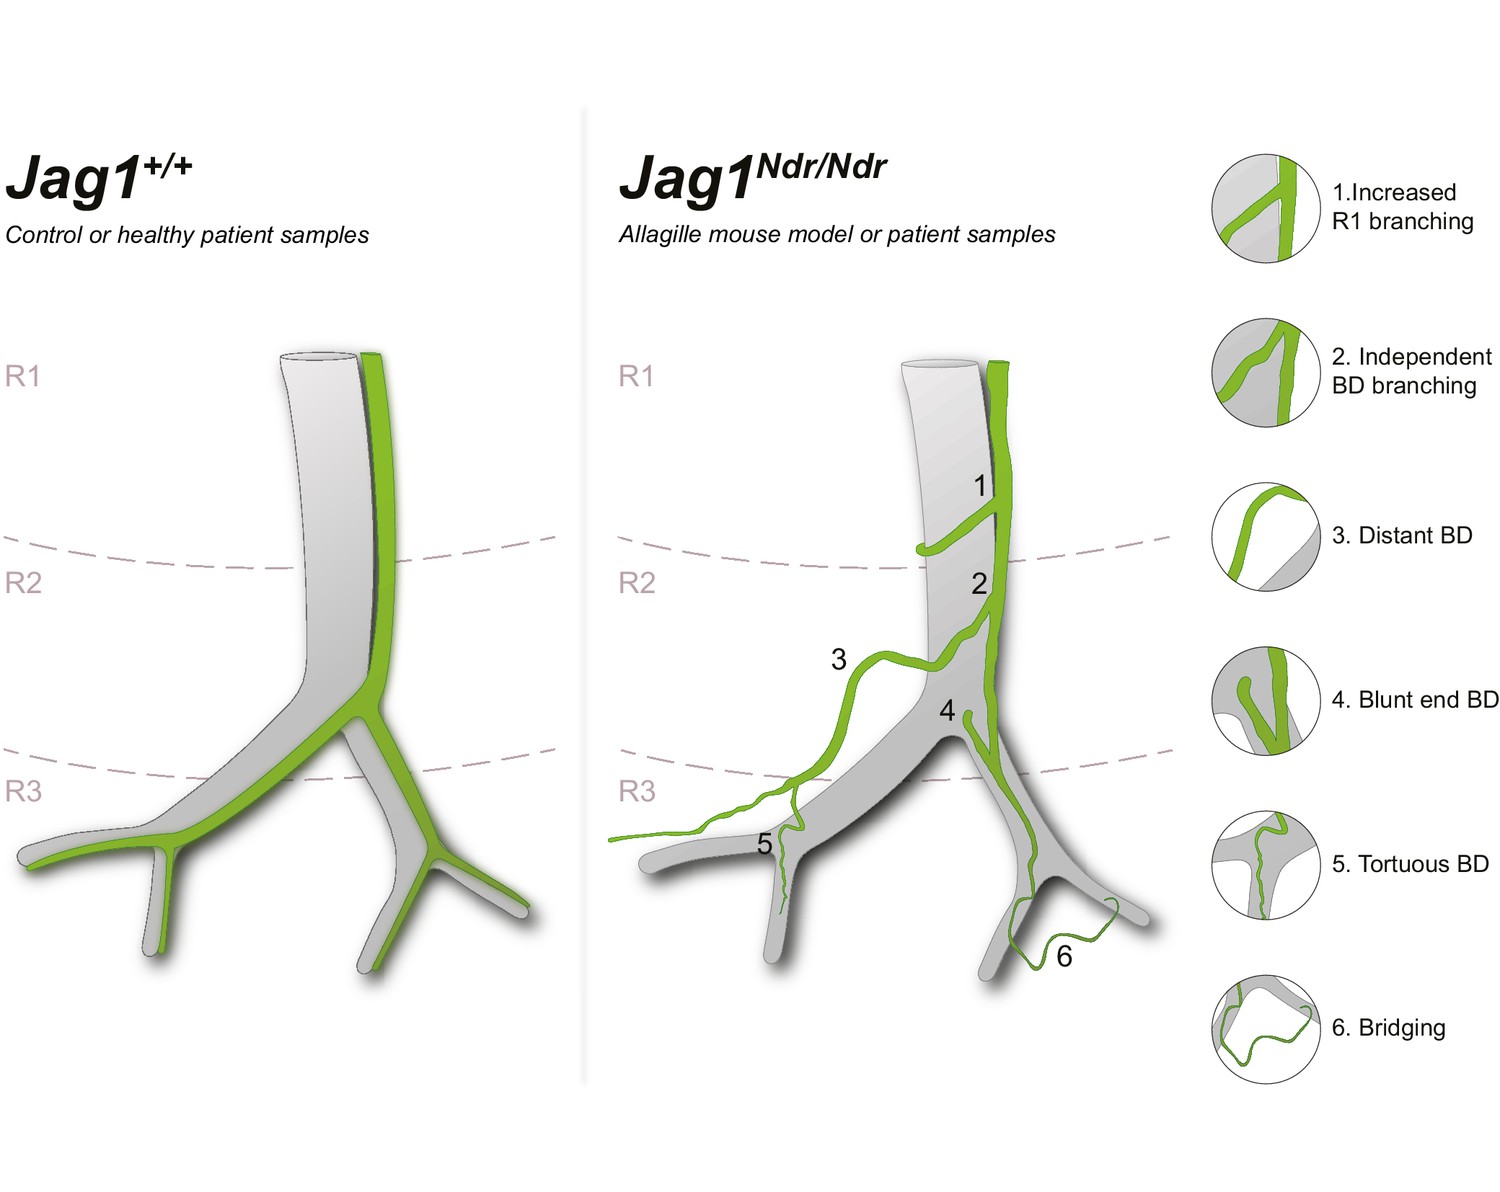
Schematic of Jag1Ndr/Ndr biliary abnormalities in de novo generated bile ducts.
Left panel depicts a simplified wild type or healthy human spatial arrangement of portal veins and bile ducts in three liver regions (R1, R2 and R3). Right panel illustrates a simplified adult Jag1Ndr/Ndrregenerated biliary system displaying morphological abnormalities including (1) increased branching in region 1, (2) branching independent of the portal vein, (3) increased distance from portal vein, (4) abrupt/blunt endings facing the hilum, (5) peripheral tortuosity and (6) bridging between two portal veins. Independently branching, abruptly ending, parenchymal and tortuous bile ducts were confirmed in liver from patients with Alagille syndrome.
Figure 8
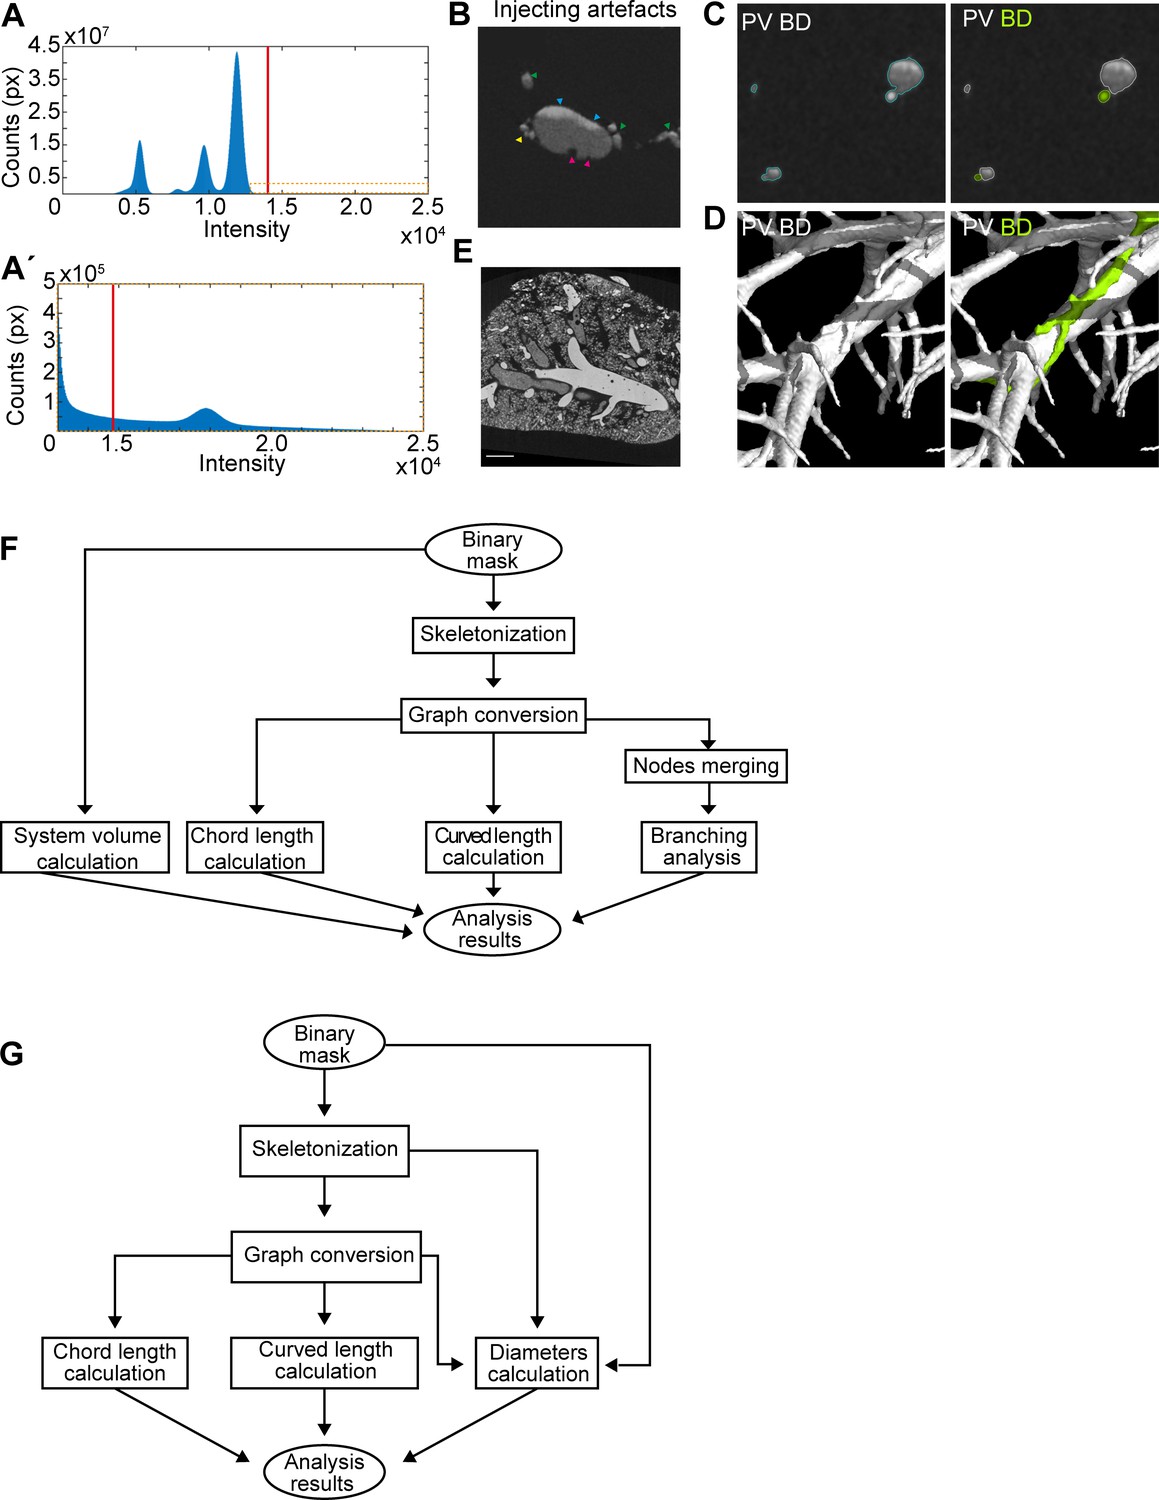
Micro computed tomography image processing.
(A) µCT scan thresholding. Orange box in (A), magnified in (A’), shows MICROFIL intensity levels. (B) Resin injection artefacts including inadequate mixing of MICROFIL resin (blue arrowheads), bubbles in the resin which require manual correction (magenta arrowheads), and leakage due to excessive injection pressure or vessel/duct weakness (yellow arrowhead). Green arrowheads represent side branches. (C) Global thresholding separates old MICROFIL injected ducts and vessels from background tissue. BD and PV are identified manually. (D) 3D visualization of BD and PV after first segmentation (left panel) and after the systems separation. (E) Global thresholding separates fresh MICROFIL injected airways and vessels from each other and the background tissue. (F) Quantification pipeline schematic for the whole lobe (G) or only the main branch analysis.
Tables
Table 1
Liver function test overview for patients with Alagille syndrome.
M-ALGS stands for patients with mild Alagille syndrome. S-ALGS stands for patients with severe Alagille syndrome.
| ID | Age (years) | ALT (µkat/L) | AST (µkat/L) | ALP (µkat/L) | GT (µkat/L) | Bil Tot (µmol/L) | BilD (µmol/L) | Bile acids (µmol/L) | Sample |
|---|---|---|---|---|---|---|---|---|---|
| Reference value | <0.76 | <1 | <7.6 | <0.76 | <22 | <4 | <10 | ||
| S-ALGS_1 | 1.2 | 3.29 | 2.87 | 23.4 | 21.8 | 308 | 272 | 665 | Explant |
| S-ALGS_2 | 1.5 | 3.09 | - | 10.8 | 13.5 | 274 | 246 | 473 | Explant |
| S-ALGS_3 | 4 | 4.41 | - | 9.9 | 7.5 | 238 | 215 | 246 | Explant |
| S-ALGS_4 | 6 | 3.9 | - | 9.4 | 8.1 | 220 | 193 | 244 | Explant |
| M-ALGS_1 | 0.6 | 1.09 | - | 4.6 | 1.2 | 7 | 2 | - | Biopsy |
| M-ALGS_2 | 1.4 | 0.78 | 0.96 | 6.6 | 1.2 | 3 | <2 | 33 | Biopsy |
| M-ALGS_3 | 2.5 | 1.46 | 1.44 | 13.6 | 7.4 | 10 | 6 | 106 | Biopsy |
| M-ALGS_4 | 3.4 | 0.68 | 0.92 | 5.2 | 1.5 | 14 | 4 | 31 | Biopsy |
| M-ALGS_5_1 | 0.2 | 1.44 | 1.77 | - | - | 46 | 39 | 175 | Biopsy |
| M-ALGS_5_2 | 1.2 | 1.59 | 1.8 | - | - | 3 | 2 | - | Biopsy |
| M-ALGS_5_3 | 4.7 | 0.79 | 0.93 | 3.5 | 0.52 | 9 | <2 | 2 | Biopsy |
| M-ALGS_6 | 6.4 | 1.18 | 1.44 | 6.4 | 3 | 6 | <2 | 1 | Biopsy |
Key resources table
| Reagent type (species) or resource | Designation | Source or reference | Identifiers | Additional information |
|---|---|---|---|---|
| Antibody | Anti-Cytokeratin 7 (rabbit monoclonal) | Abcam | Cat # ab181598 RRID:AB_2783822 | iDISCO+ (1:1000) |
| Antibody | Anti-Cytokeratin 7 (mouse monoclonal) | Invitrogen/ThermoFisher Scientific | Cat # MA5-11986, clone: OV-TL 12/30 RRID:AB_10989596 | IHC (1:200) |
| Antibody | Anti-Cytokeratin 7 (mouse monoclonal) | Sigma - Aldrich | Cat # C6198 RRID:AB_476856 | iDISCO+ (1:2000) |
| Antibody | Anti-Cytokeratin 19 (rat monoclonal) | DSHB | Cat # TROMA-III RRID:AB_2133570 | IHC (1:50) |
| Antibody | Anti-human SOX9 (goat polyclonal) | RnD Systems | Cat # AF3075 RRID:AB_2194160 | IHC (1:100) |
| Commercial assay or kit | MICROFIL | Flow Tech Inc | Cat # MV120, MV-122 | DUCT |
| Software, algorithm | MATLAB | Mathworks | RRID:SCR_001622 | codes available: https://github.com/JakubSalplachta/DUCT |
Table 2
Settings parameters of the GE Phoenix v|tome|x L 240 system.
| Sample | Voxel size | Acceleration voltage | X-ray tube current | Exposition time | Number of projections |
|---|---|---|---|---|---|
| 2401 | 8 µm | 80 kV | 160 µA | 600 ms* | 2500* |
| 2404 | 12 µm | 80 kV | 160 µA | 600 ms* | 2500* |
| 2405 | 12 µm | 80 kV | 160 µA | 600 ms* | 2500* |
| 2431 | 12 µm | 80 kV | 160 µA | 600 ms* | 2500* |
| 2713 | 12 µm | 80 kV | 160 µA | 334 ms† | 1900† |
| 2714 | 12 µm | 80 kV | 160 µA | 334 ms† | 1900† |
| N864 | 6.5 µm | 80 kV | 160 µA | 400 ms† | 1800† |
| N865 | 6.5 µm | 80 kV | 160 µA | 400 ms† | 1800† |
| Jag1+/+ lung | 8 µm | 80 kV | 160 µA | 400 ms† | 2000† |
-
*Flat panel DXR250 (2048 px ×2048 px, pixel size 200 μm).
†Flat panel dynamic 41|100 (4048 px ×4048 px, pixel size 100 μm with binning 2).
Table 3
PV branching generation distribution into liver regions.
| PV generation # | Jag1+/+ (3 animals) | Jag1Ndr/Ndr (3 animals) | ||||
|---|---|---|---|---|---|---|
| R1 | 1–4 | 1–3 | 1–4 | 1–4 | 1–3 | 1–3 |
| R2 | 5–10 | 4–9 | 5–10 | 5–8 | 4–7 | 4–7 |
| R3 | 11–18 | 10–14 | 11–17 | 9–15 | 8–12 | 8–11 |
Table 4
BD branching generation distribution into liver regions.
| BD generation # | Jag1+/+(3 animals) | Jag1Ndr/Ndr (3 animals) | ||||
|---|---|---|---|---|---|---|
| R1 | 1–4 | 1–4 | 1–2 | 1–4 | 1–6 | 1–6 |
| R2 | 5–7 | 5–7 | 3–5 | 5–9 | 7–10 | 7–10 |
| R3 | 8–12 | 8–11 | 6–7 | 10–16 | 11 | 11–12 |
Additional files
Download links
A two-part list of links to download the article, or parts of the article, in various formats.
Downloads (link to download the article as PDF)
Open citations (links to open the citations from this article in various online reference manager services)
Cite this article (links to download the citations from this article in formats compatible with various reference manager tools)
DUCT reveals architectural mechanisms contributing to bile duct recovery in a mouse model for Alagille syndrome
eLife 10:e60916.
https://doi.org/10.7554/eLife.60916


