A prion accelerates proliferation at the expense of lifespan
- Department of Chemical & Systems Biology, Stanford University School of Medicine, United States
- Institute of Molecular Biology, Department of Biology, University of Oregon, United States
- Department of Pathology, University of Washington, United States
- Department of Developmental Biology, Stanford University School of Medicine, United States
Figures
Figure 1 with 1 supplement
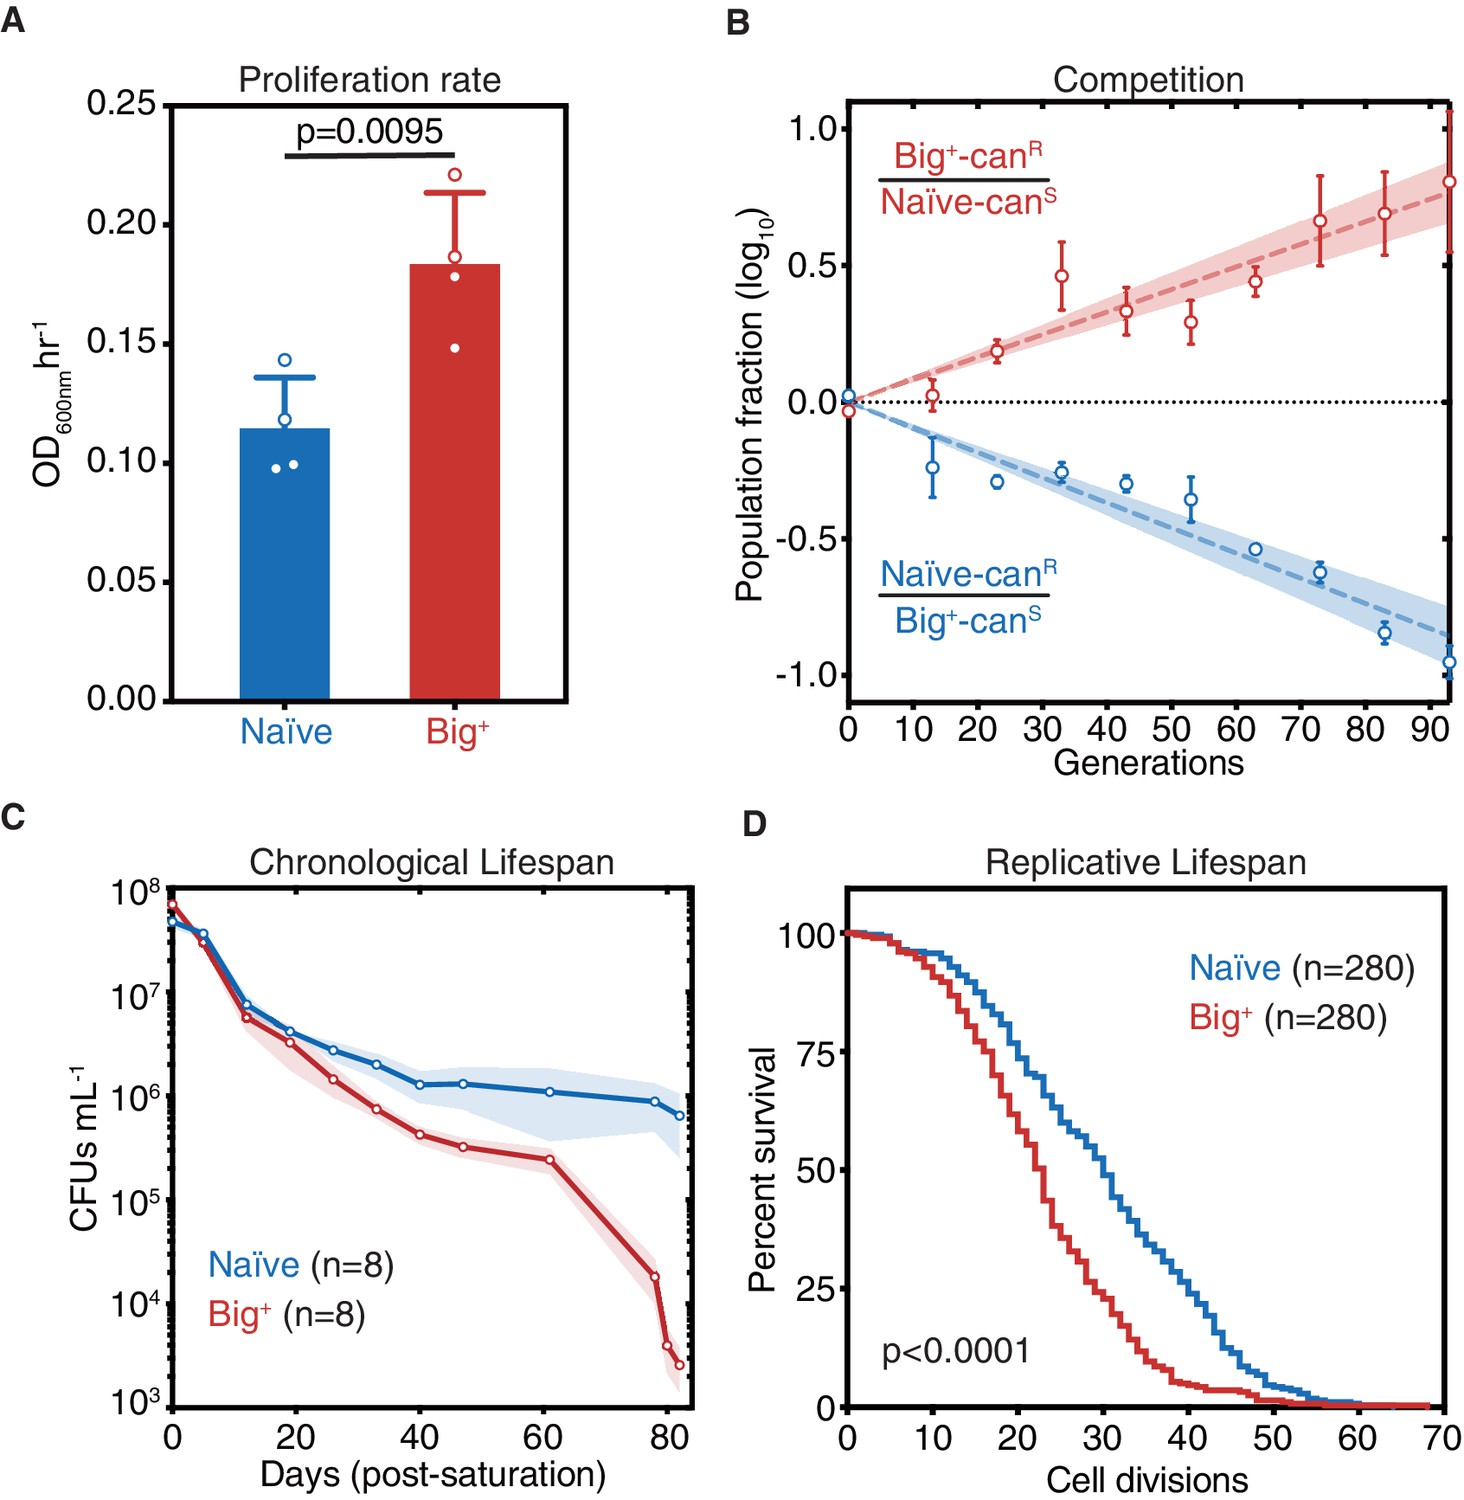
Cells bearing a prion-like epigenetic element live fast and die young.
(A) Big+ cells proliferate faster than naïve cells. Bars represent the mean of four replicates of maximum growth rate in YPD medium (measured by the peak of the derivative of the growth data), error bars are standard deviation, p=0.0095, unpaired t-test. (B) In a direct growth competition, Big+ cells outcompete naïve cells. Raw data with standard error bars; trend line is dashed line showing shaded standard error; four replicates were performed for each competition. (C) Big+ cells have a reduced chronological lifespan (CLS). Cells were grown to saturation in rich medium and then transferred to nutrient-poor medium and allowed to age for up to 80 days. Periodically samples were replated onto rich medium to measure remaining viability via colony-forming units (CFUs). Thin lines are the average value from eight biological replicates with standard error represented by shading. (D) Big+ cells have a reduced replicative lifespan (RLS). Starting with virgin mother cells, at each cell division, daughter cells were separated, and the total number yielded was counted for each replicate. n = 280 per strain, combined from three independent experiments. p-value<0.0001, by Gehan–Breslow–Wilcoxon test. Median survival: naïve = 30 generations, Big+ = 23 generations.
Figure 1—figure supplement 1
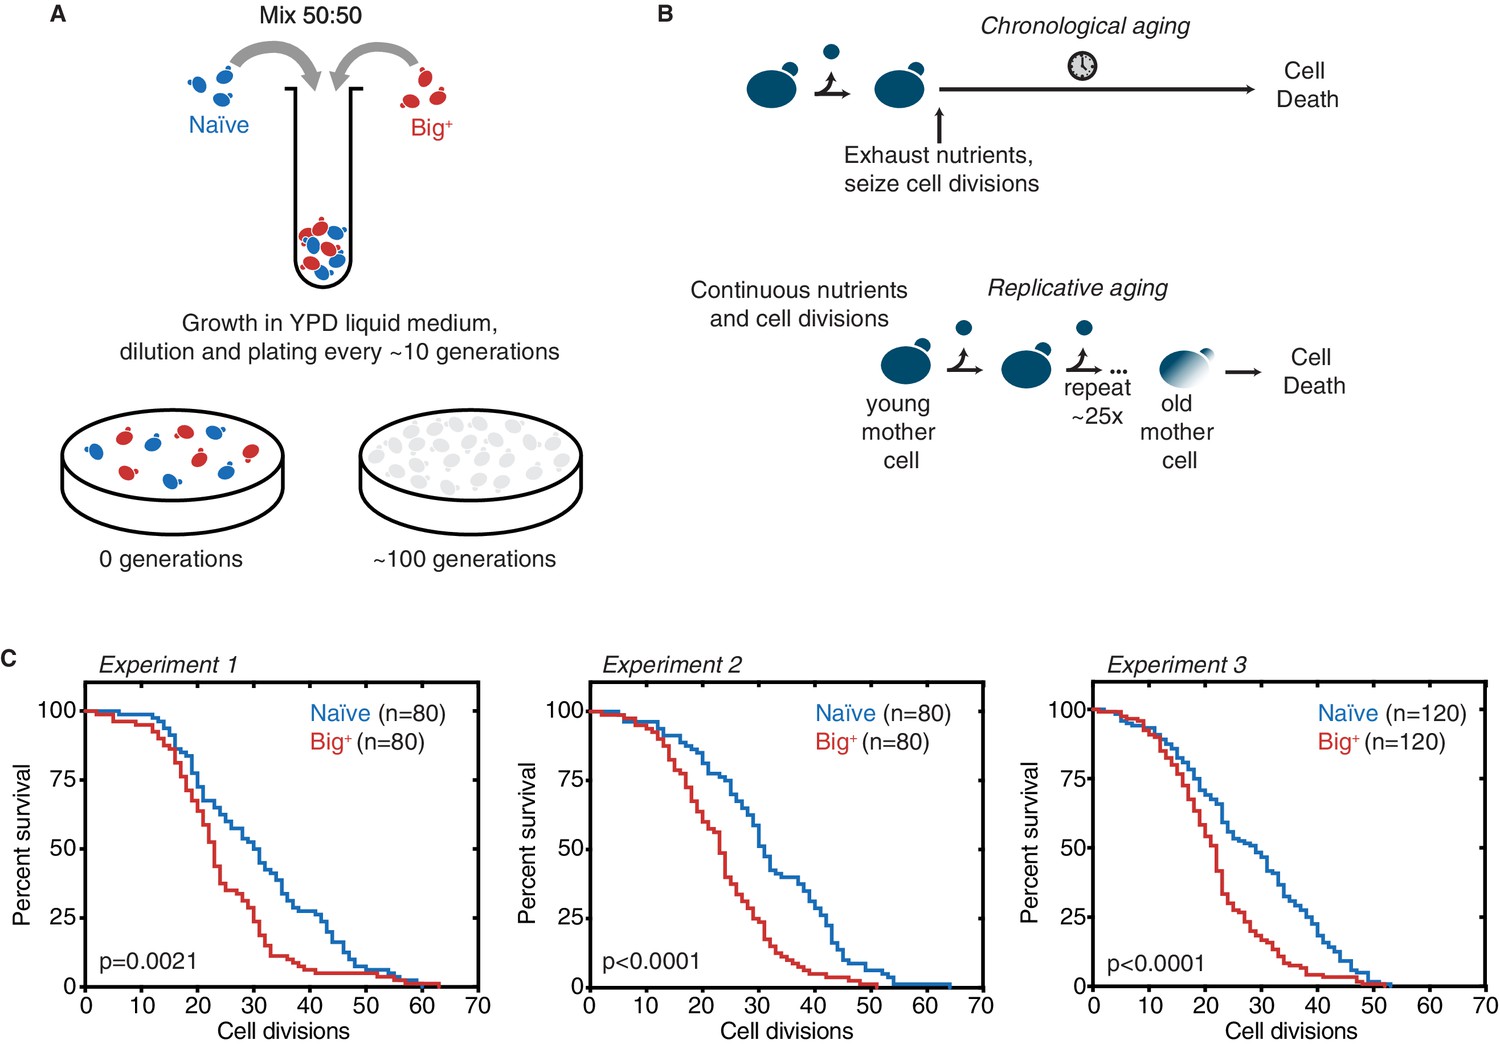
Probing lifespan of Big+ cells.
(A) Experimental scheme for growth competition experiment associated with Figure 1B. (B) Experimental scheme for chronological and replicative lifespan (RLS) measurements associated with Figure 1C and D. (C) Results from three independent RLS experiments, as combined into Figure 1D. Experiment 1: n = 80 per strain, p-value=0.0021, by Gehan–Breslow–Wilcoxon test. Median survival: naïve = 30.5 generations, Big+ = 24 generations. Experiment 2: n = 80 per strain, p-value<0.0001, by Gehan–Breslow–Wilcoxon test. Median survival: naïve = 31 generations, Big+ = 23 generations. Experiment 3: n = 120 per strain, p-value<0.0001, by Gehan–Breslow–Wilcoxon test. Median survival: naïve = 29 generations, Big+ = 22 generations.
Figure 2 with 1 supplement
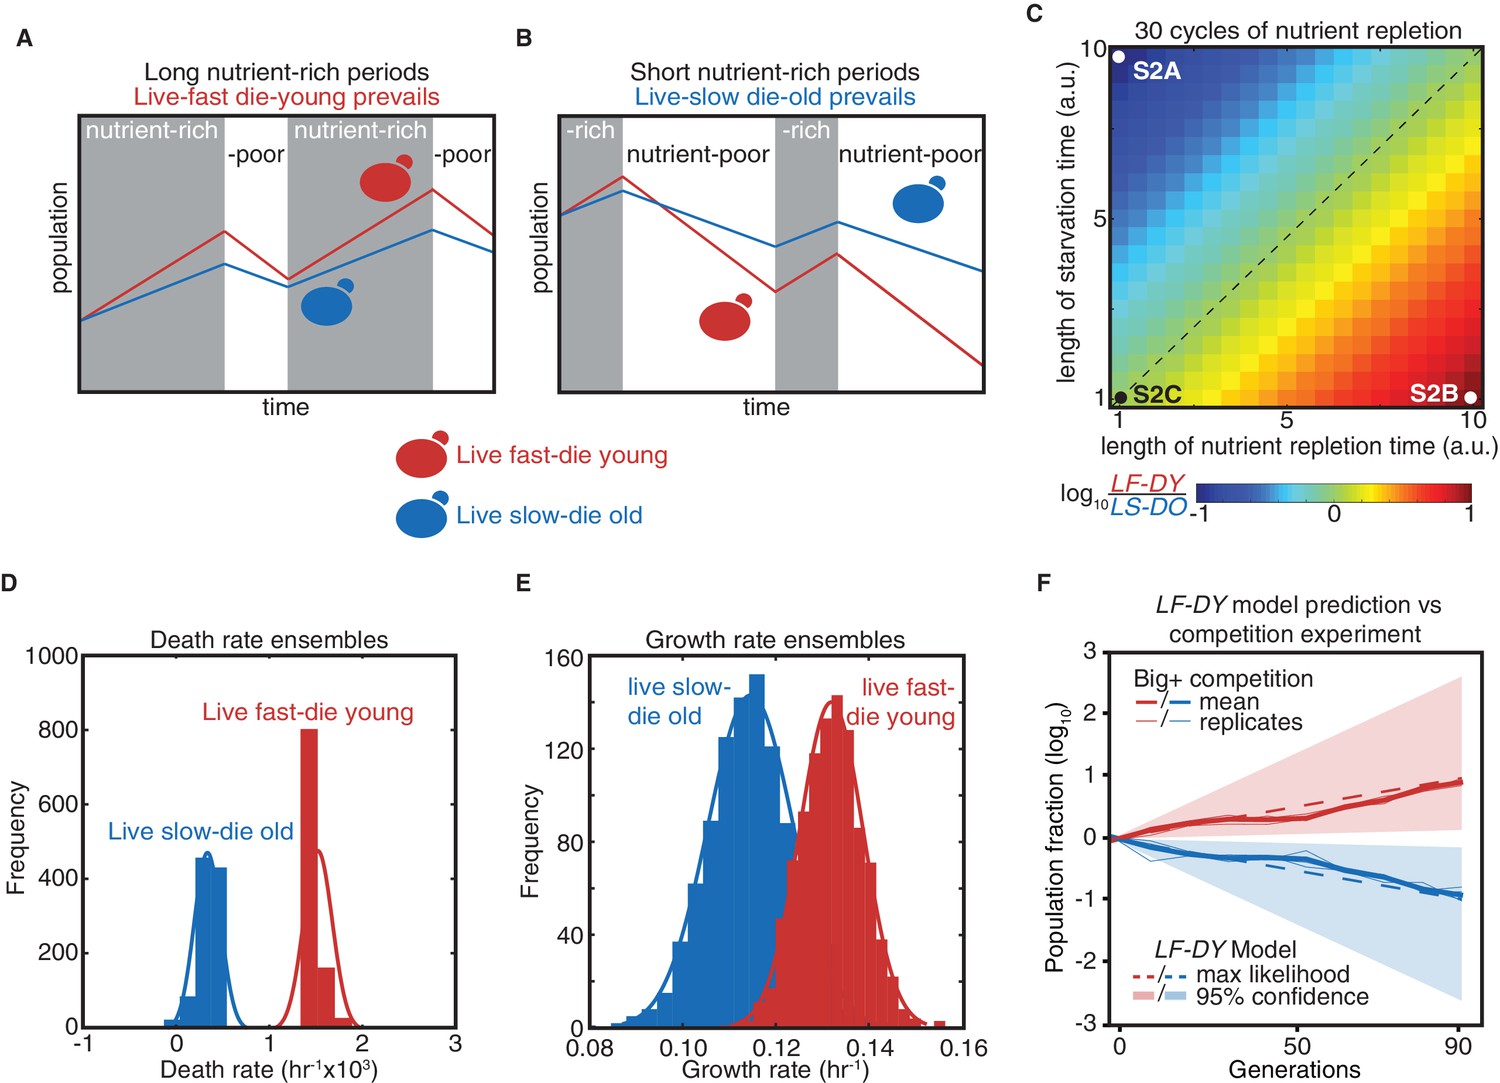
Modeling a reversible epigenetic live fast and die young strategy.
(A) A live fast–die young epigenetic element is beneficial for survival in environments with regular, extended nutrient-rich periods. (B) A live slow–die old growth state is beneficial for survival during conditions of repeated and extended starvation. (C) Simulated final population fraction (ratio of live-fast-die-young [LF-DY] to live-slow-die-old [LS-DO]) after 30 cycles of nutrient repletion and starvation, assuming a 1% growth advantage, a 1% higher death rate, and equal starting population sizes. Note log scale. (D) Monte Carlo sampling of exponential decay constant and (E) exponential growth constant distributions used to generate the ensemble of simulations shown in (F). (F) Monte Carlo simulation (dashed lines) of growth competition between LF-DY to LS-DO cells under parameters sampled from experimental growth and lifespan measurements of the Big+ element (Figure 2D and E). 95% confidence interval indicated by shaded areas. Shown in solid lines are the results of competitive growth between Big+ and naïve cells as shown in Figure 1B (mean: bold line; n = 4 biological replicates: thin lines).
Figure 2—figure supplement 1
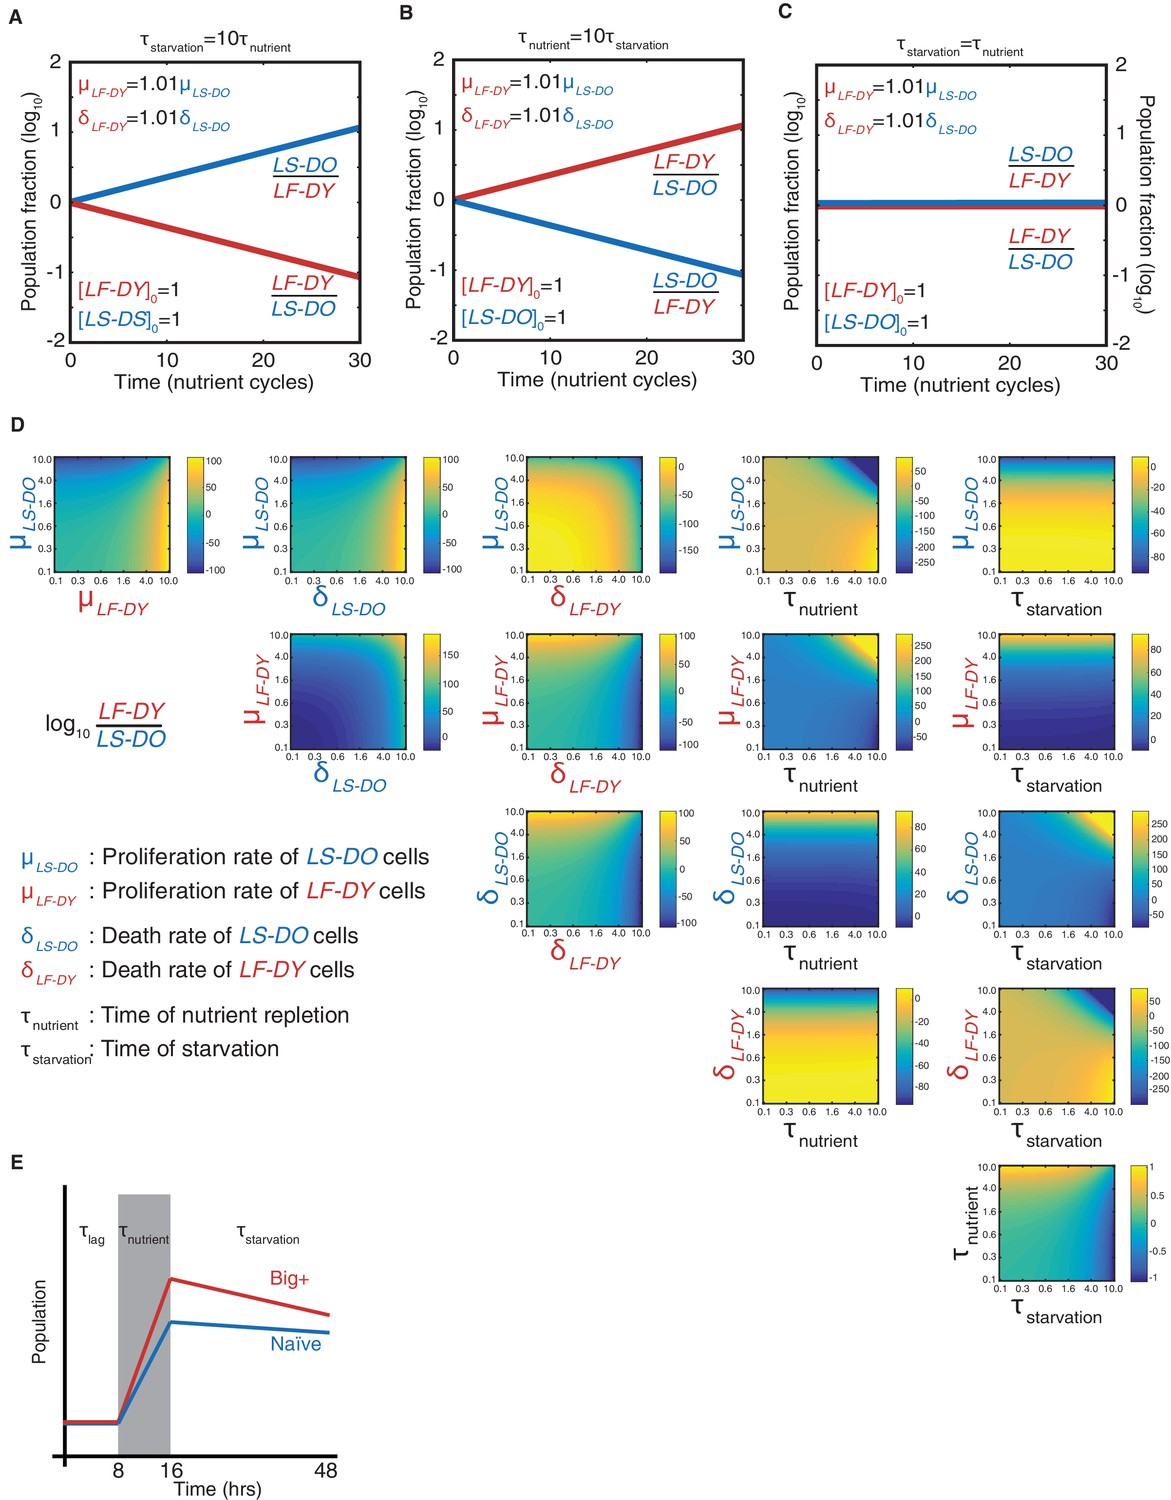
Modeling a reversible epigenetic live fast and die young strategy.
Time-resolved simulations when (A) the period of starvation is 10 times the period of nutrient repletion; (B) the period of nutrient repletion is 10 times the period of starvation; and (C) the two nutrient regimes are of equal length. (D). Phase space representations of the simulated final population fraction (ratio of live-fast-die-young [LF-DY] to live-slow-die-old [LS-DO]) after 30 cycles of nutrient repletion and starvation, as in Figure 2C. Indicated on the ordinate and abscissa of each panel are the parameters that were varied to generate each phase space. Parameters were varied over two orders of magnitude, as indicated. All other parameters were set to the baseline values as shown in Supplementary file 1. (E) Schematic of parameters needed to model competitive growth experiment. During τlag, we assume that there is no change in population ratio. During τnutrient, we require the exponential growth constants, and during τstarvation, we require the exponential decay constants (assuming cell death is a first-order process).
Figure 3 with 1 supplement
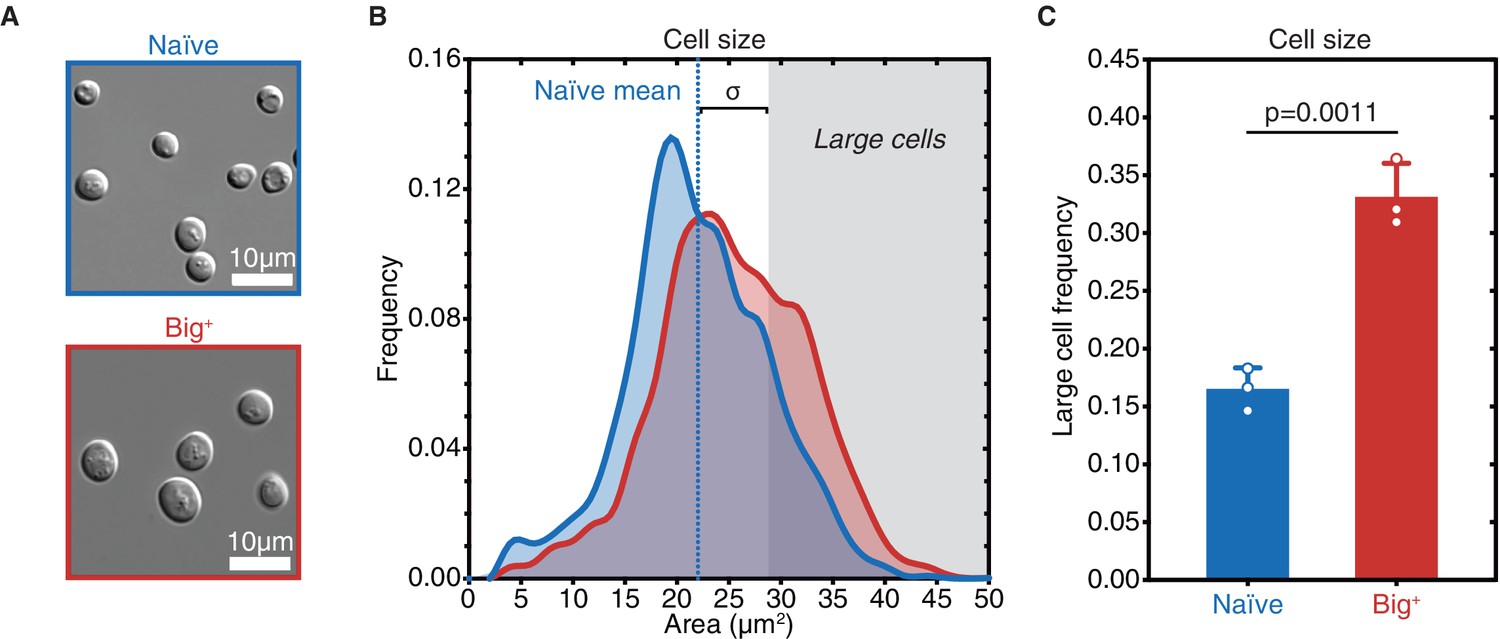
Big+ cells are large.
(A) Micrographs of naïve and Big+ haploid yeast cells. (B) Cell size distributions for thousands of naïve and Big+ haploid cells (100% of distribution is shown, n = 4678 for naïve, n = 5501 for Big+, dotted line indicates naïve mean). Large cell threshold begins at one standard deviation above the naïve mean. (C) The frequency of haploid cells above the large cell threshold. Bars represent the mean of three replicate strains, for which thousands of cells are measured for each strain, error bars are standard deviation. p=0.0011, unpaired t-test.
Figure 3—figure supplement 1
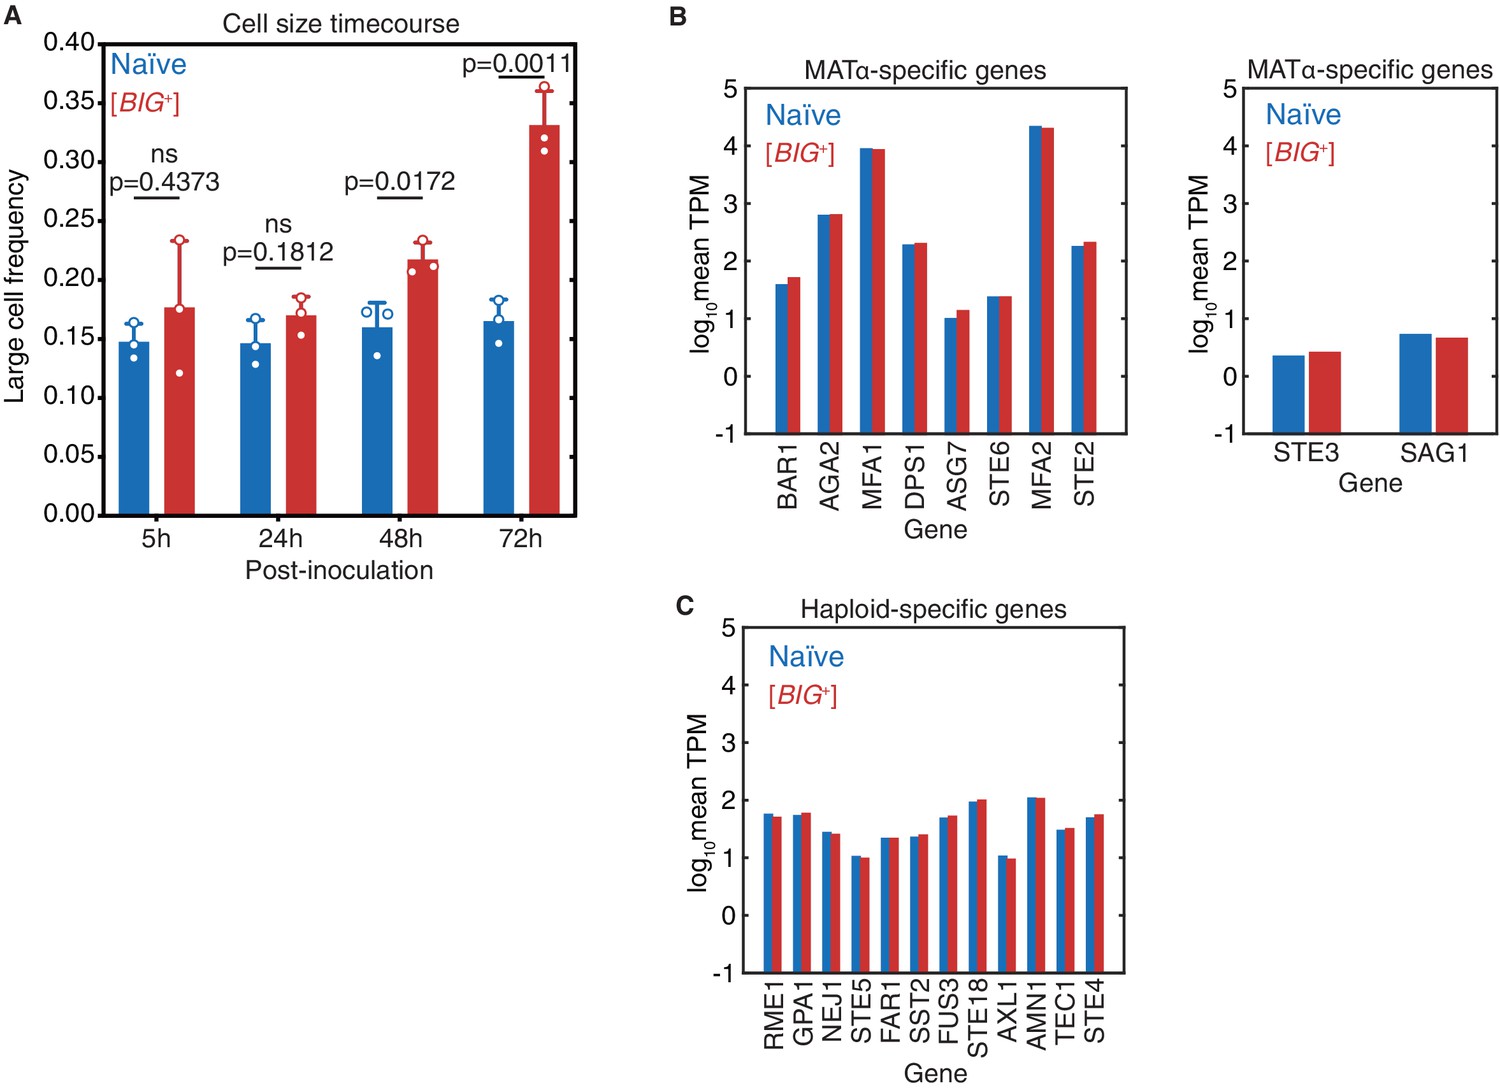
The large cell phenotype of Big+ emerges during the growth of a culture.
(A) The large phenotype of Big+ cells was stronger after 3 days of growth than after 2 days of growth (4 days of growth yielded similar differences in cell size as for 3 days of growth, data not shown). The phenotype was not observed 1 day (24 hr) after inoculation or during the exponential growth phase (5 hr after inoculation). Bars represent the mean of three replicate strains—for which thousands of cells are measured for each—of the frequency of cells above the large cell threshold, error bars are standard deviation. Exponential growth (5 hr) p=0.4373, 24 hr p=0.1812, 48 hr p=0.0172, 72 hr p=0.0011; unpaired t-test for all. (B) Expression levels of MATa-specific (left panel) or MATalpha-specific (right panel) genes in naïve and Big+ cells, determined by mRNA sequencing. Values shown are the mean log10 of transcripts per kilobase million (TPM) from four biological replicates for each strain. Data show that Big+ cells are, like naïve cells, MATa haploids. Neither strain expresses genes associated with MATalpha-specific genes. (C) Expression levels of haploid-specific genes in naïve and Big+ cells, determined by mRNA sequencing. Values shown are the mean log10 of TPM from four biological replicates for each strain. Data show that Big+ cells are, like naïve cells, haploids and not diploids.
Figure 4 with 1 supplement
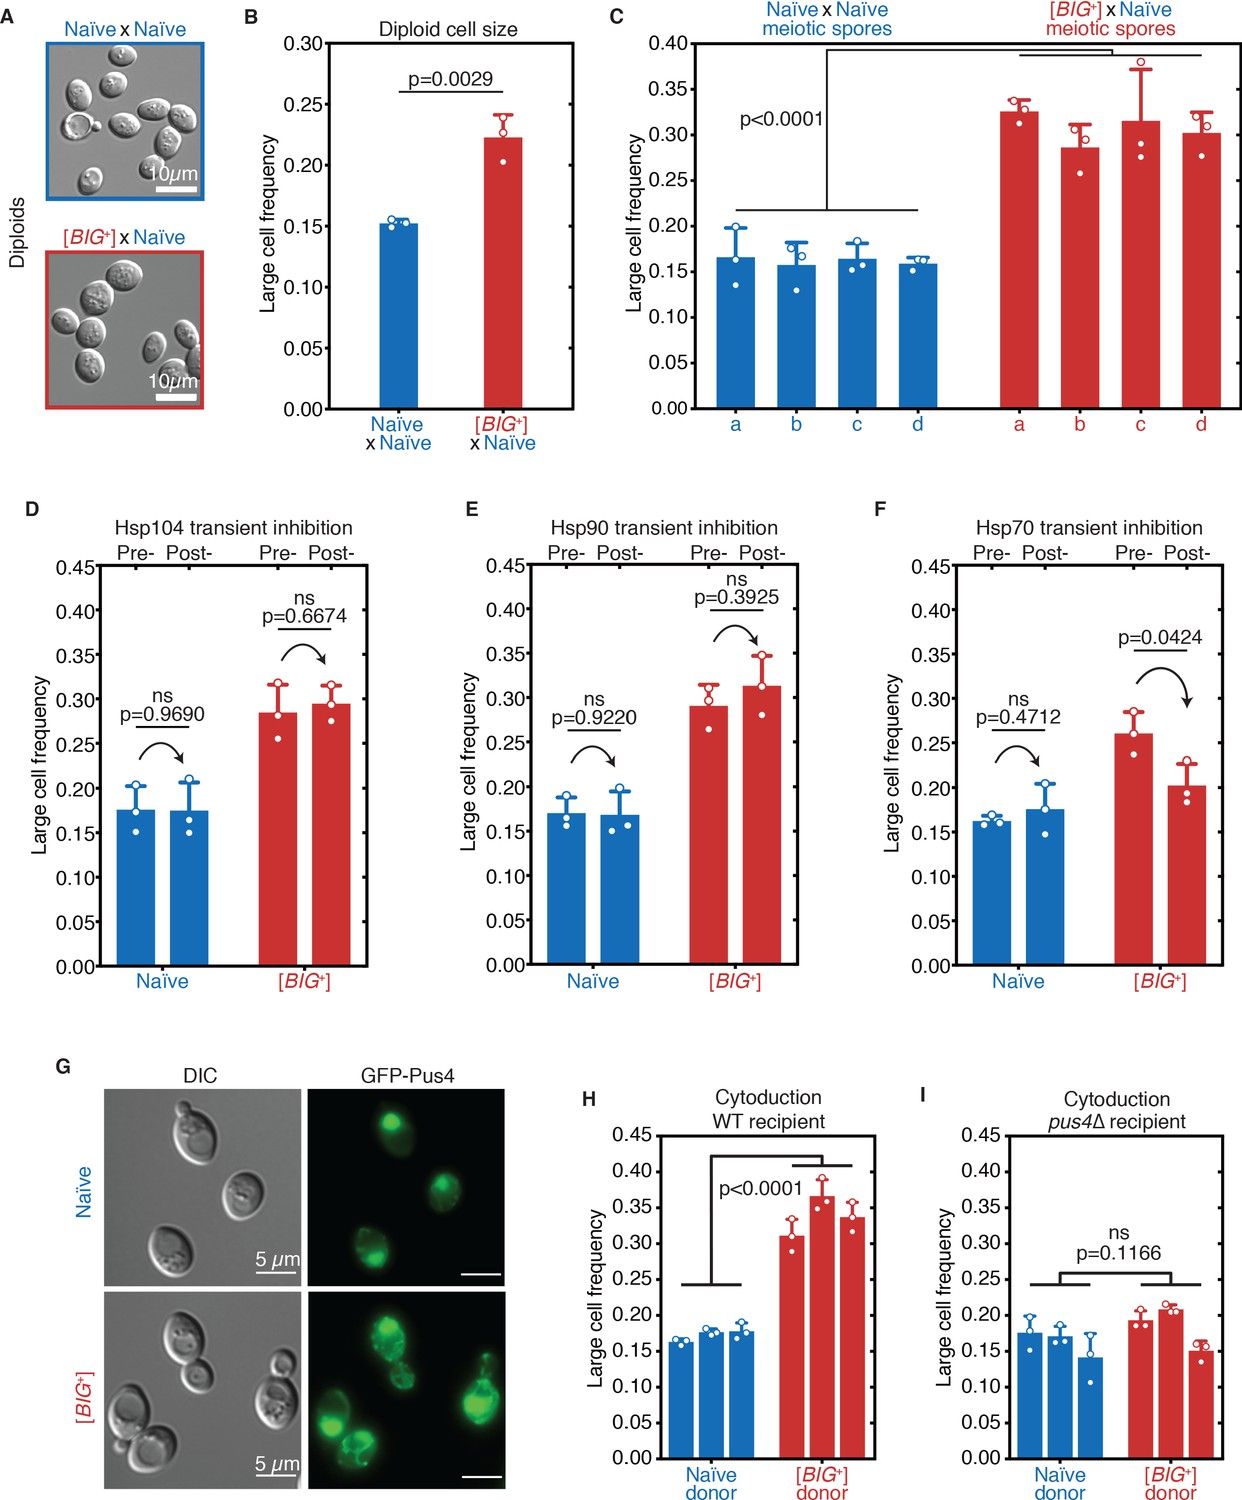
[BIG+] has prion-like patterns of inheritance.
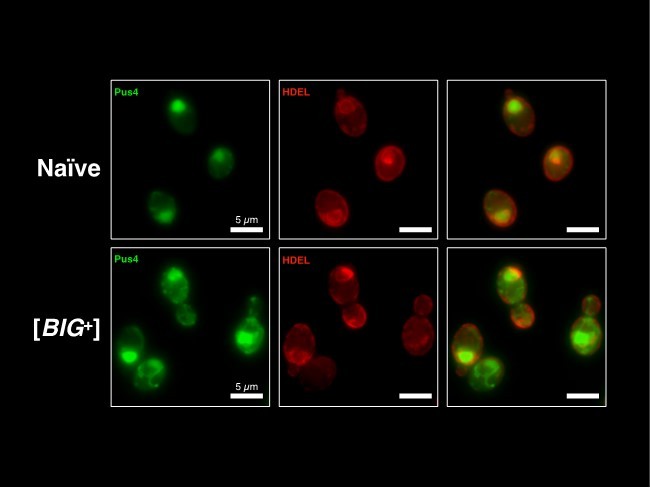
(A) Micrographs of diploid yeast cells resulting from crosses of naïve and naïve parents, or naïve and [BIG+] parents. (B) The frequency of diploid cells above the large cell threshold. Bars represent the mean of three replicate strains, for which thousands of cells were measured for each strain, error bars are standard deviation. p=0.0029, unpaired t-test. (C) Inheritance of large cell frequency to all meiotic spores. Bars represent the mean frequency of cells above the large cell threshold from three replicates, for which thousands of cells were measured for each replicate, error bars are standard deviation. Difference between the means of four tetrad spores between naïve and [BIG+], p<0.0001, unpaired t-test. (D) Transient inhibition of Hsp104 chaperone activity using guanidinium hydrochloride (GdnHCl) does not heritably alter the cell size trait. Bars represent the mean frequency of cells above the large cell threshold from three replicates, for which thousands of cells were measured for each replicate, error bars are standard deviation. Control samples (left bars of each pair) were propagated in parallel on nutrient-matched agar plates not containing GdnHCl. Post-inhibition represents strains subjected to GdnHCl treatment followed by recovery prior to cell size measurements (Materials and methods). Naïve p=0.9690, [BIG+] p=0.6674; unpaired t-test for both. (E) Transient inhibition of Hsp90 chaperone activity using radicicol does not heritably alter the cell size trait. Bars represent the mean frequency of cells above the large cell threshold from three replicates, for which thousands of cells were measured for each replicate, error bars are standard deviation. Control samples (left bars of each pair) were propagated in parallel on nutrient-matched agar plates not containing radicicol. Post-inhibition represents strains subjected to radicicol treatment followed by recovery prior to cell size measurements (Materials and methods). Naïve p=0.9220, [BIG+] p=0.3925; unpaired t-test for both. (F) Transient inhibition of Hsp70 chaperone activity by expression of a dominant-negative allele of SSA1 permanently eliminates the [BIG+] cell size trait. Bars represent the mean frequency of cells above the large cell threshold from three replicates, for which thousands of cells were measured for each replicate, error bars are standard deviation. Control samples (left bars of each pair) did not contain the SSA1K69M constitutive expression plasmid but were propagated in parallel on non-dropout but otherwise nutrient-matched agar plates. Post-inhibition represents strains subjected to plasmid expression followed by plasmid removal and recovery prior to cell size measurements (Materials and methods). Naïve p=0.4712, [BIG+] p=0.0424; unpaired t-test for both. (G) The expression pattern of Pus4 is altered in [BIG+] cells. (H) [BIG+] can be transmitted via cytoduction into a wild-type recipient cell, consistent with a prion-based mechanism. Each bar represents the mean frequency of cells above the large cell threshold from three biological replicates, for which thousands of cells were measured for each replicate, error bars are standard deviation. Bars for three independent cytoductants are shown for each donor strain. Difference between the means of the three cytoductants between naïve and [BIG+] donors: p<0.0001, unpaired t-test. (I) [BIG+] is not transmitted via cytoduction into a pus4∆ recipient cell, indicating that prion transmission depends on continuous endogenous expression of Pus4. Each bar represents the mean frequency of cells above the large cell threshold from three biological replicates, for which thousands of cells were measured for each replicate, error bars are standard deviation. Bars for three independent cytoductants are shown for each donor strain. Difference between the means of the three cytoductants between naïve and [BIG+] donors: p=0.1166, unpaired t-test.
Figure 4—figure supplement 1
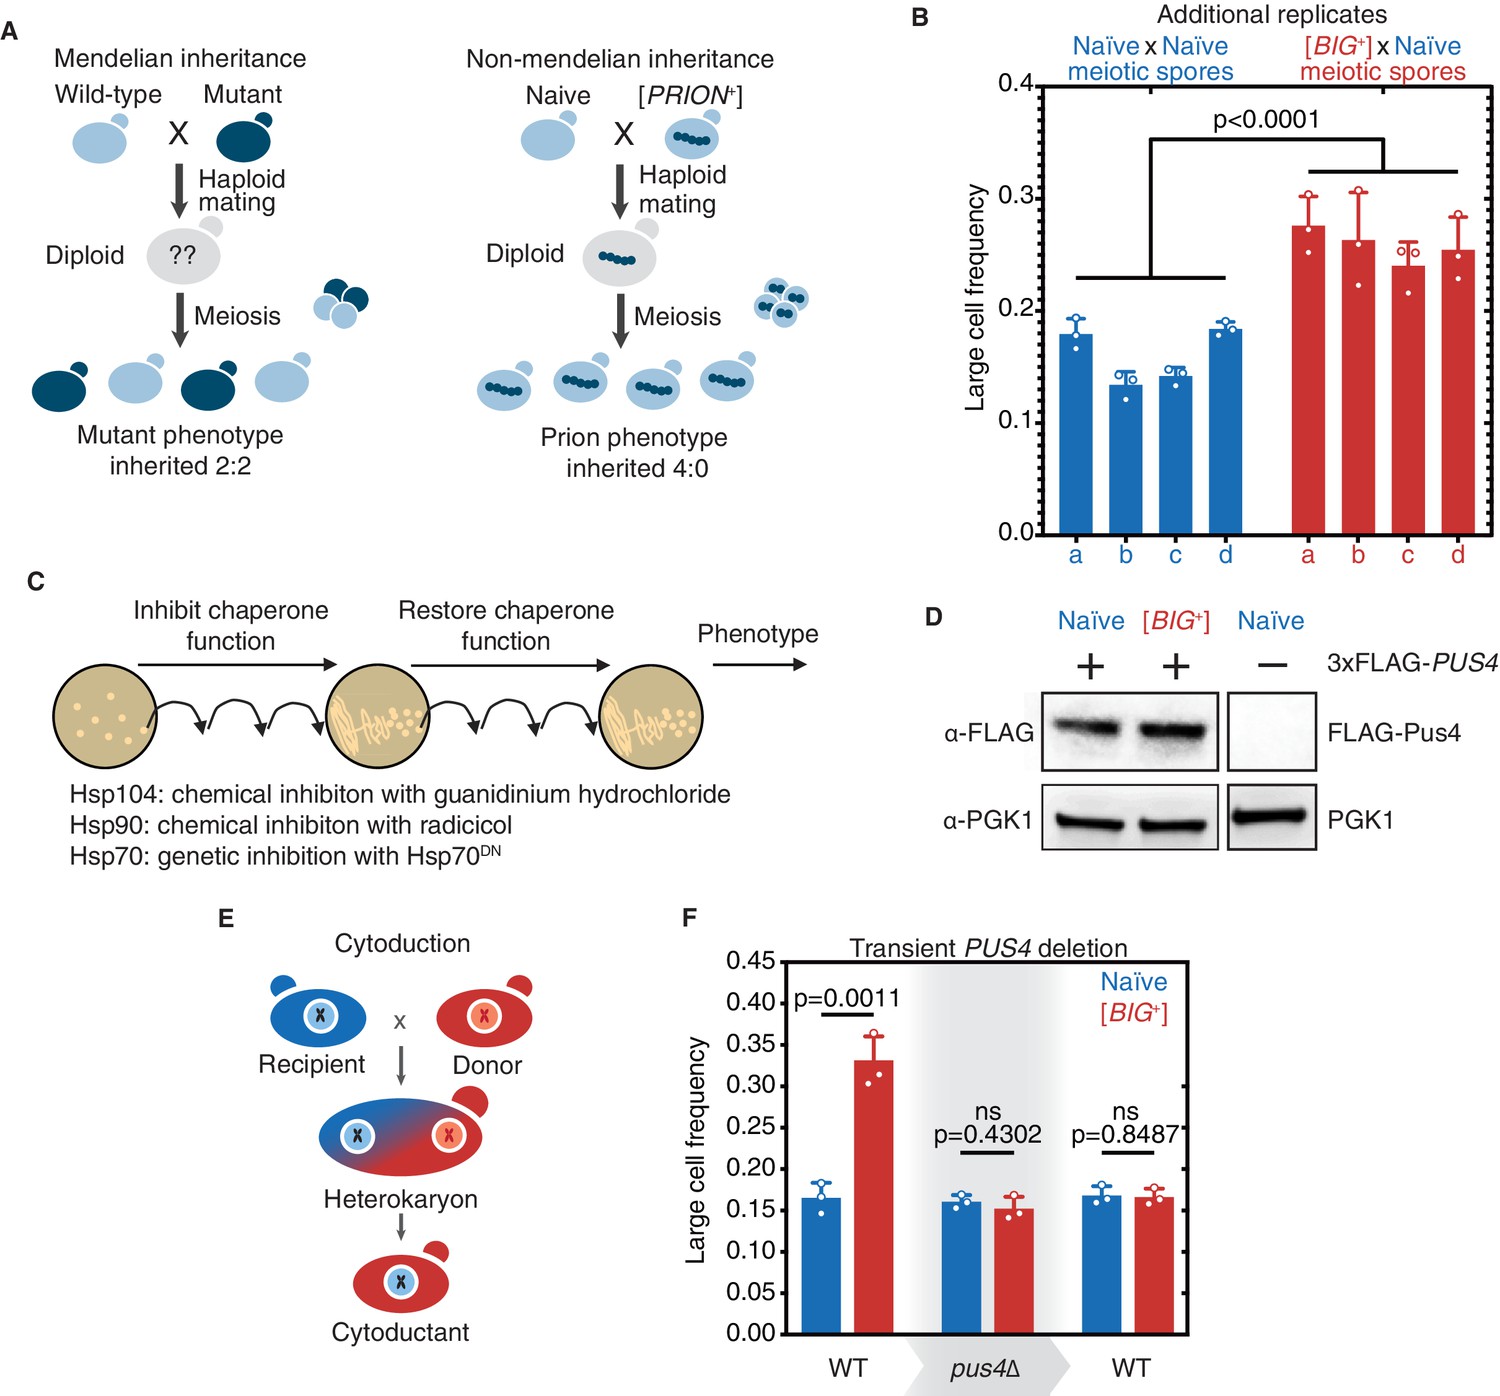
Tests for prion-like patterns of inheritance and dependence on Pus4 for [BIG+].
(A) In contrast to mutations, which when arising from one parent are inherited in half of the meiotic progeny, prion-based traits can be inherited in all meiotic progeny. (B) Additional biological replicate pairs of tetrads are shown for naïve and [BIG+] crosses. Bars represent the mean frequency of cells above the large cell threshold from three replicates, for which thousands of cells were measured for each replicate, error bars are standard deviation. Difference between the means of four tetrad spores between naïve and [BIG+], p<0.0001, unpaired t-test. (C) Experimental scheme to test the role of three different protein chaperones in the propagation of [BIG+]. Cells were exposed to various chaperone inhibitors, then propagated without inhibition to allow cells to recover, and then tested for retention of the large cell phenotype that existed prior to inhibition. (See Materials and methods.) (D) Pus4p is expressed at similar levels in naïve and [BIG+] cells. Naïve or [BIG+] haploid cells were crossed to a strain containing a seamlessly N-terminally 3xFLAG-tagged PUS4 gene, and total protein lysate was harvested, of which 15 µg was loaded onto a PAGE gel for each sample, and then probed with anti-FLAG, or anti-PGK1 loading control antibodies. The negative control lane (untagged strain) is from the same blot. (E) Prion-based traits can be passed through cytoduction that exchanges cytoplasmic material without exchange of nuclear material. (F) Transient deletion of PUS4 blocks inheritance of the large cell trait from [BIG+] cells. Bars represent the mean frequency of cells above the large cell threshold from three replicates, for which thousands of cells were measured for each replicate, error bars are standard deviation. Differences between mean large cell frequencies of wild-type naïve and [BIG+] cells prior to deletion, p=0.0011; after deletion of PUS4, p=0.4302; after re-introduction of PUS4, p=0.8487; unpaired t-test for all.
Figure 5 with 1 supplement
Pus4 activity is maintained in [BIG+].
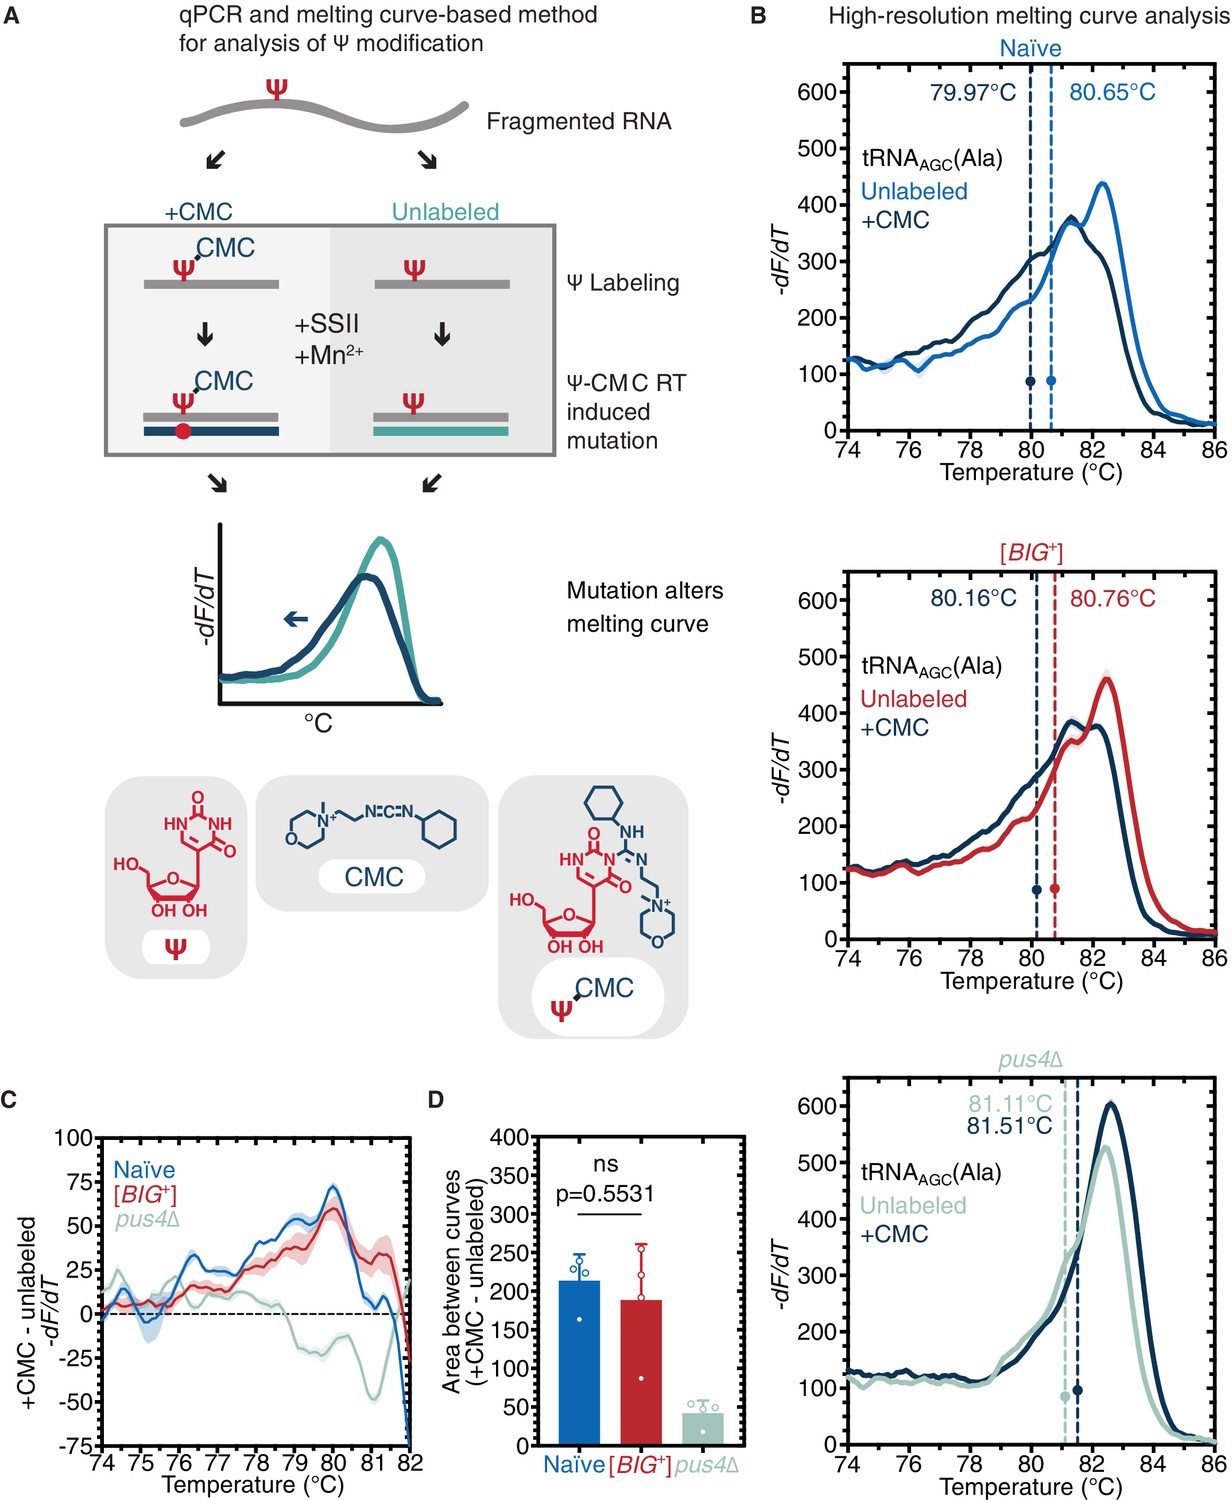
(A) Radiolabeling-free, qPCR-based method for locus-specific pseudouridine detection. Illustration is adapted from Scheme 1 of Lei and Yi, 2017. (B) High-resolution melting curve analysis demonstrates that Pus4-dependent pseudouridylation of tRNAAGC (Ala) is maintained in [BIG+] cells but not in cells that do not contain Pus4p. Top panel: naïve samples CMC-labeled (dark blue) or -unlabeled (light blue). Middle panel: [BIG+] samples CMC-labeled (dark blue) or -unlabeled (red). Bottom panel: pus4∆ samples CMC-labeled (dark blue) or -unlabeled (turquoise). Solid lines representing melting curves are the mean of four replicates, with shaded areas representing the standard error of the mean. Dots mark the geometric center of four replicates, bisected by a dashed line with a shaded area representing the standard error of the mean. The melting temperature (Tm) of this point is also displayed. The leftward shift of +CMC curves in naïve and [BIG+] but not pus4∆ samples indicates Pus4-dependent pseudouridylation of U55. (C) The difference in melting temperature behavior (dF/dT) between CMC-labeled and CMC-unlabeled tRNAAGC (Ala) amplicons is similar between [BIG+] cells and naïve cells, suggesting that Pus4-dependent Ψ is present at position 55 in tRNAAGC (Ala) in [BIG+] cells. Solid line represents the mean of four replicates, with shaded areas showing standard error of the mean. (D) The difference in area between the melting curves of CMC-labeled and CMC-unlabeled tRNAAGC (Ala) amplicons is similar between [BIG+] cells and naïve cells, suggesting that Pus4-dependent Ψ is present in [BIG+] cells. Bars represent the mean of four replicates, error bars indicate standard deviation, p=0.5531, unpaired t-test.
Figure 5—figure supplement 1
tRNA pseudouridylation and quantitative scaling of gene expression in mRNA sequencing.
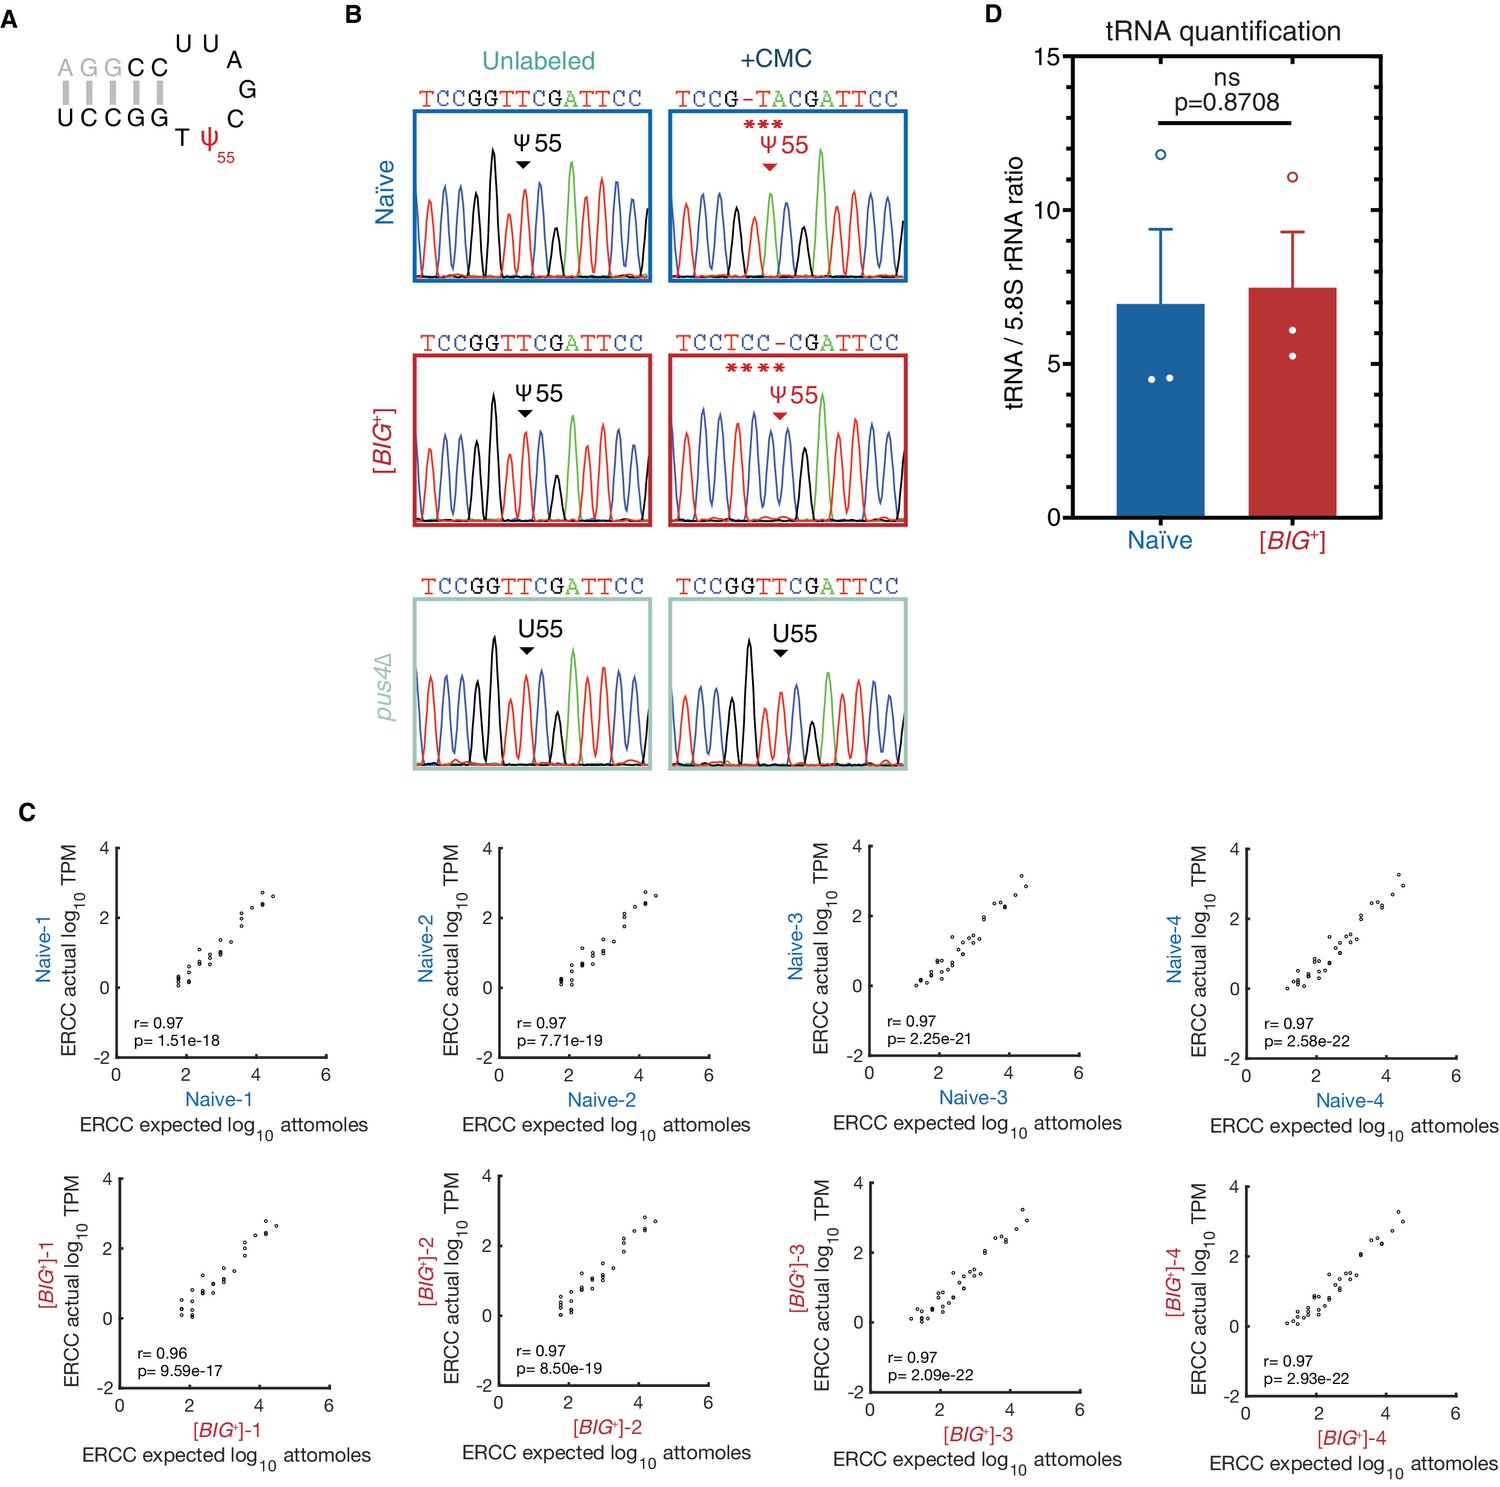
(A) In the TΨC loop of tRNAAGC (Ala), mutations resulting from reverse transcription of CMC-treated samples were only observed originating from position 55 (Ψ). Sanger sequencing profiles from nucleotides 49–62 (black or red) are shown in (B): control and CMC-labeled tRNA from naïve, [BIG+], and pus4Δ cells. Naïve and [BIG+] samples show a characteristic mutation in the +CMC-labeled molecules at position 55, the site of Pus4-dependent pseudouridylation, while pus4∆ cells do not. Asterisks highlight positions of CMC-induced mutations. (C) Plots comparing actual vs. expected read counts for ERCC spike-in controls in mRNA sequencing for each biological replicate of naïve (top row) and [BIG+] (bottom row). Data indicate robust quantitative scaling in gene expression measurements. (D) Total tRNA levels are not different in [BIG+] cells compared to naïve cells when normalized to non-Pus4 target 5.8 S rRNA (158 nt). Measurements represent the mean of three replicates with standard deviation shown, p=0.8708.
Figure 6 with 1 supplement
[BIG+] has altered protein synthesis.
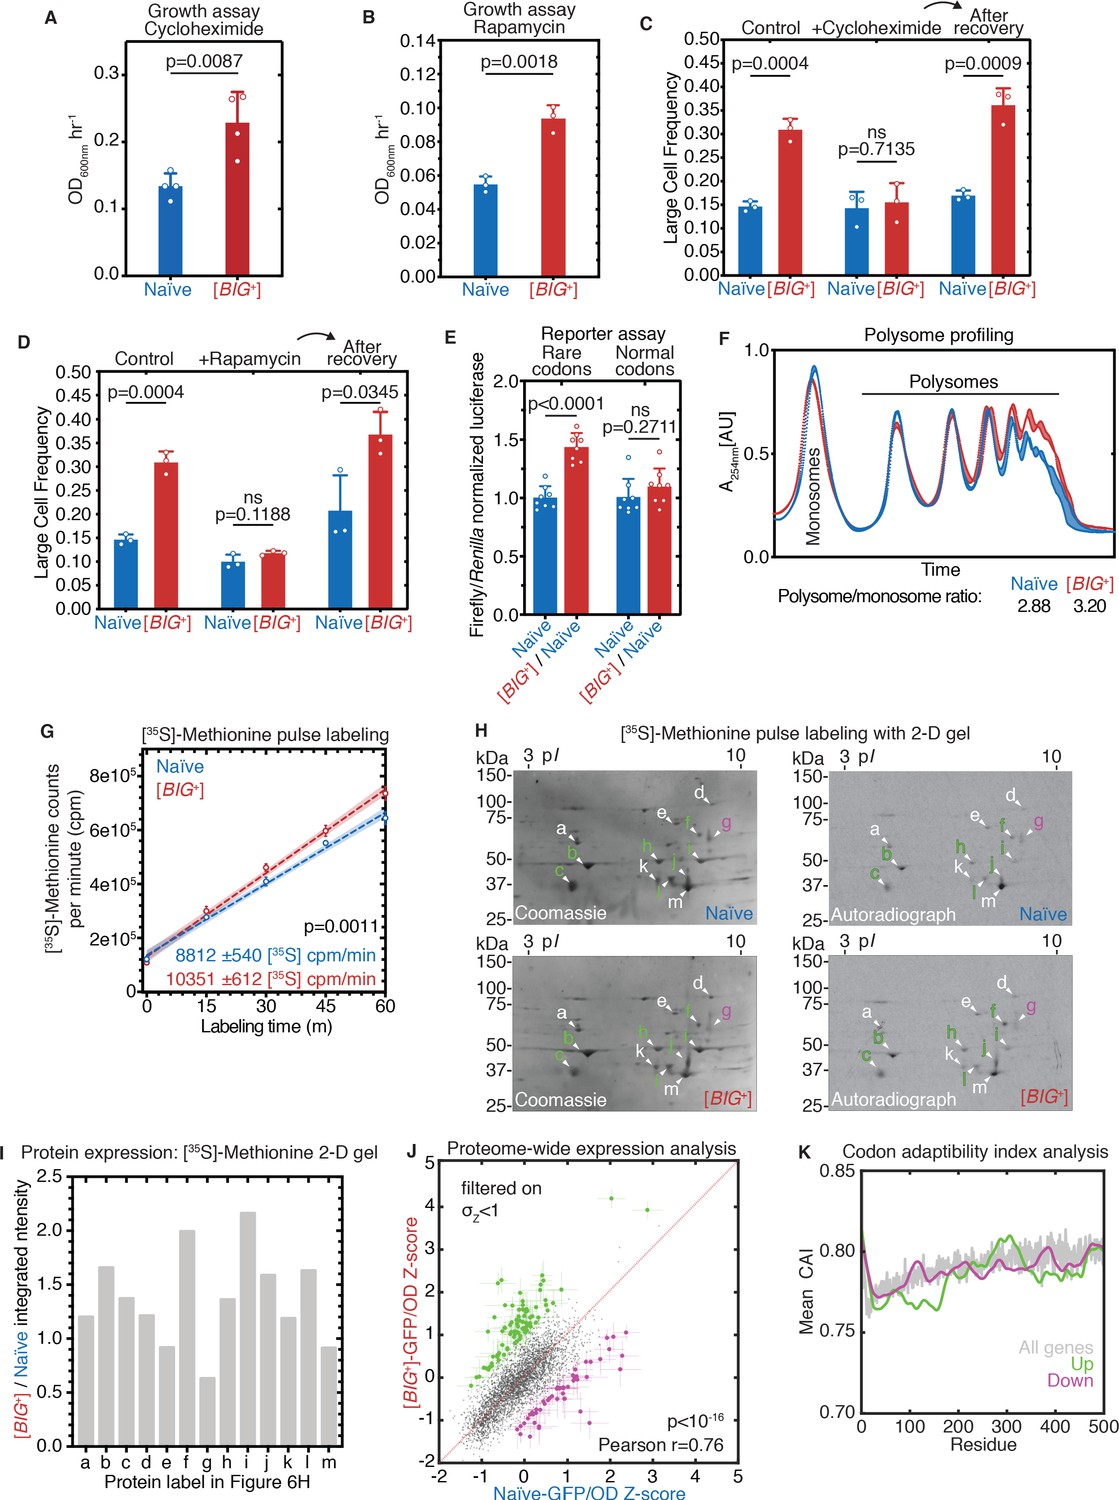
(A) [BIG+] cells are resistant to translation elongation inhibitor cycloheximide. Bars represent the mean of the maximum growth rate in YPD + cycloheximide (measured by the peak of the derivative of the growth data) of four replicates, error bars are standard deviation, p=0.0087, unpaired t-test. (B) [BIG+] cells are resistant to TOR inhibitor rapamycin. Bars represent the mean of the maximum growth rate in YPD + rapamycin (measured by the peak of the derivative of the growth data) of three replicates, error bars are standard deviation, p=0.0018, unpaired t-test. (C) [BIG+] cells grown in cycloheximide (0.05 µg/mL) are not larger than naïve cells. However, after recovery, they regain this phenotype. After treatment, cells were sub-cultured in YPD for ~75 generations before re-measuring the size in the absence of stress (see Materials and methods). Bars represent the mean frequency of cells above the large cell threshold from three replicates, for which thousands of cells were measured for each replicate, error bars are standard deviation. Difference between the means of naïve and [BIG+]: YPD control p=0.0004; YPD + cycloheximide p=0.7135; YPD after recovery p=0.0009; unpaired t-test for all. (D) [BIG+] cells grown in rapamycin are not larger than naïve cells. However, after recovery they regain this phenotype. After treatment, cells were subcultured in YPD for ~75 generations before re-measuring the size in the absence of stress (see Materials and methods). Bars represent the mean frequency of cells above the large cell threshold from three replicates, for which thousands of cells were measured for each replicate, error bars are standard deviation. Difference between the means of naïve and [BIG+]: YPD control p=0.0004 (same data presented in Figure 6C as experiments were done in parallel); YPD + rapamycin p=0.1188; YPD after recovery p=0.0345; unpaired t-test for all. (E) [BIG+] meiotic progeny translate more of a firefly luciferase reporter containing rare codons than naïve meiotic progeny do. This effect is not seen in an mRNA variant that encodes an identical protein but contains codons more frequently used in yeast. For each variant, normalized luciferase values in naïve cells are set to 1.0 to make presentation straightforward; however, the normal codon variant of firefly produces approximately five times more luciferase activity than the rare codon variant (data not shown; Chu et al., 2014). Bars represent mean normalized luciferase values (an invariable Renilla luciferase gene is co-expressed from the same plasmid) from eight replicates: rare codons p<0.0001, normal codons p=0.2711, unpaired t-tests for both. (F) [BIG+] cells have more polysomes than naïve cells, as measured by polysome profiling. Lines for two technical replicates for each sample are shown, with the area between them shaded. Ratios (average of two technical replicates) were calculated by taking the lowest point between the monosome and disome peak as zero, and then calculating the ratios of the areas under the sum of the polysome peaks to that under the monosome peaks. (G) Using [35S]-methionine pulse labeling, [BIG+] cells have an increased rate of translation relative to naïve cells (slope line fit: p=0.0011). Lines for three biological replicates for each sample are shown, with the area between them shaded. Timepoints were taken at 1, 15, 30, 45, and 60 min. (H) Separation of total protein by 2-D gel electrophoresis from cells pulse-labeled for 1 hr with [35S]-methionine demonstrates that many proteins are synthesized at a faster rate in [BIG+] cells, few at a slower rate, and some at an indistinguishably different rate, constituting an altered program of protein synthesis. For each gel, a Coomassie stain showing total protein and an autoradiography exposure newly synthesized protein are shown with a sampling of 13 distinguishable proteins labeled. Letters colored green or violet mark proteins whose expression was increased or decreased >1.25-fold, respectively, in the analysis presented in the next panel. (I) Relative protein levels measured by dot intensities from autoradiographs shown in Figure 6H. Shown are the values for 13 proteins quantified in both naïve and [BIG+] [35S]-methionine pulse-labeled samples. (J) Plot showing proteome-wide GFP::protein fusion expression in [BIG+] cells compared to naïve cells, highlighting ~130 proteins whose levels change. Each dot represents the mean of quadruplicate measurements of a single protein in naïve or [BIG+] cells: black dots are proteins that did not change significantly as measured by Z-score change of less than 1.0 (σZ<1); green dots are protein fusions with higher fluorescence in [BIG+] cells; violet dots are protein fusions with lower fluorescence in [BIG+] cells. For colored dots, the standard error of the mean is shown for both measurements from four biological replicates each. Pearson correlation of naïve and [BIG+] cells, r = 0.76, and p<10–16 indicates that most proteins have correlated expression levels. OD600 was adjusted based on known blank wells, and the GFP/OD600 measurements were normalized by Z-score ([xi-µ]/σ) within the naïve and [BIG+] populations independently. (K) Plot showing the protein residue number vs. the mean codon adaptation index (CAI) for all measured GFP-tagged proteins (gray line) and proteins whose levels were increased (green line) or decreased (violet line) in [BIG+] relative to naïve cells in the proteome-wide screen. Proteins whose levels were elevated in [BIG+] relative to naïve cells have a lower mean CAI in the 5′ ends of their mRNAs.
Figure 6—figure supplement 1
Altered cell cycle and translation in [BIG+].
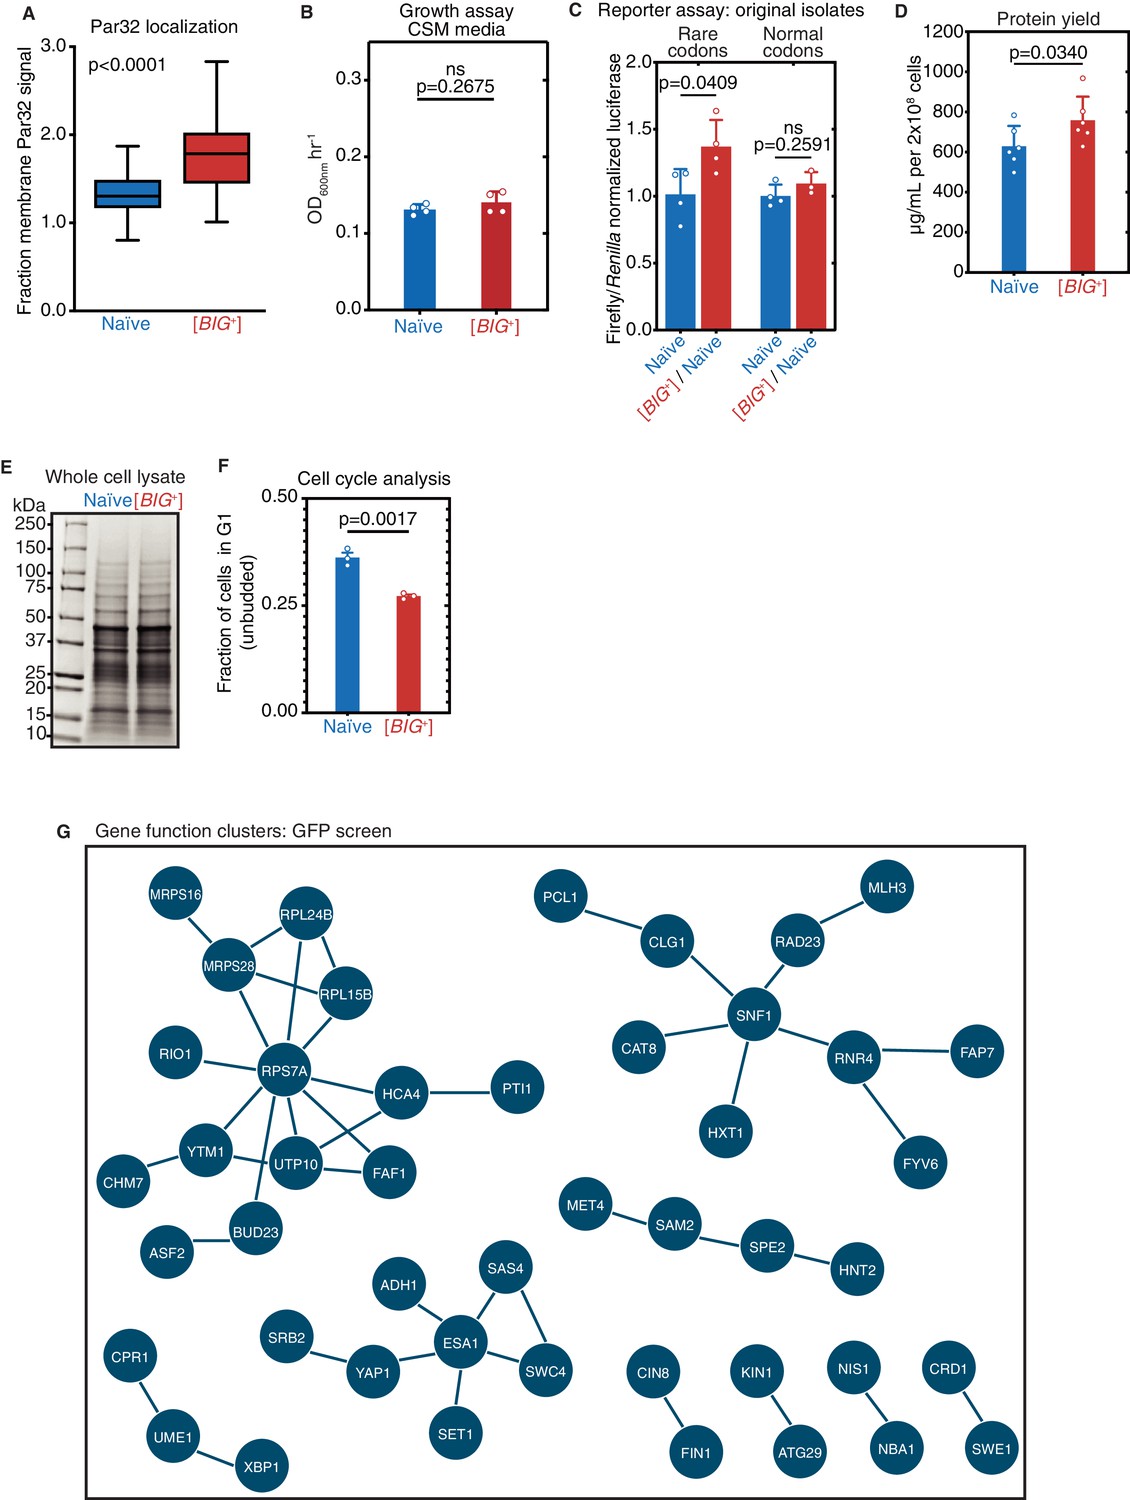
(A) Fraction of GFP-Par32 signal localized to the plasma membrane in naïve vs. [BIG+] cells measured using fluorescence microscopy. Shown are box-and-whisker plots with horizontal black lines in the center of each box showing the mean value and the error bars showing the complete range of values measured (72 and 86 cells from naïve and [BIG+] strains, respectively). A higher fraction of membrane Par32 signal is consistent with higher TOR activity. p<0.0001, Kolmogorov–Smirnov test. (B) [BIG+] cells do not exhibit enhanced proliferation in SD-CSM, a less nutrient-rich medium than YPD (Figure 1A). Bars represent the mean of four replicates of maximum growth rate (measured by the peak of the derivative of the growth data), error bars are standard deviation, p=0.2675, unpaired t-test. (C) Original [BIG+] isolates translate more of a firefly luciferase reporter containing rare codons than naïve cells do. This effect is not seen in an mRNA variant that encodes an identical protein but contains codons more frequently used in yeast. Bars represent mean normalized luciferase values (an invariable Renilla luciferase gene is co-expressed from the same plasmid) from four replicates: rare codons p=0.0409, normal codons p=0.2591, unpaired t-tests for both. (D) [BIG+] cells produce more total protein per cell number than naïve cells, as measured by bicinchoninic acid (BCA) Assay. Bars represent the mean of six replicates, p=0.0340, unpaired t-test. (E) Coomassie stain of 15 µg whole-cell protein lysate from each strain suggests there are no major differences in the relative expression of the most abundant proteins in [BIG+] cells compared to naïve cells. (F) The ratio of unbudded cells (G1 phase of the cell cycle) to budded cells (G2 and S phases) is reduced in [BIG+]. Bars represent the mean of three replicates, error bars are standard deviation, p=0.0017, unpaired t-test. (G) Network representation of proteins whose levels change in [BIG+] vs. naïve cells in GFP fusion screen (Figure 6J and Supplementary file 3), generated from STRING (string-db.org). Solid lines link proteins with genetic and/or physical interactions. The largest cluster—upper left—contains proteins involved in ribosome assembly and translation.
Figure 7 with 1 supplement
Pseudouridylation of mRNA in [BIG+] cells.
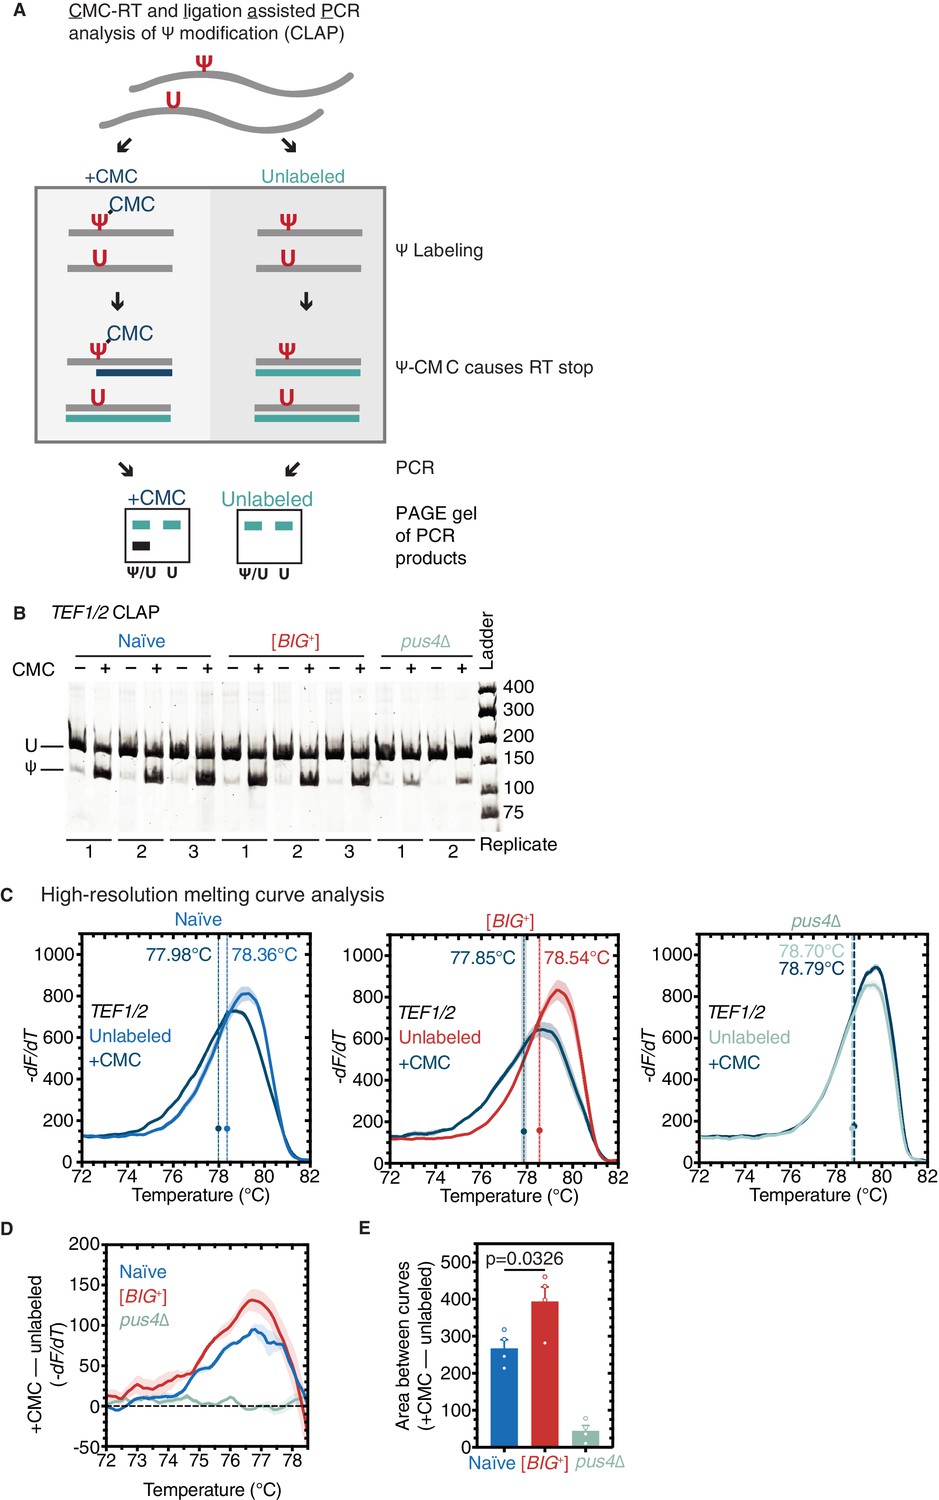
(A) CMC-RT and ligation-assisted PCR analysis of Ψ modification (CLAP) (Zhang et al., 2019). (B) Native PAGE showing the CLAP result for TEF1/TEF2 mRNA from multiple replicates of naïve (3), [BIG+] (3), or pus4∆ (2). Shorter bands indicating pseudouridylation that appear in CMC-unlabeled or pus4∆ samples may reflect either background signal from spontaneous cleavage near target site or Pus4p-independent modification of this site. (C) High-resolution melting curve analysis shows that U239 is pseudouridylated in TEF1/TEF2 mRNA in both naïve and [BIG+] cells but not in cells that do not contain Pus4p. Left panel: naïve samples CMC-labeled (dark blue) or -unlabeled (light blue). Middle panel: [BIG+] samples CMC-labeled (dark blue) or -unlabeled (red). Right panel: pus4∆ samples CMC-labeled (dark blue) or -unlabeled (turquoise). Dots mark the geometric center of four replicates, bisected by a dashed line with shaded area representing the standard error of the mean. The melting temperature (Tm) of this point is also displayed. Solid lines representing melting curves are the mean of four replicates, with shaded areas representing the standard error of the mean. (D) The difference in melting temperature behavior (df/dT) between CMC-labeled and CMC-unlabeled TEF1/TEF2 mRNA amplicons is larger in [BIG+] cells than in naïve cells, suggesting higher levels of pseudouridylation of U239 in [BIG+] cells. Solid line represents the mean of four replicates, with shaded areas showing standard error of the mean. (E) The difference in area between the melting curves of CMC-labeled and CMC-unlabeled TEF1/TEF2 mRNA amplicons is greater in [BIG+] cells than in naïve cells, suggesting higher levels of pseudouridylation of U239 in [BIG+] cells. Bars represent the mean of four replicates, error bars indicate standard deviation, p=0.0326, unpaired t-test.
Figure 7—figure supplement 1
Pseudouridylation of mRNA in [BIG+] cells.
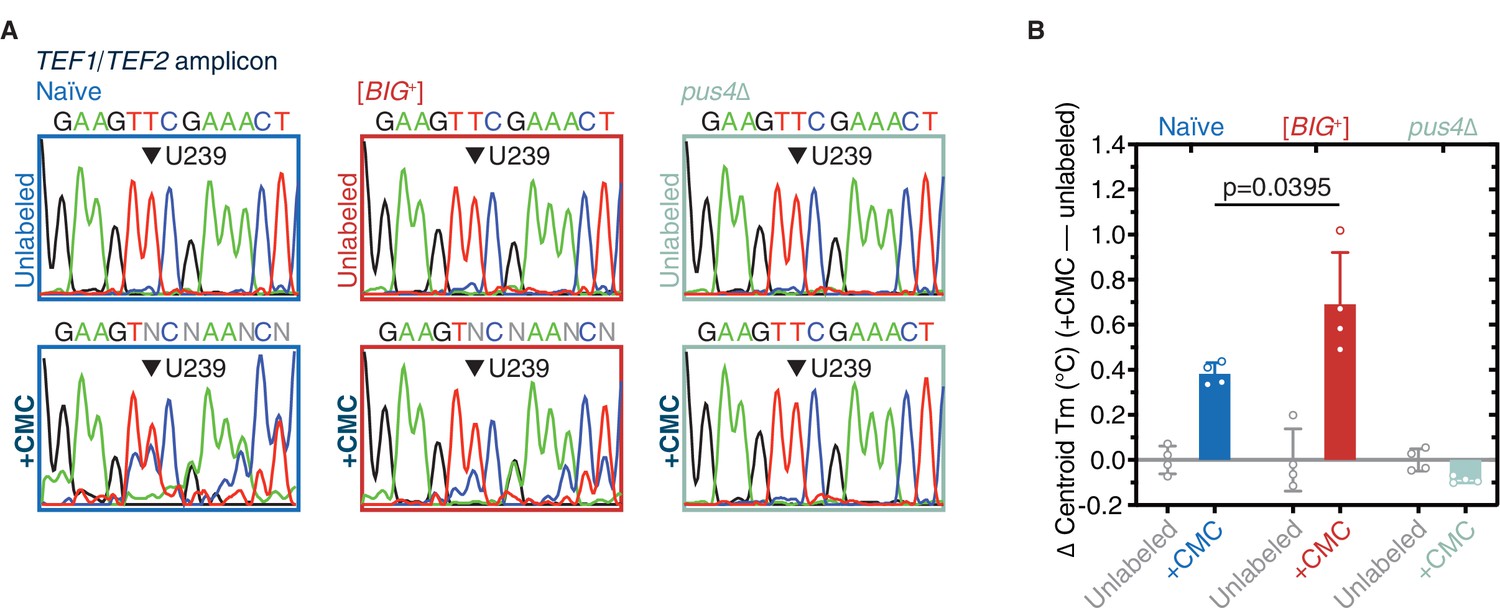
(A) Sanger sequencing profiles from control and CMC-labeled RNA from naïve, [BIG+], and pus4Δ cells. Naïve and [BIG+] samples show characteristic mixed nucleotide assignments at previously annotated pseudouridylated position U239 in TEF1/TEF2 mRNA, as well as more variable assignments 3′ or this position, indicating the presence of a mixed population of amplicons containing CMC-pseudouridine induced mutations and deletions. (B) The difference in Tm between the curves of CMC-labeled and CMC-unlabeled TEF1/TEF2 mRNA amplicons is greater in [BIG+] cells than in naïve cells, suggesting higher levels of pseudouridylation of U239 in [BIG+] cells. Each bar represents the mean of four technical replicates of the change in the centroid Tm, or the center of the distribution in both the x and y dimensions. Error bars are standard deviations. Difference between naïve and [BIG+], p=0.0395, unpaired t-test.
Figure 8 with 1 supplement
Epigenetic control of [BIG+]-like phenotypes in wild yeasts.
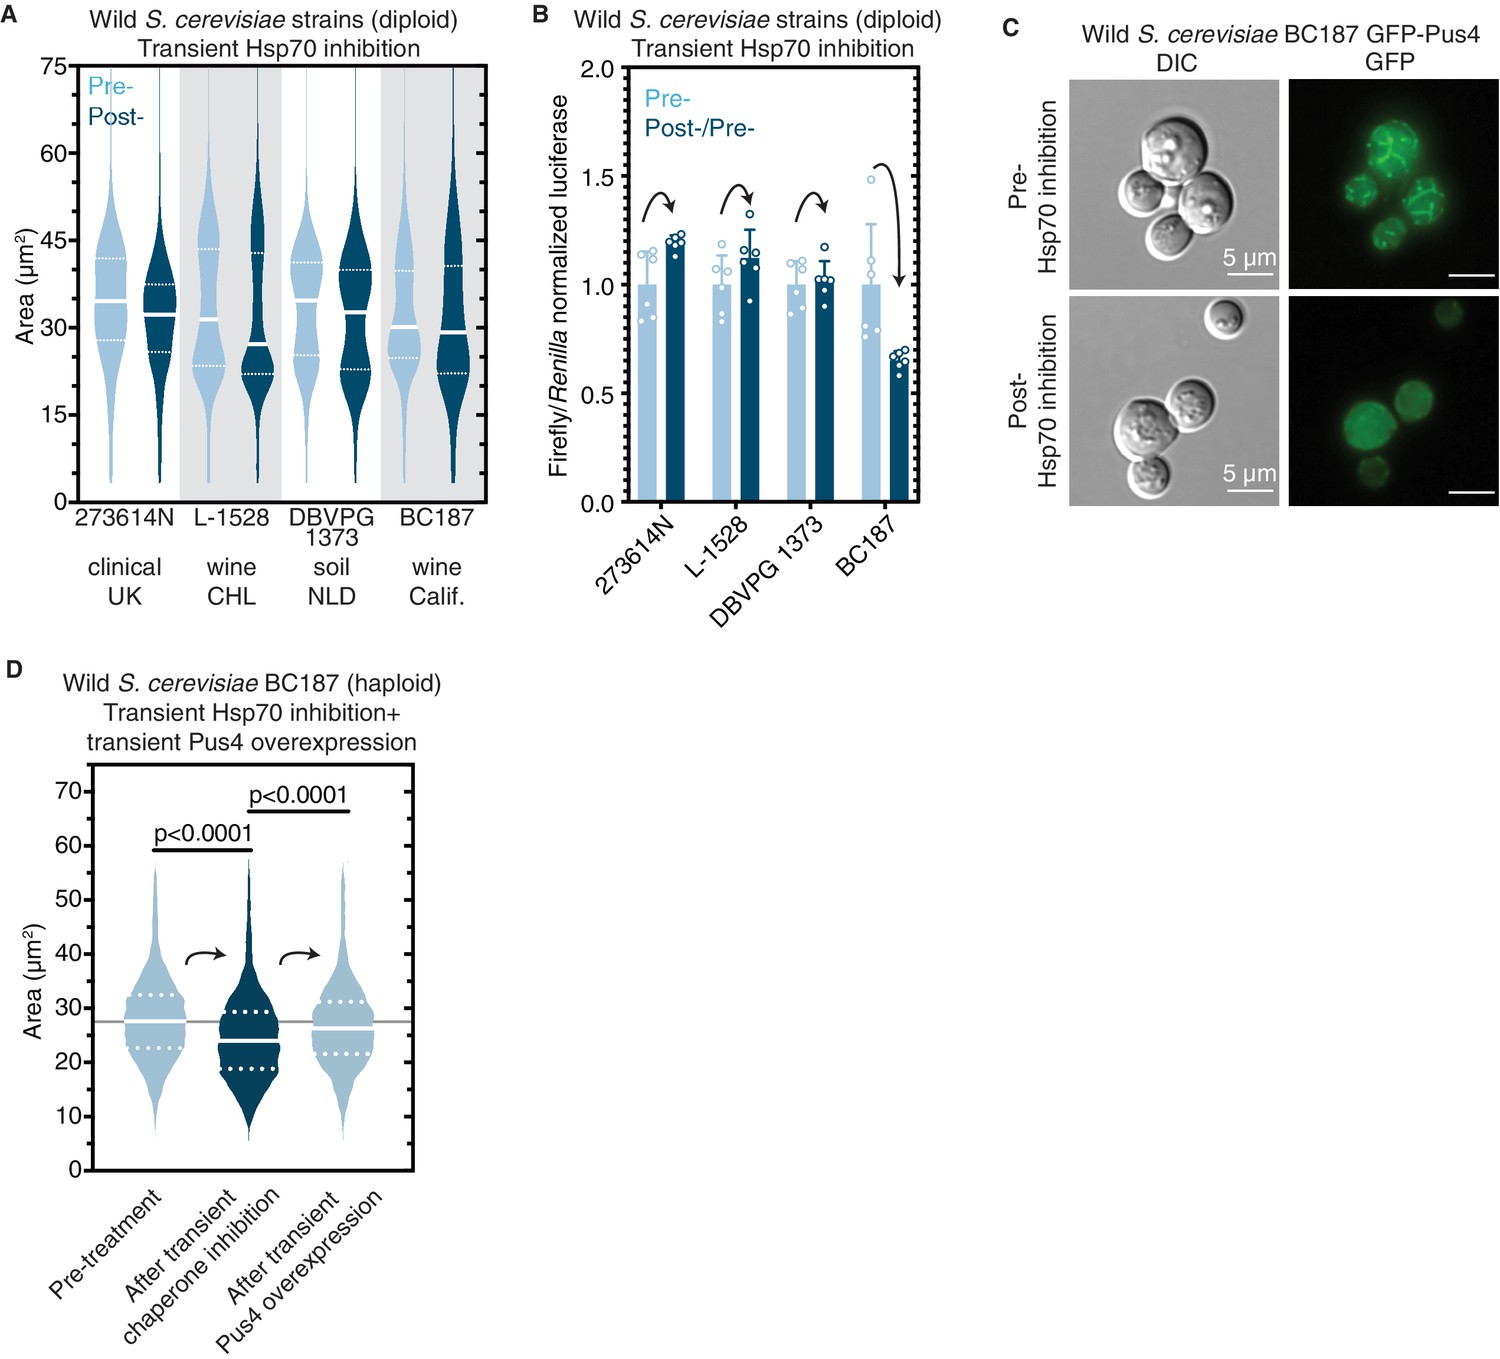
(A) Transient inhibition of Hsp70 in diploid wild yeast strains from different niches around the globe leads to a permanent reduction in cell size. Violin plots show all data from thousands of cells from three biological replicates of each strain, light blue are cells before Hsp70 inhibition (‘pre-’), dark blue are cells after transient Hsp70 inhibition and recovery (‘post-’). The solid white line bisecting each distribution indicates mean; dotted lines indicate upper and lower quartiles. 273614N: clinical isolate from the United Kingdom, pre- vs. post- p<0.0001. L-1528: wine isolate from Chile, pre- vs. post- p<0.0001. DBVPG 1373: soil isolate from the Netherlands, pre- vs. post- p<0.0001. BC187: wine isolate from California, pre- vs. post- p<0.0001. Kolmogorov–Smirnov test for all. (B) Transient inhibition of Hsp70 in wild yeast strains leads to permanent changes in protein synthesis capacity. Firefly reporter contains the ‘normal’ suite of codons, which is normalized to internal control Renilla luciferase. Bars represent the mean of normalized luciferase values for six biological replicates, error bars are standard deviation. Light blue ‘pre-’ are cells prior to Hsp70 inhibition, dark blue ‘post-’ are cells after transient Hsp70 inhibition and recovery. A value above 1.0 for the dark blue bars indicates that the normalized translation capacity has increased after prion curing, a value below 1.0 indicates that capacity has decreased. 273614N p=0.0134, L-1528 p=0.1397, DBVPG 1373 p=0.7428, BC187 p=0.0125, unpaired t-test for all. (C) Transient inhibition of Hsp70 in BC187 wine isolate leads to permanent changes in Pus4p expression pattern, suggesting that its conformation may also be epigenetically regulated in wild strains. Prior to inhibition (top), cells show a distinct fragmented network of Pus4 expression; after transient inhibition and recovery (bottom), the expression pattern becomes much more diffuse. (D) Transient inhibition of Hsp70 in haploid wild BC187 yeast strains leads to a permanent reduction in cell size. After this regime, if Pus4p alone is transiently overexpressed, cells then permanently regain their original larger cell size. Violin plots show all data from thousands of cells from three biological replicates of each strain. The solid white line bisecting each distribution indicates mean; dotted lines indicate upper and lower quartiles. Kolmogorov–Smirnov tests.
Figure 8—figure supplement 1
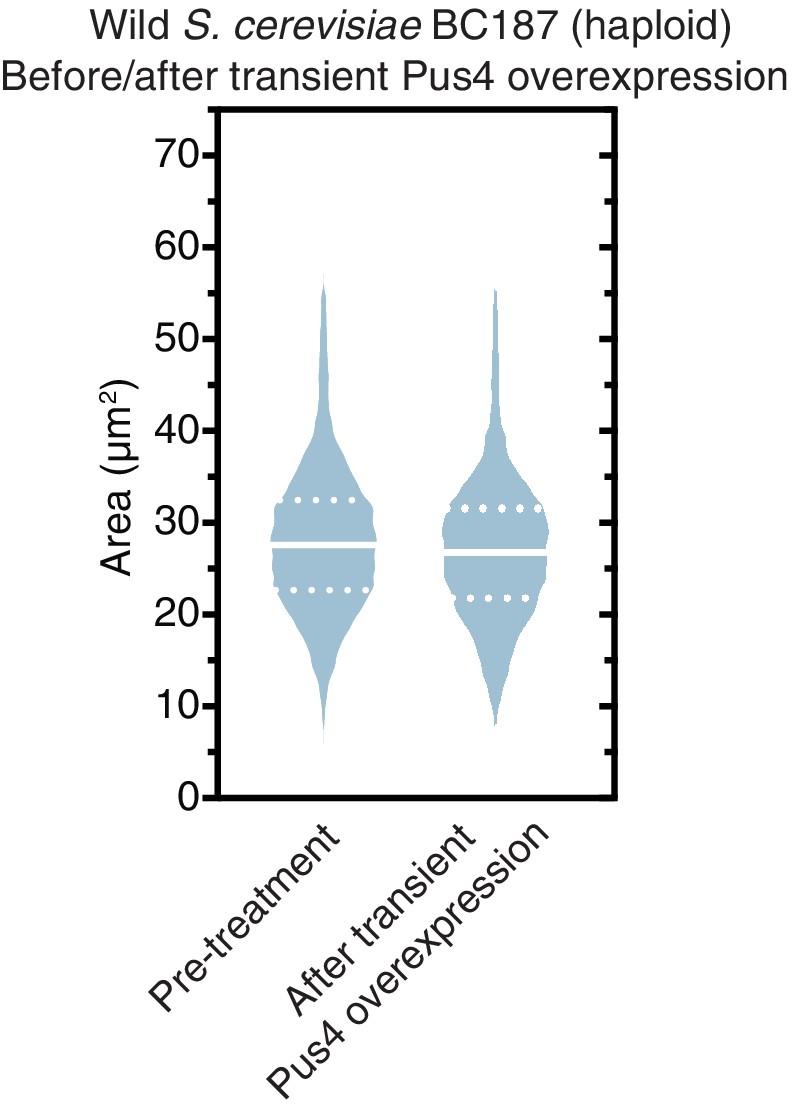
Transient Pus4 overexpression does not permanently increase the size of uncured BC187 cells.
Violin plots show all data from thousands of cells from three biological replicates of each strain. The solid white line bisecting each distribution indicates mean; dotted lines indicate upper and lower quartiles.
Author response image 1

Author response image 2
Tables
Key resources table
| Reagent type (species) or resource | Designation | Source or reference | Identifiers | Additional information |
|---|---|---|---|---|
| Strain, strain background (Saccharomyces cerevisiae) | See Supplementary file 4 | |||
| Antibody | Anti-FLAG M2 mouse monoclonal antibody | Sigma | RRID:AB_262044 | (1:1000) |
| Antibody | Goat anti-mouse IgG peroxidase | Sigma | RRID:AB_257993 | (1:10,000) |
| Antibody | Mouse anti-PGK1 monoclonal antibody | Invitrogen | RRID:AB_2532235 | (1:1000) |
| Recombinant DNA reagent | See Supplementary file 4 | |||
| Sequence-based reagent | See Supplementary file 4 | |||
| Commercial assay or kit | Dual-Luciferase Reporter Assay | Promega | Catalog# E1910 | |
| Commercial assay or kit | ERCC ExFold RNA Spike-In Mixes | Invitrogen | Catalog# 4456739 | |
| Chemical compound, drug | Cycloheximide | Sigma | Catalog# C1988 | CAS# 66-81-9 |
| Chemical compound, drug | Radicicol | Research Products International | Catalog#R20020-0.001 | CAS# 12772-57-5 |
| Chemical compound, drug | Rapamycin | LC Laboratories | Catalog# R-5000 | CAS# 53123-88-9 |
| Chemical compound, drug | Canavanine | Sigma | Catalog# C9758 | CAS# 2219-31-0 |
| Chemical compound, drug | 5-Fluoroorotic acid monohydrate (5-FOA) | GoldBio | Catalog# F-230–2.5 | CAS# 220141-70-8 |
| Chemical compound, drug | Guanidine hydrochloride | Sigma | Catalog# G3272 | CAS# 50-01-1 |
| Chemical compound, drug | [35S]-methionine | Perkin Elmer | Catalog# NEG709A500UC | |
| Chemical compound, drug | N-Cyclohexyl-N′-(2-morpholinoethyl)carbodiimide methyl-p-toluenesulfonate (CMC) | Sigma | Catalog# C106402 | CAS# 2491-17-0 |
| Software, algorithm | ImageJ software | ImageJ (http://imagej.nih.gov/ij/) | RRID:SCR_003070 | |
| Software, algorithm | GraphPad Prism software | GraphPad Prism (https://graphpad.com) | RRID:SCR_002798 | |
| Software, algorithm | Model | https://github.com/cjakobson/liveFastDieYoung |
Additional files
-
Supplementary file 1
See .docx file for parameter values used for the competitive fitness models shown in Figure 2 and Figure 2—figure supplement 1.
- https://cdn.elifesciences.org/articles/60917/elife-60917-supp1-v1.docx
-
Supplementary file 2
RNA-sequencing results.
See .xlsx file for transcripts per kilobase million for each gene in four replicates of naïve and four replicates of [BIG+]. Genes that showed significant differences are listed in a separate tab.
- https://cdn.elifesciences.org/articles/60917/elife-60917-supp2-v1.xlsx
-
Supplementary file 3
Proteins whose expression is changed in [BIG+] cells.
- https://cdn.elifesciences.org/articles/60917/elife-60917-supp3-v1.xlsx
-
Supplementary file 4
Yeast strains, plasmids, and oligonucleotides used in this study.
See .xlsx file.
- https://cdn.elifesciences.org/articles/60917/elife-60917-supp4-v1.xlsx
-
Supplementary file 5
Yeast genes with predicted Pus4 target sites based on scanning the yeast genome using a position weight matrix.
See .csv file.
- https://cdn.elifesciences.org/articles/60917/elife-60917-supp5-v1.csv
-
Transparent reporting form
- https://cdn.elifesciences.org/articles/60917/elife-60917-transrepform1-v1.docx
-
Reporting standard 1
Statistical reporting.
- https://cdn.elifesciences.org/articles/60917/elife-60917-repstand1-v1.xlsx
Download links
A two-part list of links to download the article, or parts of the article, in various formats.
Downloads (link to download the article as PDF)
Open citations (links to open the citations from this article in various online reference manager services)
Cite this article (links to download the citations from this article in formats compatible with various reference manager tools)
A prion accelerates proliferation at the expense of lifespan
eLife 10:e60917.
https://doi.org/10.7554/eLife.60917


