Uncovering the basis of protein-protein interaction specificity with a combinatorially complete library
- Department of Biology Massachusetts Institute of Technology, United States
- Howard Hughes Medical Institute Massachusetts Institute of Technology, United States
Figures
Figure 1 with 1 supplement

Specificity-determining residues that dictate toxin-antitoxin interactions.
(A) Schematic representing how antitoxin mutations in specificity-determining residues might affect binding to the cognate toxin (blue) or the non-cognate toxin (gold). A wider gap in binding preference reflects greater specificity. The effects of mutating a specificity residue that serves a positive specificity role (a), a negative specificity role (b), or both roles (c) are shown. Mutations that represent possible trade-offs between binding the cognate toxin and discriminating against the non-cognate toxin are also shown (d–e). (B) Models for how positive and negative specificity determinants are distributed across the interface. Model 1: positive and negative design are accomplished by distinct interface residues. Model 2: individual residues can serve both roles. (C) Sequence alignment of three ParD-ParE systems from Mesorhizobium opportunistum. Coevolving residues are highlighted in purple (ParD) or orange (ParE). (D) Phylogenetic tree inferred from protein sequences of 15 highly conserved genes. Distribution of ParDE2 systems and ParDE3 systems are indicated in gold and blue, respectively. (E) Toxicity-rescue assay for wild-type ParD2, wild-type ParD3, or the ParD3 variant indicated, each co-expressed with either wild-type ParE2 or ParE3 toxin. The ParD3 variants harbor subsets, as noted, of the mutations D61I, K64L, and E80K. (F) Residues in ParD and ParE that strongly coevolve (probability score >0.95) with lines connecting covarying pairs. Residues are numbered according to their position in the alignments in panel (C). Positions selected for the ParD3 saturation mutagenesis library are indicated in red.
Figure 1—figure supplement 1

ParE protein tree.
A representative protein from each clade is indicated.
Figure 2 with 2 supplements

Mapping variant fitness via a combinatorially complete library.
(A) Residues mutated in the saturation mutagenesis library, mapped onto the ParD3-ParE3 crystal structure (PDB: 5CEG). Salt bridges between ParD3 library positions and ParE3 are indicated. Note that ParD3-ParE3 forms a symmetric tetramer with two chains of each protein; for simplicity, only a single chain of each is shown. (B) Schematic of the ParD3 library experiment. (C) Fraction of single, double, and triple mutants that neutralize ParE3 or ParE2 (W ≥ 0.5). (D) Frequency of amino acids at each position for variants that neutralize ParE3, summarized as a sequence logo, as the fitness thresholds indicated. (E–F) Fitness of all single (E) and double (F) mutants against ParE3. (G–I) Same as in (D)-(F), but for ParE2.
Figure 2—figure supplement 1
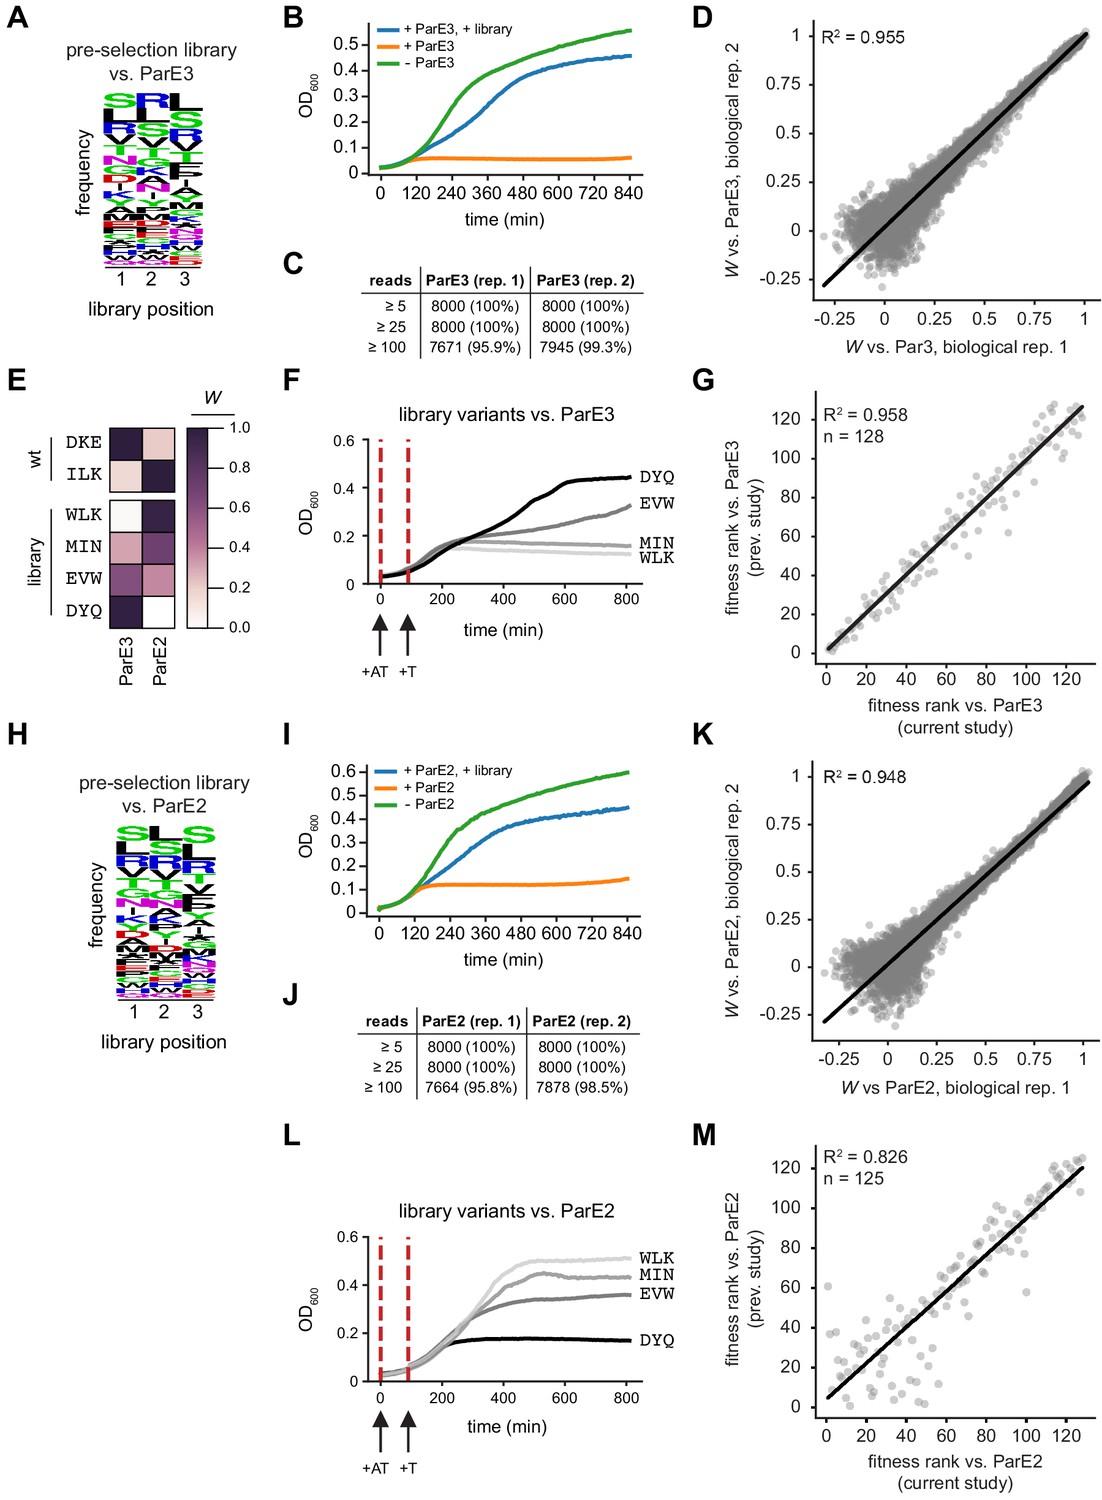
ParD3 library validation and statistics.
(A) Composition of the ParD3 library in ParE3-expressing cells at t = 0. (B) Representative cell growth following ParE3 induction, +/- library expression. (C) Pre-selection read counts for two replicates. Selection was performed independently on each replicate. (D) Comparison of fitness measurements between replicates. (E–F) Fitness scores for four variants from selection experiment (E), and the growth of these variants in the presence of ParE3 in an independent assay (F). (G) Comparison of relative fitness for variants studied in this work (x-axis) and our previous work (y-axis; Aakre et al., 2015). (H–K) Same as in A-D, but for ParE2. (L–M) Same as in F-G, but for ParE2. Variants in (L) are the same as in (E–F).
Figure 2—figure supplement 2
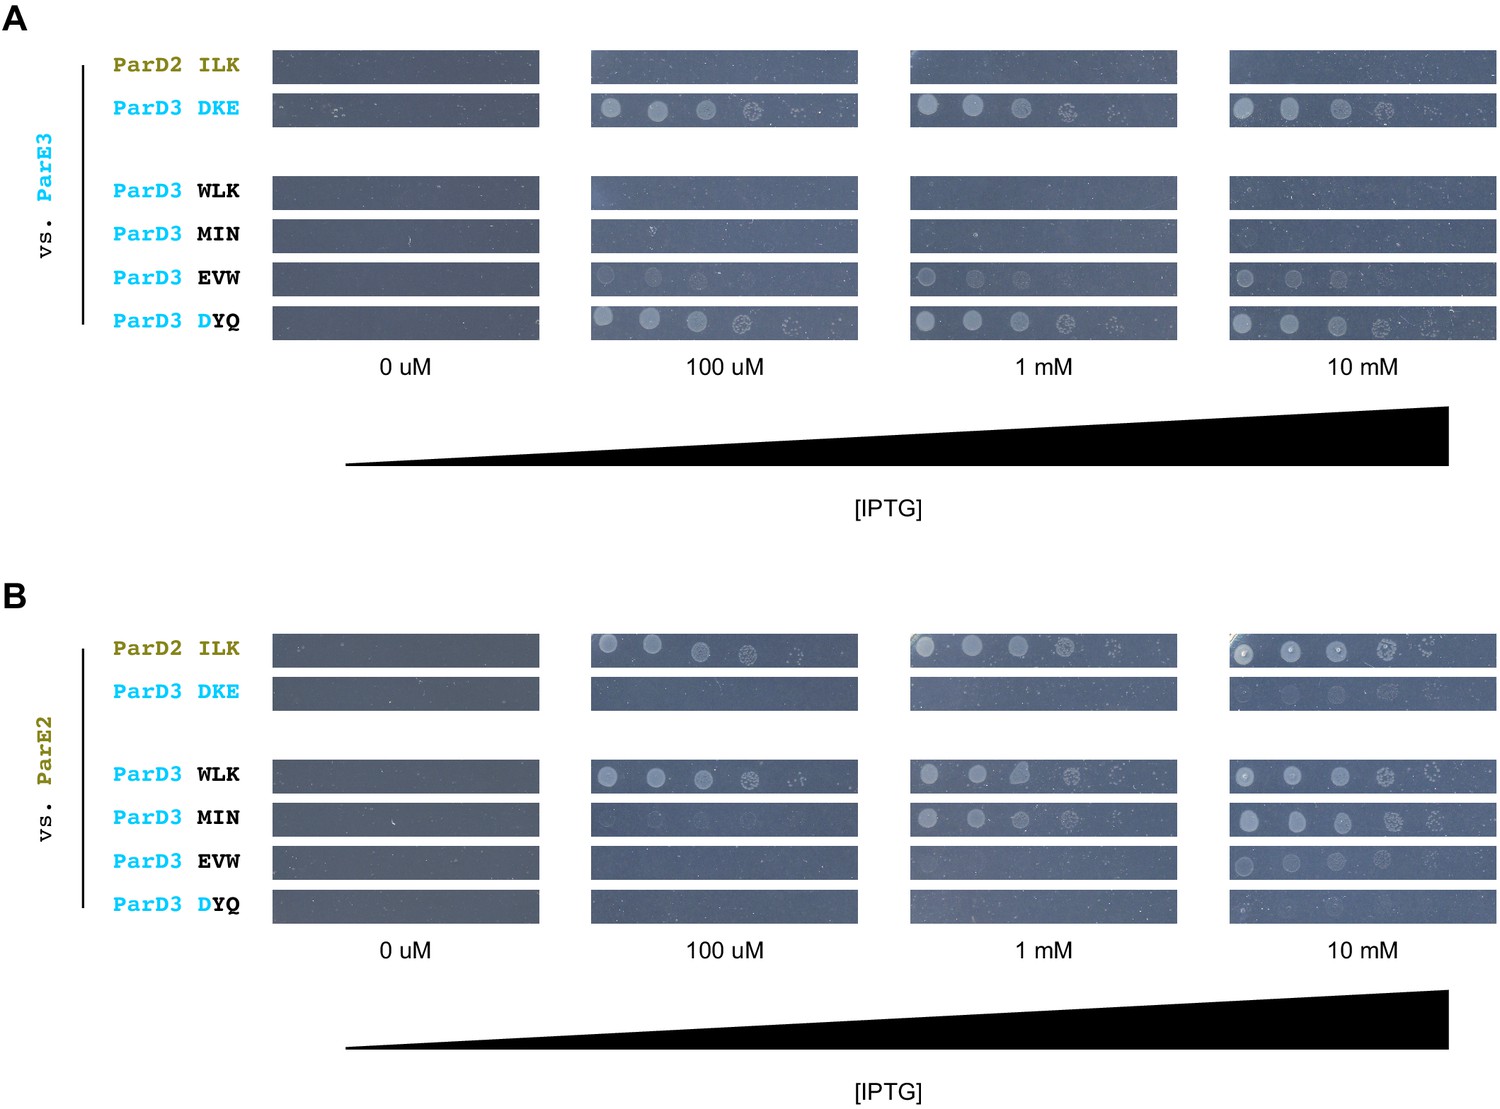
Comparing the relative fitness of variants across different induction levels.
(A) Cell growth of strains expressing ParE3 and indicated ParD3 variants in the presence of different concentrations of IPTG. Variants correspond to those in Figure 2—figure supplement 1E. (B) Same as (A), but for ParE2.
Figure 3 with 1 supplement
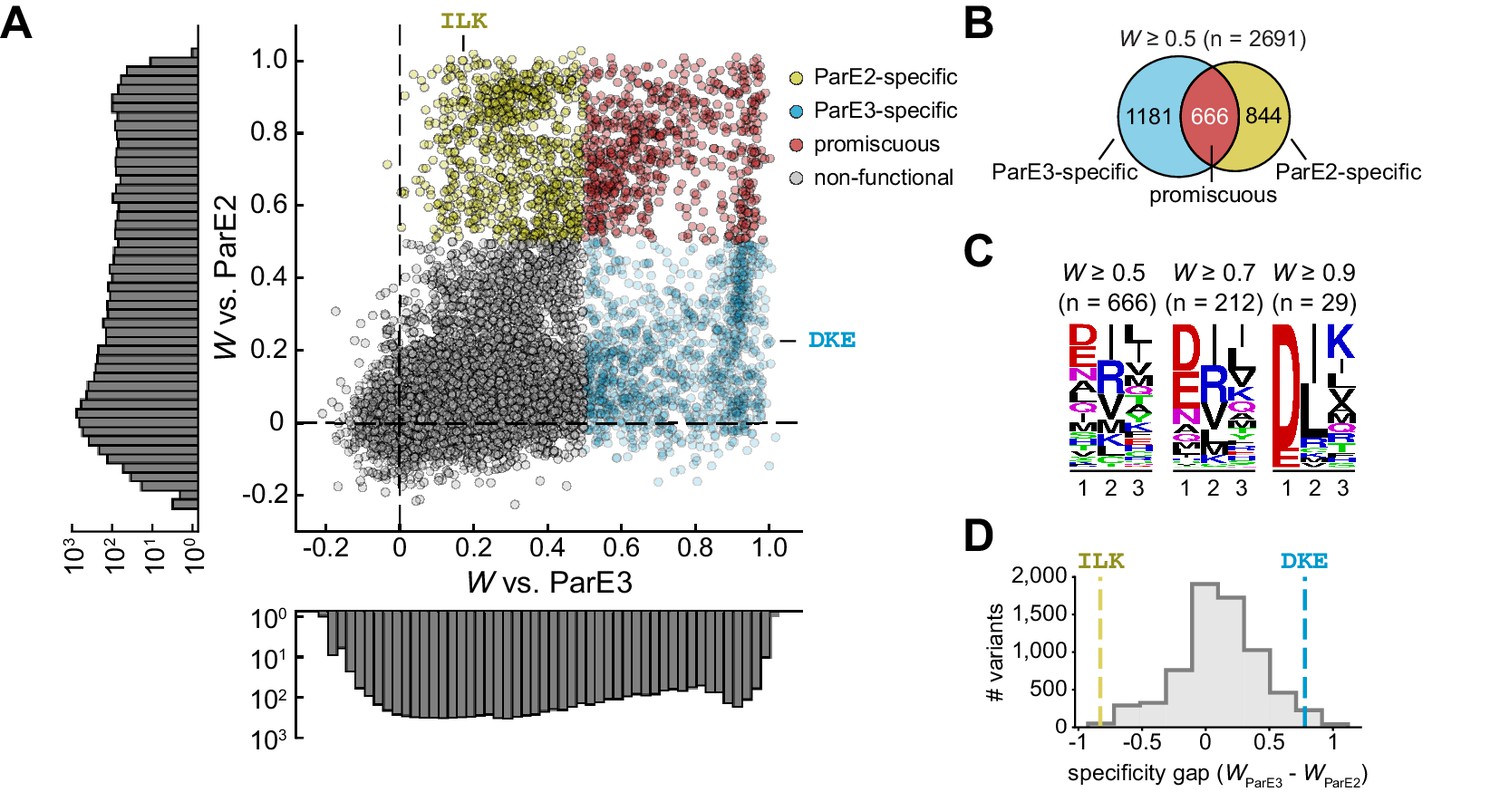
The sequence space of antitoxin specificity residues.
(A) Fitness of ParD3 variants against ParE2 and ParE3. Gold, specific for ParE2; blue, specific for ParE3; red, promiscuous for both toxins. Histograms of fitness values are depicted. (B) Venn diagram of ParD3 variants that neutralize ParE3, ParE2, or both. (C) Frequency of amino acids at each position for promiscuous variants, summarized as a sequence logo, at the fitness thresholds indicated. (D) Specificity gap for library variants, calculated as WParE3 – WParE2. The gap for the wild-type ParD3 variant (‘DKE,’ blue dashed line) and ParD2-like variant (‘ILK,’ gold dashed line) are shown. Variants with prolines are omitted.
Figure 3—figure supplement 1
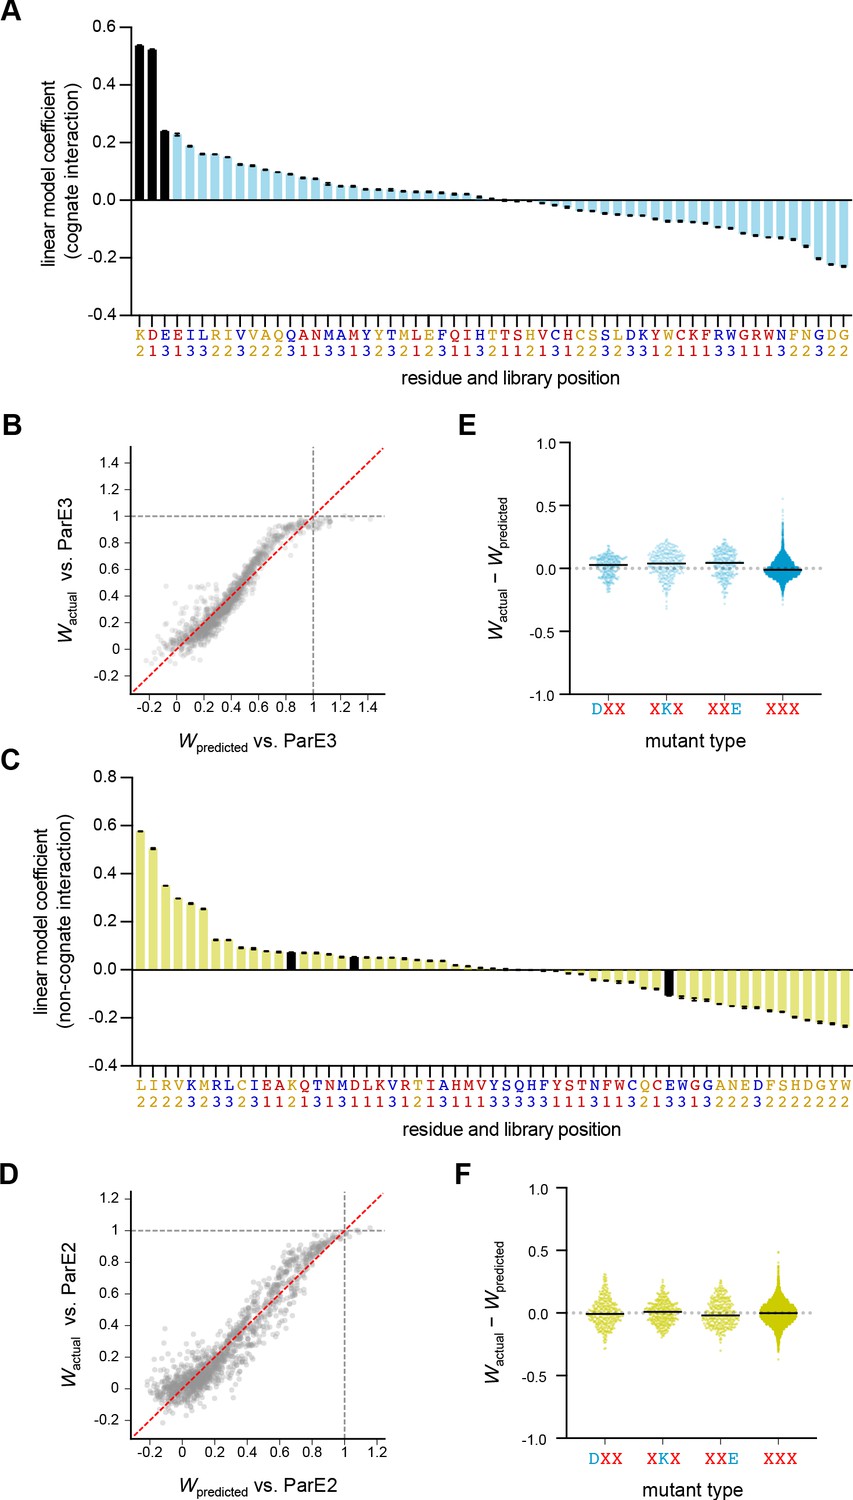
A linear model predicts variant fitness.
(A) All coefficients for a linear model (see text and Materials and methods for details) predicting variant fitness against ParE3, assuming additivity between library positions. Error bars indicate standard deviations from five-fold cross-validation. Wild-type ParD3 residues are black. (B) Observed fitness values for library variants are plotted against the predicted values from the linear model. Data are from one representative fold. The y = x line is plotted in red. (C–D) Same as in (A–B), but for variant fitness against ParE2. (E–F) Difference between actual and predicted fitness versus. ParE3 (E) or ParE2 (F) calculated from the linear model for double and triple mutants.
Figure 4 with 3 supplements
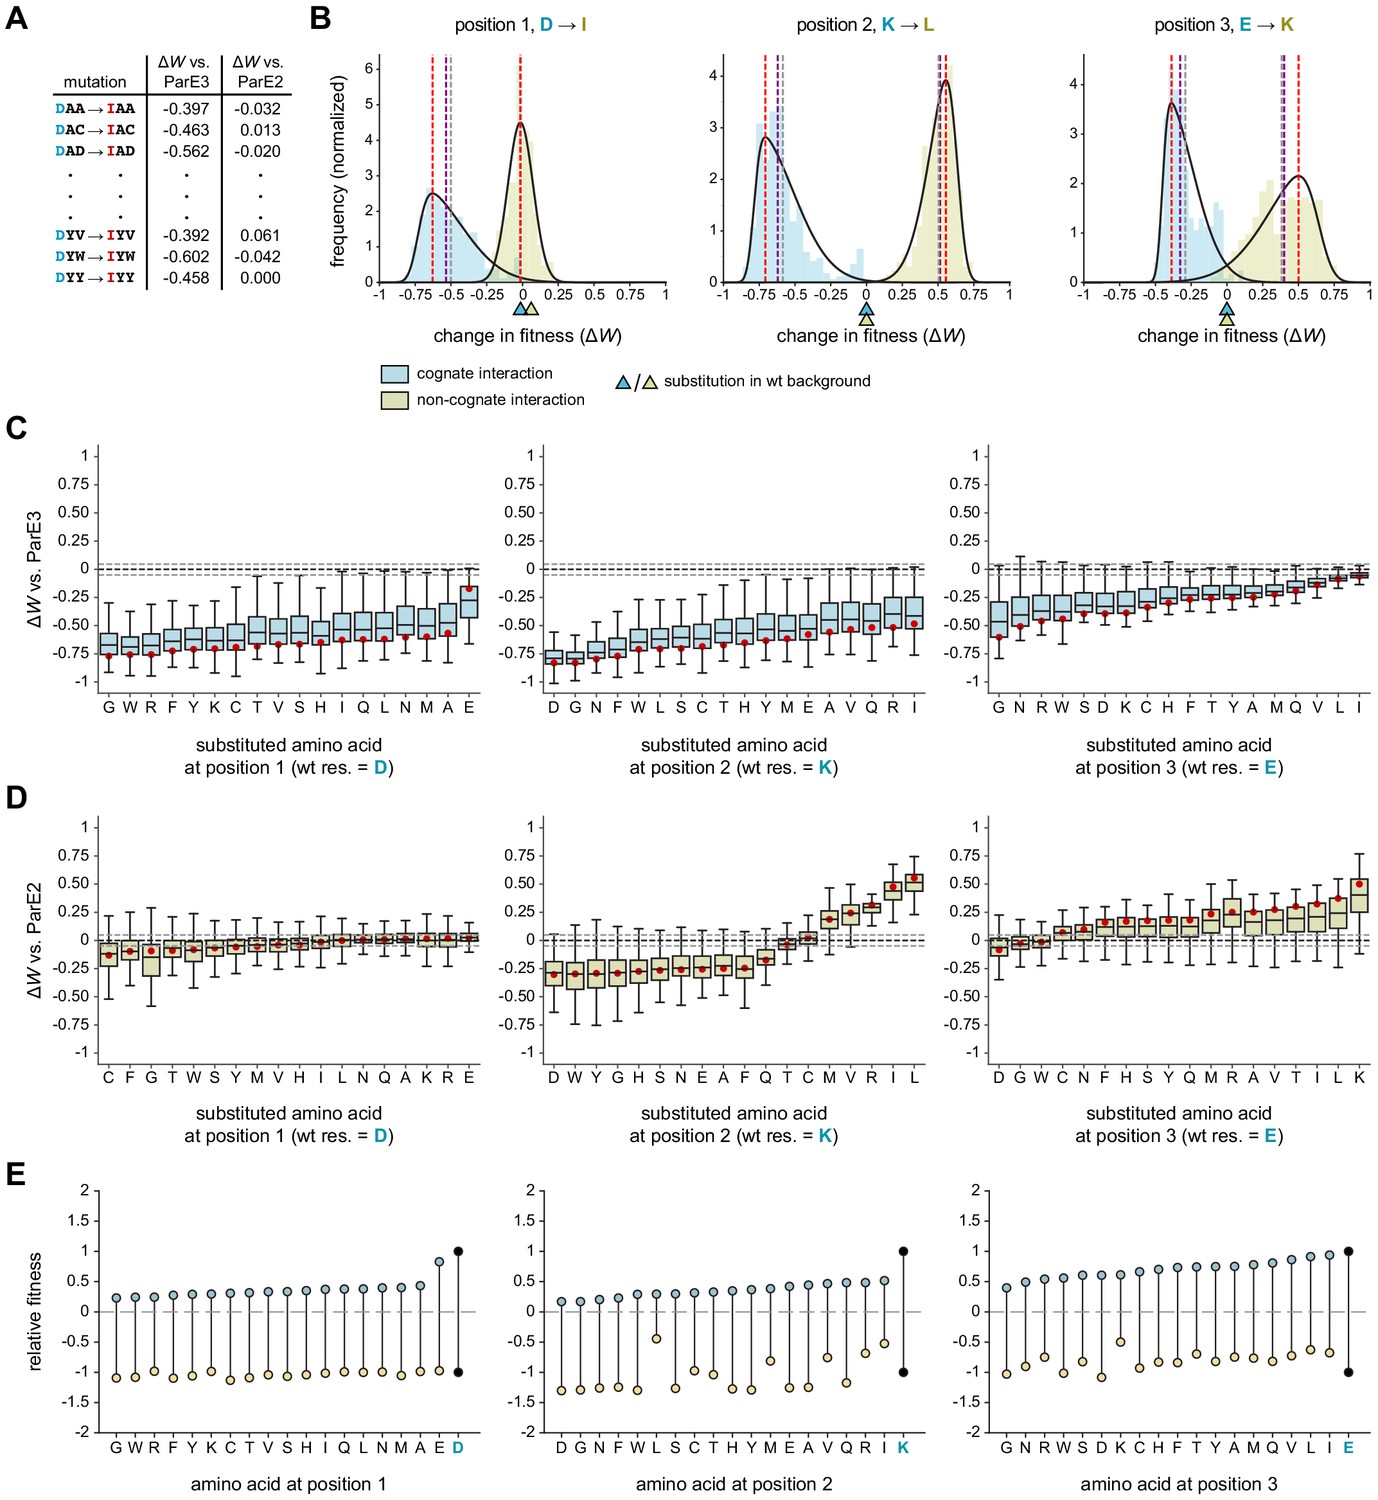
Systematic dissection of interface substitutions.
(A) Example illustrating how each substitution occurs in hundreds of contexts in the saturation mutagenesis library. (B) Distribution of fitness effects for the substitutions indicated (each replacing a specificity residue in ParD3 with the corresponding residue in ParD2) in all possible contexts, fitted to skew normal distributions. The effect on the cognate interaction is shown in blue, and the effect on the non-cognate interaction is shown in gold. Mean (gray), median (purple), and mode (red) are indicated. Triangles denote the effect of each substitution in the wild-type background (DKE). (C–D) Box plots showing the distribution of fitness effects for each substitution. For each substitution, the effects on fitness against ParE3 (C, blue) and ParE2 (D, gold) are shown. The mode of the fitted skew normal distribution is indicated in red. Dashed lines represent the threshold for a mode not expected by chance (<5% FDR based on 1000 permutation tests). Outliers (1.5 * IQR) are hidden for clarity but were included in all quantitative analyses. (E) Diagram illustrating how each substitution affects fitness for both ParE3 and ParE2. Starting fitness of the wild-type antitoxin is arbitrarily set to W = 1 for ParE3 and W = −1 for ParE2 (black dots). Blue and gold points represent shifts in fitness for variants when tested against ParE3 and ParE2, respectively, based on the mode effect size measured in (C) and (D).
Figure 4—figure supplement 1
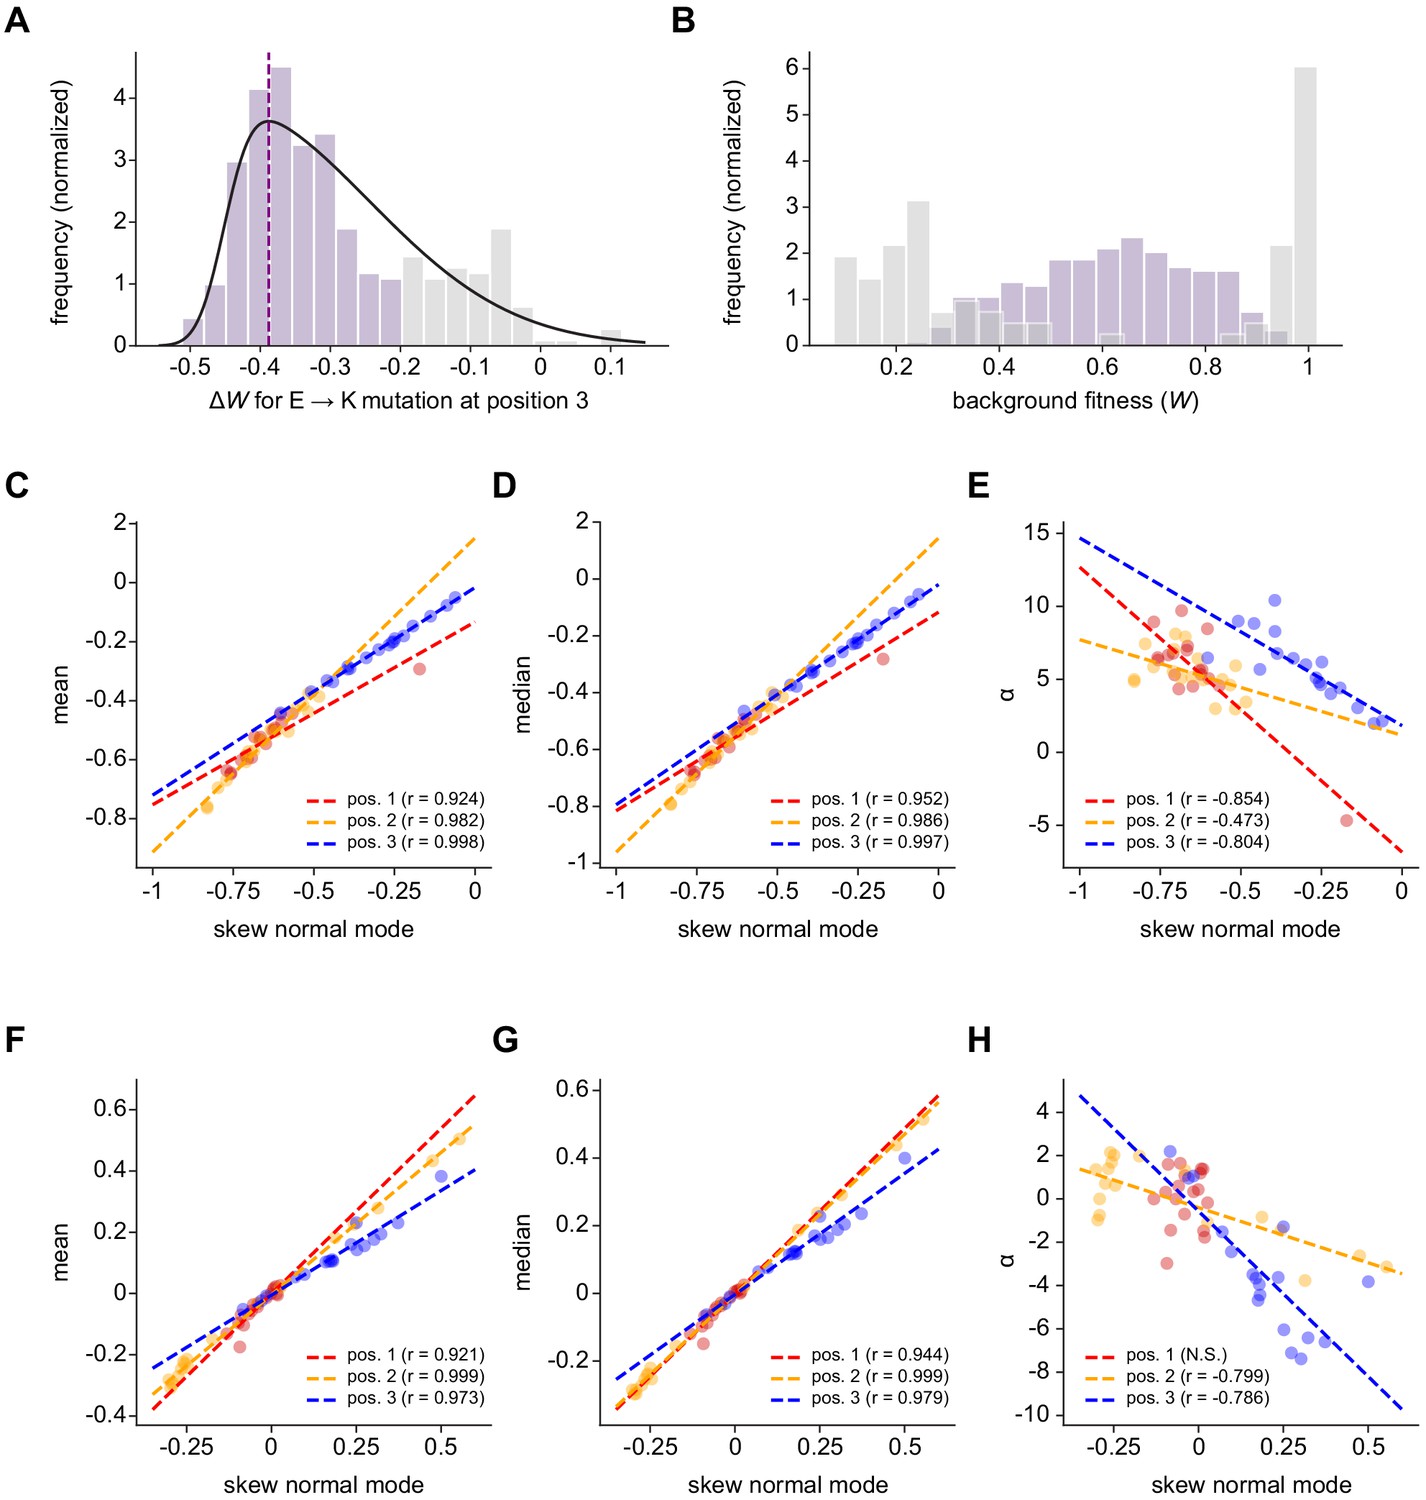
Characterizing the distribution of fitness effects for every amino acid substitution in the ParD3 library.
(A–B) Distribution of fitness effects (∆W) versus. ParE3 for an example substitution type, E → K at library position 3 (A). Fit to a skew normal distribution is plotted in black; dashed purple line indicates the mode of the distribution. (B) Histograms showing the fitness of variants in which the substitution occurs (i.e., variants with E at position 3). In both (A) and (B), variants for which ∆WE → K ≥ -0.20 are shown in gray and ∆WE → K < -0.20 are shown in purple. (C–E) Comparison of the mode to other measurements of central tendency (C–D) and α, a measure of skewness (E). Each point summarizes the distribution of fitness effects versus. ParE3 for a given substitution type. Dashed lines are regression lines; Pearson r is indicated. (F–H) Same as C-E, but for ParE2.
Figure 4—figure supplement 2
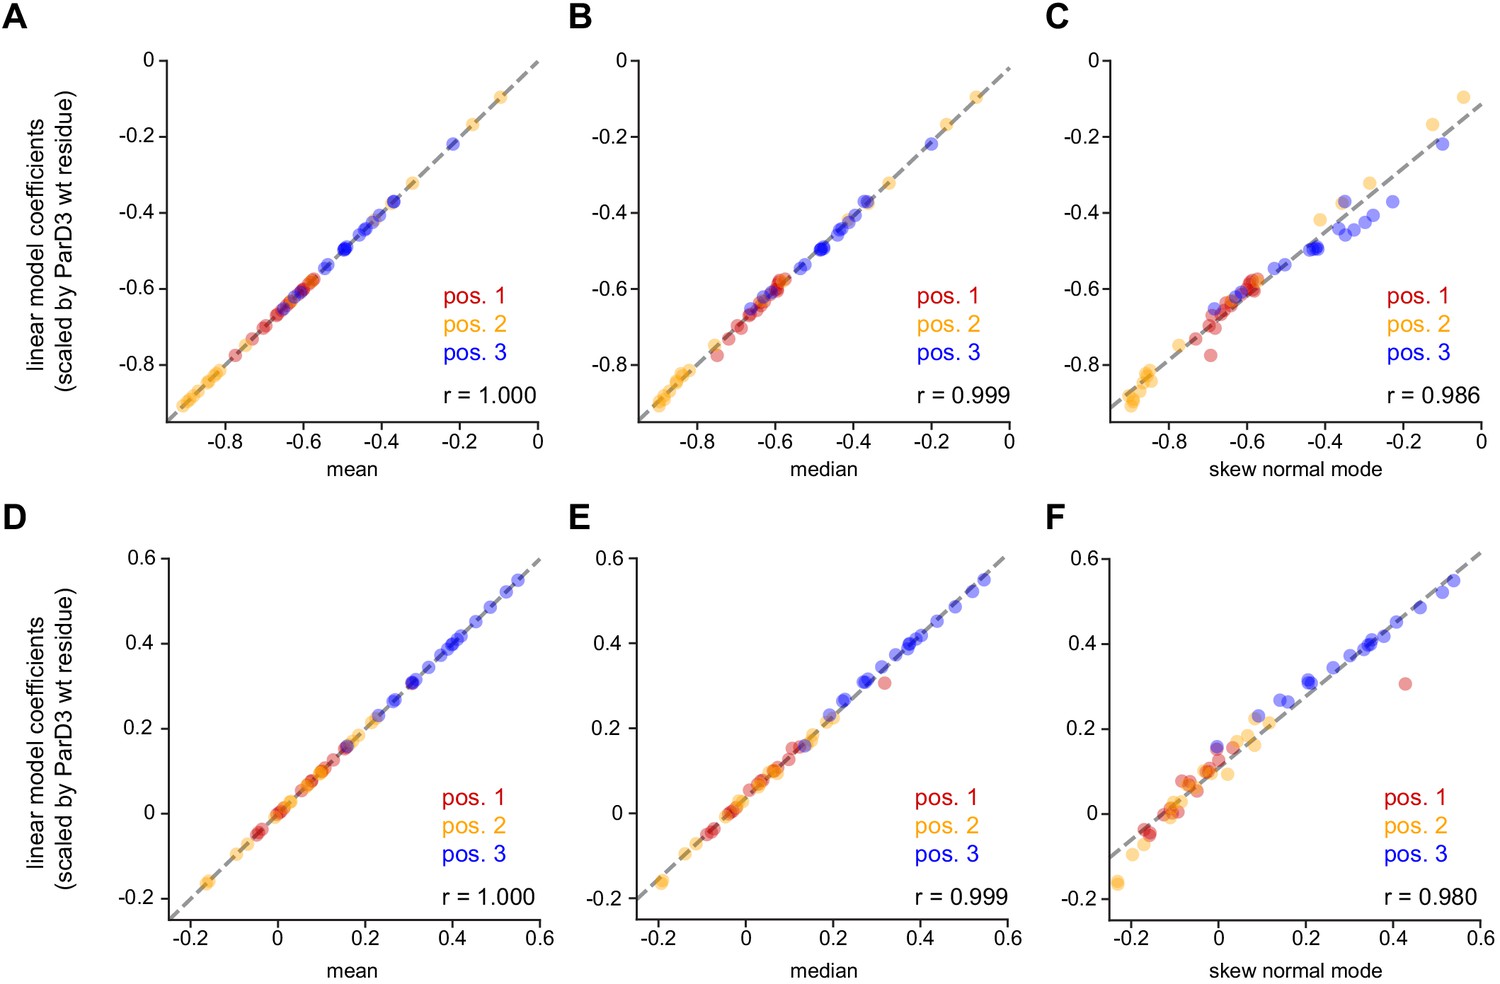
Comparison of linear model coefficients to parameters estimated from the distribution of fitness effects.
Dashed line is regression line; Pearson r is indicated.
Figure 4—figure supplement 3
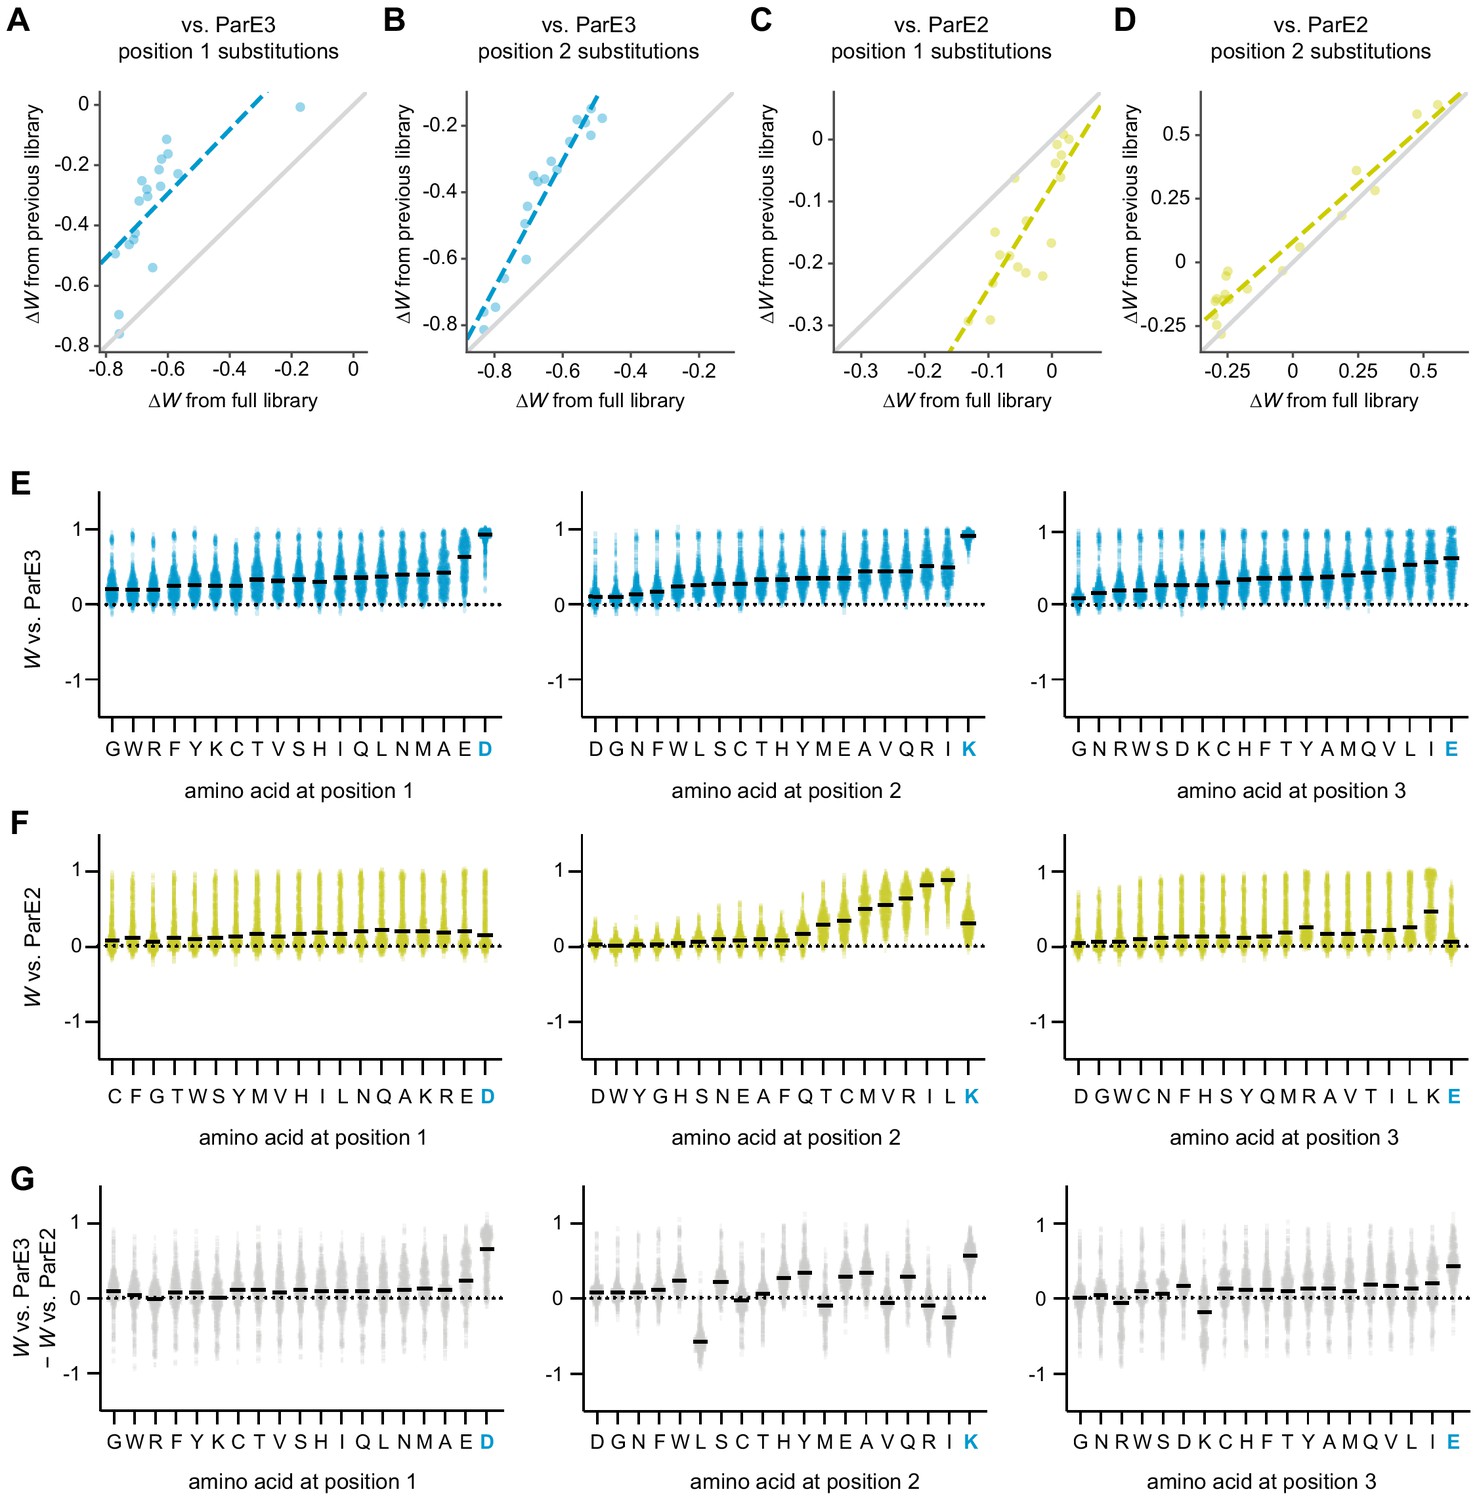
Library estimates of residue fitness and optimality.
(A–B) Estimates of ∆W versus. ParE3 for all substitutions at position 1 (A) or 2 (B), calculated using the library from this work (x-axis) versus. the ~130 genetic contexts shared with previous work from Aakre et al. (y-axis). The dashed line is the line of best fit. The y = x line is plotted in gray. (C–D) Same as in (A–B), but for ParE2. (E–F) Fitness distributions for variants with the amino acid indicated at the position indicated versus. ParE3 (E) or ParE2 (F). The order of amino acids matches Figure 4E. The median is indicated by a horizontal line. (G) Distributions of fitness versus. ParE3 – fitness versus. ParE2, for variants with the amino acid indicated at the position indicated.
Figure 5 with 1 supplement

Comparing the interfaces of paralogous toxin-antitoxin complexes.
(A) The interface between ParD3 and ParE3 (PDB: 5CEG). Top inset, library positions 1 and 2, with neighboring residues. Bottom inset, library position 3. Salt bridges are indicated by dashed lines. (B) Same as in (A), illustrating the corresponding regions of ParD2-ParE2 (PDB: 6X0A).
Figure 5—figure supplement 1
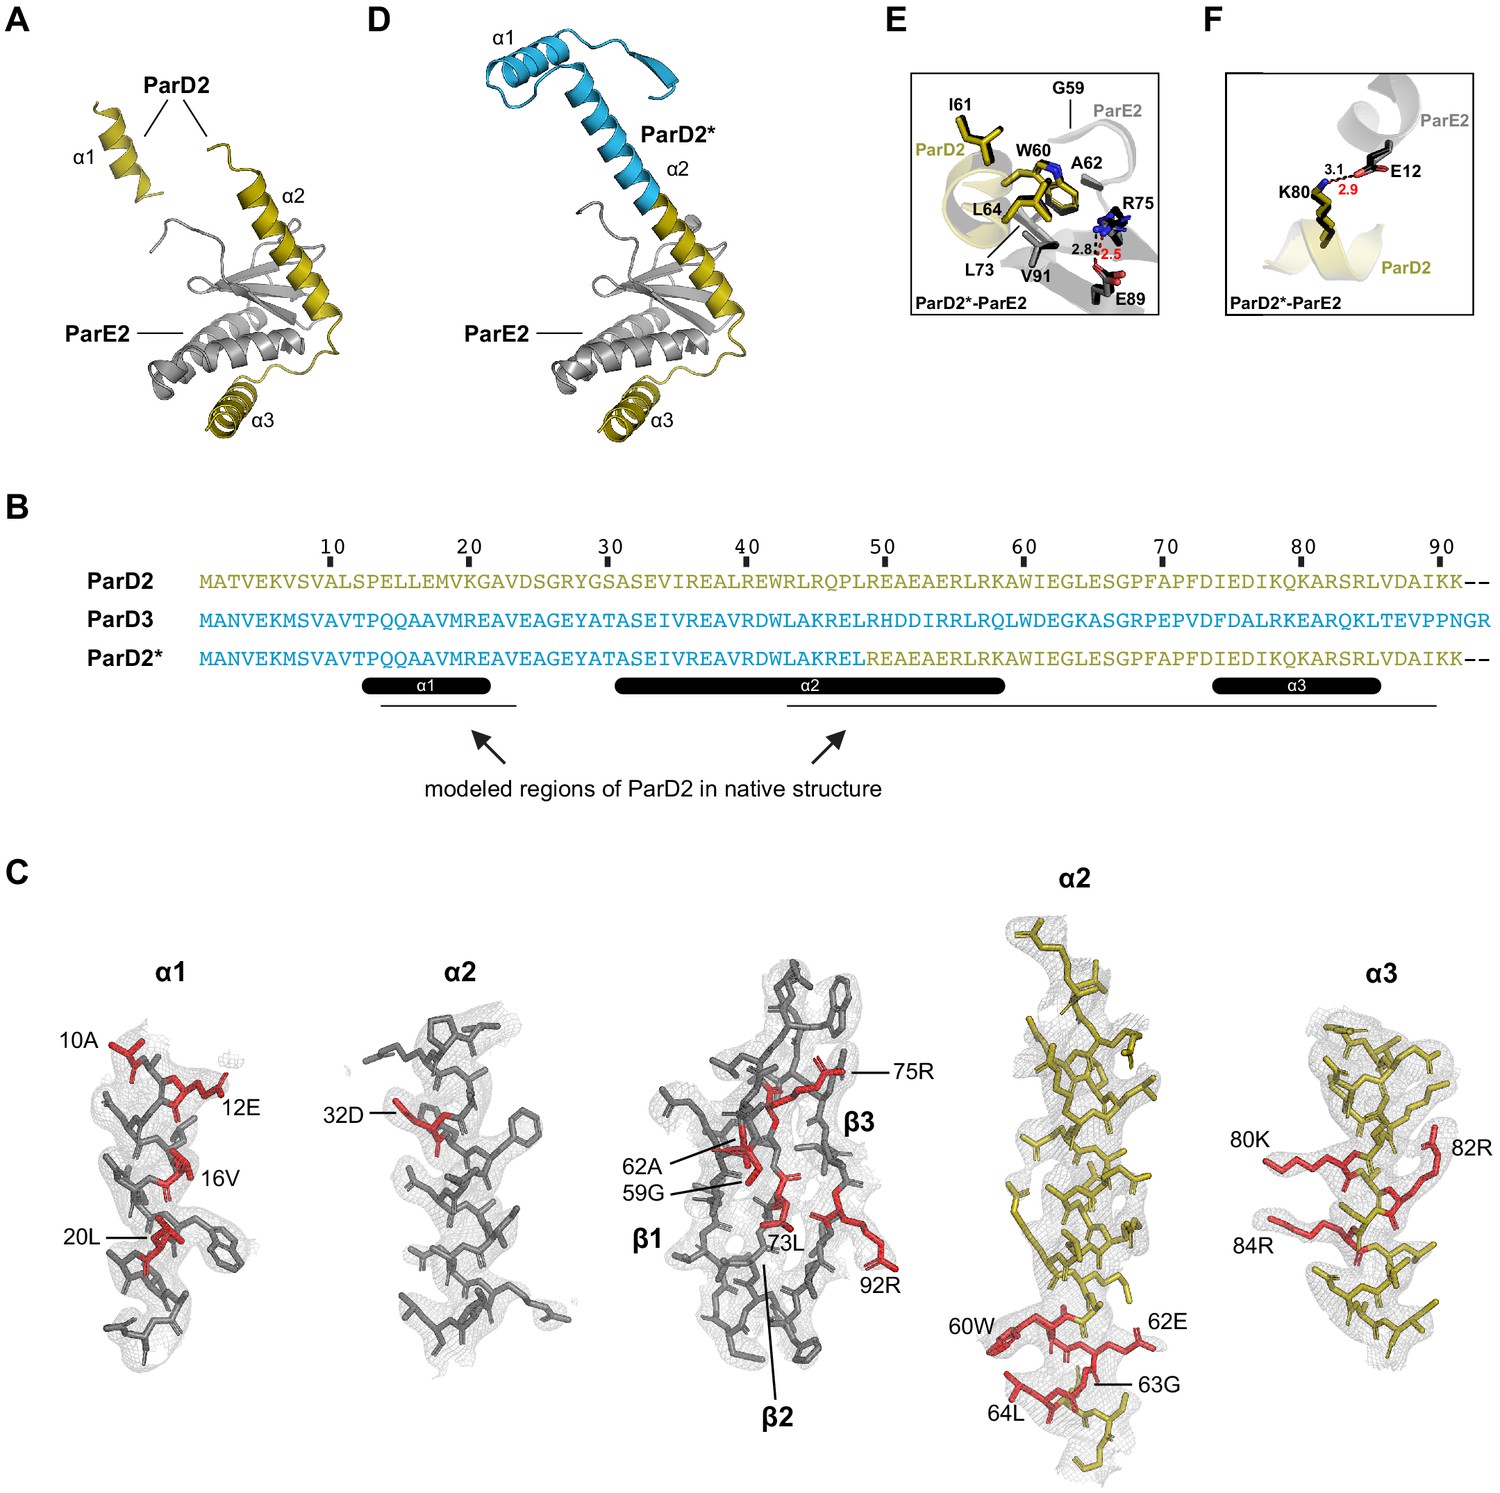
Crystal structures of the ParD2-ParE2 interface.
(A) Best model for the wild-type ParD2-ParE2 co-crystal structure. Model includes ParD2 residues 12–25 and 43–89. Also see Source data 5–6. (B) Alignment of ParD2, ParD3, and chimeric ParD2*. (C) Model of wild-type ParD2-ParE2 with an overlay of corresponding electron density. ParE2 is gray; ParD2 is gold; specificity-determining residues (see Figure 1C and F) are indicated in red. (D) Solved structure of chimeric ParD2*-ParE2. (E–F) Comparison of the key interfacial regions between the ParD2-ParE2 (gold and gray) and ParD2*-ParE2 (black) structures. Length of salt bridges is indicated for wild-type structure (black) and chimeric structure (red).
Additional files
-
Source data 1
ParE protein tree.
- https://cdn.elifesciences.org/articles/60924/elife-60924-data1-v2.zip
-
Source data 2
ParE protein alignment.
- https://cdn.elifesciences.org/articles/60924/elife-60924-data2-v2.zip
-
Source data 3
Species tree.
- https://cdn.elifesciences.org/articles/60924/elife-60924-data3-v2.zip
-
Source data 4
Species alignment.
- https://cdn.elifesciences.org/articles/60924/elife-60924-data4-v2.zip
-
Source data 5
ParD2-ParE2 model.
- https://cdn.elifesciences.org/articles/60924/elife-60924-data5-v2.zip
-
Source data 6
ParD2-ParE2 electron density.
- https://cdn.elifesciences.org/articles/60924/elife-60924-data6-v2.zip
-
Supplementary file 1
Tables S1-S3.
Table S1. Crystallographic data and refinement statistics Table S2. Plasmids created in this study Table S3. Oligonucleotides used in this study
- https://cdn.elifesciences.org/articles/60924/elife-60924-supp1-v2.docx
-
Transparent reporting form
- https://cdn.elifesciences.org/articles/60924/elife-60924-transrepform-v2.pdf
Download links
A two-part list of links to download the article, or parts of the article, in various formats.
Downloads (link to download the article as PDF)
Open citations (links to open the citations from this article in various online reference manager services)
Cite this article (links to download the citations from this article in formats compatible with various reference manager tools)
Uncovering the basis of protein-protein interaction specificity with a combinatorially complete library
eLife 9:e60924.
https://doi.org/10.7554/eLife.60924


