Reprogramming of bone marrow myeloid progenitor cells in patients with severe coronary artery disease
- Department of Internal Medicine and Radboud Institute for Molecular Life Science (RIMLS), Radboud University Medical Center, Netherlands
- Department of Cardiology, Canisius Wilhelmina Hospital, Netherlands
- Quantitative Systems Biology, Life & Medical Sciences Institute, University of Bonn, Single Cell Genomics and Epigenomics Unit at the German Center for Neurodegenerative Diseases and the University of Bonn, Germany
- Department of Cardiology, Radboud University Medical Center, Netherlands
- Department of Laboratory Medicine – Laboratory for Haematology, Radboud University Medical Center, Netherlands
- Department of Radiology and Nuclear Medicine, Radboud University Medical Center, Netherlands
- Department of Computational Biology for Individualised Infection Medicine, Centre for Individualised Infection Medicine (CiiM) & TWINCORE, joint ventures between the Helmholtz-Centre for Infection Research (HZI) and the Hannover Medical School (MHH), Germany
- Department of Haematology, Radboud University Medical Center, Netherlands
- Department of Medical Genetics, Iuliu Hatieganu University of Medicine and Pharmacy, Romania
- Department for Genomics & Immunoregulation, Life and Medical Sciences Institute (LIMES), University of Bonn, Germany
Figures
Figure 1
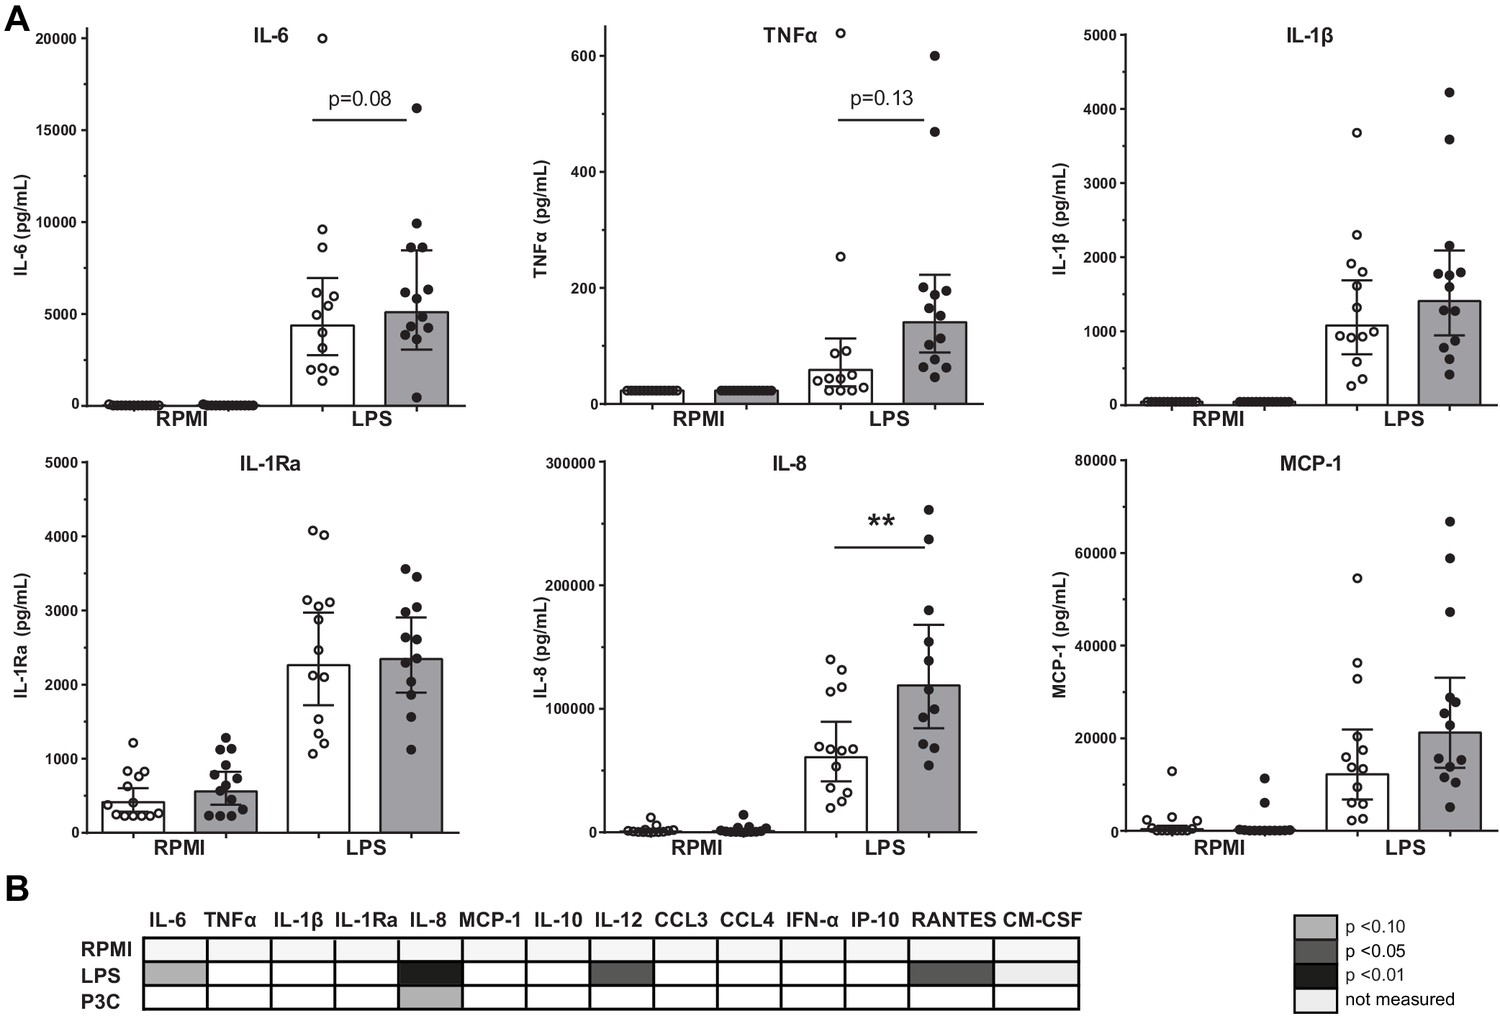
Cytokine production capacity of circulating PBMCs.
(A) Cytokine production capacity of circulating PBMCs after LPS stimulation in control individuals (white bars, n = 13) and individuals with CAD (gray bars, n = 13). Geometric mean with 95% CI. (B) Table of cytokine/chemokine production (x-axis) after stimulation with LPS or P3C (y-axis) of PBMCs showing statistical differences between groups. The p-values are corrected for age and BMI with ANCOVA. Outliers were removed with an SD of >2.5 of Z-scores. * indicates p<0.05, **: p<0.01.
Figure 2 with 1 supplement

Progenitor cell populations in the bone marrow compartment (A–G) and in the circulation (H and I).
Control individuals (white bars, n = 13) and individuals with CAD (gray bars, n = 13). HSC and MPP cell populations were combined as the CD90 expression marker was not available for n = 6 in each study group. Geometric mean with 95% CI. The p-values are corrected for age and BMI with ANCOVA. * indicates p<0.05, **: p<0.01. In top-down order: HSC indicates hematopoietic stem cell, MPP: multipotent progenitor, CLP: common lymphoid progenitor, CMP: common myeloid progenitor, GMP: granulocyte-macrophage progenitor, MEP: megakaryocyte erythrocyte progenitor.
Figure 2—figure supplement 1
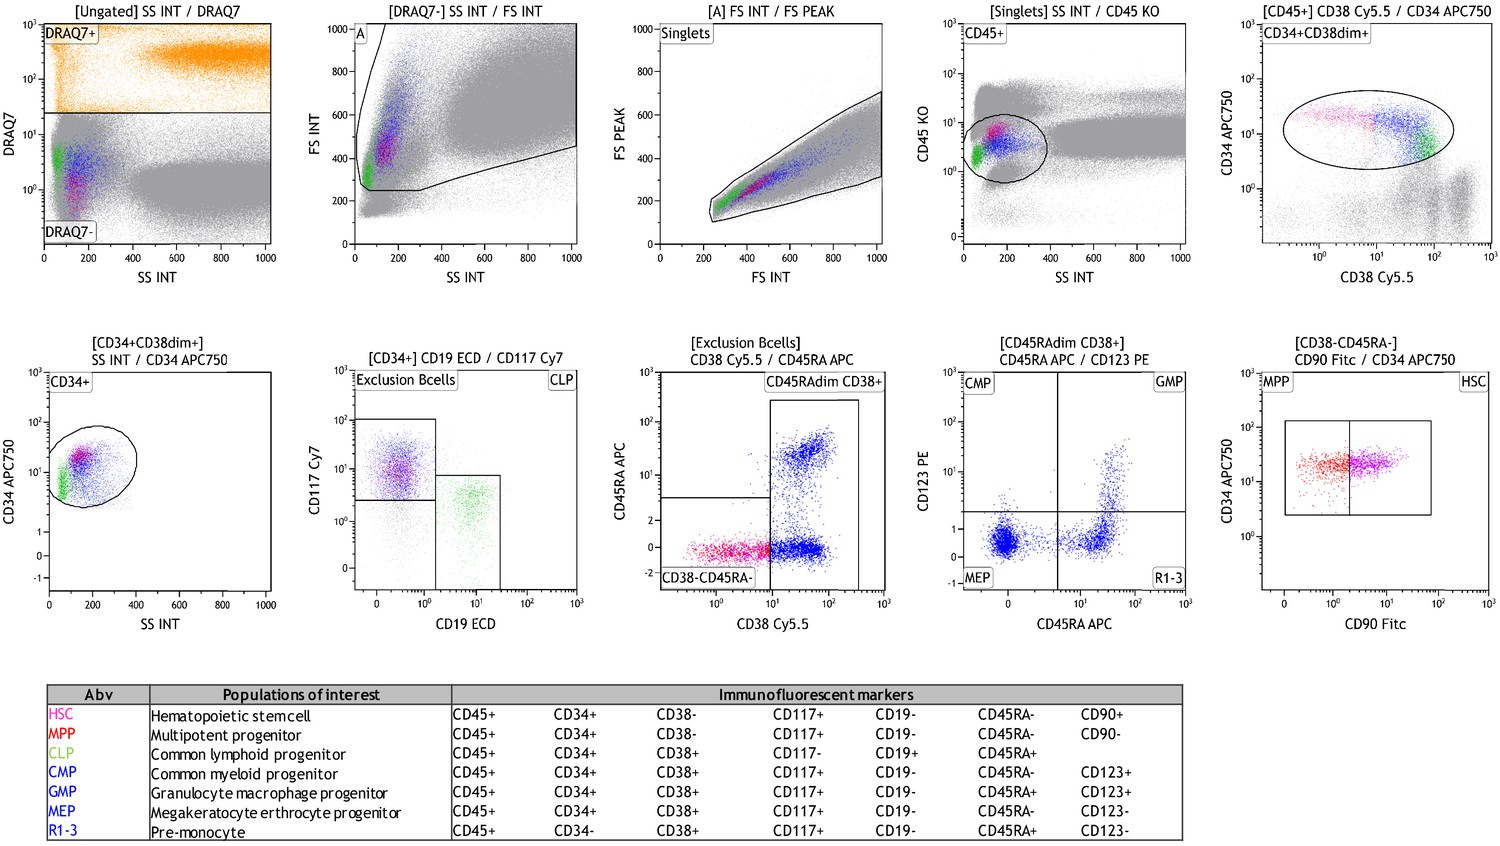
Gating strategy of hematopoietic stem and progenitor cells in the bone marrow.
HSPCs were defined as CD45+CD34+CD38dim cells, after exclusion of dead cells and doublets. Next, the lymphoid lineage was excluded in CD19-CD117+ cells. In CD45RAdimCD38+ cells, CMP, GMP, MEP, and R1-3 progenitor populations were identified using CD123 and CD45RA expression, see Table for details. CD90 expression in CD38-CD45RA- cells determined MPP and HSC populations.
Figure 3
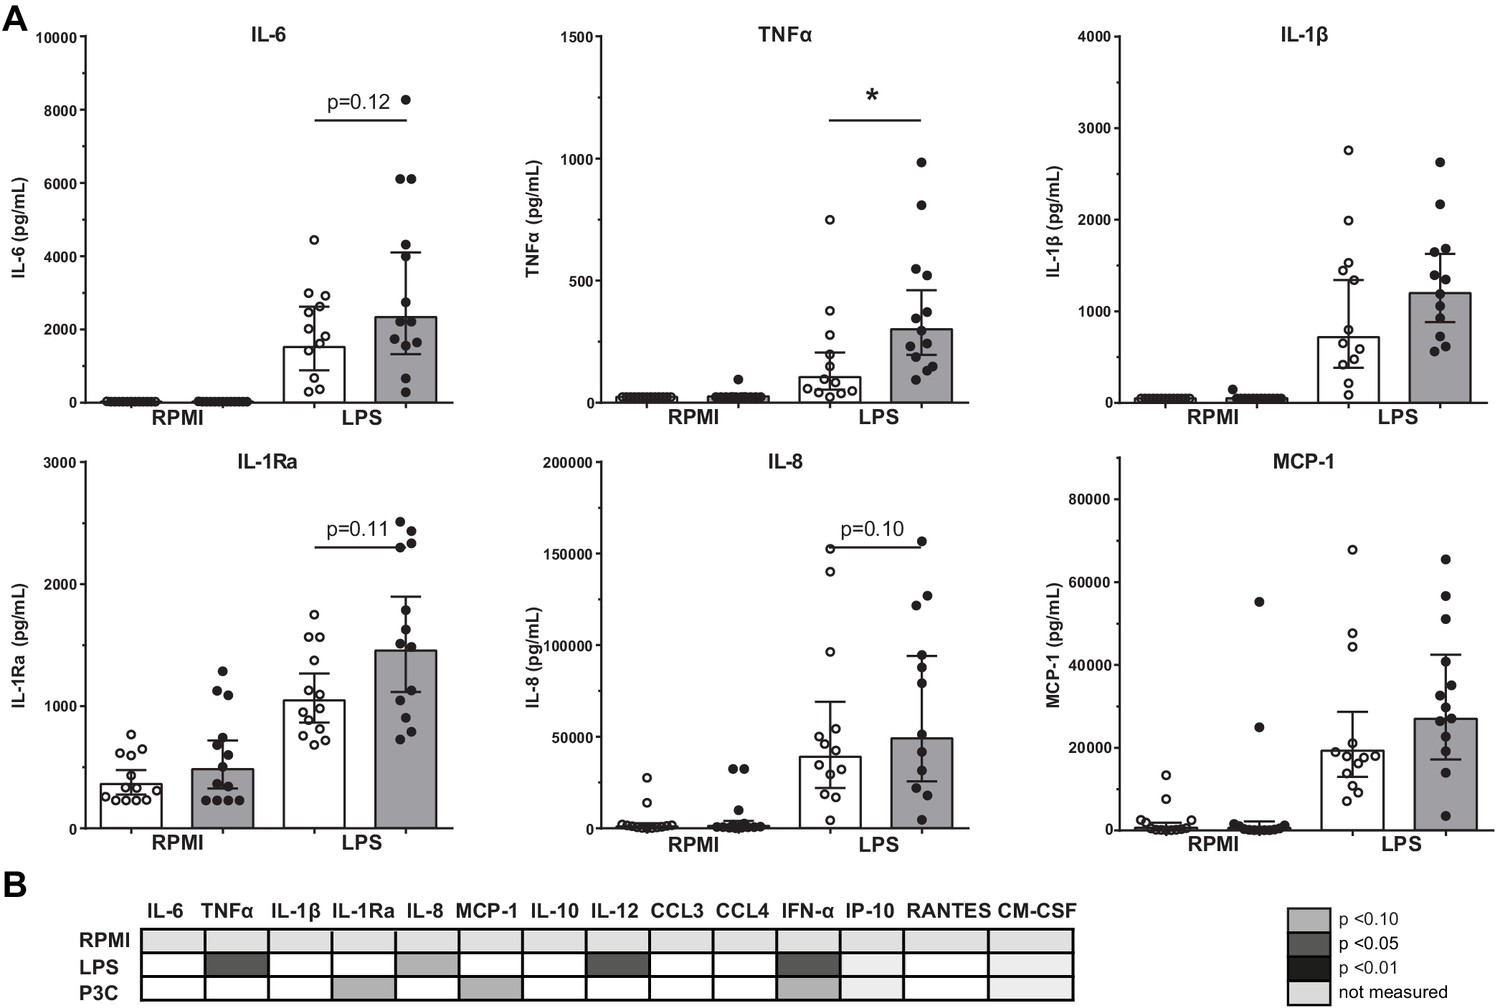
Cytokine production capacity of bone marrow MNCs.
(A) Cytokine production capacity of BM-MNCs after LPS stimulation in control individuals (white bars, n = 13) and individuals with CAD (gray bars, n = 13). Geometric mean with 95% CI. (B) Table of cytokine/chemokine production (x-axis) after stimulation with LPS or P3C (y-axis) of BM-MNCs showing statistical differences between groups. The p-values are corrected for age and BMI with ANCOVA. Outliers were removed with an SD of >2.5 of Z-scores. * indicates p<0.05, **: p<0.01.
Figure 4
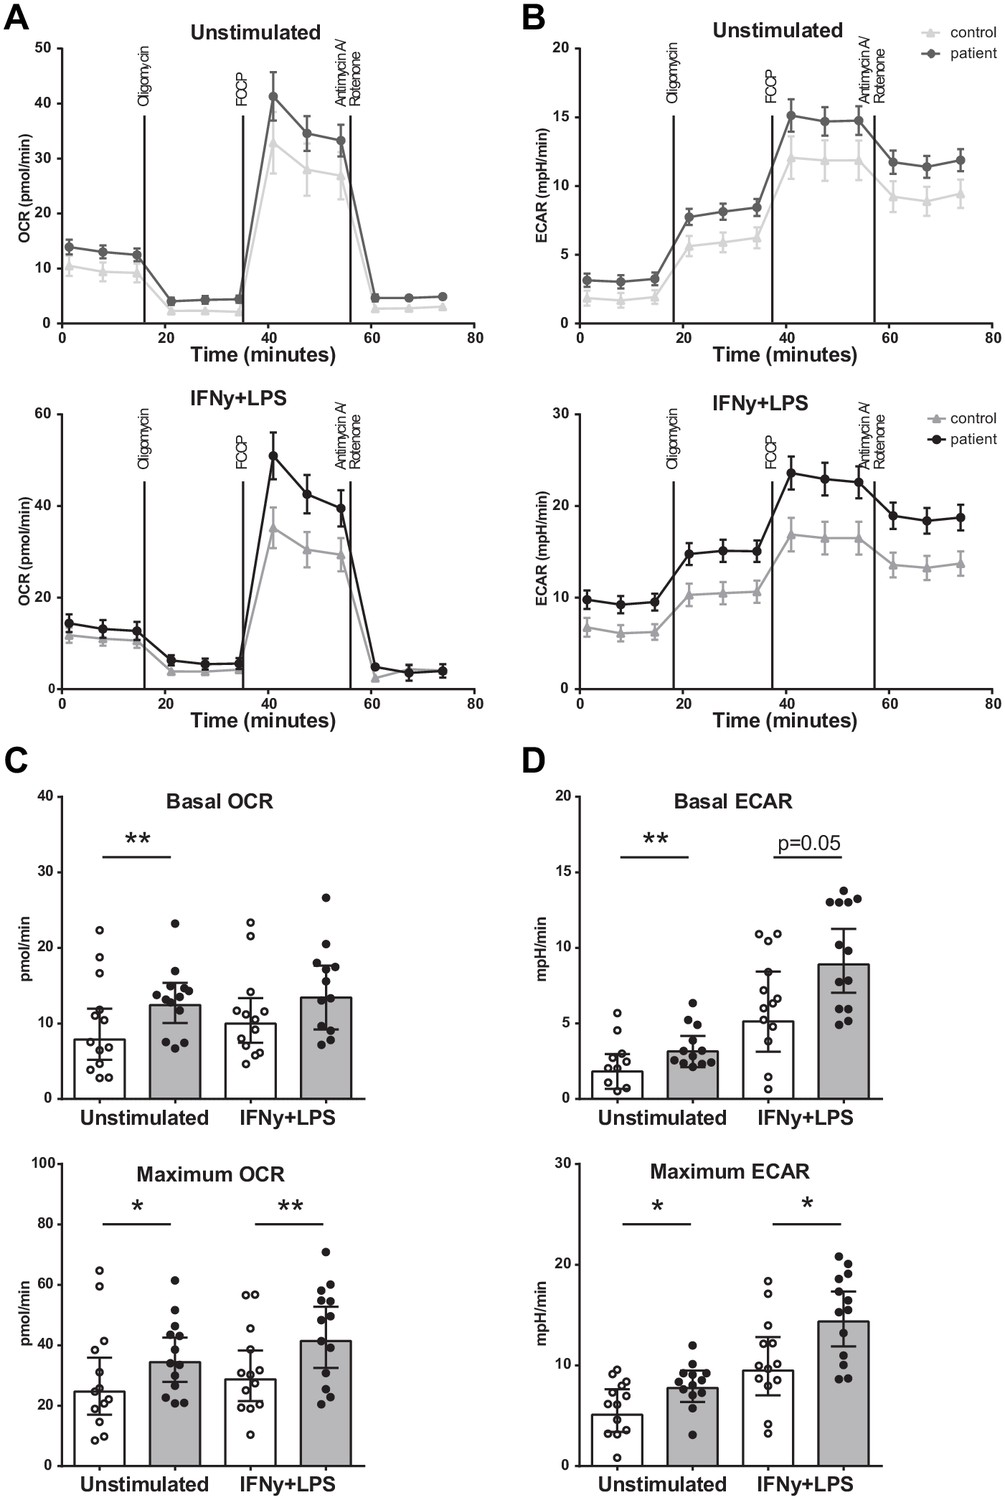
Metabolism of BM-MNCs assessed with Seahorse respirometry in unstimulated condition and 2 hours after IFN-γ+LPS stimulation.
(A, B) Oxygen consumption and extracellular acidification rates over time using treatment with Oligomycin, FCCP, and Rotenone/Antimycin A. (C, D) Bar graphs of control individuals (white bars, n = 13) and individuals with CAD (gray bars, n = 13). Geometric mean with 95% CI. The p-values are corrected for age and BMI with ANCOVA. * indicates p<0.05, **: p<0.01. IFN-γ+LPS: 2 hr IFN-γ and LPS stimulation.
Figure 5
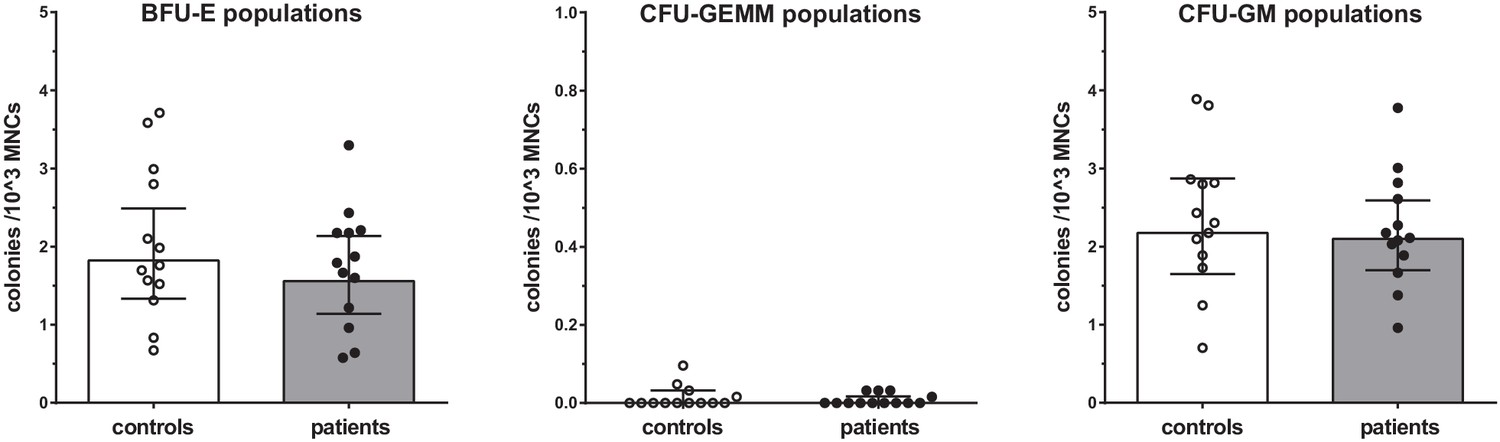
Proliferation capacity of bone marrow MNCs.
Counted colonies per 103 cultured BM-MNCs of control individuals (white bars, n = 13) and individuals with CAD (gray bars, n = 13). Geometric mean with 95% CI. The p-values are corrected for age and BMI with ANCOVA. BFU-E indicates erythroid progenitor population, CFU-GEMM: myeloid progenitor population, CFU-GM: granulocyte-macrophage progenitor population.
Figure 6 with 3 supplements
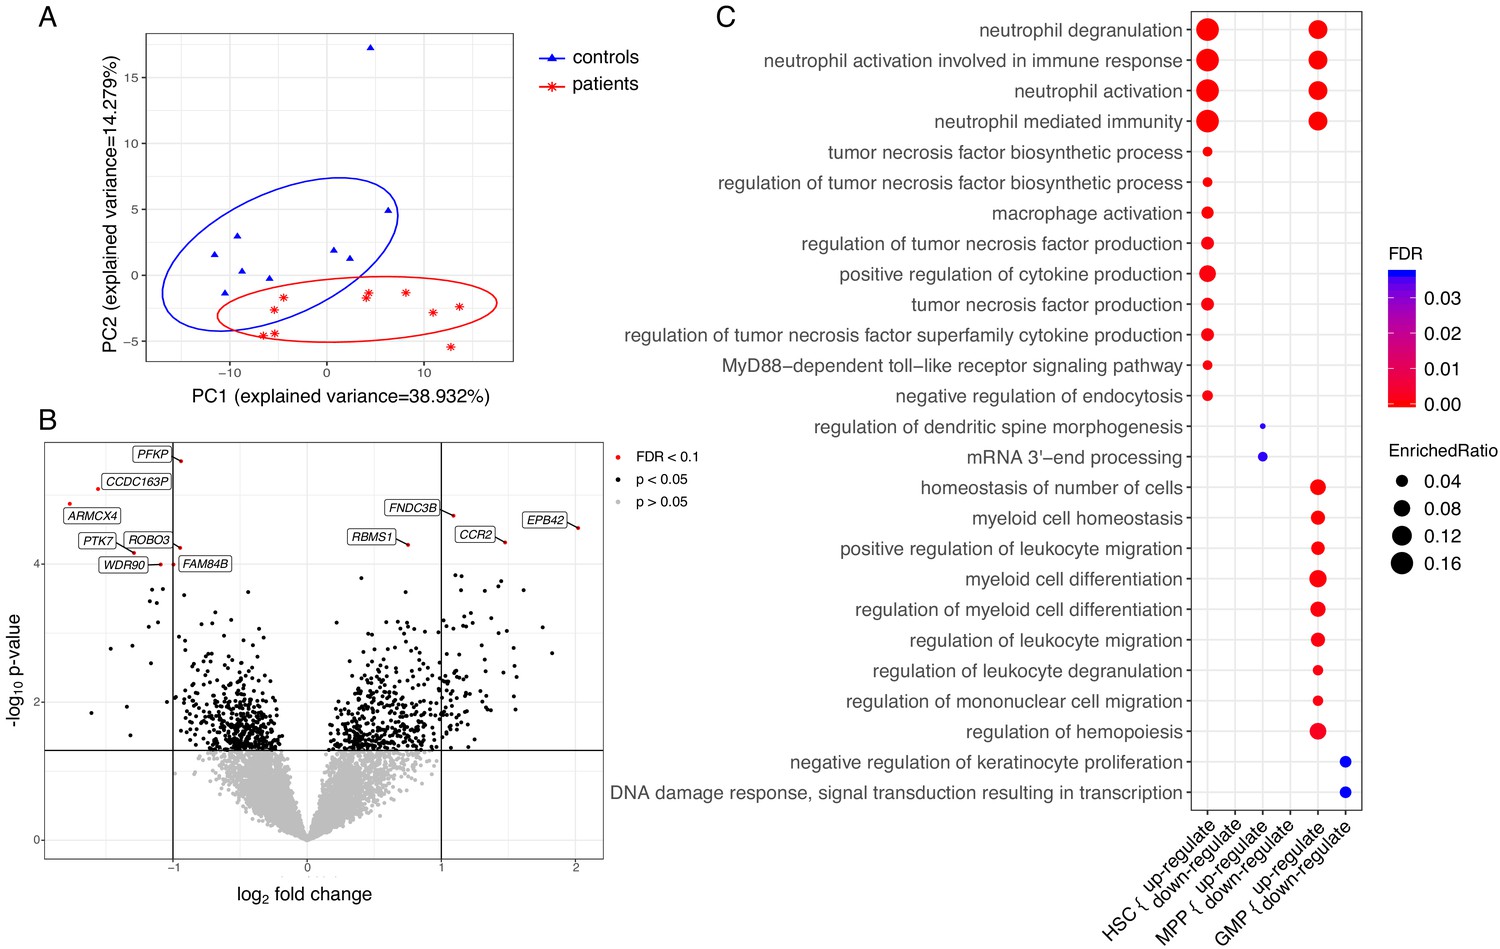
Transcriptome analyses of HSC, MPP, and GMP populations.
Control individuals (n = 10) versus individuals with CAD (n = 10) for each cell population. (A) Principle component analysis (PCA) based on differentially expressed (DE) genes of the HSC population; (B) Volcano plot showing differential expressed genes between patients with CAD and individuals without atherosclerosis, controlled for age, in a combined analysis of HSC, MPP, and GMP population. Genes with an FDR <0.1 are named; (C) Gene ontology enrichment analysis of DE genes from HSCs, MPPs, and GMPs, depicting the FDR and enrichment ratio.
-
Figure 6—source data 1
Contains source data for Figure 6B, and Figure 6—figure supplements 1B, 2, 3.
Table of differential expressed genes between patients with CAD and individualswithout atherosclerosis, controlled for age, in a combined/separated analysis of HSCs, MPPs, and GMPs population.
- https://cdn.elifesciences.org/articles/60939/elife-60939-fig6-data1-v2.xlsx
-
Figure 6—source data 2
Contains source data for Figure 6C.
Table of enrichment analysis of gene ontology terms and involved DE genes of HSCs, MPPs, and GMPs population.
- https://cdn.elifesciences.org/articles/60939/elife-60939-fig6-data2-v2.xlsx
Figure 6—figure supplement 1
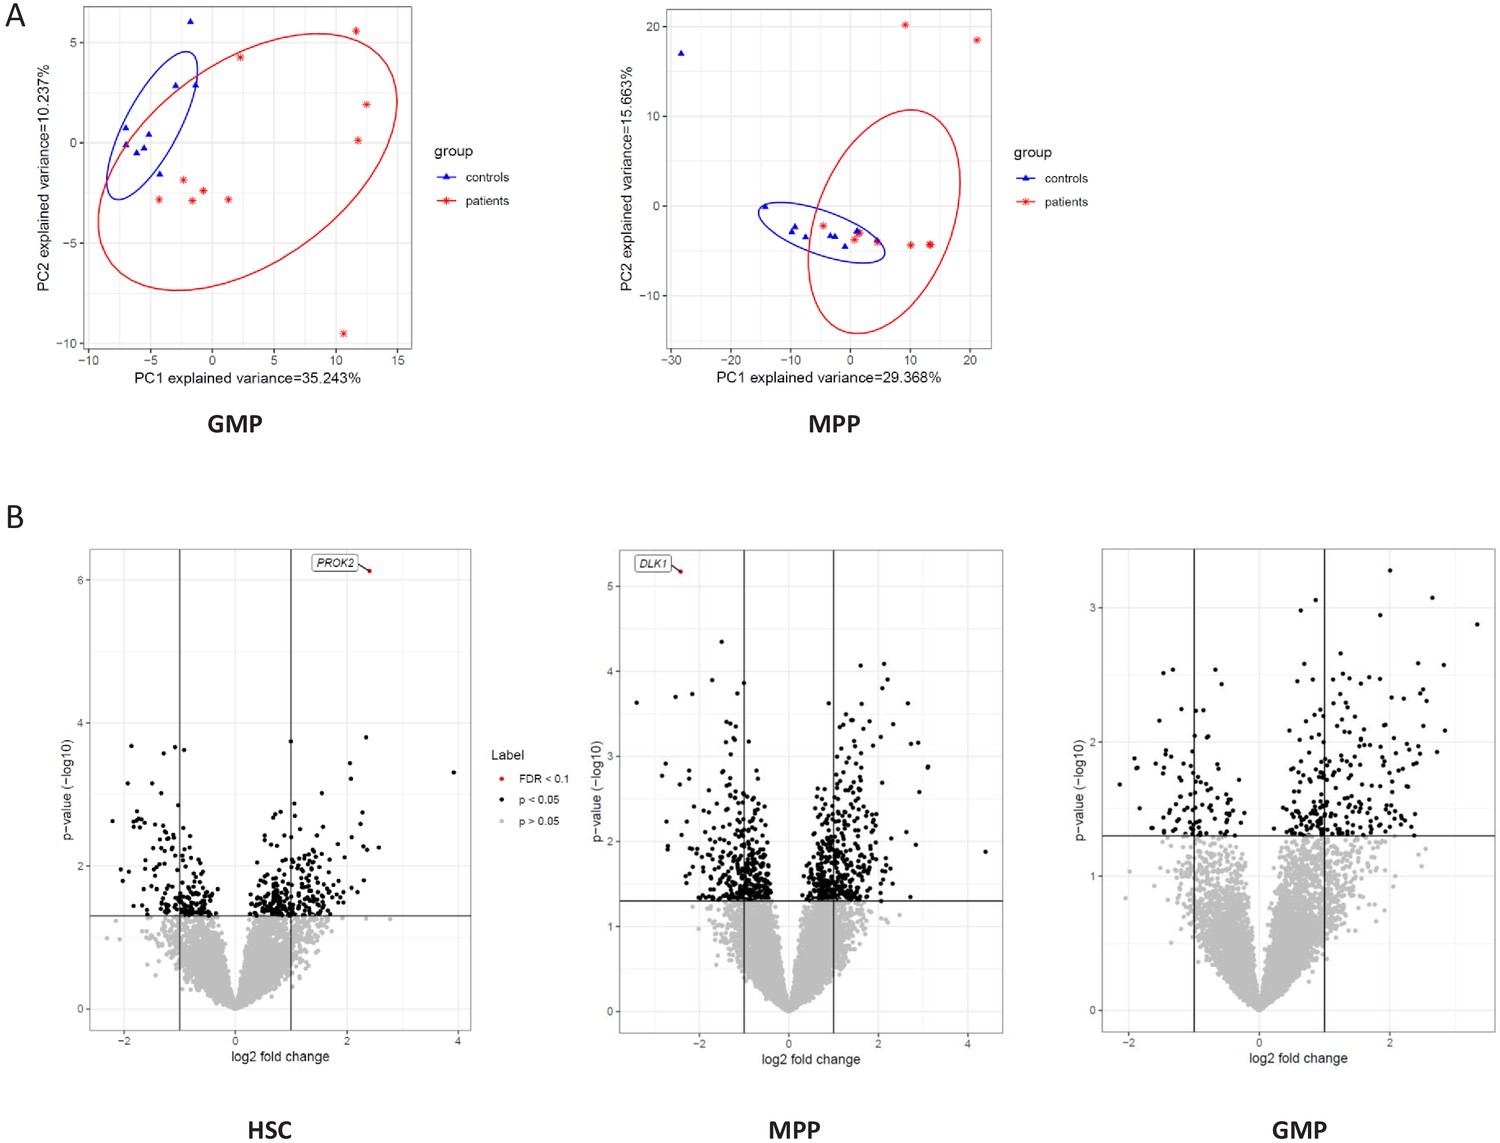
Transcriptome of HSC, MPP, and GMP populations.
(A) PCA analysis based on DE genes of the GMP and MPP cell population; (B) Volcano plot showing differential expressed genes between CAD patients and controls, controlled for age, in the HSC, MPP, and GMP cell populations. Genes with an FDR <0.1 are called out.
Figure 6—figure supplement 2
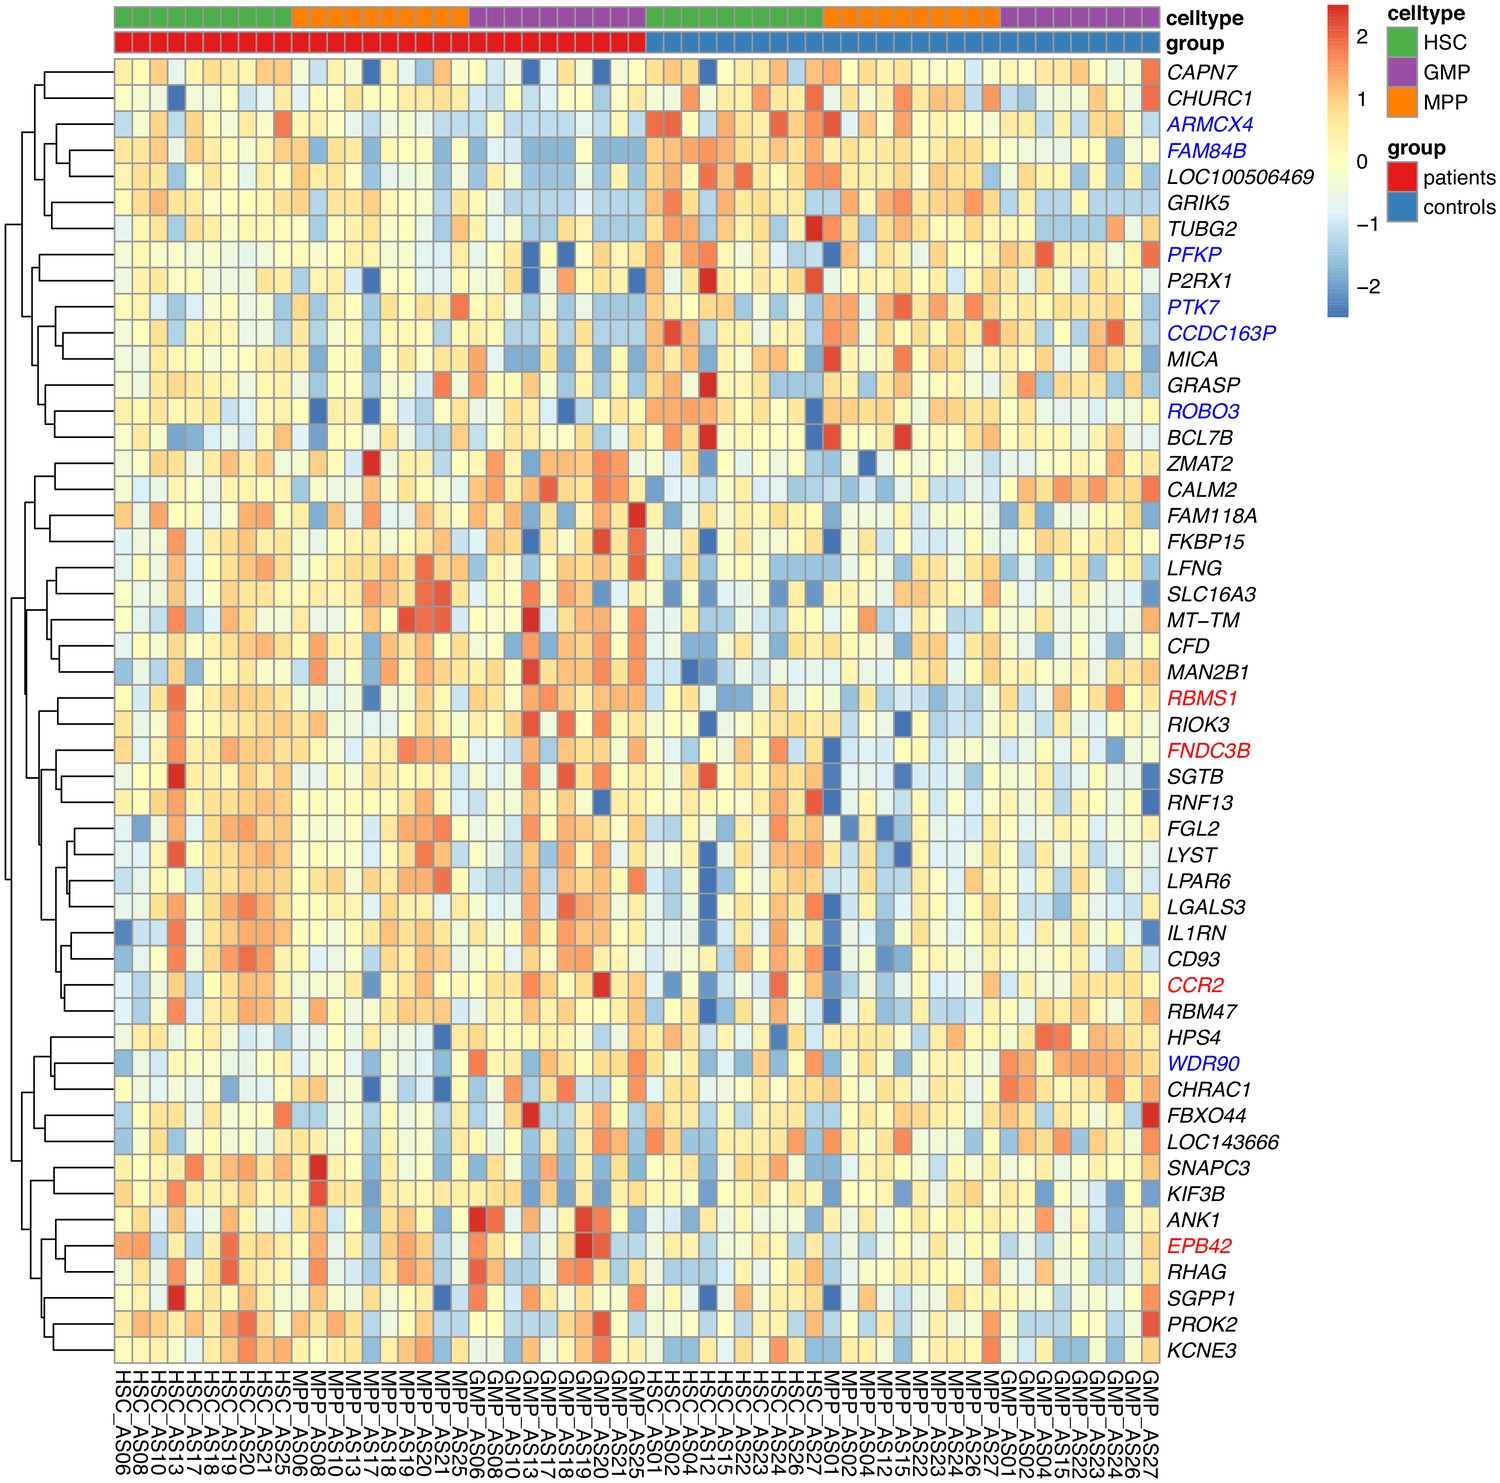
Combined heatmap showing the top 50 DE genes for the HSC, MPP, and GMP cell populations in the patients and the control subjects.
Genes with an FDR <0.1 are colored in red and blue for up- and down-regulated, respectively.
Figure 6—figure supplement 3

Separated heatmap showing the top 50 DE genes for each of the HSC, MPP, and GMP cell populations in the patients and the control subjects.
Genes with an FDR <0.1 are colored in red and blue for up- and down-regulated, respectively.
Figure 7 with 1 supplement
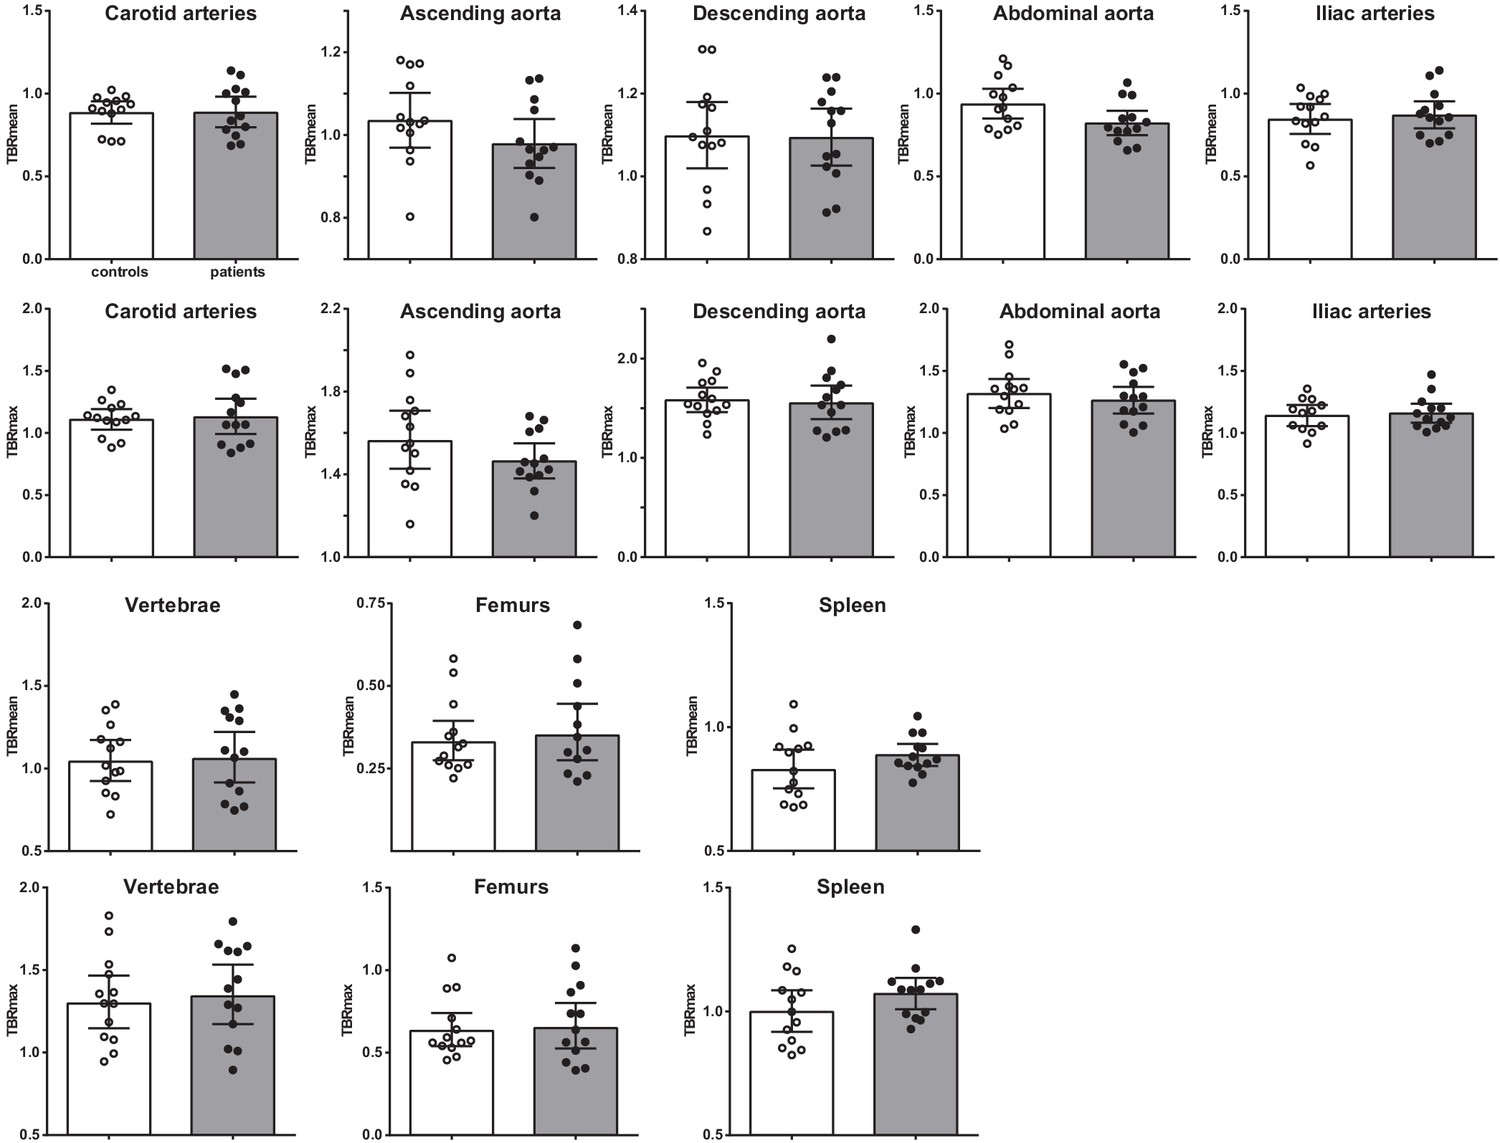
Vascular wall inflammation and hematopoietic tissue activation on [18F]FDG PET/CT scan.
Standard uptake value of each region in control individuals (white bars, n = 13) and individuals with CAD (gray bars, n = 13). Geometric mean with 95% CI. The p-values are corrected for age and BMI with ANCOVA.* indicates p<0.05, **: p<0.01. TBR: target SUV/mean blood pool SUV or mean liver SUV as background.
Figure 7—figure supplement 1
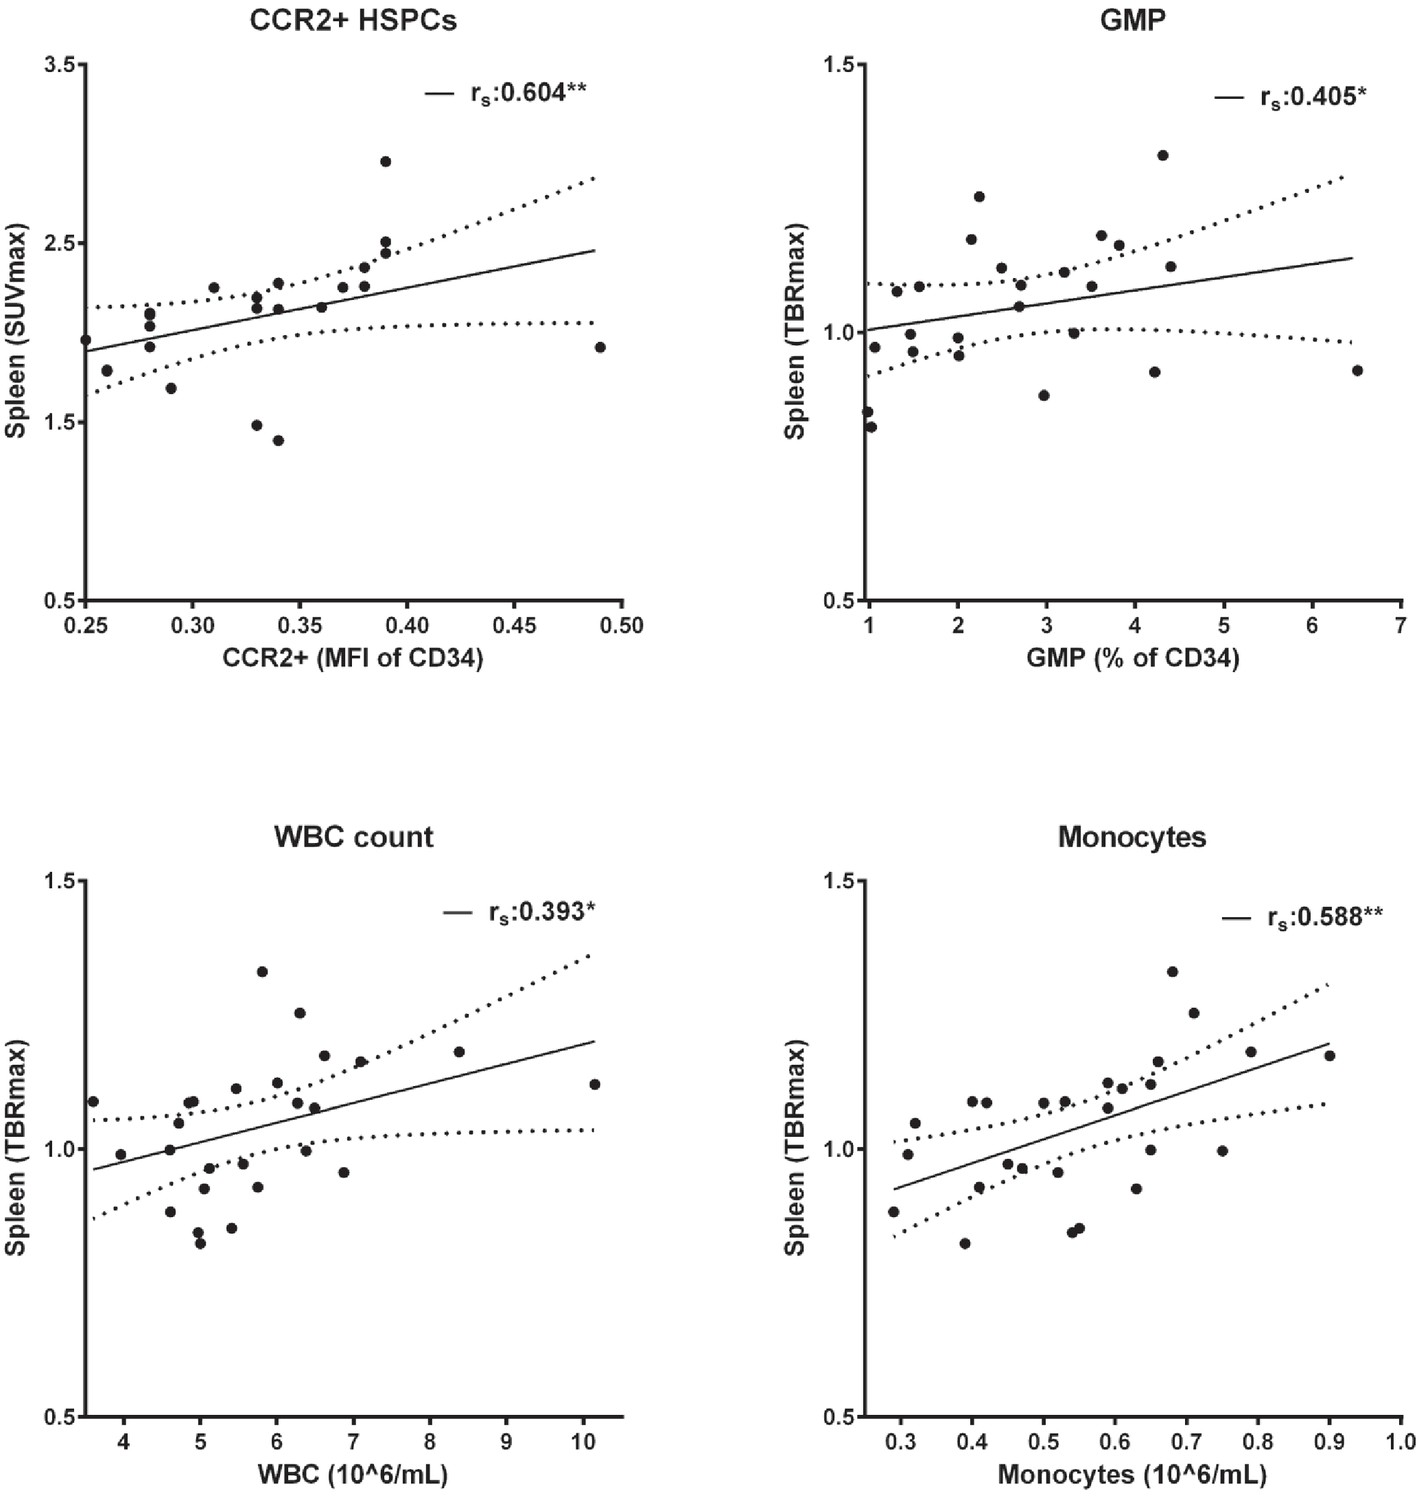
Splenic activity correlates with progenitor cells and circulating immune cells.
Linear regression with 95% CI (n = 26). Spearman correlation coefficient (rs). * indicates p<0.05, **: p<0.01. HSPCs: hematopoietic stem and progenitor cells, GMP: granulocyte macrophage progenitor cells, WBC: white blood cells.
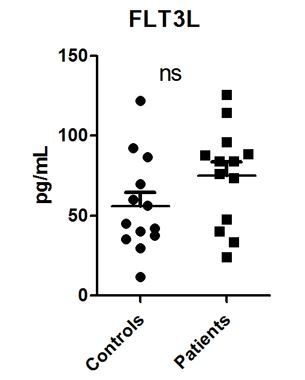
Author response image 1
Tables
Table 1
Group characteristics.
| Characteristics | Individuals with CAD (n = 13) | Individuals without atherosclerosis (n = 13) |
|---|---|---|
| Age (years) | 59.8 ± 9.7 | 52.2 ± 10.4 |
| Sex (% men, n) | 100 (13) | 100 (13) |
| BMI (kg/m2) | 27.8 ± 2.8 | 25.8 ± 2.5 |
| SBP (mm Hg) | 133 ± 15 | 126 ± 10 |
| DBP (mm Hg) | 90 ± 8* | 84 ± 6 |
| Hypertension (%, n) | 93 (12)** | 31 (4) |
| Current smoking (%, n) | 23 (3) | 31 (4) |
| Calcium score (HU) | 445 [213-781]** | 0 [0] |
| Total Plaque score (0–16)‡ | 14 [9-15]*** | 0 [0] |
| Lipid-lowering therapy (%, n) | 77 (10)*** | 8 (1) |
| Acetylsalicylic acid use (%, n) | 69 (9)*** | 0 (0) |
| ACE-inhibitor use (%, n) | 23 (3) | 8 (1) |
| β-blocker use (%, n) | 23 (3) | 8 (1) |
| Glucose (mmol/L) | 5.9 ± 0.8 | †5.7 ± 0.7 |
| Creatinine (µmol/L) | 89 ± 14 | 91 ± 16 |
| Tchol (mmol/L) | 4.51 ± 0.86** | 5.61 ± 0.61 |
| LDLc (mmol/L) | †2.52 ± 0.97** | 3.56 ± 0.64 |
| HDLc (mmol/L) | 1.25 ± 0.31 | 1.51 ± 0.34 |
| TG (mmol/L) | 1.98 ± 1.97 | 1.20 ± 0.38 |
| nHDLc (mmol/L) | 3.26 ± 1.06* | 4.11 ± 0.75 |
-
Data are reported as mean ± SD, as mean (number of participants), or as median [interquartile range] and compared with the appropriate statistical tests. ‡ TPS was calculated for participants with a calcium score of <400 HU (n = 6). † Data is missing for one participant. * indicates p<0.05, **: p<0.01, ***: p<0.001.
Table 2
Circulating immune cells and inflammatory markers in patients and controls.
| Cell types | Individuals with CAD | Individuals without atherosclerosis |
|---|---|---|
| WBC (106/mL) | †5.5 [4.9–6.0] | 5.4 [4.8–6.7] |
| Neutrophils (106/mL) | †3.2 [2.5–3.6] | 3.0 [2.6–4.0] |
| Lymphocytes (106/mL) | 1.7 [1.3–1.9] | 1.8 [1.5–2.5] |
| Monocytes (106/mL) | 0.53 [0.42–0.67] | 0.55 [0.45–0.66] |
| Monocytes (%) | 9.8 [8.0–11.5] | 9.3 [7.7–11.1] |
| Classical monocytes (%gated) | 78.1 [72.8–80.3] | 72.8 [70.1–85.5] |
| Intermediate monocytes (%gated) | 9.8 [8.2–14.2] | 10.1 [7.6–13.7] |
| Nonclassical monocytes (%gated) | 12.2 [9.3–14.3] | 13.1 [6.3–18.2] |
| CCR2+ monocytes (%gated) | 80.5 [73.0–82.3] | †77.6 [71.4–86.3] |
| CD11b expression monocytes (MFI) | 10490 [7814–12025]^ | ††6978 [6512–10041] |
| CD41+ monocytes (%gated) | 7.8 [6.5–9.7] | 8.7 [7.6–8.9] |
| Inflammatory markers | ||
| IL-1β (pg/mL) | †0.12 [0.09–0.17] | 0.12 [0.06–0.15] |
| IL-1Ra (pg/mL) | 271 [197-338] | 212 [165-253] |
| IL-6 (pg/mL) | 2.31 [1.37–2.86] | †1.61 [1.23–2.19] |
| IL-18 (pg/mL) | 162 [127-227] | 195 [144-236] |
| hsCRP (pg/mL) | 1.66 [0.83–4.87] | 1.37 [0.53–3.84] |
| E-selectin (ng/mL) | †11.74 [7.65–15.10]* | 8.45 [4.52–14.06] |
| VCAM-1 (ng/mL) | 773 [711-859]^ | 769 [643-844] |
| MMP2 (ng/mL) | 354 [264-434] | 341 [250-427] |
-
Circulating concentrations of cells and inflammatory markers in individuals with CAD (n = 13) compared to individuals without atherosclerosis (n = 13). Median with [IQR]. P-values are corrected for age and BMI with ANCOVA. Outliers were removed with an SD of >2.5 of Z-scores. † Data is missing for one participant. *p<0.05, **p<0.01. HSPCs: hematopoietic stem and progenitor cells.
Key resources table
| Reagent type (species) or resource | Designation | Source or reference | Identifiers | Additional information |
|---|---|---|---|---|
| Biological sample (Homo sapiens) | Peripheral blood | Through venous puncture | Freshly isolated from Homo sapiens, men, 18–75 years | |
| Biological sample (Homo sapiens) | Bone Marrow aspirate | From the posterior iliac crest according to standard practice | Freshly isolated from Homo sapiens | |
| Antibody | Mouse monoclonal CD45 KO | Beckman Coulter | Clone J33 Cat# B36294, RRID:AB_2833027 | (1:25) |
| Antibody | Mouse monoclonal HLA-DR PE | Beckman Coulter | Clone immu-357 Cat# IM1639U RRID:AB_2876782 | (1:10) |
| Antibody | Mouse monoclonal CD14 PECy7 | eBioscience | Clone 61D3 Cat# 25-0149-42 RRID:AB_1582276 | (1:25) |
| Antibody | Mouse monoclonal CD16 FITC | eBioscience | Clone CB16 Cat# 11-0168-42 RRID:AB_10805747 | (1:25) |
| Antibody | Mouse monoclonal CD3 APC-Alexa750 | Beckman Coulter | Clone UCTH1 Cat# A66329 RRID:AB_2876783 | (1:25) |
| Antibody | Mouse monoclonal CD56 APC | Beckman Coulter | Clone N901 Cat# IM2474U RRID:AB_2876784 | (1:25) |
| Antibody | Mouse monoclonal CD192 BV421 | BD Biosciences | Clone 48607 Cat# 564067, RRID:AB_2738573 | (1:50) |
| Antibody | Mouse monoclonal CD11b BV785 | Biolegend | Clone ICRF44 Cat# 301346, RRID:AB_2563794 | (1:50) |
| Antibody | Mouse monoclonal CD41 PerCP-Cy5.5 | Biolegend | Clone Hip8 Cat# 303719, RRID:AB_2561731 | (1:50) |
| Antibody | Mouse monoclonal CD90 FITC | Biolegend | Clone 5E10 Cat# 328107, RRID:AB_893438 | (1:50) |
| Antibody | Mouse monoclonal CD123 PE | BD Biosciences | Clone 9F5 Cat# 555644, RRID:AB_396001 | (1:40) |
| Antibody | Mouse monoclonal CD19 ECD | Beckman Coulter | Clone J4.119 Cat# IM2708U, RRID:AB_130854 | (1:20) |
| Antibody | Mouse monoclonal CD38 PC5.5 | Beckman Coulter | Clone LS198-4-3 Cat# IM2651U, RRID:AB_131166 | (1:20) |
| Antibody | Mouse monoclonal CD117 PEC7 | Beckman Coulter | Clone 104D2D1 Cat# IM3698, RRID:AB_131184 | (1:20) |
| Antibody | Mouse monoclonal CD45RA APC | Beckman Coulter | Clone 2H4LDH11LD89 (2H4) Cat# B14807 RRID:AB_2876787 | (1:20) |
| Antibody | Mouse monoclonal CD34-APC A750 | Beckman Coulter | Clone 581 Cat# A89309 RRID:AB_2876786 | (1:20) |
| Commercial assay or kit | DRAQ7 | Biostatus | Live/Dead stain | (1:500) |
| Commercial assay or kit | Human Cytokine Magnetic Magpix 25-plex panel | Invitrogen | MAGPIX platform | |
| Commercial assay or kit | SimplePlex cartridge | ProteinSimple | Ella platform | |
| Commercial assay or kit | Truseq small RNA primers | Illumina | ||
| Commercial assay or kit | hsCRP ELISA | R&D | DY1707 | |
| Commercial assay or kit | VCAM-1 ELISA | R&D | DY809 | |
| Commercial assay or kit | MMP2 ELISA | R&D | DY902 | |
| Commercial assay or kit | E-selectin ELISA | R&D | DY724 | |
| Chemical compound, drug | Pharm Lyse lysing buffer | BD Biosciences | ||
| Chemical compound, drug | Glutamine | Invitrogen | 2 mmol/L in RPMI | |
| Chemical compound, drug | Gentamycin | Centrafarm | 10 mg/mL in RPMI | |
| Chemical compound, drug | Pyruvate | Invitrogen | 1 mmol/L in RPMI | |
| Chemical compound, drug | Methocult GF | Stemcell Technologies | H84435 | |
| Sequence-based reagent | Hg19 human Refseq transcriptome | Li and Durbin, 2010 | To align RNAseq | |
| Peptide, recombinant protein | Lipopolysaccharide from Escherichia coli | Sigma-Aldrich | Serotype 055:B5, L2880 | 10 ng/mL |
| Peptide, recombinant protein | Pam3CysK4 | EMC Microcollections | L2000 | 10 ug/mL |
| Peptide, recombinant protein | Interferon gamma | Immukine, Boehringer Ingelheim BV | 50 ng/mL for Seahorse | |
| Peptide, recombinant protein | Oligomycin | Sigma-Aldrich | 75351 | 1 mM for Seahorse |
| Peptide, recombinant protein | FCCP | Sigma-Aldrich | C2920 | 1 mM for Seahorse |
| Peptide, recombinant protein | Rotenone | Sigma-Aldrich | R8875 | 1.25 mM |
| Peptide, recombinant protein | Antimycin A | Sigma-Aldrich | A8674 | 2.5 mM |
| Software, algorithm | Kaluza | Beckman Coulter | Version 2.1 RRID:SCR_016182 | Flow Cytometry analysis |
| Software, algorithm | MultiQC | Ewels et al., 2016 | RRID:SCR_014982 | Quality check RNAseq |
| Software, algorithm | DEseq2 v1.22.0 | Love et al., 2014 BioConductor | RRID:SCR_015687 | Differential gene expression RNAseq |
| Software, algorithm | clusterProfiler v3.10.1 | Yu et al., 2012 BioConductor | RRID:SCR_016884 | RNAseq |
| Software, algorithm | R 3.6.1 | https://www.r-project.org/ | RRID:SCR_001905 | |
| Software, algorithm | TrueX algorithm | EARL protocols | ||
| Software, algorithm | Inveon Research Workspace 4.2 | Preclinical Solutions, Siemens Medical Solutions | 3D Gaussian filter kernel, 3.0 mm | Postprocessing of FDG PET CT scanning |
| Software, algorithm | PyRadiomics toolbox | van Griethuysen et al., 2017 | Analysis FDG PET CT | |
| Software, algorithm | SPSS V25.0 | SPSS | RRID:SCR_002865 | Data analysis |
| Software, algorithm | Prism v6.0 | GraphPad software | RRID:SCR_002798 | Figures |
| Other | Sysmex-XN 450 hematology analyzer | Sysmex | For total blood counts | |
| Other | CytoFLEX flow cytometer | Beckman Coulter | 13 color on CytExpert RRID:SCR_017217 | Flow Cytometry Peripheral blood |
| Other | Navios flow cytometer | Beckman Coulter | RRID:SCR_014421 | Flow Cytometry Bone marrow Progenitors |
| Other | XFp Analyzer | Seahorse Bioscience | ||
| Other | BD FACSAria II SORP | Becton Dickinson | RRID:SCR_018091 | Flow cytometry sorting |
| Other | Illumina Nextseq500 platform | Illumina | RRID:SCR_014983 | RNAseq |
| Other | Biograph 40 mCT scanner | Siemens Healthineers | ~2.1 MGq/kg FDG i.v. | FDG PET CT |
Table 3
Cell composition of PBMC and BM-MNC fraction.
| Cell types in PBMC fraction | Controls | Patients |
|---|---|---|
| Lymphocytes (%) | 73 [68-79] | 65 [62-75]* |
| Monocytes (%) | 25 [19-31] | 32 [23-35] |
| Neutrophils (%) | 0.7 [0.6–1.1] | 1.2 [0.6–1.7] |
| Cell types in BM-MNC fraction | ||
| HSPCs (%) | 1.6 [1.2–2.0] | 1.4 [1.2–4.7] |
-
Cellular composition after mononuclear cell enrichment of peripheral blood and bone marrow. Median with [IQR]. Mann-Whitney U test. *: p<0.05, **: p<0.01. HSPCs: hematopoietic stem and progenitor cells.
Additional files
-
Supplementary file 1
Gating strategy of circulating immune cells (related to Table 2).
Monocytes were selected based on CD45+ HLA-DR+ and monocyte scatter properties, after exclusion of dead cells and doublets. Then CD3+ lymphocytes and CD56+ NK-cells were excluded, and monocyte subsets were identified in the CD14/CD16 plot as the percentage of gated. CD11b and CCR2 expression was determined on the monocyte population.
- https://cdn.elifesciences.org/articles/60939/elife-60939-supp1-v2.pdf
-
Transparent reporting form
- https://cdn.elifesciences.org/articles/60939/elife-60939-transrepform-v2.docx
Download links
A two-part list of links to download the article, or parts of the article, in various formats.
Downloads (link to download the article as PDF)
Open citations (links to open the citations from this article in various online reference manager services)
Cite this article (links to download the citations from this article in formats compatible with various reference manager tools)
Reprogramming of bone marrow myeloid progenitor cells in patients with severe coronary artery disease
eLife 9:e60939.
https://doi.org/10.7554/eLife.60939


