Co-circulation of multiple influenza A reassortants in swine harboring genes from seasonal human and swine influenza viruses
- Technical University of Denmark, National Veterinary Institute, Denmark
- University of Copenhagen, Department of Health Sciences, Institute for Animal and Veterinary Sciences, Denmark
- Statens Serum Institut, Denmark
- Department of Health Technology, Section for Bioinformatics, Technical University of Denmark, Denmark
Figures
Figure 1 with 2 supplements

Submission and lineage distribution 2011-2018.
(a) The percentages of submissions testing negative and positive for influenza A virus including the proportion of positive submissions containing a hemagglutinin (HA) of H1N1pmd09 origin. (b) Lineage distribution of the influenza A-positive samples. * indicates the novel reassortants discovered during the surveillance.
Figure 1—figure supplement 1
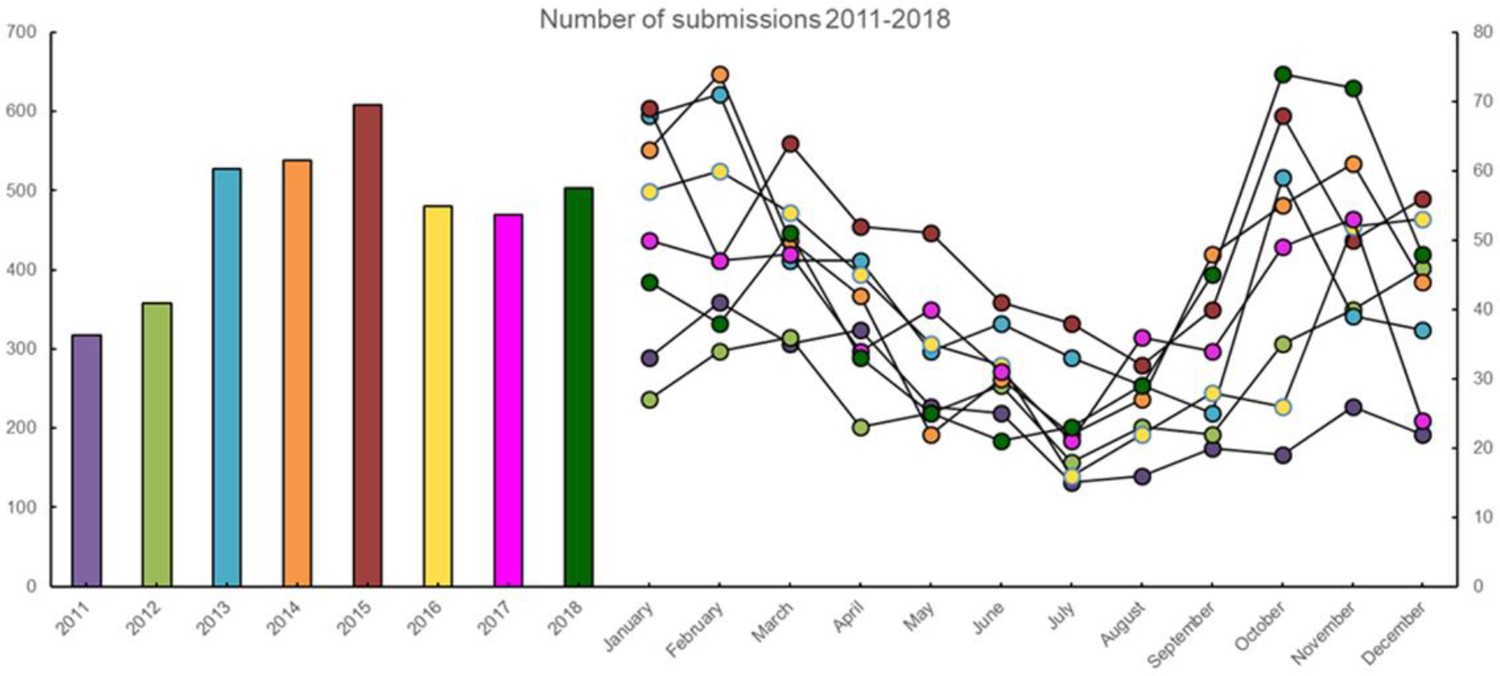
The annual and monthly number of submissions received from Danish pigs with acute respiratory disease in the years 2011–2018.
Figure 1—figure supplement 2
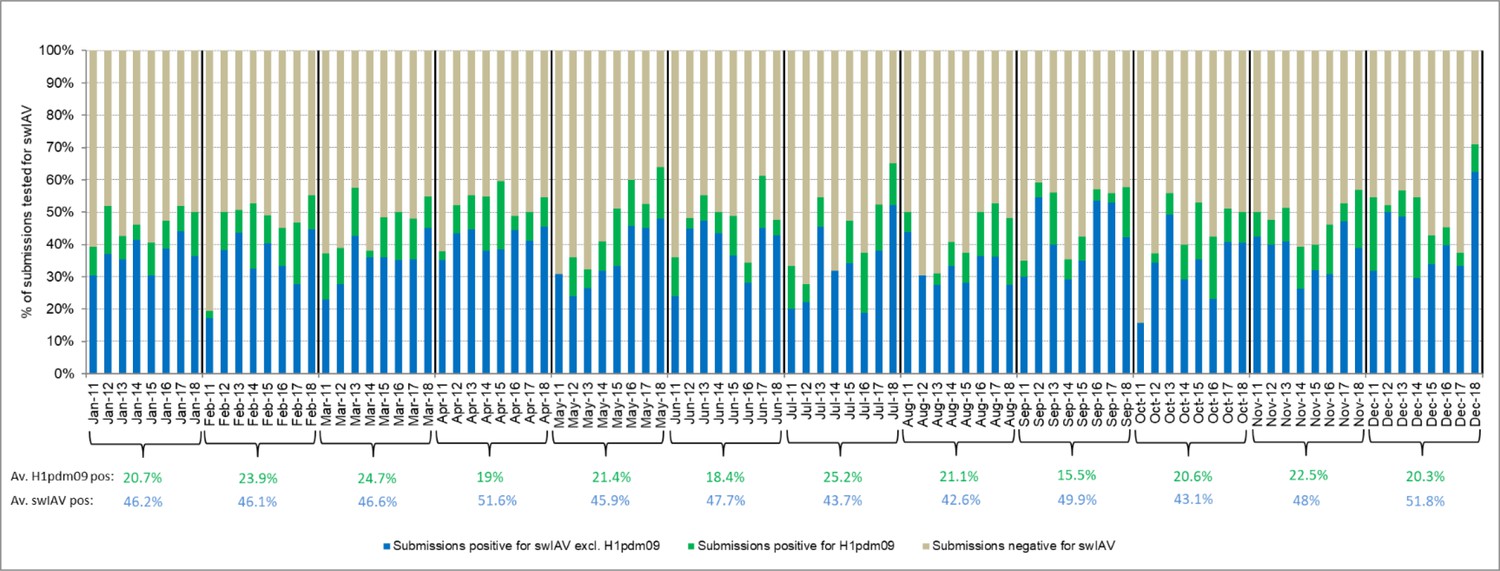
Monthly distribution of submissions for the Danish swine influenza A virus (swIAV) surveillance 2011–2018.
The average percentage of swIAV-positive and H1pdm09-positive over the 8-year surveillance period is indicated below each representative month in blue and green, respectively.
Figure 2 with 1 supplement
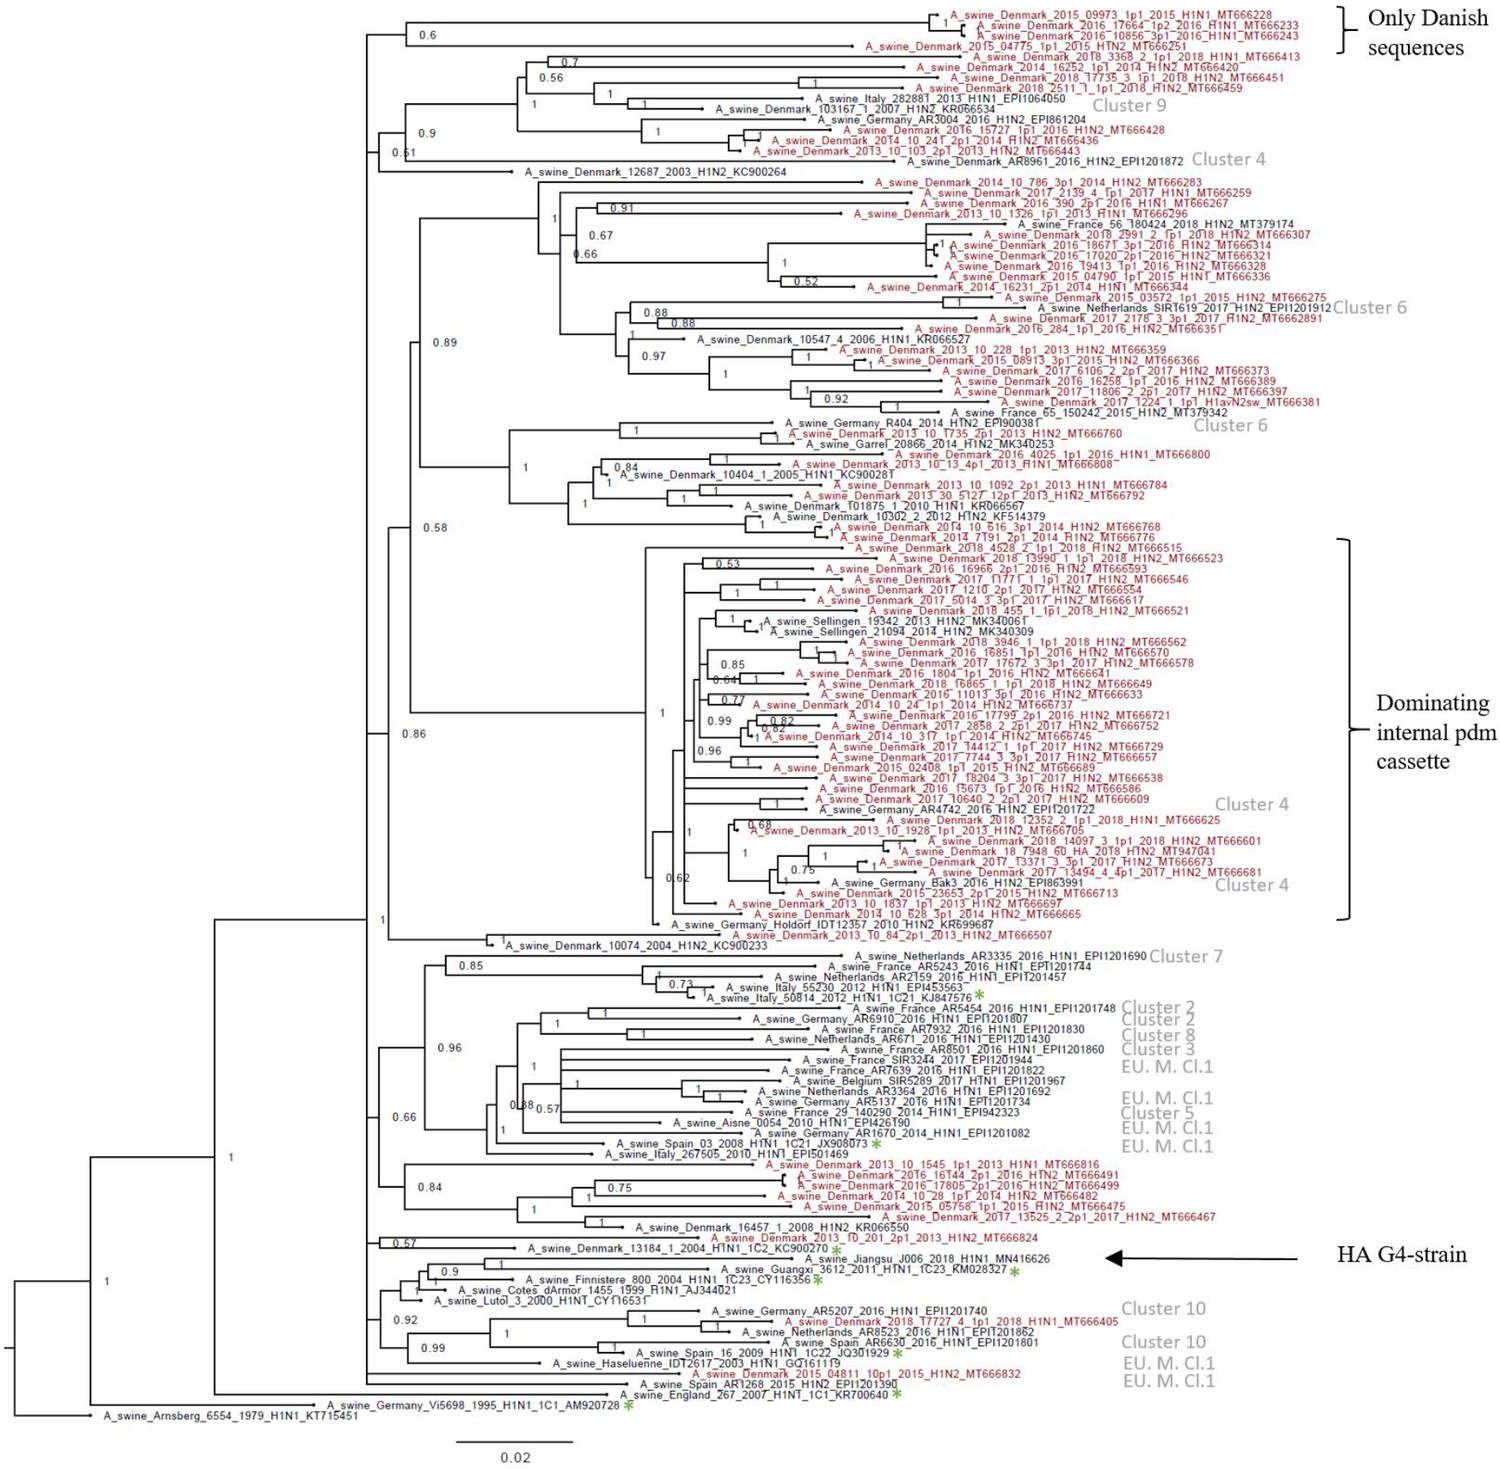
Bayesian phylogenetic tree of the Danish hemagglutinin (HA) nucleotide sequences of H1av origin from 2011 to 2018 and HA reference sequences of H1av origin.
The Danish HA sequences of H1av origin obtained in this study are marked in red, whereas the reference sequences of H1av are marked in black. The sequences belonging to the 10 recently defined European cluster (Henritzi et al., 2020) are highlighted with the name of the specific cluster in gray color. Two clusters are highlighted with brackets; one containing only Danish sequences and one containing H1av sequences derived from H1avNx viruses containing mainly and internal gene cassette of H1N1pdm09 origin. The reference sequences of IRD used to define the 1.C.1 (1C1) and 1.C.2 (1C2) clades are marked with a green *. Node labels represent posterior probabilities. All sequences are named according to the influenza nomenclature, and the accession number is given as a suffix for each sequence. A_Arnsberg_6554_1979_H1N1_KT715451 was used as an outgroup.
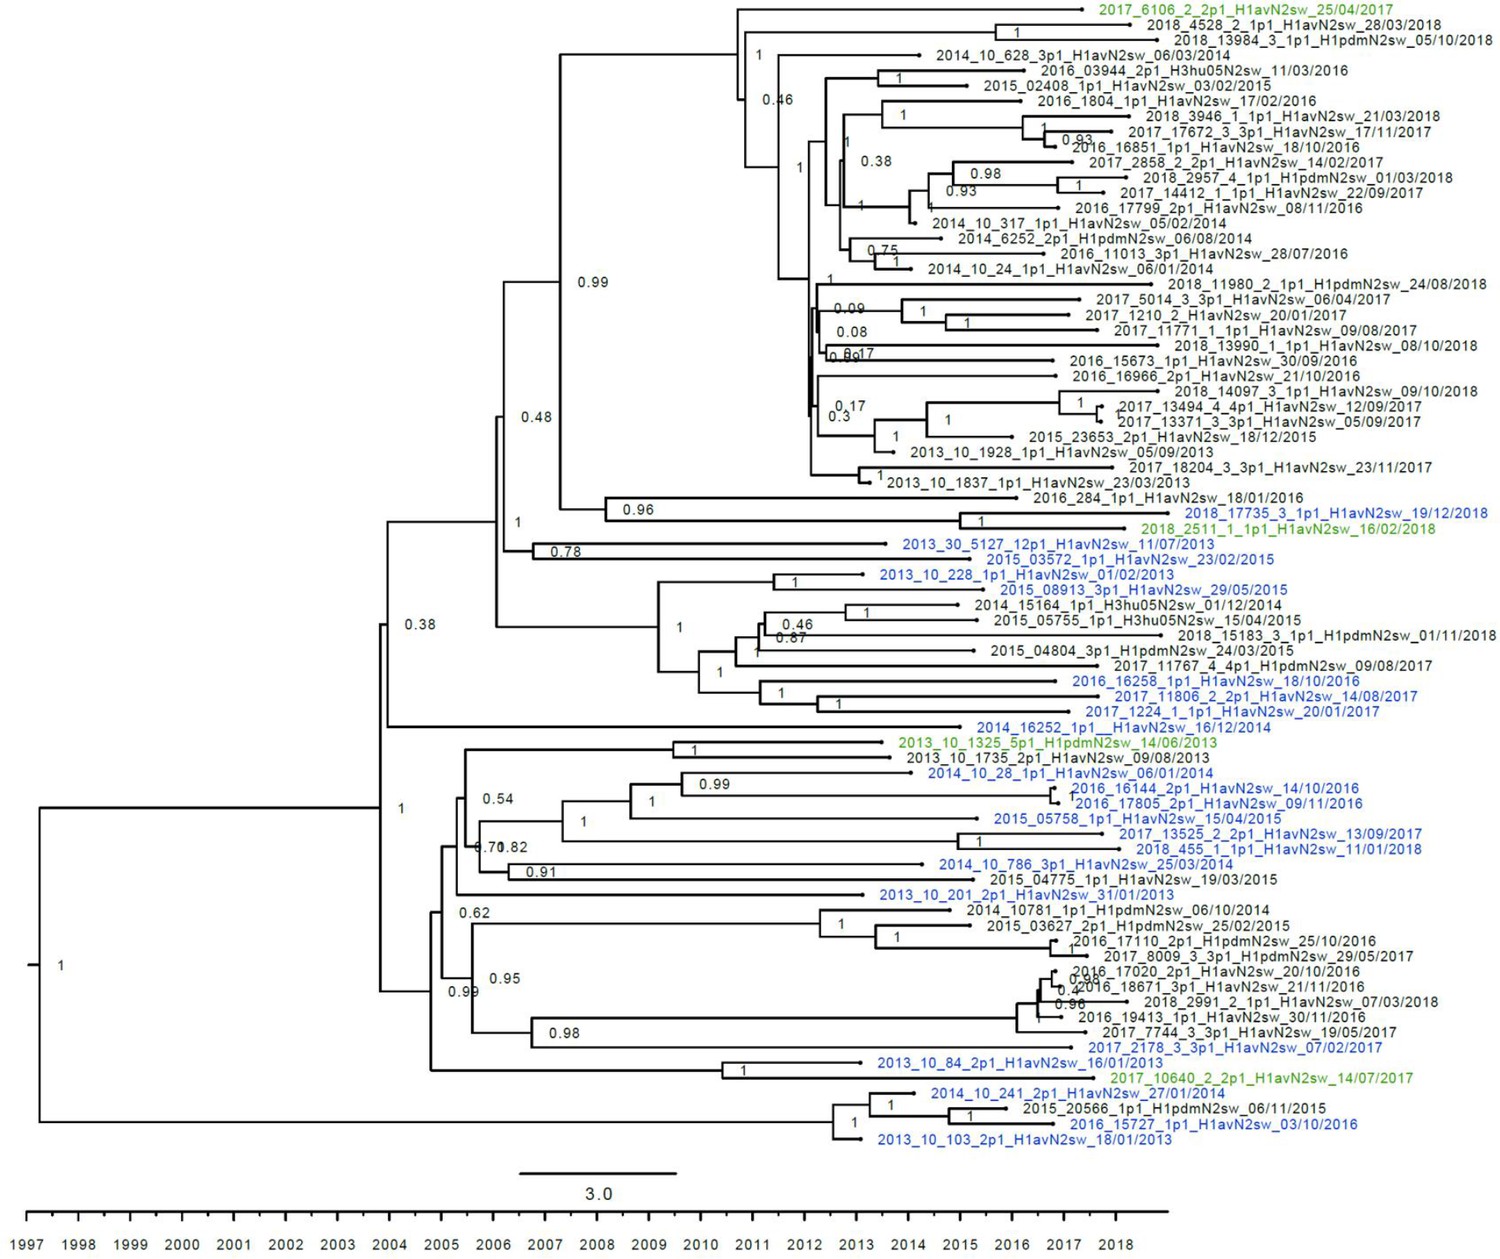
Figure 2—figure supplement 1
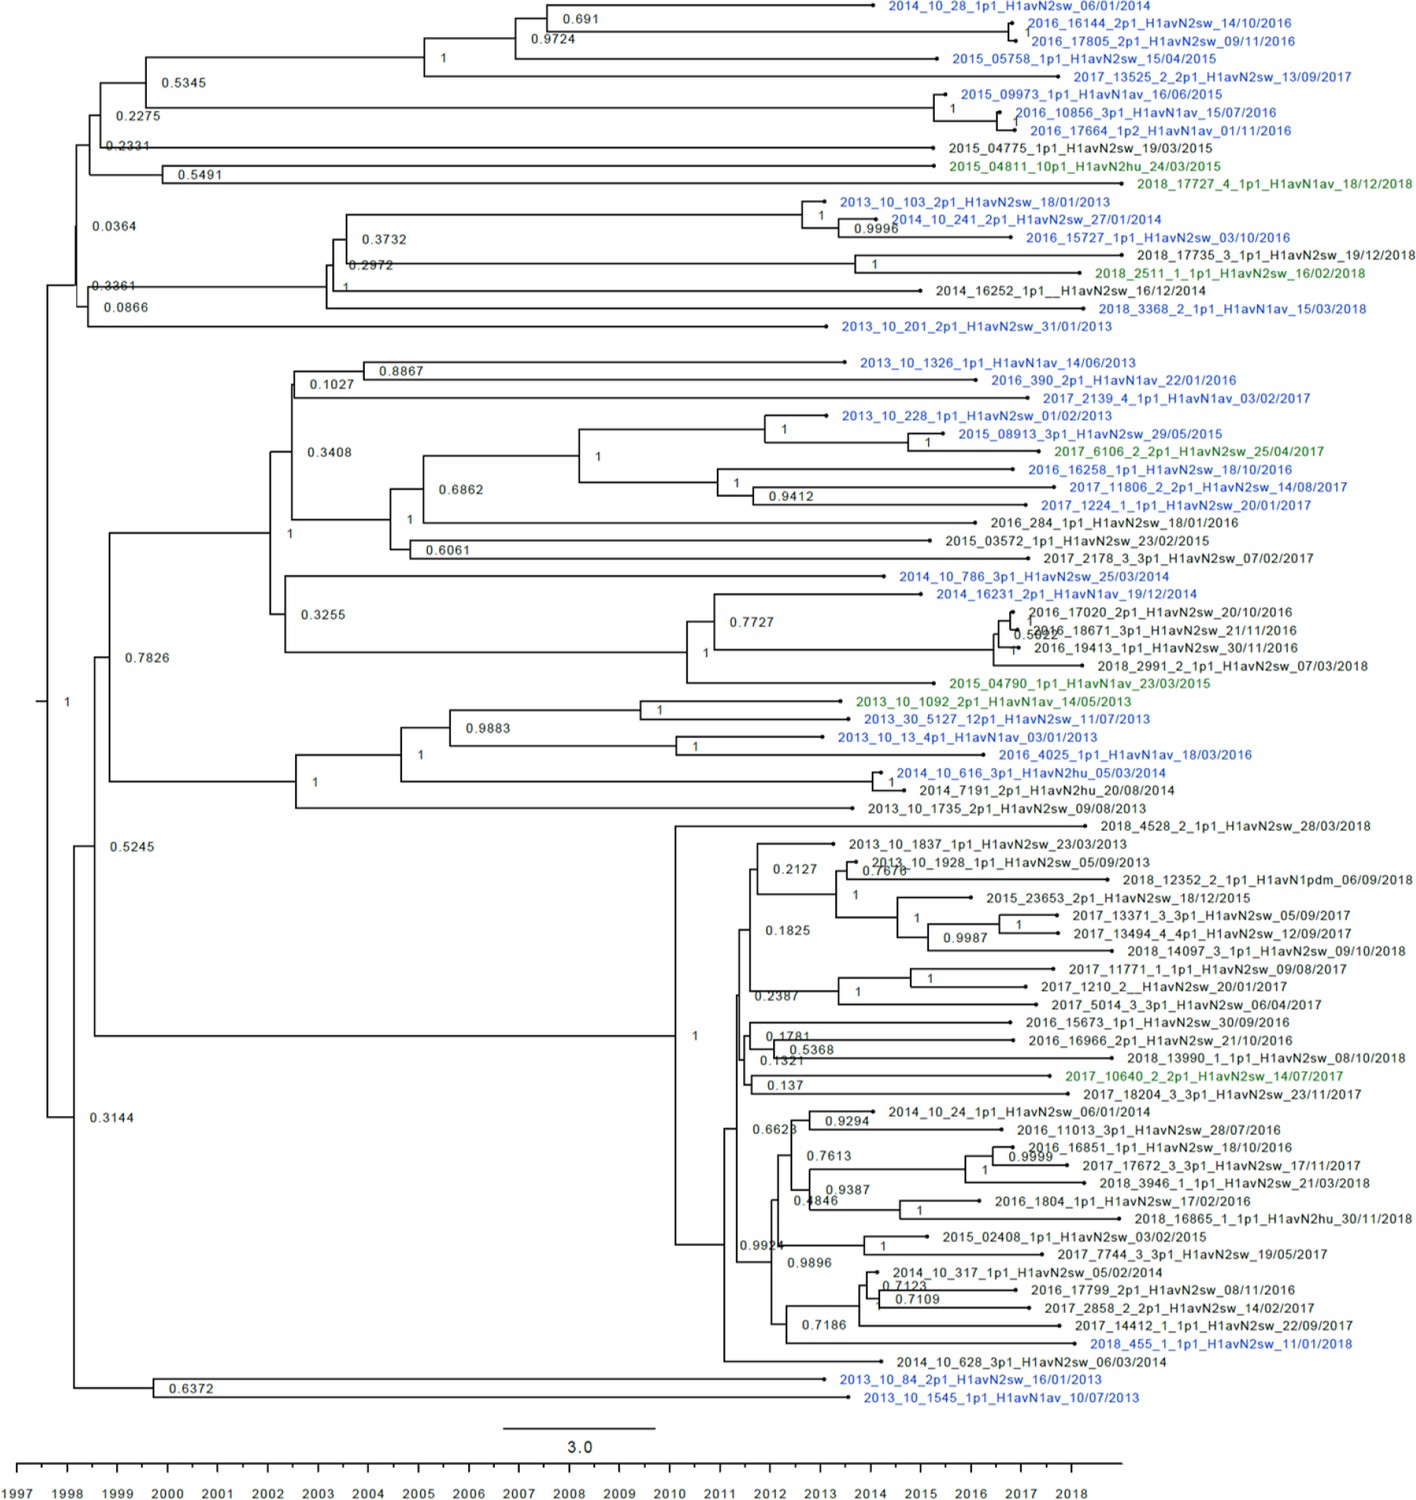
Strict molecular clock tree of the H1av nucleotide sequences of the Danish swine influenza A virus (swIAV) surveillance 2011–2018.
The x-axis indicates the time in years and each tick indicates half a year. A blue taxon indicates that the sample carried an internal gene cassette of avian origin, whereas a green taxon indicates that the sample carried a partial internal gene cassette of H1N1pdm09 origin. A black taxon indicates that the sample carried an internal gene cassette of H1N1pdm09 origin. Sequences are named according to their sequence ID, lineage, and sampling date. The x-axis represents time in years.
Figure 3 with 5 supplements
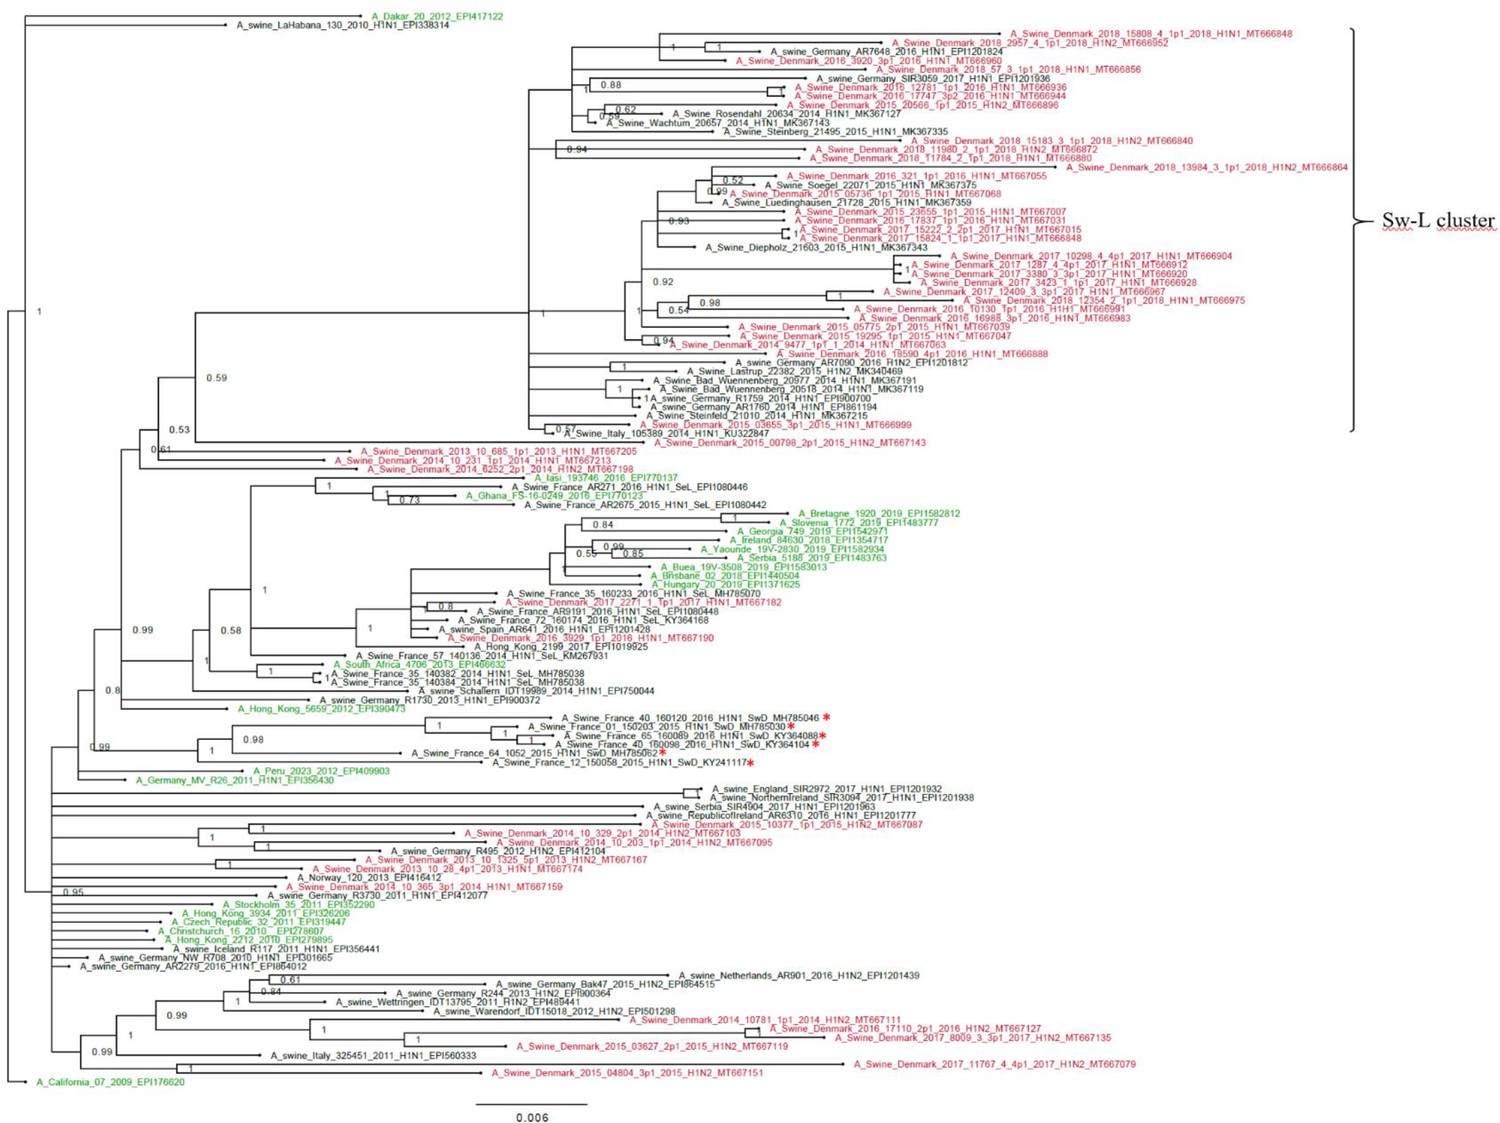
Bayesian phylogenetic tree of the Danish hemagglutinin (HA) nucleotide sequences of H1N1pdm09 origin from 2011 to 2018 and HA reference sequences of H1N1pdm09 origin.
The Danish HA sequences of H1N1pdm09 origin obtained in this study are marked in red, whereas the official human reference sequences of H1N1pdm09 origin of each year from 2009 to 2019 are marked in green. The remaining sequences are HA reference sequences of H1N1pdm09 origin obtained from swine and include representative sequences of each of the five clusters defined in a recent paper by Henritzi et al., 2020, and the swine divergent (SwD and marked with a red *) and seasonal-like (SeL) of an earlier French study by Chastagner et al., 2018. Moreover, the closest swine HA sequence matches of NCBI GenBank were included. Sw-L cluster includes the cluster formed by only H1pdm09Nx sequences of swine origin. All sequences are named according to the influenza nomenclature, and the accession number is given as a suffix for each sequence. A_California_07_2009_EPI176620 was used as an outgroup. Node labels represent posterior probabilities.
Figure 3—figure supplement 1
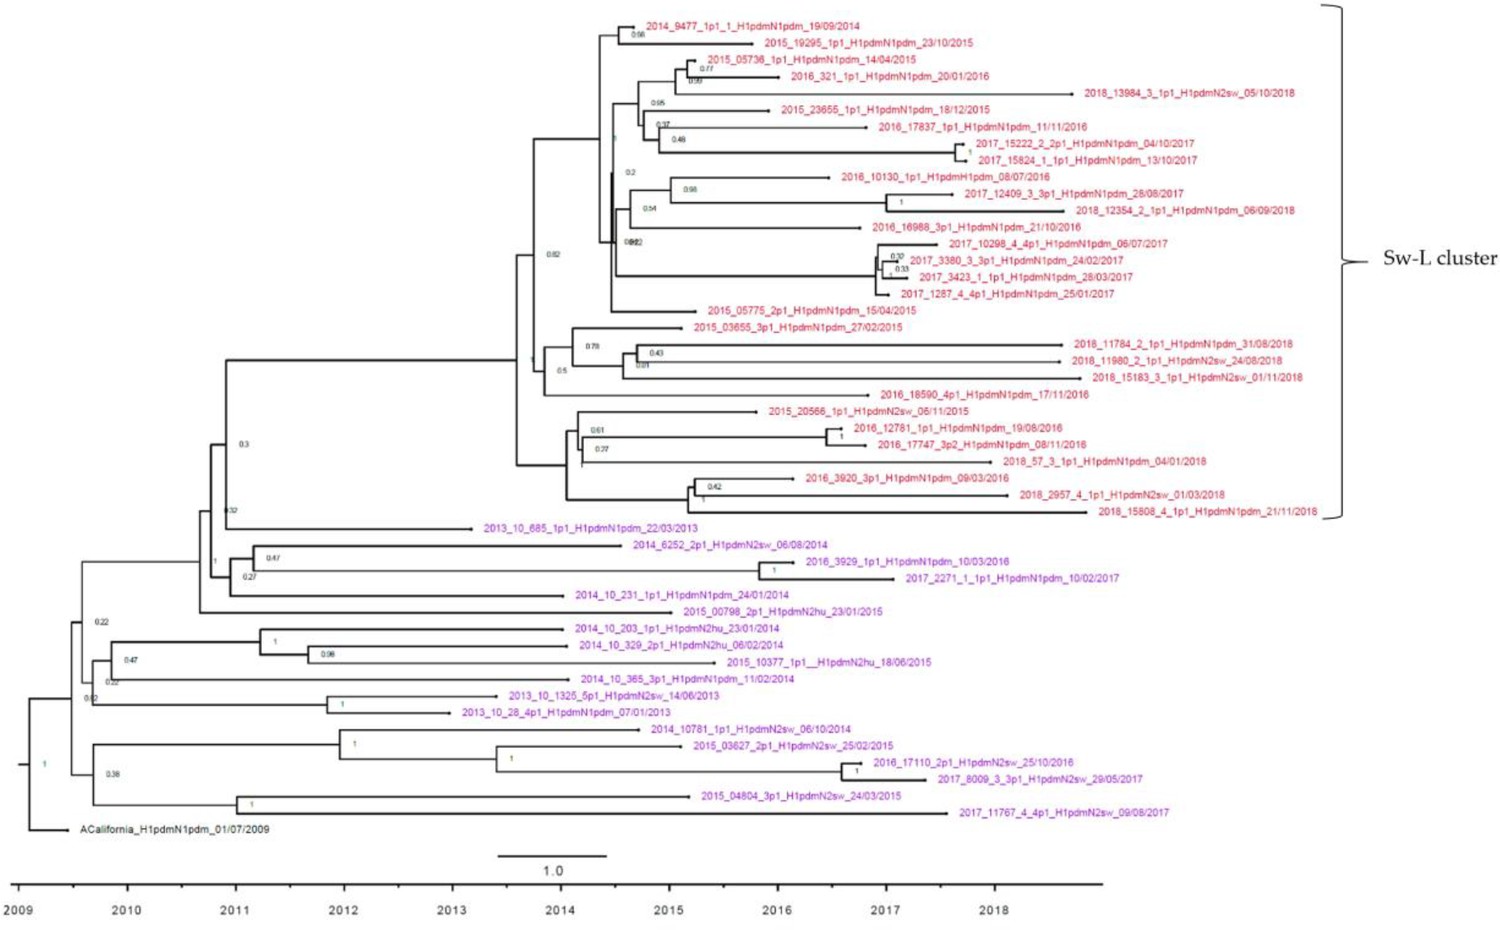
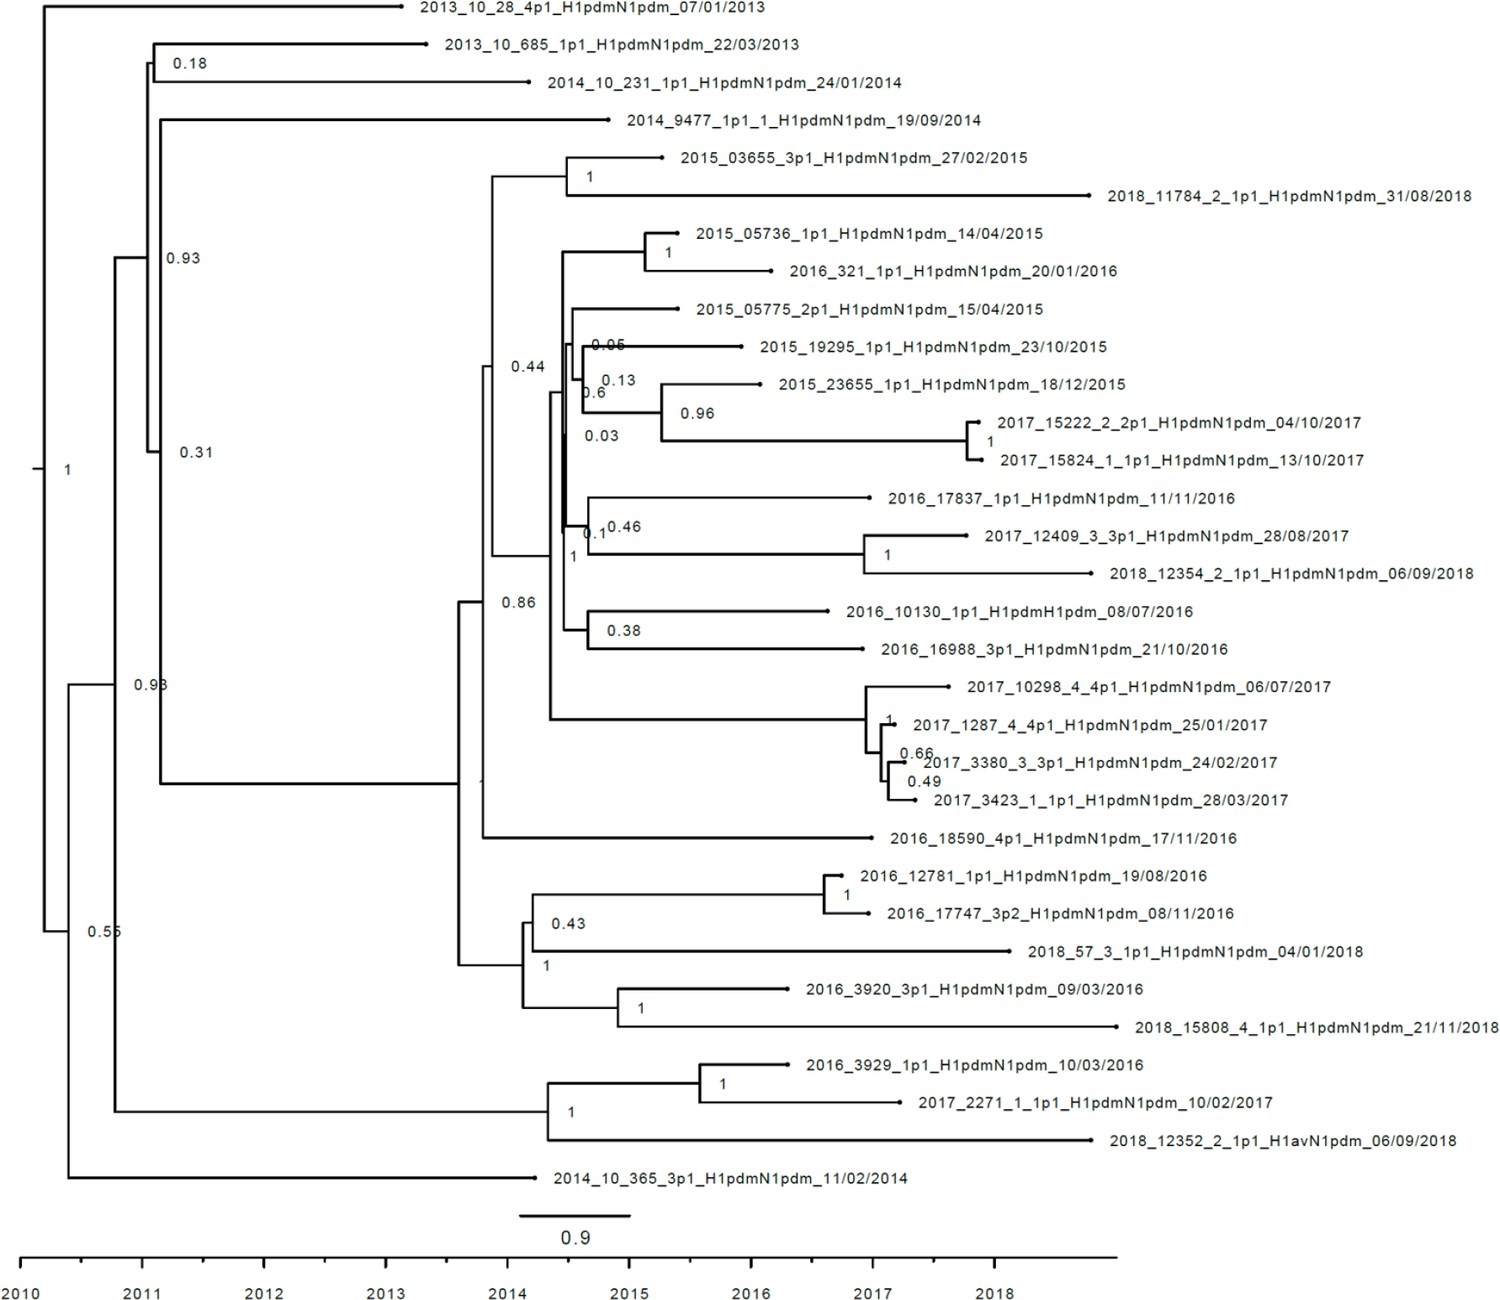
Strict molecular clock tree of the H1pdm09 sequences of the Danish swine influenza A virus (swIAV) surveillance 2011–2018.
Node labels represent posterior probabilities. The x-axis represents the time in years, and each tick indicates half a year. Sequences are named according to their sequence ID, lineage, and sampling date. A red taxon indicates samples included in the Sw-L cluster, and a purple taxon indicates samples located outside the Sw-L cluster.
Figure 3—figure supplement 2
Strict molecular clock tree of the N1pdm09 sequences of the Danish swine influenza A virus (swIAV) surveillance 2011–2018.
The x-axis indicates the time in years, and each tick indicates half a year. A black taxon indicates that the sample carried an internal gene cassette of H1N1pdm09 origin. Sequences are named according to their sequence ID and lineage.
Figure 3—figure supplement 3
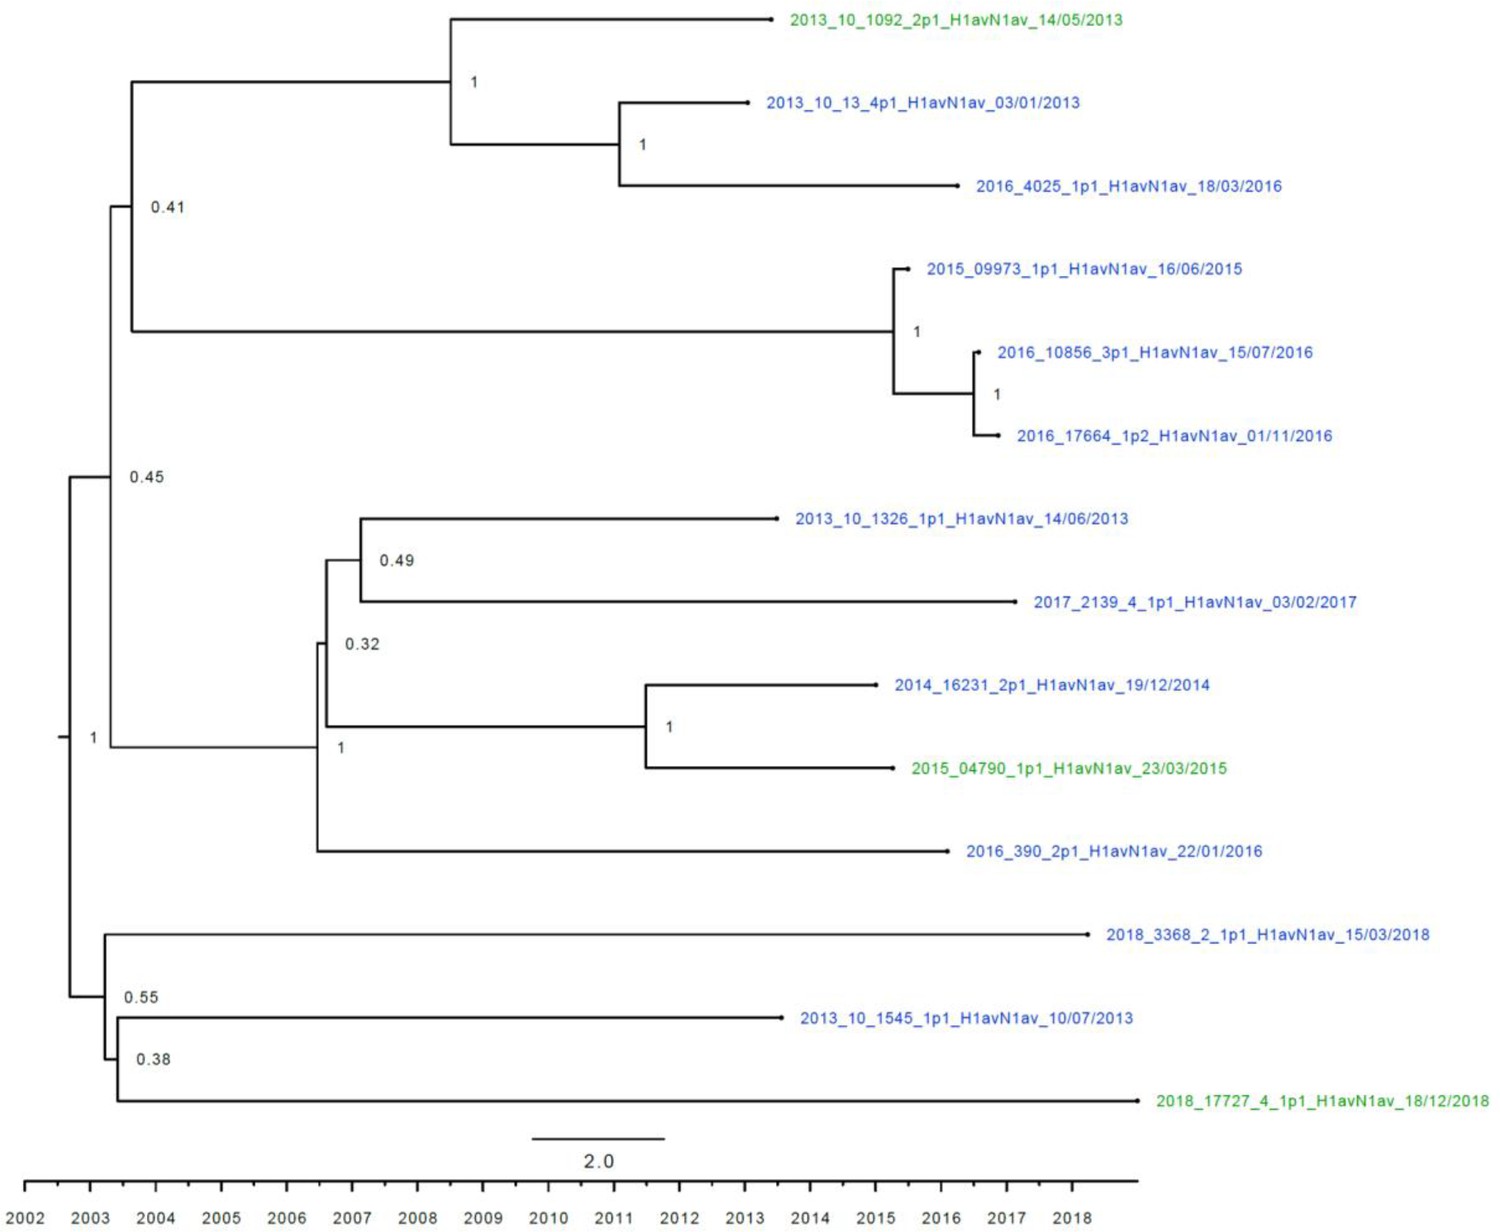
Strict molecular clock tree of the N1av sequences of the Danish swine influenza A virus (swIAV) surveillance 2011–2018.
The x-axis indicates the time in years, and each tick indicates half a year. A blue taxon indicates that the sample carried an internal gene cassette of avian origin, whereas a green taxon indicates that the sample carried a partial internal gene cassette of H1N1pdm09 origin. Sequences are named according to their sequence ID and lineage.
Figure 3—figure supplement 4
Strict molecular clock tree of the N2dk sequences of the Danish swine influenza A virus (swIAV) surveillance 2011–2018.
The x-axis indicates the time in years, and each tick indicates half a year. A blue taxon indicates that the sample carried an internal gene cassette of avian origin, whereas a green taxon indicates that the sample carried a partial internal gene cassette of H1N1pdm09 origin. A black taxon indicates that the sample carried an internal gene cassette of H1N1pdm09 origin. Sequences are named according to their sequence ID and lineage.
Figure 3—figure supplement 5
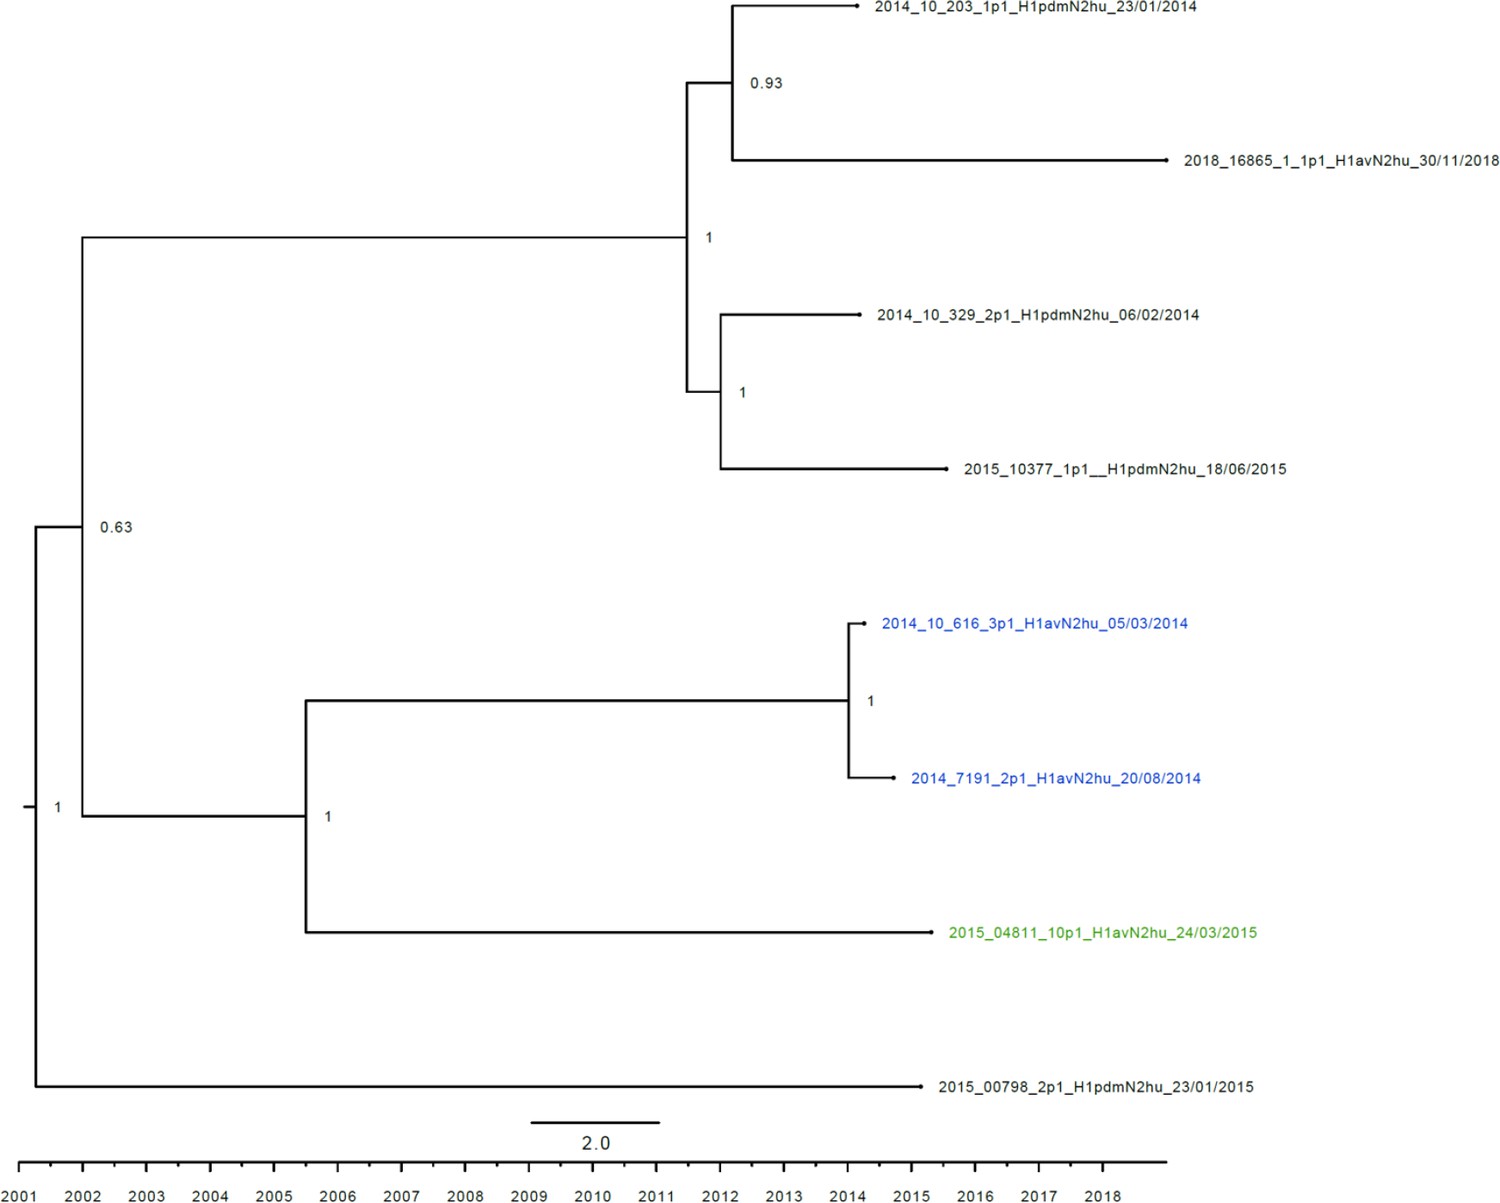
Strict molecular clock tree of the N2hu95 sequences of the Danish swine influenza A virus (swIAV) surveillance 2011–2018.
The x-axis indicates the time in years, and each tick indicates half a year. A blue taxon indicates that the sample carried an internal gene cassette of avian origin, whereas a green taxon indicates that the sample carried a partial internal gene cassette of H1N1pdm09 origin. A black taxon indicates that the sample carried an internal gene cassette of H1N1pdm09 origin. Sequences are named according to their sequence ID and lineage.
Tables
Table 1
Results of the evolutionary analysis of the hemagglutinin (HA) protein of the H1av and the H1pdm09 lineages obtained in the Danish swine influenza A virus (swIAV) surveillance 2011–2018, including division of the H1pdm09 sequences into the ones located in and outside the Sw-L cluster.
The best-fitting substitution model M1a and M2a indicates neutral/negative selection and positive selection, respectively. The global ω ratio indicates average dN/dS ratio of the sequences. The positions in which positive selection occurred are given, and the positions are numbered from the first methionine. The TempEst correlation coefficient indicates how well the sequences are accumulating nucleotide changes proportionally to elapsed time. The substitution rate was calculated based on the length of the HA gene (1701nts) and represents the number of substitutions for the entire gene per year.
| H1pdm n = 48 | H1pdm09 Sw-L cluster n = 30 | H1pdm09 outside the Sw-L cluster n = 18 | H1av n = 78 | |
|---|---|---|---|---|
| Probability of M1a/M2a (%) | 0.1/99.9 | 91/9 | 0.1/99.9 | 0.1/99.9 |
| Global ω ratio | 0.27 | 0.25 | 0.26 | 0.19 |
| Positions with positive selection (antigenic site/RBS) | 142K (Sa), 154P (Ca1/RBS), 172E (Sa), 174V (Sa), 200A (RBS), 202S, 204D (RBS), 206R (Sb/RBS), 207T (Sb/RBS) | - | 142K (Sa), 154P, 159K (Ca1/RBS), 160G, 172E (Sa), 178L (Sa), 179N (Sa), 200A (RBS), 202S, 203D (Sb/RBS), 204D (RBS), 206R (Sb/RBS), 207T (Sb/RBS), 338I, 391G | 142Q (Sa), 159K (Ca1/RBS), 172R (Sa), 173E (Sb) |
| TempEst correlation coefficient | 0.87 | 0.85 | 0.93 | 0.56 |
| Substitution rate | 4.9 × 10⁻³ per site per year = 8.3 nt substitutions per year | 4.6 × 10⁻³ per site per year = 7.8 nt substitutions per year | 6.1 × 10⁻³ per site per year = 10.4 nt substitutions per year | 4.6 × 10⁻³ per site per year = 7.8 nt substitutions per year |
Table 2
Mutations of the H1pdm09 defining the sequences of the Sw-L cluster of the H1pdm09 phylogenetic tree (Figure 3).
Positions in the aa sequences are numbered from the first methionine. Bold letters indicate the mutations that are unique to the Danish swine divergent cluster. RBS: receptor binding site.
| Aa change Hu-L → Sw-L | Prevalence in the Sw-L cluster | Prevalence outside the Sw-L cluster | Antigenic site/RBS |
|---|---|---|---|
| N/S16D | 44/46 | 0/75 | - |
| N/D114N/H | 46/46 | 39/75 | - |
| P141T | 46/46 | 0/75 | Sa |
| N/G/K142D | 45/46 | 15/75 | Sa |
| H143N/D/E | 46/46 | 0/75 | Sa |
| D144N/K | 42/46 | 0/75 | - |
| S145L | 41/46 | 0/75 | - |
| N/S/D146K/E | 46/46 | 0/75 | RBS |
| N/Q/K147E | 46/46 | 1/75 | RBS |
| A152S | 46/46 | 2/75 | RBS |
| N/K/R159S | 45/46 | 1/75 | Ca1/RBS |
| G/E/R/V172T/M | 46/46 | 0/75 | Sa |
| N/S/K173D/G | 44/46 | 0/75 | Sb |
| K/E/A/Q180I | 46/46 | 0/75 | Sa |
| D185N | 39/46 | 0/75 | Ca1 |
| T/S/N/D202A | 44/46 | 0/75 | - |
| S/T/W/E207R | 42/46 | 3/75 | Sb/RBS |
| D239N | 46/46 | 4/75 | Ca2/RBS |
| K/T/E319Q | 46/46 | 0/75 | - |
| I/V/T338D | 42/46 | 0/75 | - |
Table 3
Results of the evolutionary analysis of the neuraminidase (NA) gene of the N1pdm, N1av, N2dk, and N2hu95 lineages.
The best-fitting substitution model M1a and M2a indicates neutral/negative selection and positive selection, respectively. The global ω ratio indicates average dN/dS ratio of the sequences. The positions in which positive selection occurred are given, and the positions are numbered from the first methionine. The TempEst correlation coefficient indicates how well the sequences are accumulating nucleotide changes proportionally to elapsed time. The substitution rate was calculated based on the length of the NA gene (1413nts) and represents the number of substitutions for the entire gene per year.
| N1pdm | N1av | N2dk | N2hu95 | |
|---|---|---|---|---|
| Probability of M1a/M2a (%) | 90/10 | 73/27 | 88/12 | 88/12 |
| Global ω ratio | 0.24 | 0.15 | 0.17 | 0.18 |
| Positions with positive Hu-Lection | - | - | - | - |
| TempEst correlation coefficient | 0.88 | 0.68 | 0.75 | 0.62 |
| Substitution rate (per site per year) | 3.9 × 10⁻³ | 5.9 × 10⁻³ | 4.4 × 10⁻³ | N.A |
Table 4
Genotypes of the different Danish swine influenza A virus (swIAV) isolates from 2013 to 2018.
Previously described genotypes originated from Watson et al., 2015 (*) and Henritzi et al., 2020 (^). The total number of samples obtained for each genotype is given in the column ‘n’, and the total number of samples does not correspond to the total number of samples sequences since sequences of each segment were not obtained from each sample; see Supplementary file 1.
| HA | NA | M | NP | NS | PA | PB1 | PB2 | Genotype | n | |
|---|---|---|---|---|---|---|---|---|---|---|
| H1N2dk | ||||||||||
| Genotype 1 | D* | 18 | ||||||||
| Genotype 2 | - | 1 | ||||||||
| Genotype 3 | AH^ | 1 | ||||||||
| Genotype 4 | T* | 28 | ||||||||
| H1avN1av | ||||||||||
| Genotype 1 | A* | 9 | ||||||||
| Genotype 2 | M* | 1 | ||||||||
| Genotype 3 | AB^ | 1 | ||||||||
| Genotype 4 | - | 1 | ||||||||
| H1N2hu95 | ||||||||||
| Genotype 1 | I* | 2 | ||||||||
| Genotype 2 | - | 1 | ||||||||
| Genotype 3 | - | 1 | ||||||||
| H1N1pdm09 | ||||||||||
| Genotype 1 | P* | 31 | ||||||||
| H1pdm09N2dk | ||||||||||
| Genotype 1 | - | 1 | ||||||||
| Genotype 2 | R* | 12 | ||||||||
| H1pdm09N2hu95 | ||||||||||
| Genotype 1 | - | 4 | ||||||||
| H3hu05N2dk | ||||||||||
| Genotype 1 | - | 3 | ||||||||
| H1avN1pdm09 | ||||||||||
| Genotype 1 | - | 1 | ||||||||
| Color-code: | ||||||||||
| Enzootic swine origin (H1avN1av, H1N2dk, H3N2sw) | Seasonal human H3N2 origin | H1N1pdm09 origin | ||||||||
-
Table 4—source data 1
Bayesian phylogenetic tree of the M sequences of the Danish swine influenza A virus (swIAV) surveillance 2011–2018.
A/sw/Denmark/12687/2003(H1N2) accession number: KC900267 was used as the outgroup. A blue taxon indicates that the M gene of the sample is of avian-like origin, whereas a black taxon indicates that the M gene of the sample is of H1N1pmd09 origin. Sequences are named according to their sequence ID and lineage.
- https://cdn.elifesciences.org/articles/60940/elife-60940-table4-data1-v2.docx
-
Table 4—source data 2
Bayesian phylogenetic tree of the NP sequences of the Danish swine influenza A virus (swIAV) surveillance 2011–2018.
A/sw/Denmark/12687/2003(H1N2) accession number: KC900267 was used as the outgroup. A blue taxon indicates that the NP gene of the sample is of avian-like origin, whereas a black taxon indicates that the NP gene of the sample is of H1N1pmd09 origin. Sequences are named according to their sequence ID and lineage.
- https://cdn.elifesciences.org/articles/60940/elife-60940-table4-data2-v2.docx
-
Table 4—source data 3
Bayesian phylogenetic tree of the NS sequences of the Danish swine influenza A virus (swIAV) surveillance 2011–2018.
A/sw/Denmark/12687/2003(H1N2) accession number: KC900267 was used as an outgroup. A blue taxon indicates that the NS gene of the sample is of avian-like origin, whereas a black taxon indicates that the NS gene of the sample is of H1N1pmd09 origin. Sequences are named according to their sequence ID and lineage.
- https://cdn.elifesciences.org/articles/60940/elife-60940-table4-data3-v2.docx
-
Table 4—source data 4
Bayesian phylogenetic tree of the PA sequences of the Danish swine influenza A virus (swIAV) surveillance 2011–2018.
A/sw/Denmark/12687/2003(H1N2) accession number: KC900267 was used as an outgroup. A blue taxon indicates that the PA gene of the sample is of avian-like origin, whereas a black taxon indicates that the PA gene of the sample is of H1N1pmd09 origin.
- https://cdn.elifesciences.org/articles/60940/elife-60940-table4-data4-v2.docx
-
Table 4—source data 5
Bayesian phylogenetic tree of the PB1 sequences of the Danish swine influenza A virus (swIAV) surveillance 2011–2018.
A/sw/Denmark/12687/2003(H1N2) accession number: KC900267 was used as an outgroup. A blue taxon indicates that the PB1 gene of the sample is of avian-like origin, whereas a black taxon indicates that the PB1 gene of the sample is of H1N1pmd09 origin.
- https://cdn.elifesciences.org/articles/60940/elife-60940-table4-data5-v2.docx
-
Table 4—source data 6
Bayesian phylogenetic tree of the PB2 sequences of the Danish swine influenza A virus (swIAV) surveillance 2011–2018.
A/sw/Denmark/12687/2003(H1N2) accession number: KC900267 was used as an outgroup. A blue taxon indicates that the PB2 gene of the sample is of avian-like origin, whereas a black taxon indicates that the PB2 gene of the sample is of H1N1pmd09 origin.
- https://cdn.elifesciences.org/articles/60940/elife-60940-table4-data6-v2.docx
-
Table 4—source data 7
Percentage of H1N2dk isolates containing at least one internal gene of H1N1pdm09 origin.
- https://cdn.elifesciences.org/articles/60940/elife-60940-table4-data7-v2.docx
Additional files
-
Supplementary file 1
The genotype of all full-genome sequenced samples during the Danish swine influenza A virus (swIAV) surveillance 2011–2018.
- https://cdn.elifesciences.org/articles/60940/elife-60940-supp1-v2.docx
-
Supplementary file 2
Residues examined for specific mutations involving host adaptation, virulence, pathogenicity, and dominating residues differing between H1av and H1N1pdm09 origin viruses.
Aa positions are numbered according to the first methionine if nothing else is indicated.
- https://cdn.elifesciences.org/articles/60940/elife-60940-supp2-v2.docx
-
Supplementary file 3
Amino acid differences in the internal proteins of the Danish sequences of the Sw-L cluster and the sequences located outside the cluster.
Aa positions are numbered according to the first methionine.
- https://cdn.elifesciences.org/articles/60940/elife-60940-supp3-v2.docx
-
Supplementary file 4
Primers and probes used for detection, subtyping, and full-genome sequencing of swine influenza A virus (swIAV).
Nucleotides are named according to the IUPAC codes. Purple color indicates the pQE part of the primers.
- https://cdn.elifesciences.org/articles/60940/elife-60940-supp4-v2.docx
-
Transparent reporting form
- https://cdn.elifesciences.org/articles/60940/elife-60940-transrepform-v2.docx
Download links
A two-part list of links to download the article, or parts of the article, in various formats.
Downloads (link to download the article as PDF)
Open citations (links to open the citations from this article in various online reference manager services)
Cite this article (links to download the citations from this article in formats compatible with various reference manager tools)
Co-circulation of multiple influenza A reassortants in swine harboring genes from seasonal human and swine influenza viruses
eLife 10:e60940.
https://doi.org/10.7554/eLife.60940


