GABAA presynaptic inhibition regulates the gain and kinetics of retinal output neurons
- Department of Neuroscience, University of Wisconsin, United States
- McPherson Eye Research Institute, University of Wisconsin, United States
- Cellular and Molecular Pathology Training Program, University of Wisconsin, United States
- Department of Ophthalmology and Visual Sciences, University of Wisconsin, United States
- Neuroscience Training Program, University of Wisconsin, United States
Figures
Figure 1 with 1 supplement
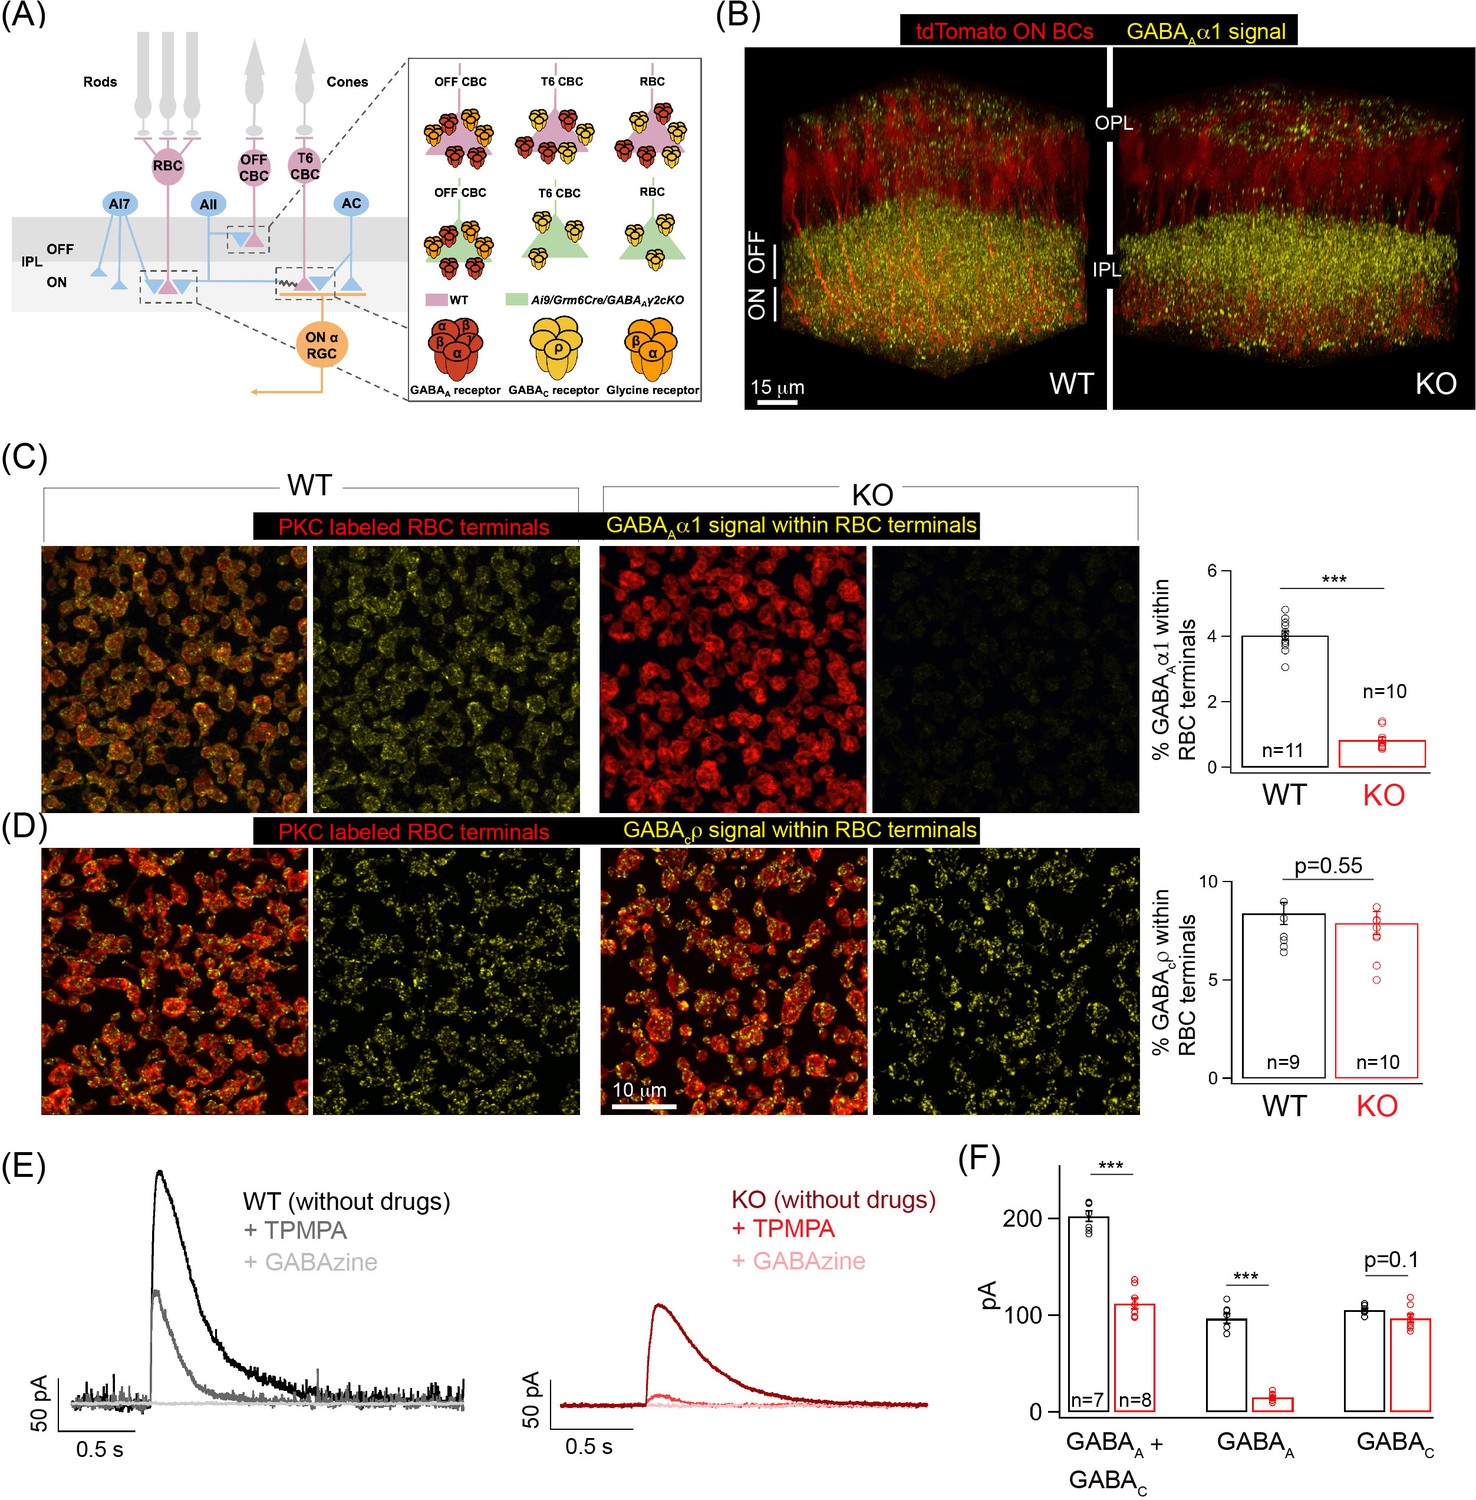
Specific elimination of GABAA receptors from ON bipolar cell (BC) terminals in the Ai9/Grm6Cre/Gabrg2 conditional knockout (KO) mouse.
(A) Schematic illustrating the receptor composition of presynaptic inhibition across rod (RBC) and cone bipolar cell (CBC) axon terminals in wildtype adult littermate control (WT) and KO retina; T6 CBC refers to Type 6 ON CBC (B) α1-subunit-containing GABAA receptor (GABAA α1) immunolabeling (yellow) and ON BC labeling (tdTomato; red) in outer and inner plexiform layers (OPL and IPL respectively) of WT retina and Ai9/Grm6Cre/Gabrg2 (KO) retina. In the KO, GABAAα1 immunofluorescence is present in the OFF lamina of the IPL but not in the ON lamina. (C) (Left) GABAAα1 receptor (yellow; signal within terminals) and protein kinase C (PKC; red) immunolabeling of RBC terminals in WT retina. The merged panel consists of the PKC signal and the receptor signal within PKC positive RBC terminals. (Right) Image of KO retina shows reduced GABAAα1 receptor immunofluorescence within RBC terminals. (Far right) Quantifications of receptor expression confirmed a significant reduction of GABAAα1 expression in the KO (mean ± sem = 0.8 ± 0.1) retina relative to WT (mean ± sem = 4 ± 0.1). (D) (Left) Immunolabeling of RBC terminals (PKC;red) in WT retina with antibodies against the ρ-subunit-containing GABAC receptor (GABACρ; yellow – signal within RBC terminals). (Right) Image shows GABACρ immunoreactivity within RBC terminals in the KO retina. (Far right) Quantification of RBC terminal GABACρ receptor expression in KO (mean ± sem = 7.9 ± 0.6) retina relative to WT (mean ± sem = 8.4 ± 0.6). (E) Exemplar traces of evoked responses of an RBC after GABA puff application at its axon terminal. WT (Left, black trace); KO (Right, red traces). TPMPA (GABAC receptor antagonist) and GABAzine (GABAA receptor antagonist) were used to pharmacologically isolate GABAA and GABAC receptor-mediated components of the evoked responses. The GABAA component is revealed after application of TPMPA (labeled +TPMPA) and is eliminated upon the addition of GABAzine (TPMPA + GABAzine; labeled +GABAzine). Note the reduction of the GABAA receptor-mediated component in the KO relative to the WT. (F) Bar graph quantifying the GABAA and GABAC-mediated component of RBC evoked responses in WT (black) and KO (red) retina. The mean ± sem peak amplitudes of GABAA + GABAC currents were 202.5 ± 5.5 pA in WT retina and 112.3 ± 5.6 pA in KO retina. The mean ± sem peak amplitudes of GABAA currents were 96.8 ± 5.2 pA in WT retina and 15.2 ± 1.5 pA in KO retina. The mean ± sem peak amplitudes of GABAC currents were 105.8 ± 1.8 pA in WT retina and 97 ± 4.3 pA in KO retina. Note that the significant reduction in the total response (GABAA + GABAC) in the KO can be attributed to the reduction in the GABAA-mediated component. In all figures, error bars indicate sem and ‘n’ refers to the number of cells analyzed except 1C, 1D, and Figure 1—figure supplement 1E occupancy quantifications where ‘n’ refers to the number of retinas analyzed.
Figure 1—figure supplement 1
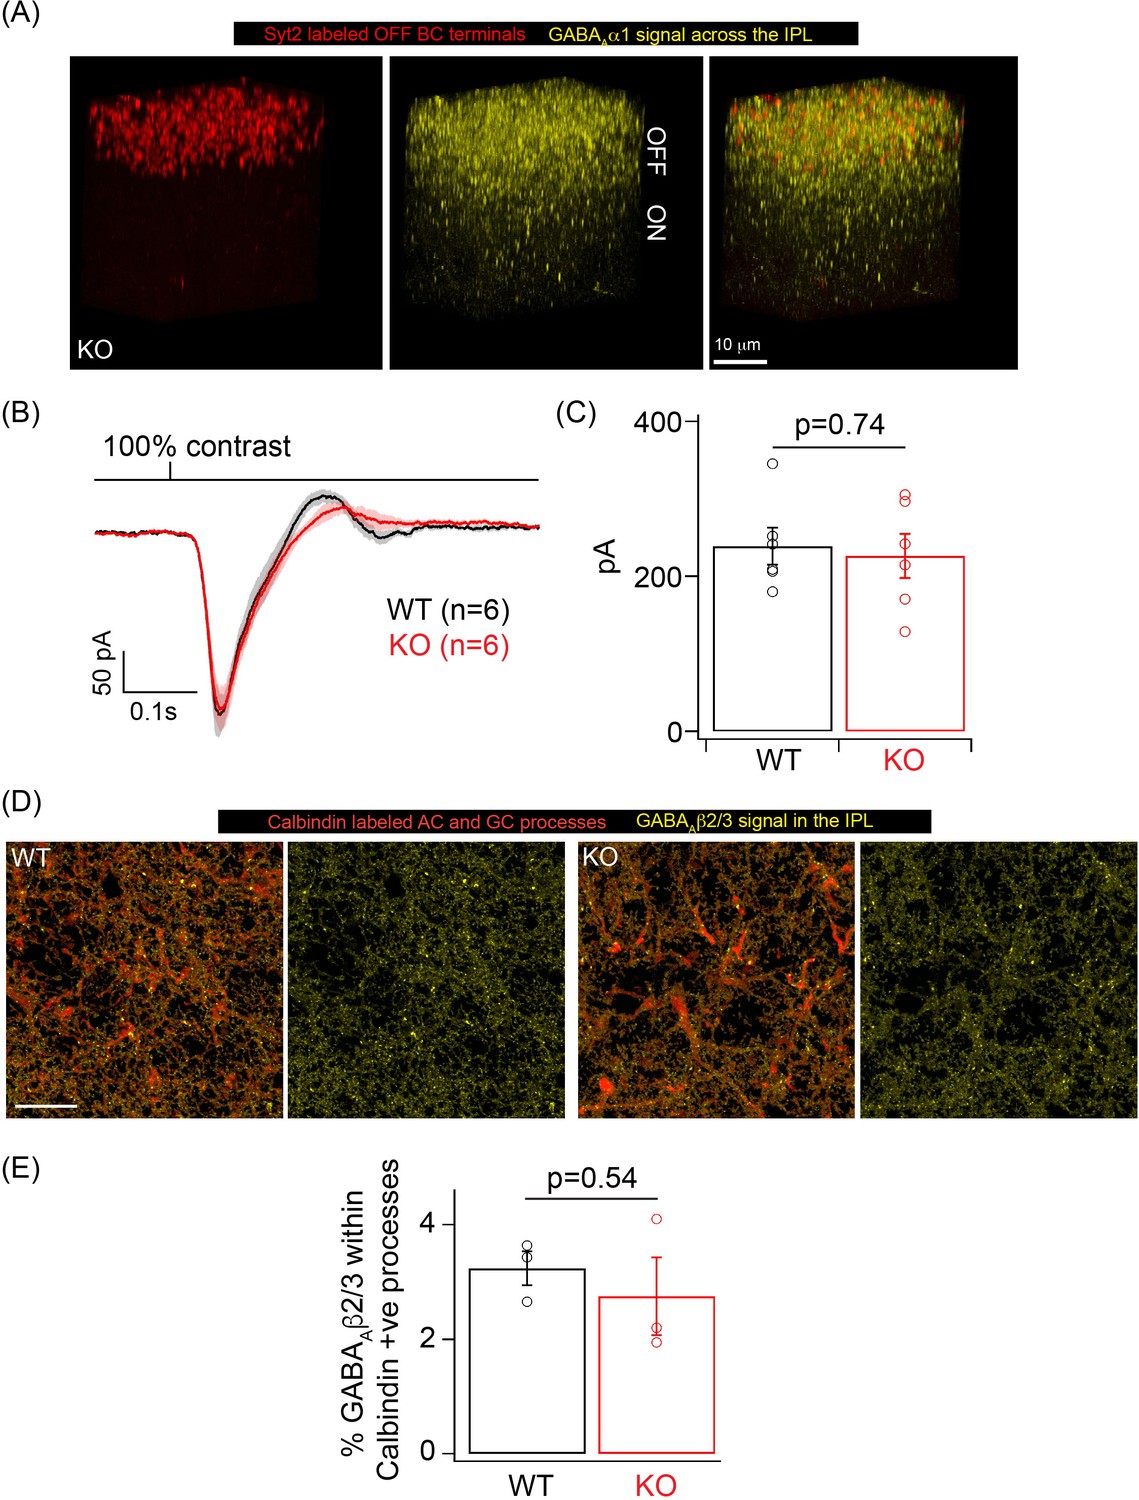
GABAA inhibition remains intact in OFF cone bipolar cell (CBC), amacrine cell (AC), and ganglion cell (GC) processes in the knockout (KO) mouse.
(A) GABAAα1 immunolabeling (yellow) and Synaptotagmin2 (Syt2) immunolabeling (red) of OFF CBC terminals in KO retina shows robust GABAAα1 immunoreactivity in the OFF sublamina. IPL: inner plexiform layer. (B) Average excitatory synaptic currents across OFF alpha transient retinal GCs (RGCs) in response to 10 ms flash of 100% contrast at a background luminance of 1000R*/S cone/s. (C) Bar graph showing quantification of the peak excitatory current response in (B) for OFF alpha transient RGCs in WT (mean ± sem = 239.2 ± 23.75 pA) and KO (mean ± sem = 226.4 ± 28.5 pA) retina. (D) GABAAβ2/3 receptor signal (yellow) within calbindin positive AC and GC processes across the ON lamina of the IPL in WT and KO retina. Scale bar = 20 μm. (E) Quantification of the percentage occupancy of GABAAβ2/3 signal within calbindin AC and GC processes in WT (mean ± sem = 3.2 ± 0.3) and KO (mean ± sem = 2.8 ± 0.7) retinas (n = 3 retinas).
Figure 2
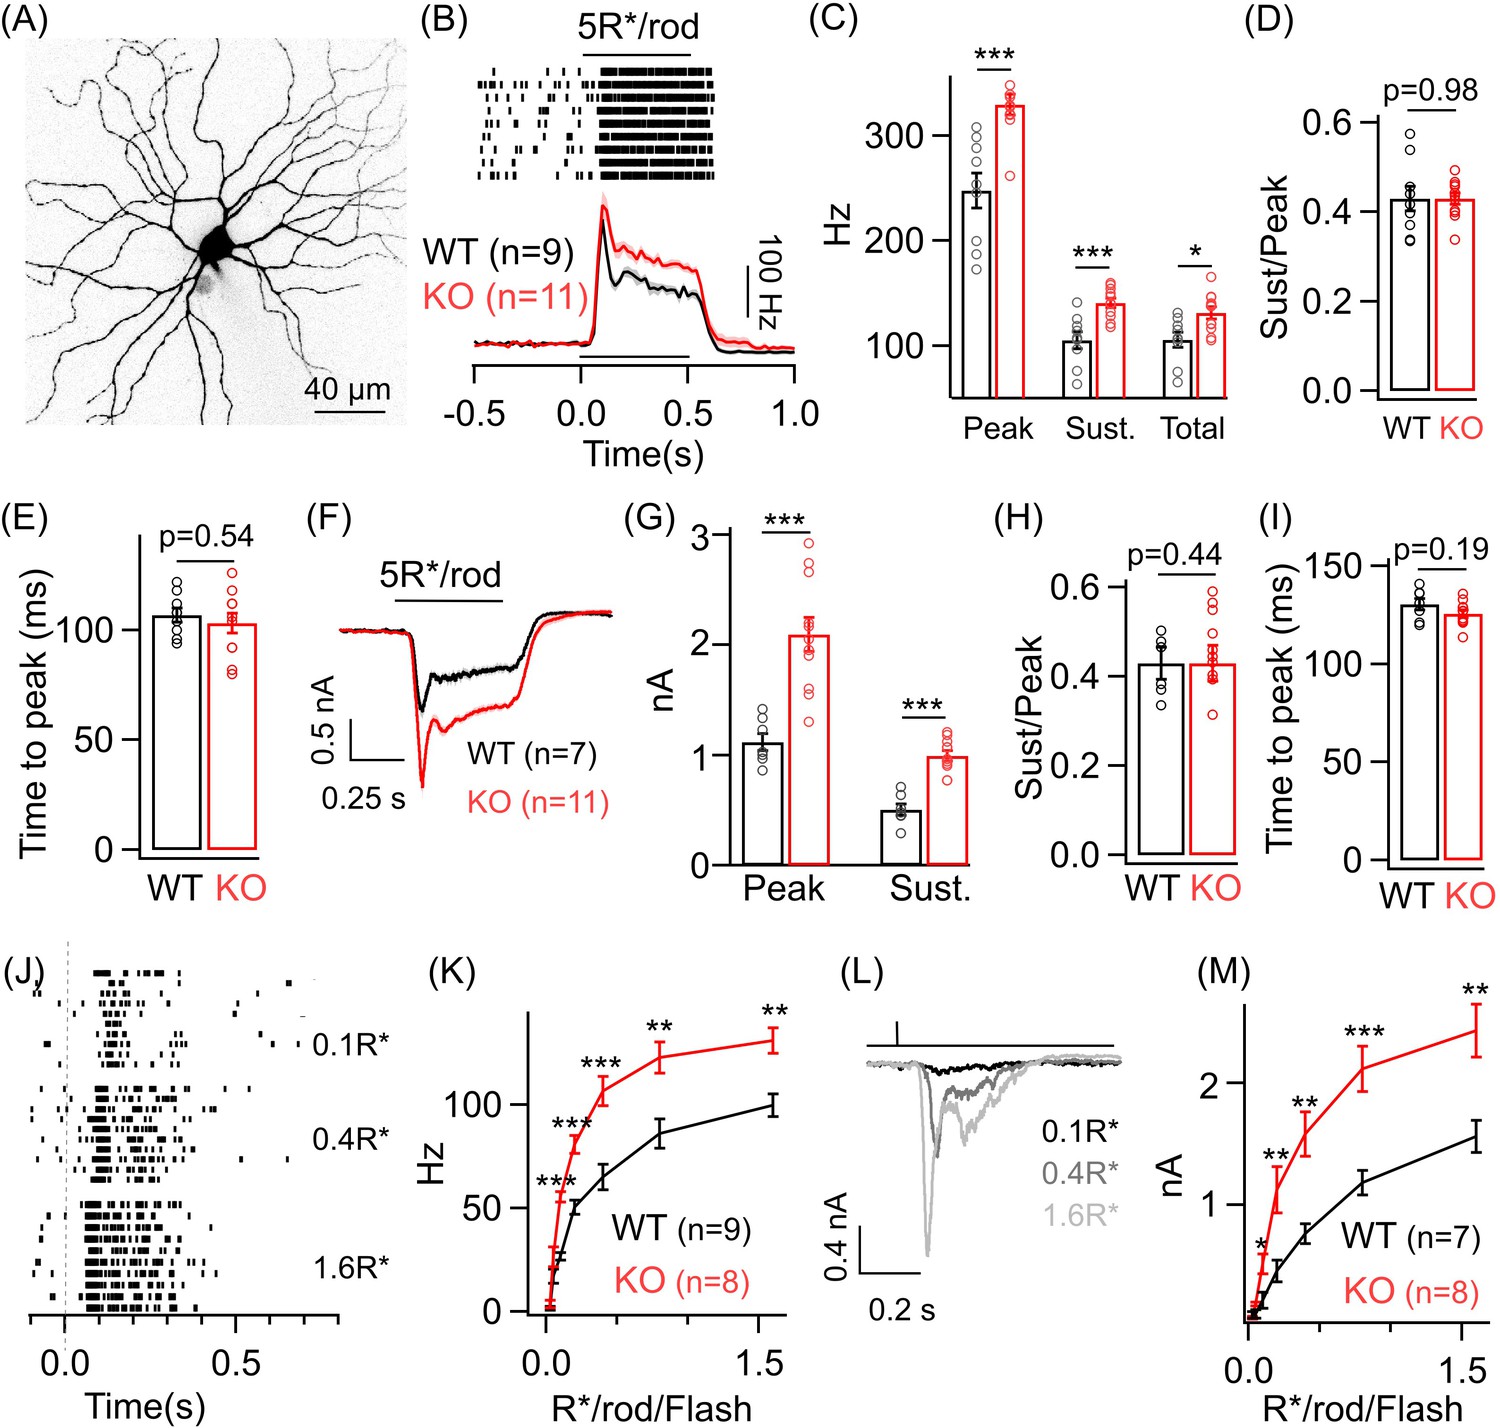
Dim light sensitivity of ONα ganglion cells (GCs) is perturbed without GABAA presynaptic inhibition.
(A) Exemplar image of an ONα GC filled with dye post-recording. (B) Raster plot showing an ONα GC spike response to a 0.5 s light step (that leads to five opsin photoisomerizations (R*) per rod photoreceptor) from darkness. Bottom panel shows average peri-stimulus time histograms (PSTH; binwidth of 20 ms) of the spike response from several ONα GCs in WT and KO mouse retina. Error bars (sem) shown in shaded colors henceforth for all average traces. The sample size for each experiment henceforth is mentioned next to the average traces and is the same for the following quantification represented in bar plots. (C) Bar plot comparing the peak (mean ± sem = 247.7 ± 16.8 Hz in WT and 329.7 ± 9.7 Hz in KO retina), sustained (mean ± sem = 105.4 ± 8.1 Hz in WT and 140.8 ± 4.4 Hz in KO retina) and total firing rate (mean ± sem = 105.6 ± 7.4 Hz in WT and 131.5 ± 5.7 Hz in KO retina) across ONα GCs as shown in (B) between WT and KO retina. (D) Bar plot comparing the ratio of sustained to peak firing rate of individual ONα GCs in WT (mean ± sem = 0.43 ± 0.03) and KO (mean ± sem = 0.43 ± 0.01) retina in response to light stimulus shown in (B). (E) Bar graph comparing the time to peak of spike PSTH (with a binwidth of 2 ms) across ONα GCs in WT (mean ± sem = 106.9 ± 3.2 ms) and KO (mean ± sem = 103.3 ± 4.5 ms) retina for the same data shown in (B). (F) Average excitatory synaptic currents measured across WT and KO ONα GCs elicited by the light stimulus described in (B). (G, H) Bar plot showing the light-evoked peak (mean ± sem = 1120.5 ± 78.8 pA in WT and 2096.2 ± 155.6 pA in KO retina) and sustained responses (mean ± sem = 505.2 ± 51.9 pA in WT and 993.7 ± 45.5 pA in KO retina) and their ratio (mean ± sem = 0.45 ± 0.04 in WT and 0.49 ± 0.04 in KO retina) analyzed from individual ONα GCs. (I) Bar graph comparing the time to peak of the excitatory current response across ONα GCs in WT (mean ± sem = 130.5 ± 3 ms) and KO (mean ± sem = 125.8 ± 1.9 ms) retina for the same data shown in (F). (J) Spike trains from an exemplar ONα GC showing the response to brief (30 ms duration) light flashes that elicit 0.1, 0.4 and 1.6 R*/rod. (K) Peak spike rates of ONα GC in response to increasing flash strengths at dim light levels in WT and KO retinas. (L) Excitatory synaptic currents measured from an exemplar WT ONα GC elicited by light flashes shown in (J). (M) Peak excitatory current response of ONα GCs in response to increasing flash strengths at dim light levels in WT and KO retinas.
Figure 3 with 2 supplements
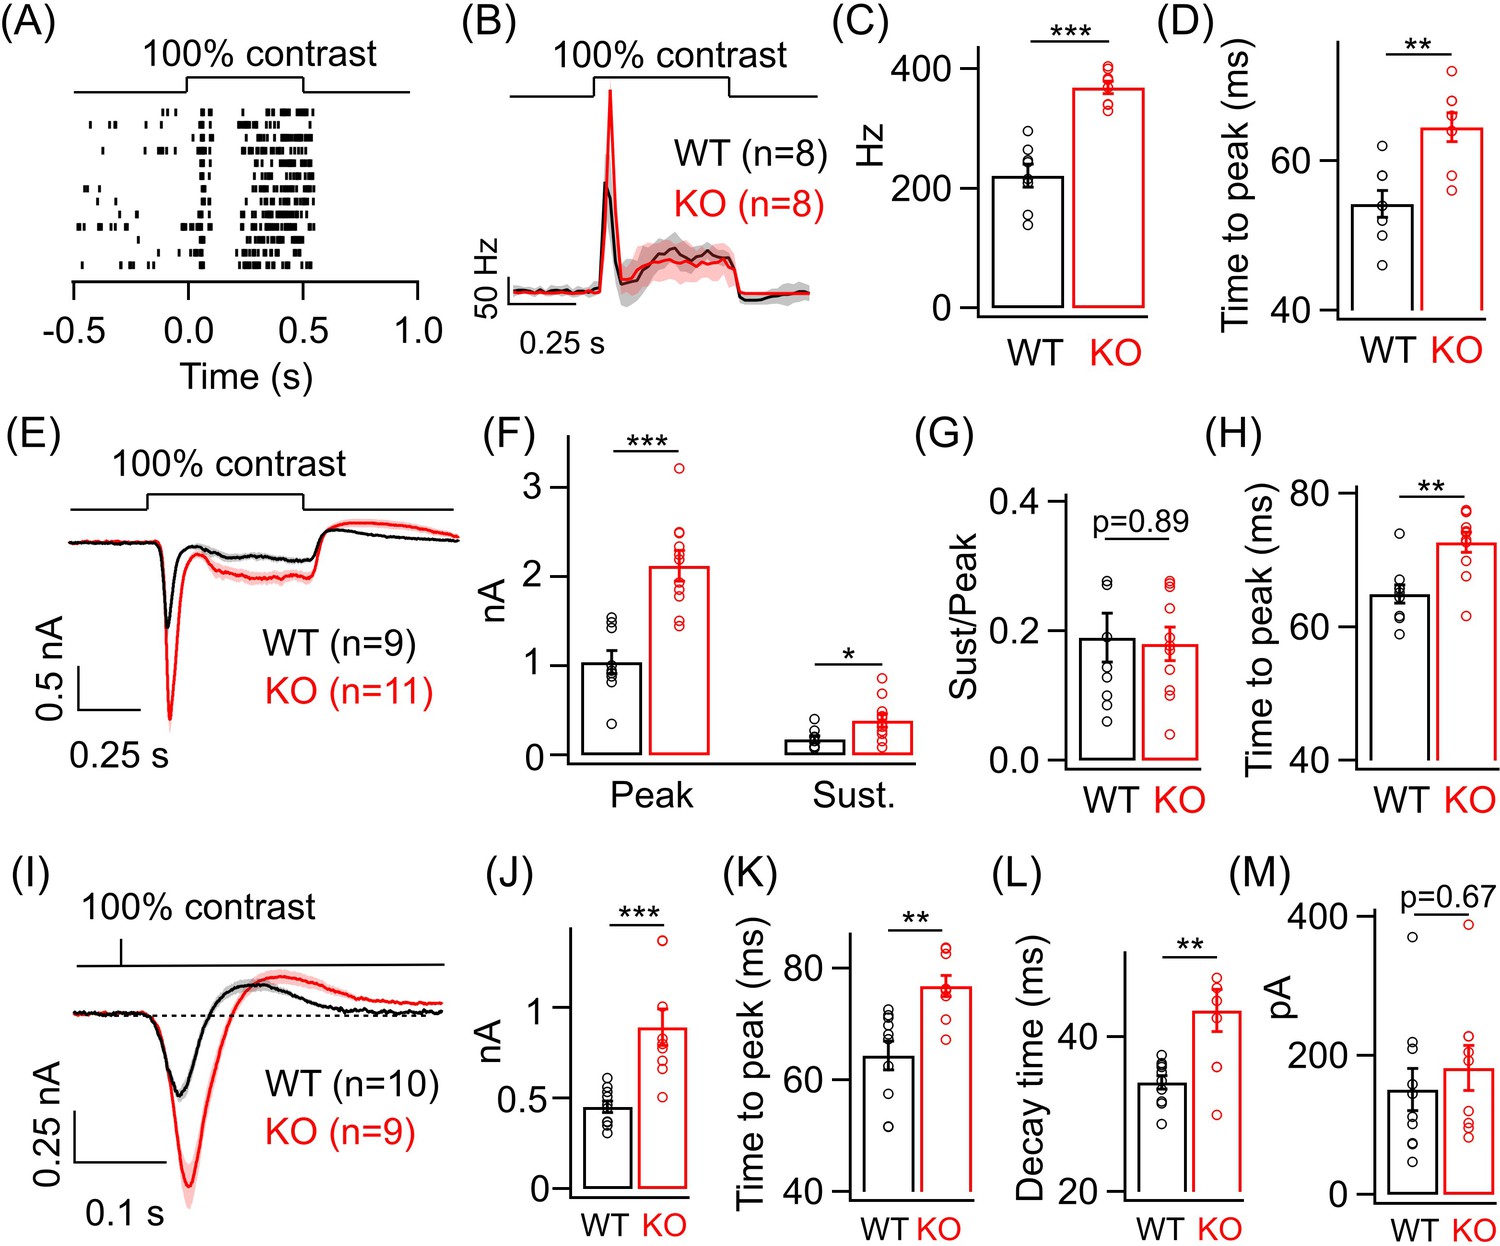
Lack of GABAA presynaptic inhibition alters ONα ganglion cell (GC) light responses at cone light levels.
(A) Exemplar spike raster from an ONα GC in WT retina in response to a 100% contrast step from a background luminance of ~1000R*/S cone/s, where cones dominate retinal responses. (B) Average PSTH (binwidth of 20 ms) of spike response to the light step in A across several ONα GCs with spike rate expressed in Hz (spikes/s). (C) Bar plot showing quantification of the peak firing rates across ONα GCs in WT (mean ± sem = 221.2 ± 18.9 Hz) and KO retina (mean ± sem = 368.5 ± 10.2 Hz). (D) Bar graph comparing the time to peak of spike PSTH (with a binwidth of 2 ms) across ONα GCs in WT (mean ± sem = 54.3 ± 1.8 ms) and KO (mean ± sem = 64.5 ± 1.9 ms) retina for the same data shown in (B). (E) Average excitatory synaptic current elicited in response to a 100% contrast step across ONα GCs in WT and KO retina. (F) Quantification of peak and sustained current amplitudes in response to the 100% contrast step in E. The mean ± sem peak amplitudes were 1042.3 ± 127.9 pA in WT retina and 2126 ± 169.5 pA in KO retina. The mean ± sem amplitudes of the sustained phase were 176.7 ± 36.2 pA in WT retina and 386.9 ± 75.5 pA in KO retina. (G) Quantification of ratio of sustained to peak amplitude in F. The mean ± sem ratios were 0.19 ± 0.04 in WT retina and 0.18 ± 0.03 in KO retina. (H) Bar graph comparing the time to peak of the excitatory current response across ONα GCs in WT (mean ± sem = 64.9 ± 1.4 ms) and KO (mean ± sem = 72.7 ± 1.5 ms) retina for the same data shown in (E-G). (I) Average excitatory synaptic currents in response to 10 ms flash of 100% contrast across ONα GCs in WT and KO retina. (J) Quantification of peak current amplitude in response to the 10 ms flash of 100% contrast step in WT (mean ± sem = 451.6 ± 32.2 pA) and KO (mean ± sem = 890.9 ± 100.8 pA) retina as shown in I. (K) Bar graph comparing the time to peak of the excitatory current response across ONα GCs in WT (mean ± sem = 64.4 ± 2.6 ms) and KO (mean ± sem = 76.8 ± 1.9 ms) retina for the same data shown in (I). (L) Quantification of decay time of the excitatory current response, i.e. time for the response in (I) to return from the peak to the baseline shown in dotted line, across ONα GCs in WT (mean ± sem = 34.1 ± 0.9 ms) and KO (mean ± sem = 43.4 ± 2.8 ms) retina for the same data shown in (I). (M) Quantification of the rebound amplitude of the excitatory current response across ONα GCs in WT (mean ± sem = 151 ± 30.4 pA) and KO (mean ± sem = 182.4 ± 32.2 pA) retina for the same data shown in (I).
Figure 3—figure supplement 1
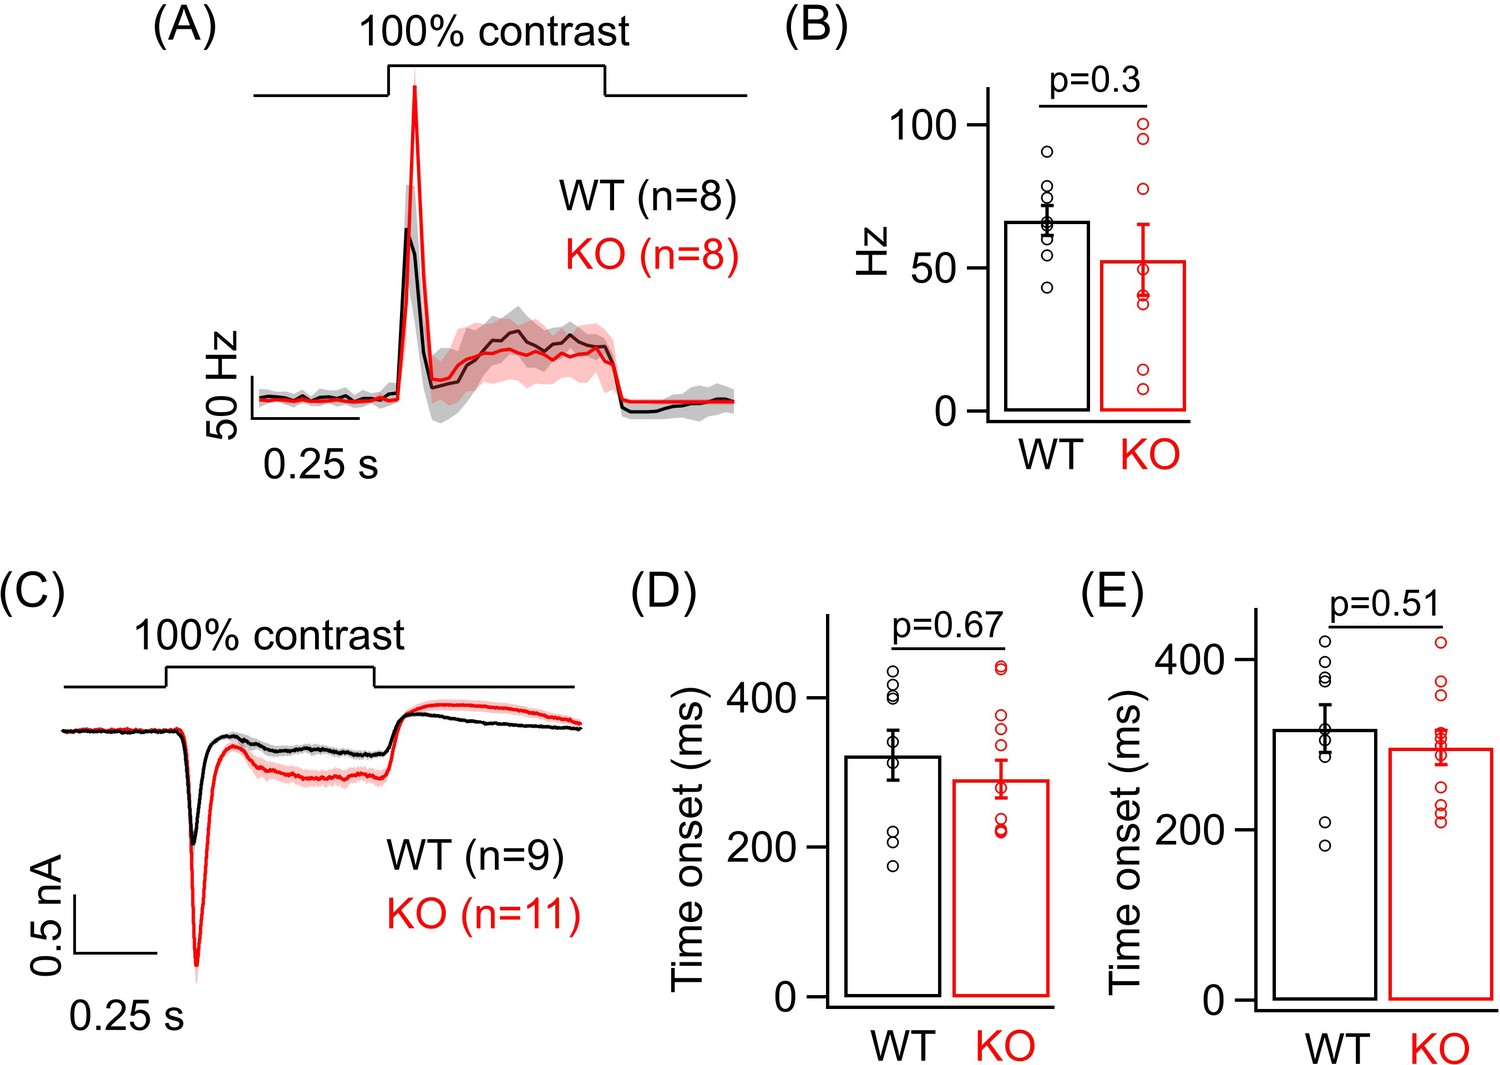
Analysis of the sustained phase of the light-evoked spike and excitatory current response in ONα ganglion cells (GCs).
(A) Figure 3B – Average PSTH (binwidth of 20 ms) of light-evoked spike response. (B) Bar plot comparing the average sustained firing rate across ONα GCs as between WT (mean ± sem = 66.56 ± 5.2 Hz) and KO (mean ± sem = 52.8 ± 12.4 Hz) retina from the same PSTHs as in Figure 3B. (C) Figure 3E – Average excitatory synaptic current elicited in response to a 100% contrast step across ONα GCs in WT and KO retina. (D) Bar plot comparing the time of onset (analyzed by fitting a line; see 'Materials and methods') of the sustained phase of the excitatory current response of ONα GCs between WT (mean ± sem = 323.6 ± 33.3 ms) and KO (mean ± sem = 291.6 ± 25.4 ms) retina from the dataset shown in Figure 3E. (E) Bar plot comparing the time of onset (analyzed by fitting an exponential; see 'Materials and methods') of the sustained phase of the excitatory current response of ONα GCs between WT (mean ± sem = 319.3 ± 27.7 ms) and KO (mean ± sem = 297.1 ± 20.4 ms) retina from the dataset shown in Figure 3E.
Figure 3—figure supplement 2
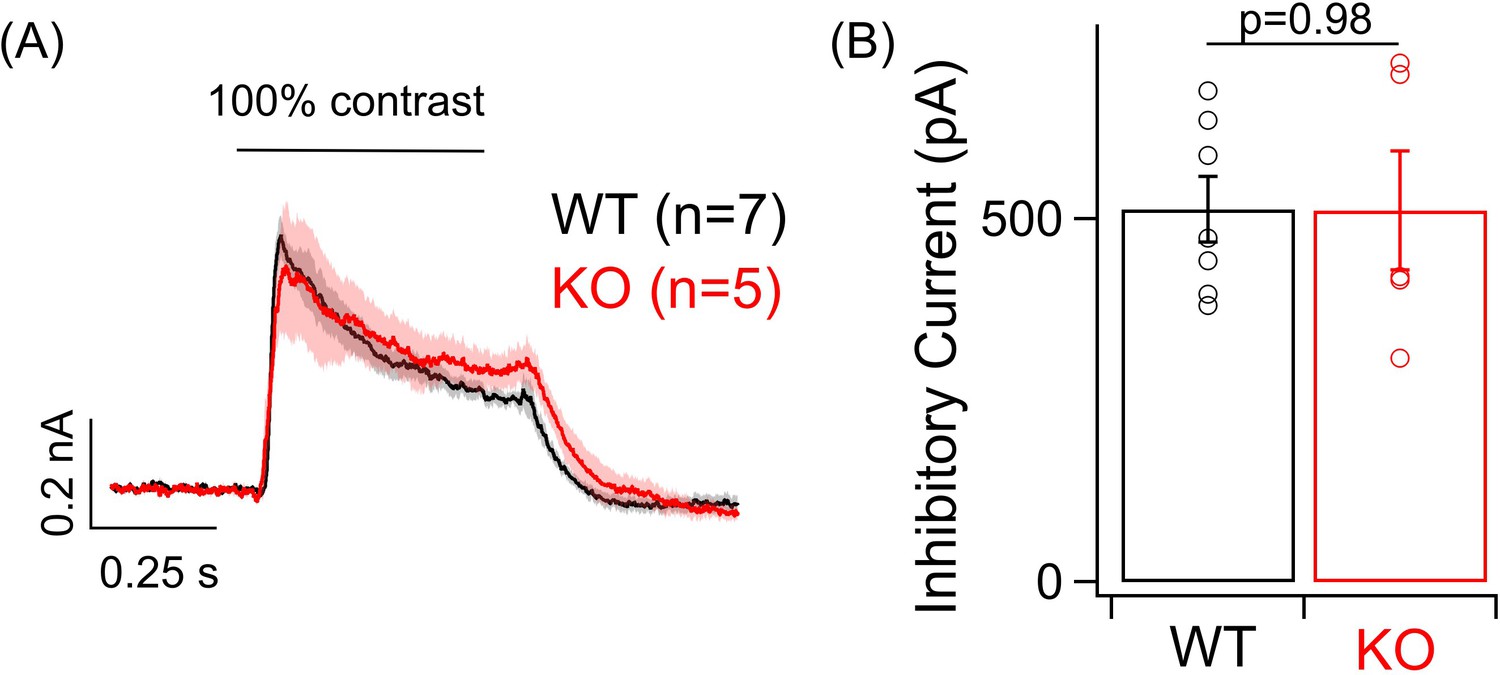
Post-synaptic inhibition remains unchanged in ONα ganglion cell (GC) in the knockout (KO) retina.
(A) Average inhibitory postsynaptic currents in response to a positive 100% contrast step increment at a background luminance of 1000R*/S cone/s measured from voltage-clamp recording of ONα GC in WT and KO retina. (B) Bar plot comparing the peak inhibitory current response to the light stimulus in (A) across ONα GCs in the WT and KO mouse retina. The mean ± sem peak amplitudes of ONα GC light-evoked inhibitory currents were 512.9 ± 44.9 pA in WT retina and 511.2 ± 82.1 pA in KO retina.
Figure 4
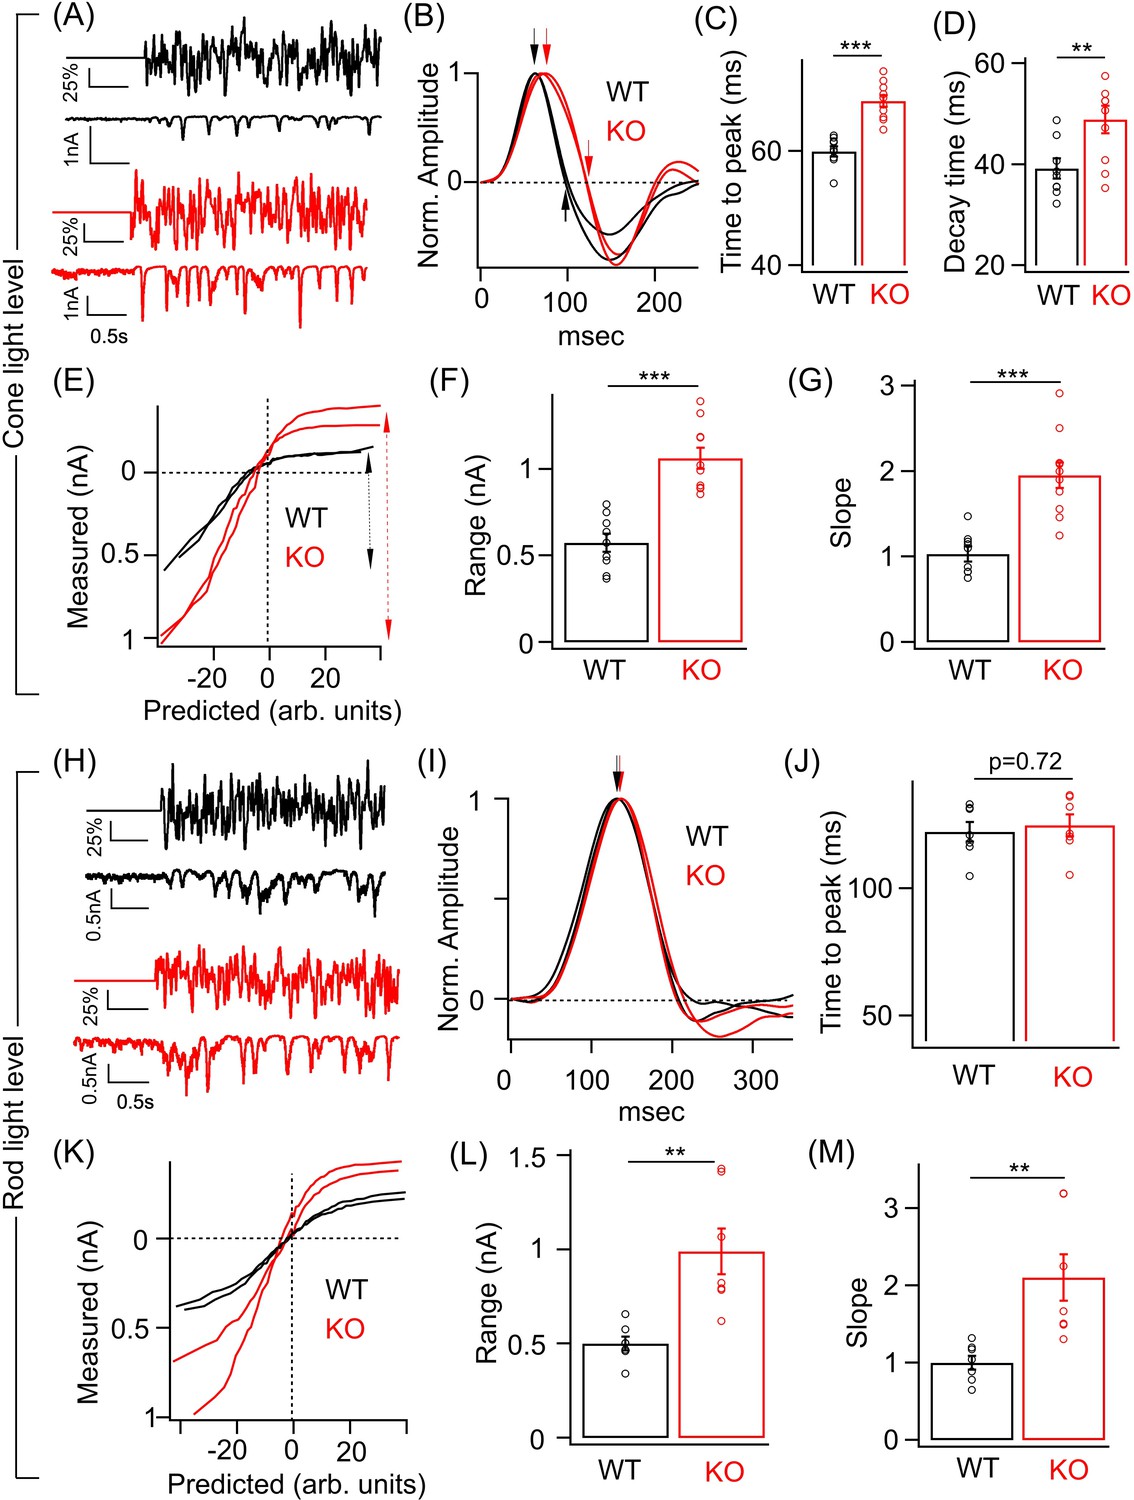
Perturbed ONα ganglion cell (GC) responses to time-varying light stimuli in absence of GABAA presynaptic inhibition.
(A) (Top) Excerpt of the time-varying random white noise stimulus presented at a background luminance of 1000 R*/S cone/s. (Bottom) The resulting excitatory synaptic response used to derive the linear filter and static nonlinearity that relate the stimulus to the response. (B) Exemplar time-reversed linear filters for the responses to noise stimuli for two ONα GCs from WT and KO retina. The black and red arrows point to the time to peak and the time point of decay to the baseline. Quantification of the time to peak (C) and the decay time (D) in linear filters for responses to stimuli (cone light levels) across ONα GCs in WT (n = 9 cells) and KO (n = 10 cells) retina. The mean ± sem peak times to peak of the linear filters were 59.9 ± 0.9 ms in WT retina and 68.5 ± 0.9 ms in KO retina. The mean ± sem decay times of the linear filters were 39.2 ± 2 ms in WT retina and 48.9 ± 2.7 ms in KO retina. (E) Exemplar static nonlinearities of two ONα GCs from KO and WT retina for the noise stimuli. (F) Quantification of the response range (denoted by the dotted black and red arrows) in (E) across ONα GCs in WT (n = 9 cells; mean ± sem = 573.3 ± 52 pA) and KO (n = 10 cells; mean ± sem = 1063.5 ± 61.4 pA) retina. (G) Quantification of the nonlinearity slope (see 'Materials and methods') across ONα GCs in WT (n = 9 cells; mean ± sem = 1 ± 0.1) and KO (n = 10 cells; mean ± sem = 2 ± 0.2) retina. (H) (Top) Excerpt of the time-varying stimulus presented at a dim background luminance of 10 R*/rod/s. (Bottom) The resulting excitatory synaptic response used to derive the linear filter and static nonlinearity that relate the stimulus to the response. (I) Exemplar time-reversed linear filters for the responses to noise stimuli (under rod light levels) for two ONα GCs from WT and KO retina. The black and red arrows point to the time to peak. (J) Quantification of the time to peak in linear filters for responses to noise stimuli (rod light levels) across ONα GCs in WT (n = 7 cells; mean ± sem = 122.2 ± 3.9 ms) and KO (n = 7 cells; mean ± sem = 124.8 ± 4.3 ms) retina. (K) Exemplar static nonlinearities of ONα GC responses for the noise stimuli from WT and KO retina. (L) Quantification of the response range across ONα GCs in WT (n = 7 cells; mean ± sem = 500.6 ± 37.1 pA) and KO (n = 7 cells; mean ± sem = 990 ± 121.9 pA) retina. (M) Quantification of the nonlinearity slope (see 'Materials and methods') across ONα GCs in WT (n = 7 cells; mean ± sem = 1 ± 0.1) and KO (n = 7 cells; mean ± sem = 2.1 ± 0.3) retina.
Tables
Key resources table
| Reagent type (species) or resource | Designation | Source or reference | Identifiers | Additional information |
|---|---|---|---|---|
| Genetic reagent (Mus musculus) | Gabrg2 | Jackson Laboratory | JAX Stock# 016830 RRID:IMSR_JAX:016830 | Transgenic mouse; floxed mice with loxP sites flanking Gabrg2 |
| Genetic reagent (Mus musculus) | Ai9 | Jackson Laboratory | JAX Stock# 007909 RRID:IMSR_JAX:00790 | Transgenic mouse; cre-dependent tdTomato expression |
| Genetic reagent (Mus musculus) | Grm6-Cre | Rachel Wong (Hoon et al., 2015) | N/A | Transgenic mouse; cre-driver line |
| Antibody | Anti-PKC clone MC5 (mouse monoclonal) | Sigma | Catalog # P5704; RRID:AB_477375 | (1:1000) |
| Antibody | Anti-GABAAα1 (guinea pig polyclonal) | Fritschy and Mohler, 1995 | Generated in Jean-Marc Fritschy’s Lab | (1:5000) |
| Antibody | Anti-GABAC(rabbit polyclonal) | Enz et al., 1996 | Generated in Heinz Wässle and Joachim Bormann’s Lab. | (1:500) |
| Antibody | Anti-Dsred (rabbit polyclonal) | Clontech | (1:1000) | |
| Antibody | Anti-synaptotagmin2 (mouse monoclonal) | Zebrafish International Resource center | Cat# znp-1; RRID:AB_10013783 | (1:1000) |
| Antibody | Anti-calbindin (rabbit polyclonal) | Swant Inc. | Swant Cat# CB38; RRID:AB_10000340 | (1:1000) |
| Antibody | Anti-GABAAβ2/3, (mouse monoclonal) | MilliporeSigma | Cat# MAB341; | (1:500) |
| Chemical compound, drug | Ames | Sigma | A1420 | |
| Chemical compound, drug | Alexa 594 | Thermofisher | A10442 | |
| Chemical compound, drug | Vectashield | Vector Labs | Cat# H-1000, RRID:AB_2336789 | |
| Chemical compound, drug | GABAzine (SR-95531) | Sigma | S106 | |
| Chemical compound, drug | GABA | Sigma | A2129 | |
| Chemical compound, drug | TPMPA | Tocris | 1040 | |
| Software, algorithm | Symphony | https://github.com/symphony-das | ||
| Software, algorithm | ScanImage | http://scanimage.vidriotechnologies.com/ PMID:12801419 | RRID:SCR_014307 | |
| Software, algorithm | MATLAB | http://www.mathworks.com/products/matlab/ | RRID:SCR_001622 | |
| Software, algorithm | IGOR Pro | https://www.wavemetrics.com/ | RRID:SCR_000325 | |
| Software, algorithm | Amira | https://www.thermofisher.com/global/en/home/industrial/electron-microscopy/electron-microscopy-instruments-workflow-solutions/3d-visualization-analysis-software/amira-life-sciences-biomedical.html | RRID:SCR_007353 | |
| Software, algorithm | ImageJ | https://ImageJ.net | RRID:SCR_003070 |
Additional files
Download links
A two-part list of links to download the article, or parts of the article, in various formats.
Downloads (link to download the article as PDF)
Open citations (links to open the citations from this article in various online reference manager services)
Cite this article (links to download the citations from this article in formats compatible with various reference manager tools)
GABAA presynaptic inhibition regulates the gain and kinetics of retinal output neurons
eLife 10:e60994.
https://doi.org/10.7554/eLife.60994


