Improved lipidomic profile mediates the effects of adherence to healthy lifestyles on coronary heart disease
- Department of Epidemiology and Biostatistics, School of Public Health, Peking University Health Science Center, China
- Departments of Epidemiology and Biostatistics, Harvard T.H. Chan School of Public Health, United States
- Peking University Institute of Public Health & Emergency Preparedness, China
- Chinese Academy of Medical Sciences, China
- Medical Research Council Population Health Research Unit at the University of Oxford, United Kingdom
- Clinical Trial Service Unit & Epidemiological Studies Unit (CTSU), Nuffield Department of Population Health, University of Oxford, United Kingdom
- NCDs Prevention and Control Department, Hunan Center for Disease Control & Prevention, China
- Liuyang Center for Disease Control & Prevention, Liuyang, China
- China National Center for Food Safety Risk Assessment, China
- Key Laboratory of Molecular Cardiovascular Sciences (Peking University), Ministry of Education, China
Figures
Figure 1 with 13 supplements
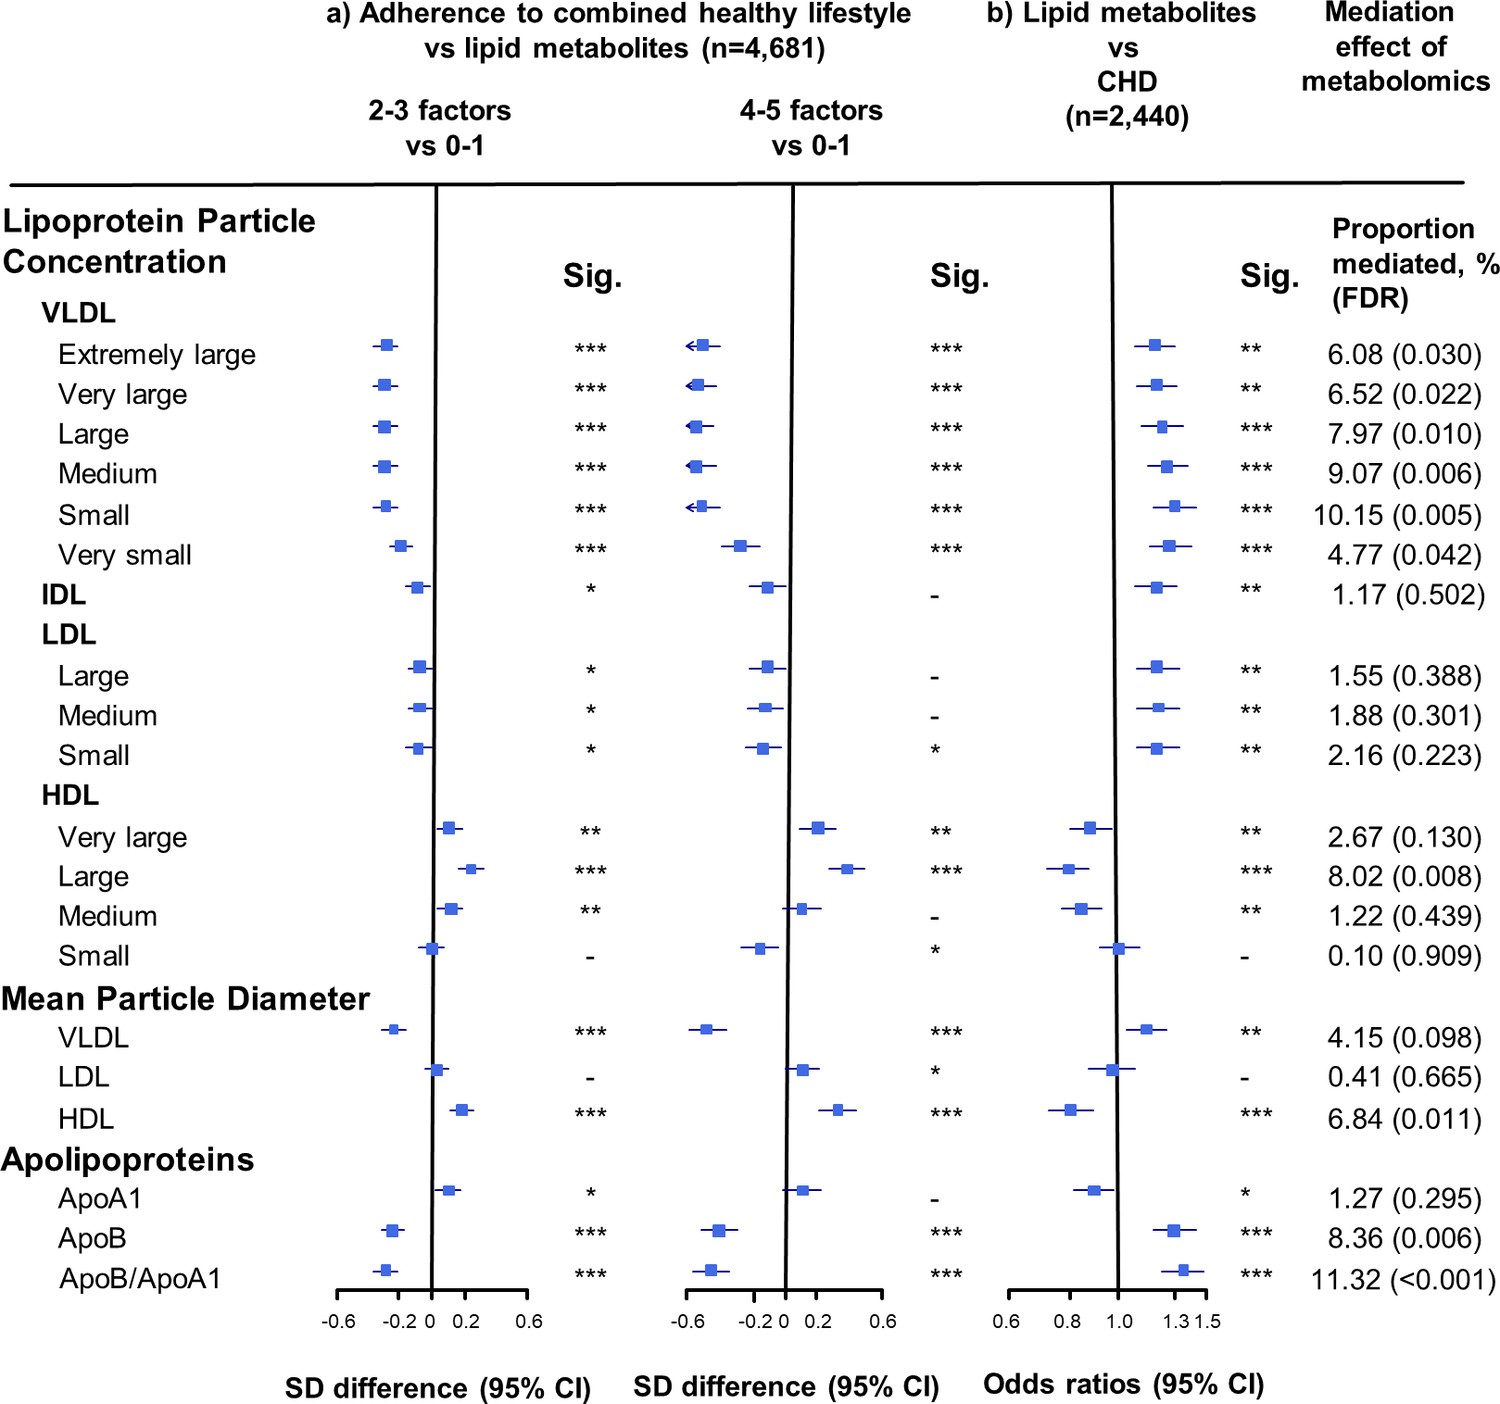
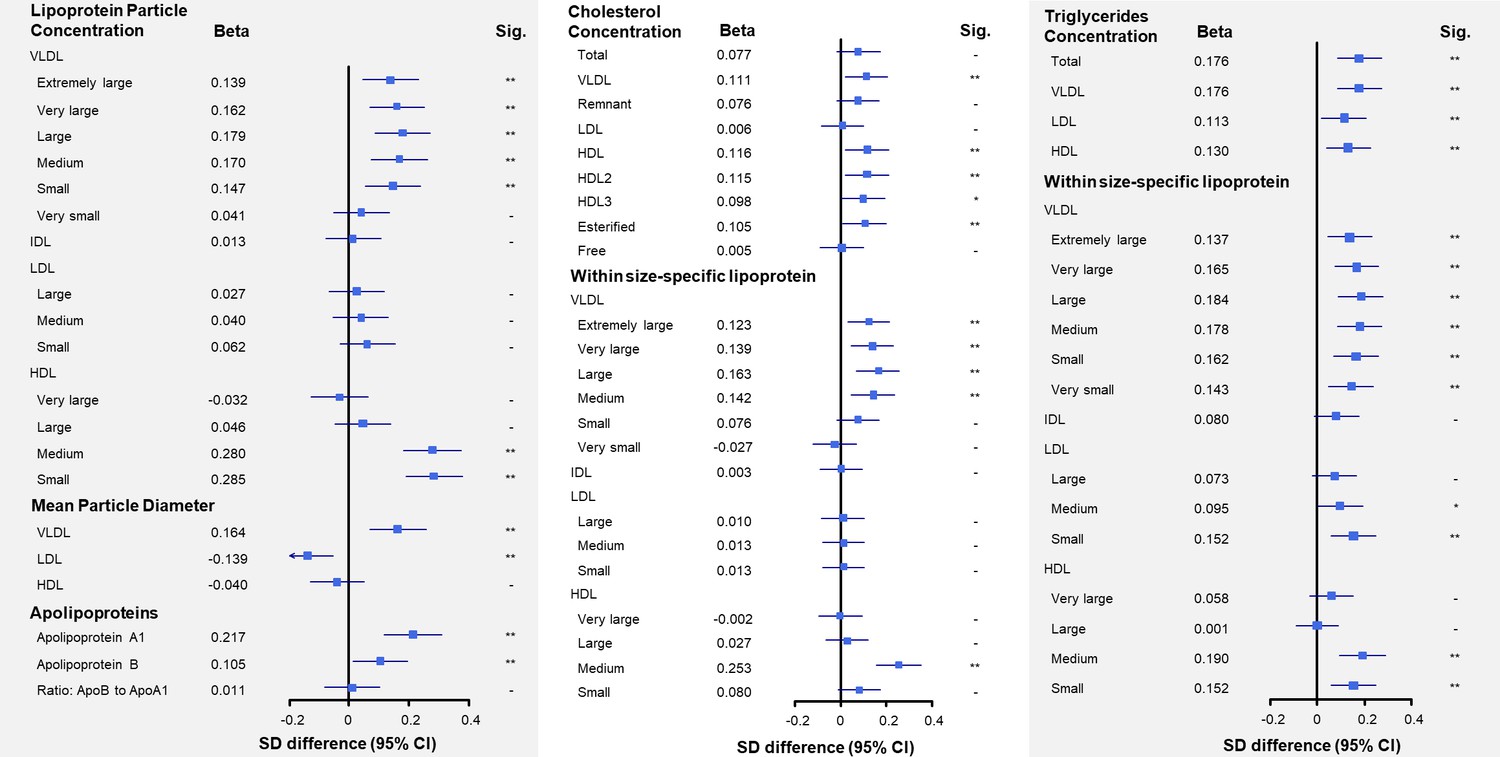
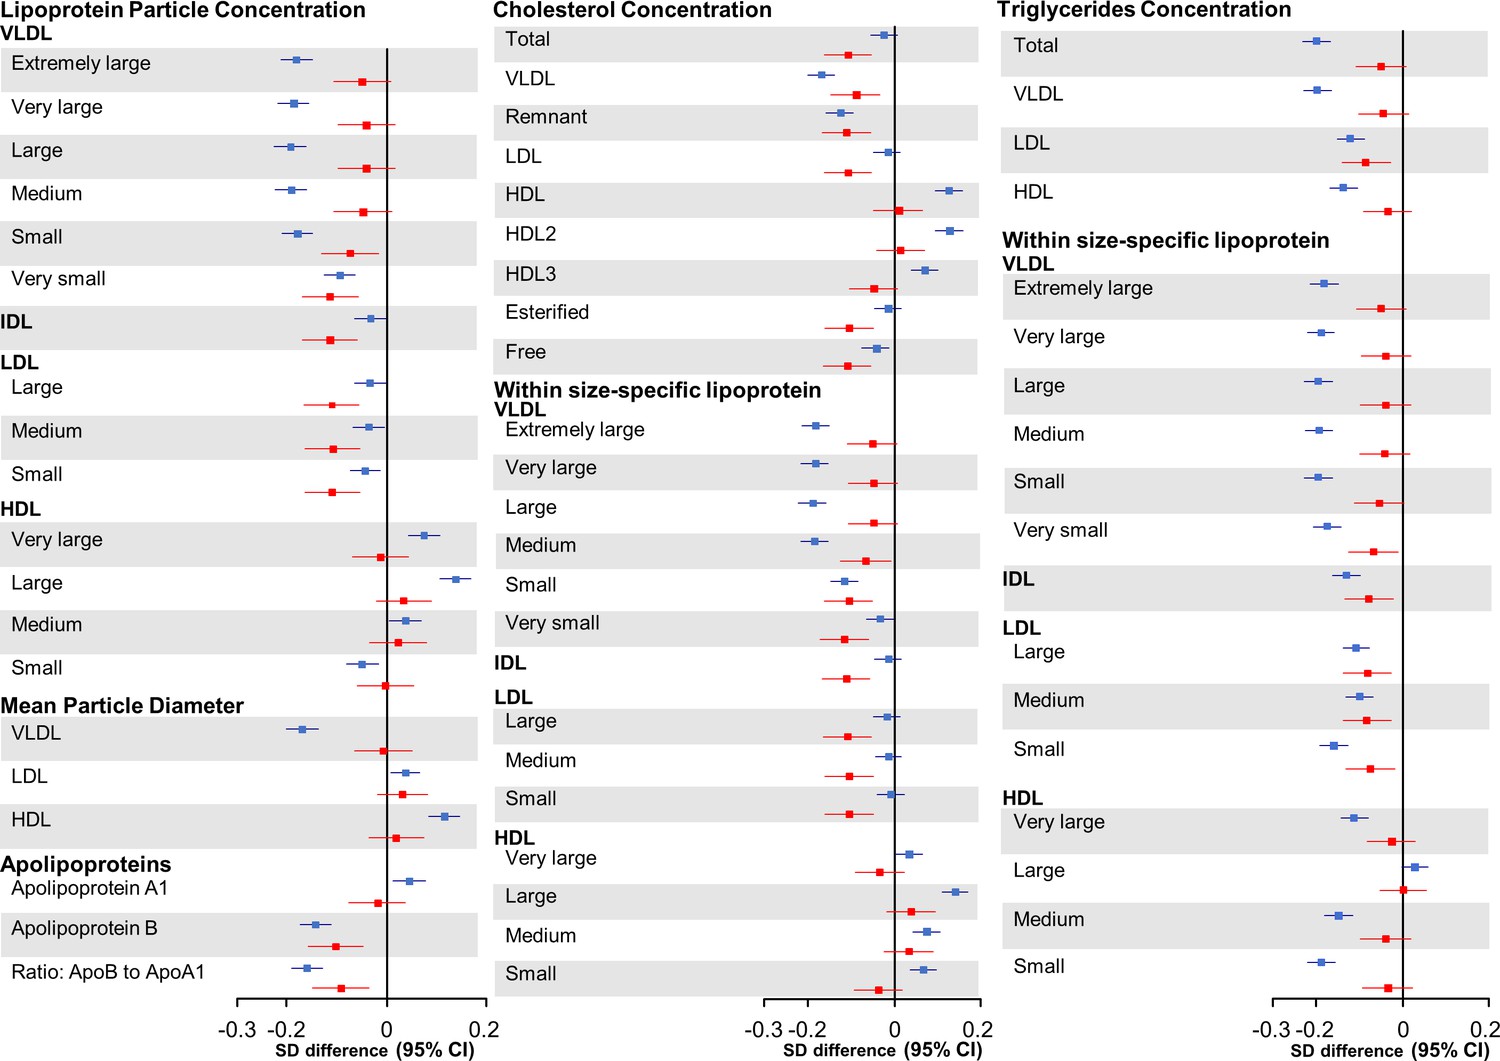
Associations of size-specific lipoprotein particle concentrations, mean lipoprotein particle diameter, and apolipoprotein concentrations with combined healthy lifestyle and risk of coronary heart disease.
(a) SD difference and 95% CI are for comparison of participants who adopted two to three or four to five combined healthy lifestyles with participants who adopted zero to one. Multivariable model was adjusted for: age, sex, fasting time, study areas, education level, and case/control status. (b) Odds ratio and 95% CI are for the associations of 1-SD metabolic markers increasing with CHD risk. Multivariable model was adjusted for: age, sex, fasting time, study areas, education level, and smoking status. Horizontal lines represent 95% CIs. ApoA1 = apolipoprotein A1; ApoB = apolipoprotein B; CHD = coronary heart disease; HDL = high-density lipoprotein; IDL = intermediate-density lipoprotein; LDL = low-density lipoprotein; Sig. = significance ***p≤0.0001, **p≤0.01, *p≤0.05, – p>0.05 (false discovery rate [FDR]–adjusted p-values); VLDL = very low-density lipoprotein.
-
Figure 1—source data 1
Associations of size-specific lipoprotein particle concentrations, mean lipoprotein particle diameter, and apolipoprotein concentrations with combined healthy lifestyle and risk of coronary heart disease.
- https://cdn.elifesciences.org/articles/60999/elife-60999-fig1-data1-v1.docx
Figure 1—figure supplement 1
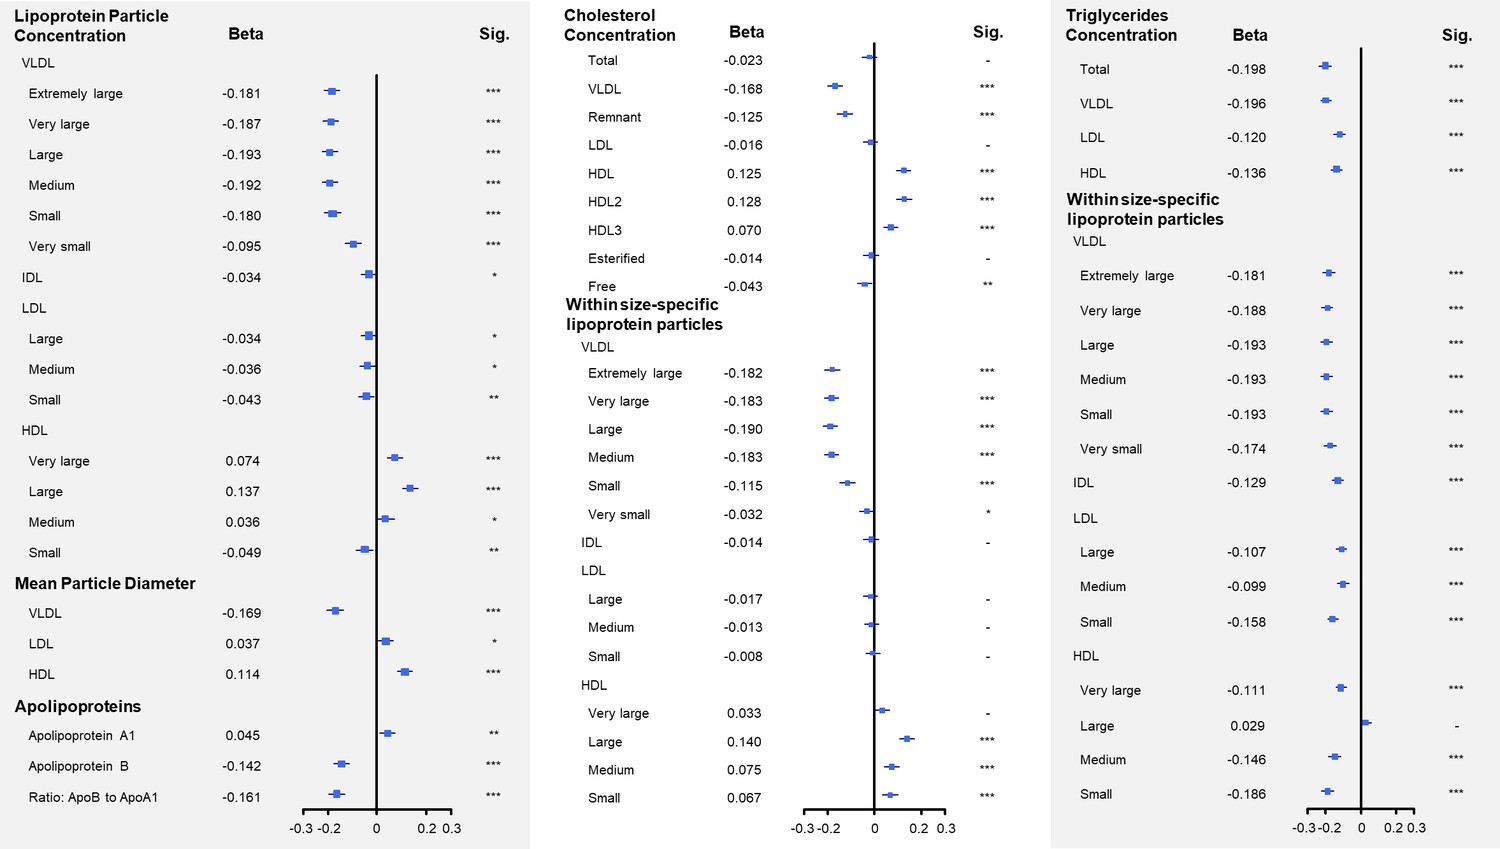
Associations between number of healthy lifestyles and lipid metabolites.
Betas are linear regression coefficients per one increase in number of healthy lifestyles. Multivariable model was adjusted for: age, sex, fasting time, study areas, education level, and case/control status. Horizontal lines represent 95% CIs. Sig. = significance ***p≤0.0001, **p≤0.01, *p≤0.05, – p>0.05 (false discovery rate [FDR]–adjusted p-values); Abbreviations as in Figure 1.
Figure 1—figure supplement 2

Associations between number of healthy lifestyles and lipid metabolites without adjustment for fasting time.
Betas are linear regression coefficients per one increase in number of healthy lifestyles. Multivariable model was adjusted for: age, sex, study areas, education level, and case/control status. Horizontal lines represent 95% CIs. Sig. = significance ***p≤0.0001, **p≤0.01, *p≤0.05, – p>0.05 (false discovery rate [FDR]–adjusted p-values); Abbreviations as in Figure 1.
Figure 1—figure supplement 3
Associations between number of healthy lifestyles and lipid metabolites with a more strict definition of healthy adiposity (body mass index in the range of 18.5–24.9 kg/m2 and waist circumference <90 cm in men and <80 cm in women).
Betas are linear regression coefficients per one increase in number of healthy lifestyles. Multivariable model was adjusted for: age, sex, fasting time, study areas, education level, and case/control status. Horizontal lines represent 95% CIs. Sig. = significance ***p≤0.0001, **p≤0.01, *p≤0.05, – p>0.05 (false discovery rate [FDR]–adjusted p-values); Abbreviations as in Figure 1.
Figure 1—figure supplement 4
Associations between number of healthy lifestyles and lipid metabolites without including moderate alcohol consumption as a healthy lifestyle.
Betas are linear regression coefficients per one increase in number of healthy lifestyles. Multivariable model was adjusted for: age, sex, fasting time, study areas, education level, and case/control status. Horizontal lines represent 95% CIs. Sig. = significance ***p≤0.0001, **p≤0.01, *p≤0.05, – p>0.05 (false discovery rate [FDR]–adjusted p-values); Abbreviations as in Figure 1.
Figure 1—figure supplement 5
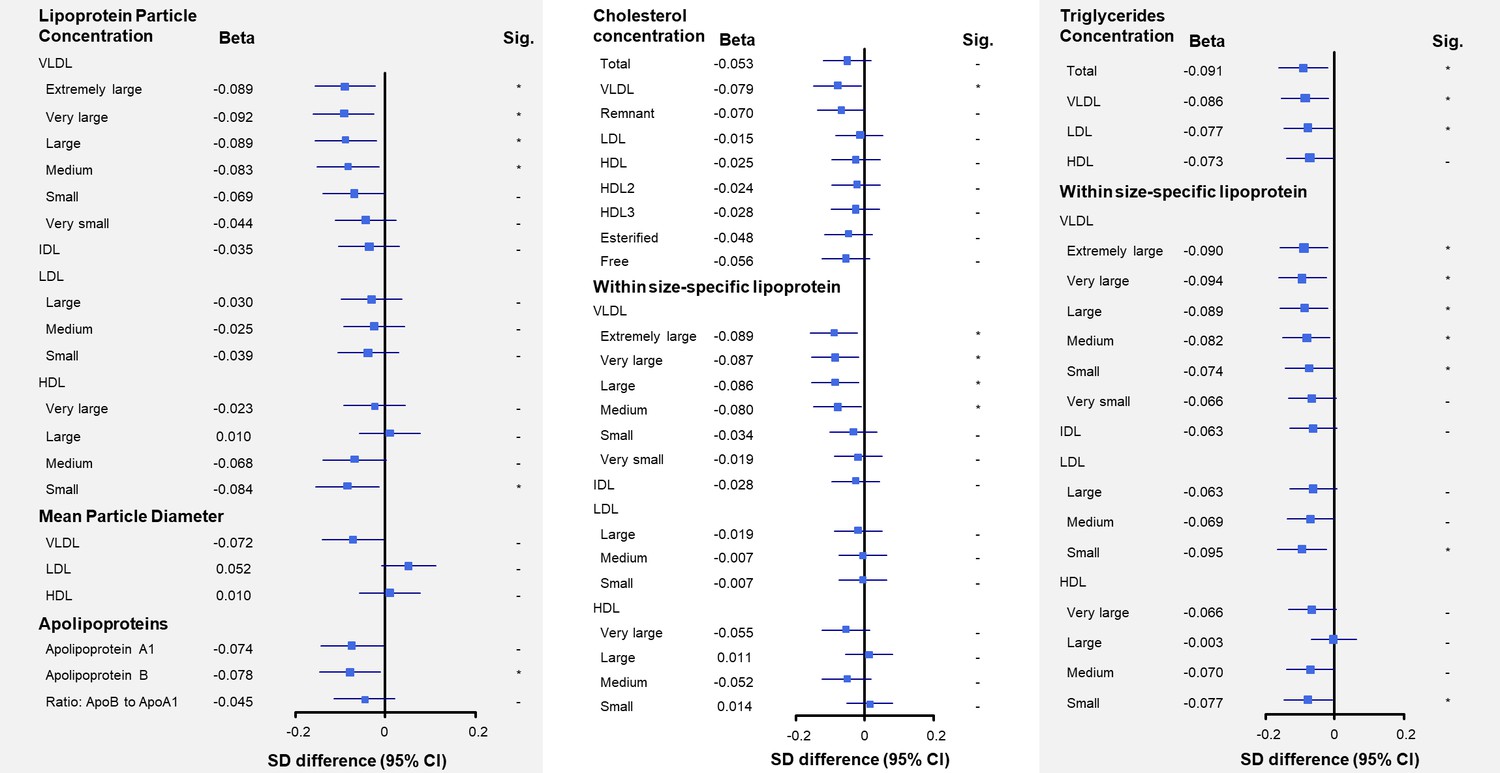
Associations between moderate alcohol consumption and lipid metabolites.
SD difference and 95% CI are for comparison of moderate alcohol drinker with others. Multivariable model was adjusted for: age, sex, fasting time, study areas, education level, case/control status, and other four lifestyle factors. Horizontal lines represent 95% CIs. Sig. = significance **p≤0.05, *p≤0.10, – p>0.10 (false discovery rate [FDR]–adjusted p-values); Abbreviations as in Figure 1.
Figure 1—figure supplement 6
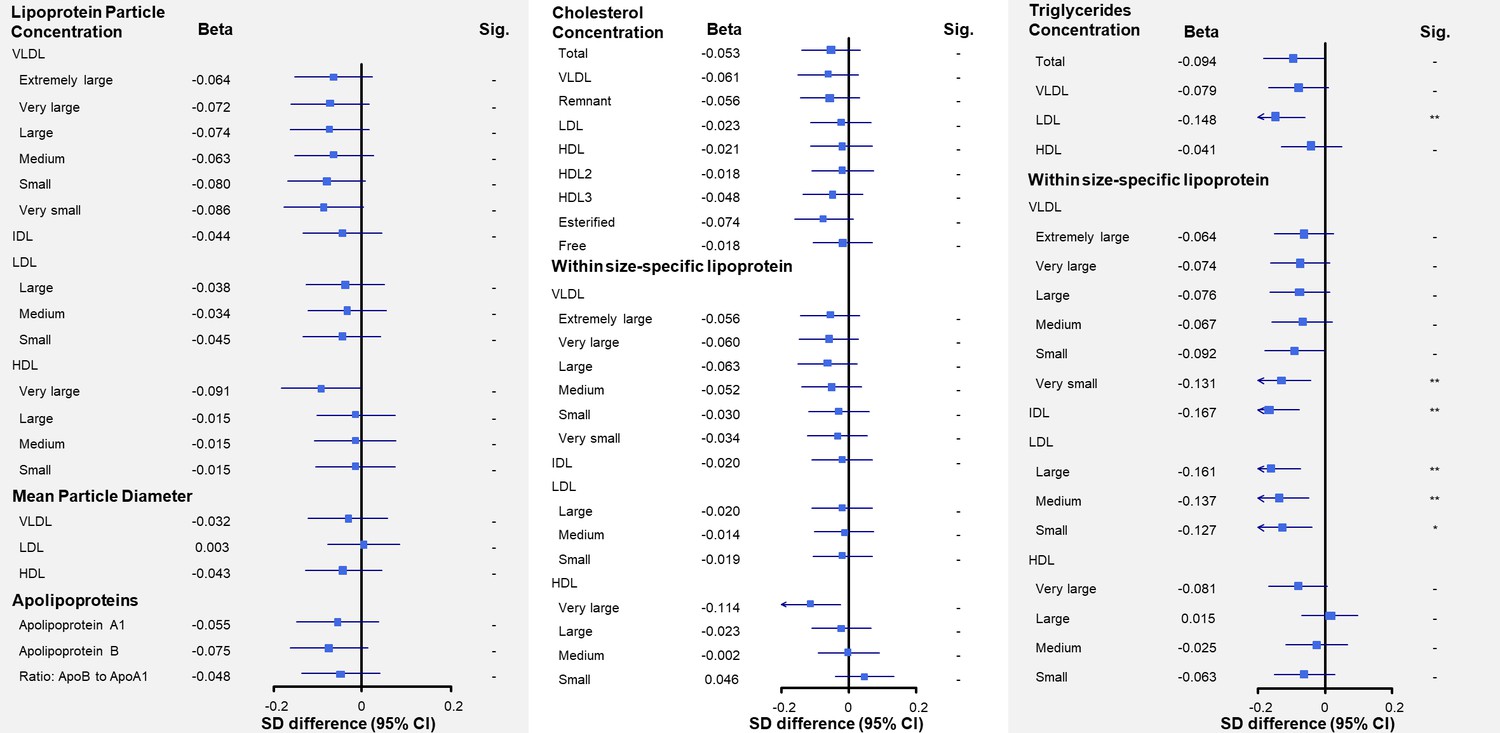
Associations between being physically active and lipid metabolites.
SD difference and 95% CI are for comparison of physically active participants with others. Multivariable model was adjusted for: age, sex, fasting time, study areas, education level, case/control status, and other four lifestyle factors. Horizontal lines represent 95% CIs. Sig. = significance **p≤0.05, *p≤0.10, – p>0.10 (false discovery rate [FDR]–adjusted p-values); Abbreviations as in Figure 1.
Figure 1—figure supplement 7
Associations between healthy adiposity level (body mass index in the range of 18.5–27.9 kg/m2 and waist circumference <90 cm in men and <85 cm in women) and lipid metabolites.
SD difference and 95% CI are for comparison of participants with healthy adiposity with others. Multivariable model was adjusted for: age, sex, fasting time, study areas, education level, case/control status, and other four lifestyle factors. Horizontal lines represent 95% CIs. Sig. = significance **p≤0.05, *p≤0.10, – p>0.10 (false discovery rate [FDR]–adjusted p-values); Abbreviations as in Figure 1.
Figure 1—figure supplement 8

Associations between healthy adiposity level (body mass index in the range of 18.5–24.9 kg/m2 and waist circumference <90 cm in men and <80 cm in women) and lipid metabolites.
SD difference and 95% CI are for comparison of participants with healthy adiposity with others. Multivariable model was adjusted for: age, sex, fasting time, study areas, education level, case/control status, and other four lifestyle factors. Horizontal lines represent 95% CIs. Sig. = significance **p≤0.05, *p≤0.10, – p>0.10 (false discovery rate [FDR]–adjusted p-values); Abbreviations as in Figure 1.
Figure 1—figure supplement 9
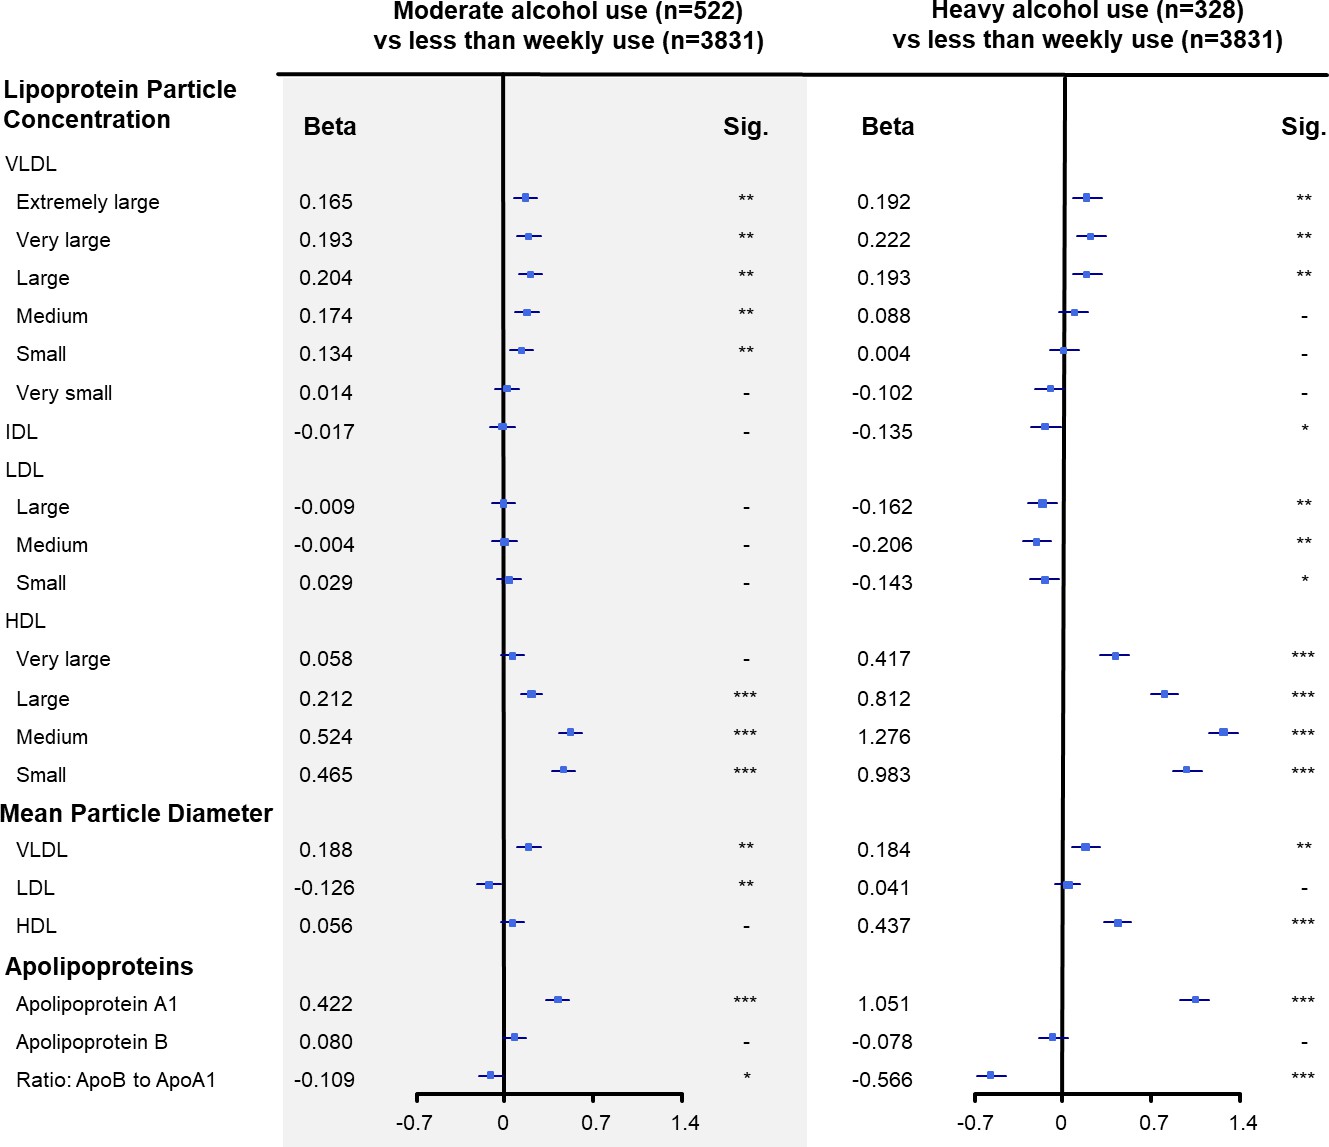
Associations of alcohol consumption with size-specific lipoprotein particle concentrations, mean lipoprotein particle diameter, and apolipoprotein concentrations.
SD difference and 95% CI are for comparison of moderate alcohol drinker with others. Participants reporting weekly or daily drinking with <30 g of pure alcohol per day were defined as moderate alcohol use group; participants with ≥30 g per day as heavy alcohol use. Multivariable model was adjusted for: age, sex, fasting time, study areas, education level, case/control status, and other four lifestyle factors. Horizontal lines represent 95% CIs. Sig. = significance ***p≤0.0001, **p≤0.01, *p≤0.05, – p>0.05 (false discovery rate [FDR]–adjusted p-values); Abbreviations as in Figure 1.
Figure 1—figure supplement 10
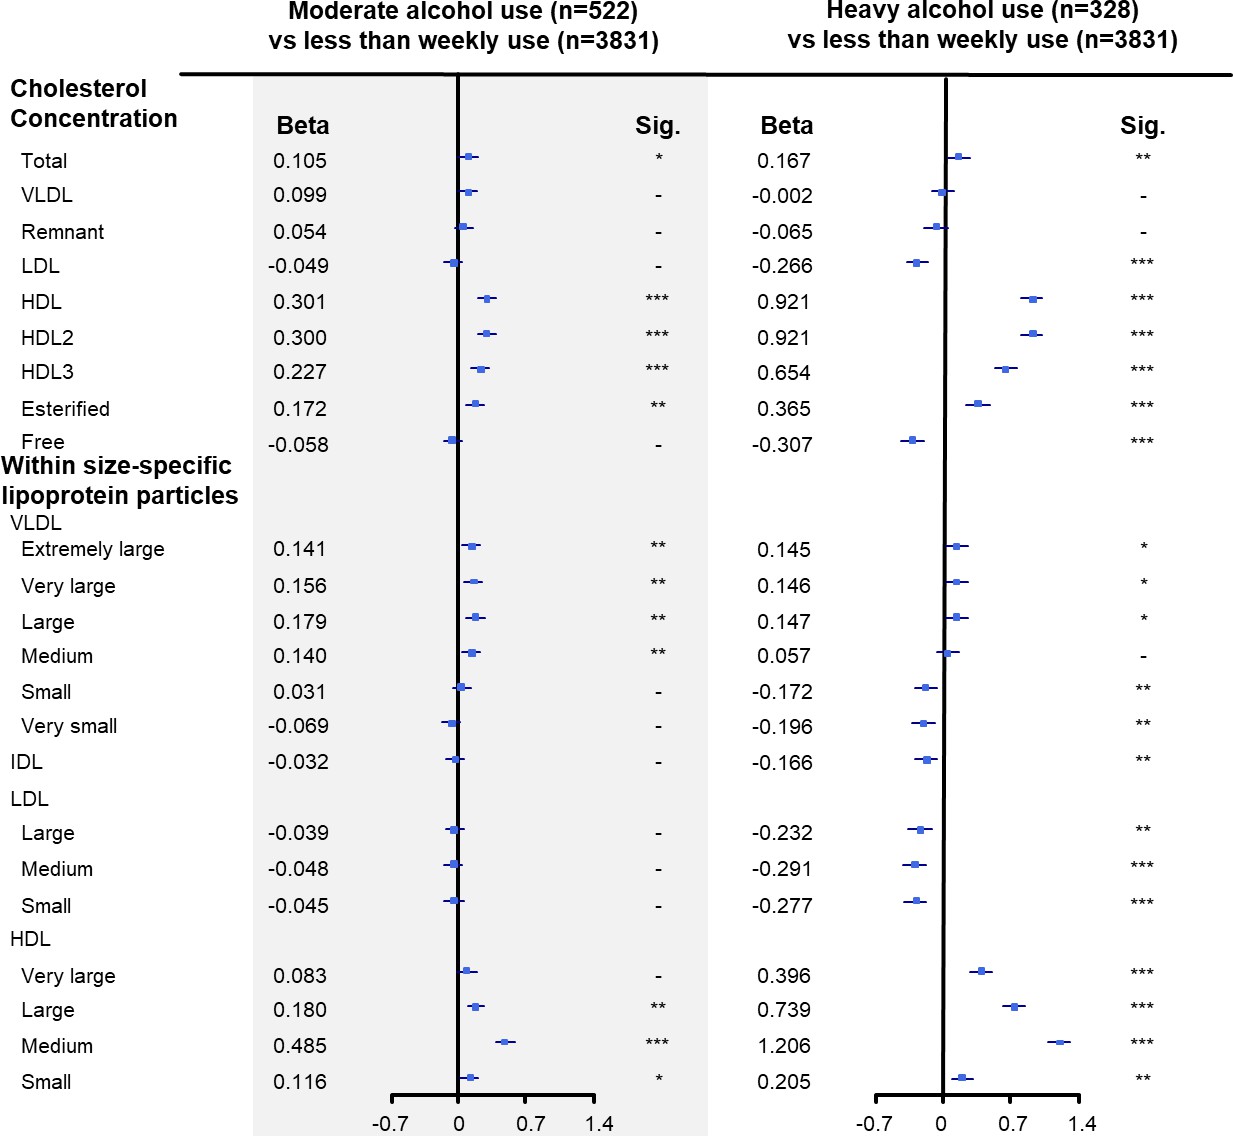
Associations of alcohol consumption with cholesterol concentrations in lipoprotein subfractions.
SD difference and 95% CI are for comparison of moderate alcohol drinker with others. Participants reporting weekly or daily drinking with <30 g of pure alcohol per day were defined as moderate alcohol use group; participants with ≥30 g per day as heavy alcohol use. Multivariable model was adjusted for: age, sex, fasting time, study areas, education level, case/control status, and other four lifestyle factors. Horizontal lines represent 95% CIs. Sig. = significance ***p≤0.0001, **p≤0.01, *p≤0.05, – p>0.05 (false discovery rate [FDR]–adjusted p-values); Abbreviations as in Figure 1.
Figure 1—figure supplement 11
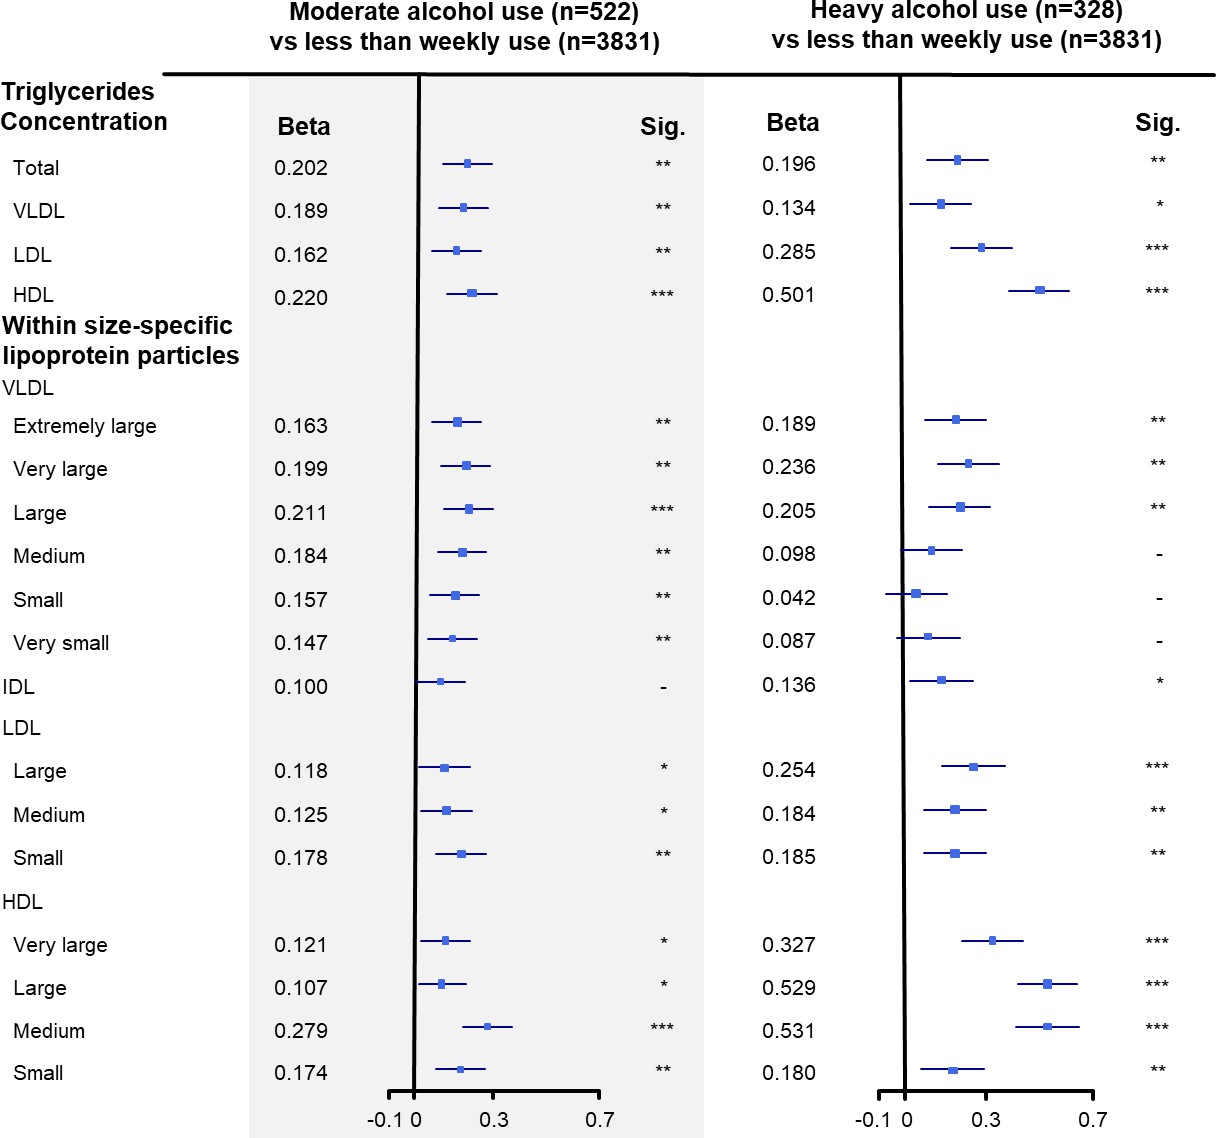
Associations of alcohol consumption with triglyceride concentrations in lipoprotein subfractions.
SD difference and 95% CI are for comparison of moderate alcohol drinker with others. Participants reporting weekly or daily drinking with <30 g of pure alcohol per day were defined as moderate alcohol use group; participants with ≥30 g per day as heavy alcohol use. Multivariable model was adjusted for: age, sex, fasting time, study areas, education level, case/control status, and other four lifestyle factors. Horizontal lines represent 95% CIs. Sig. = significance ***p≤0.0001, **p≤0.01, *p≤0.05, – p>0.05 (false discovery rate [FDR]–adjusted p-values); Abbreviations as in Figure 1.
Figure 1—figure supplement 12
Associations between never smoking and lipid metabolites.
SD difference and 95% CI are for comparison of never smokers with ever smokers. Multivariable model was adjusted for: age, sex, fasting time, study areas, education level, case/control status, and other four lifestyle factors. Horizontal lines represent 95% CIs. Sig. = significance **p≤0.05, *p≤0.10, – p>0.10 (false discovery rate [FDR]–adjusted p-values); Abbreviations as in Figure 1.
Figure 1—figure supplement 13
Associations between healthy diet pattern and lipid metabolites.
SD difference and 95% CI are for comparison of participants adopting a healthy diet pattern with others. Multivariable model was adjusted for: age, sex, fasting time, study areas, education level, case/control status, and other four lifestyle factors. Horizontal lines represent 95% CIs. Sig. = significance **p≤0.05, *p≤0.10, – p>0.10 (false discovery rate [FDR]–adjusted p-values); Abbreviations as in Figure 1.
Figure 2
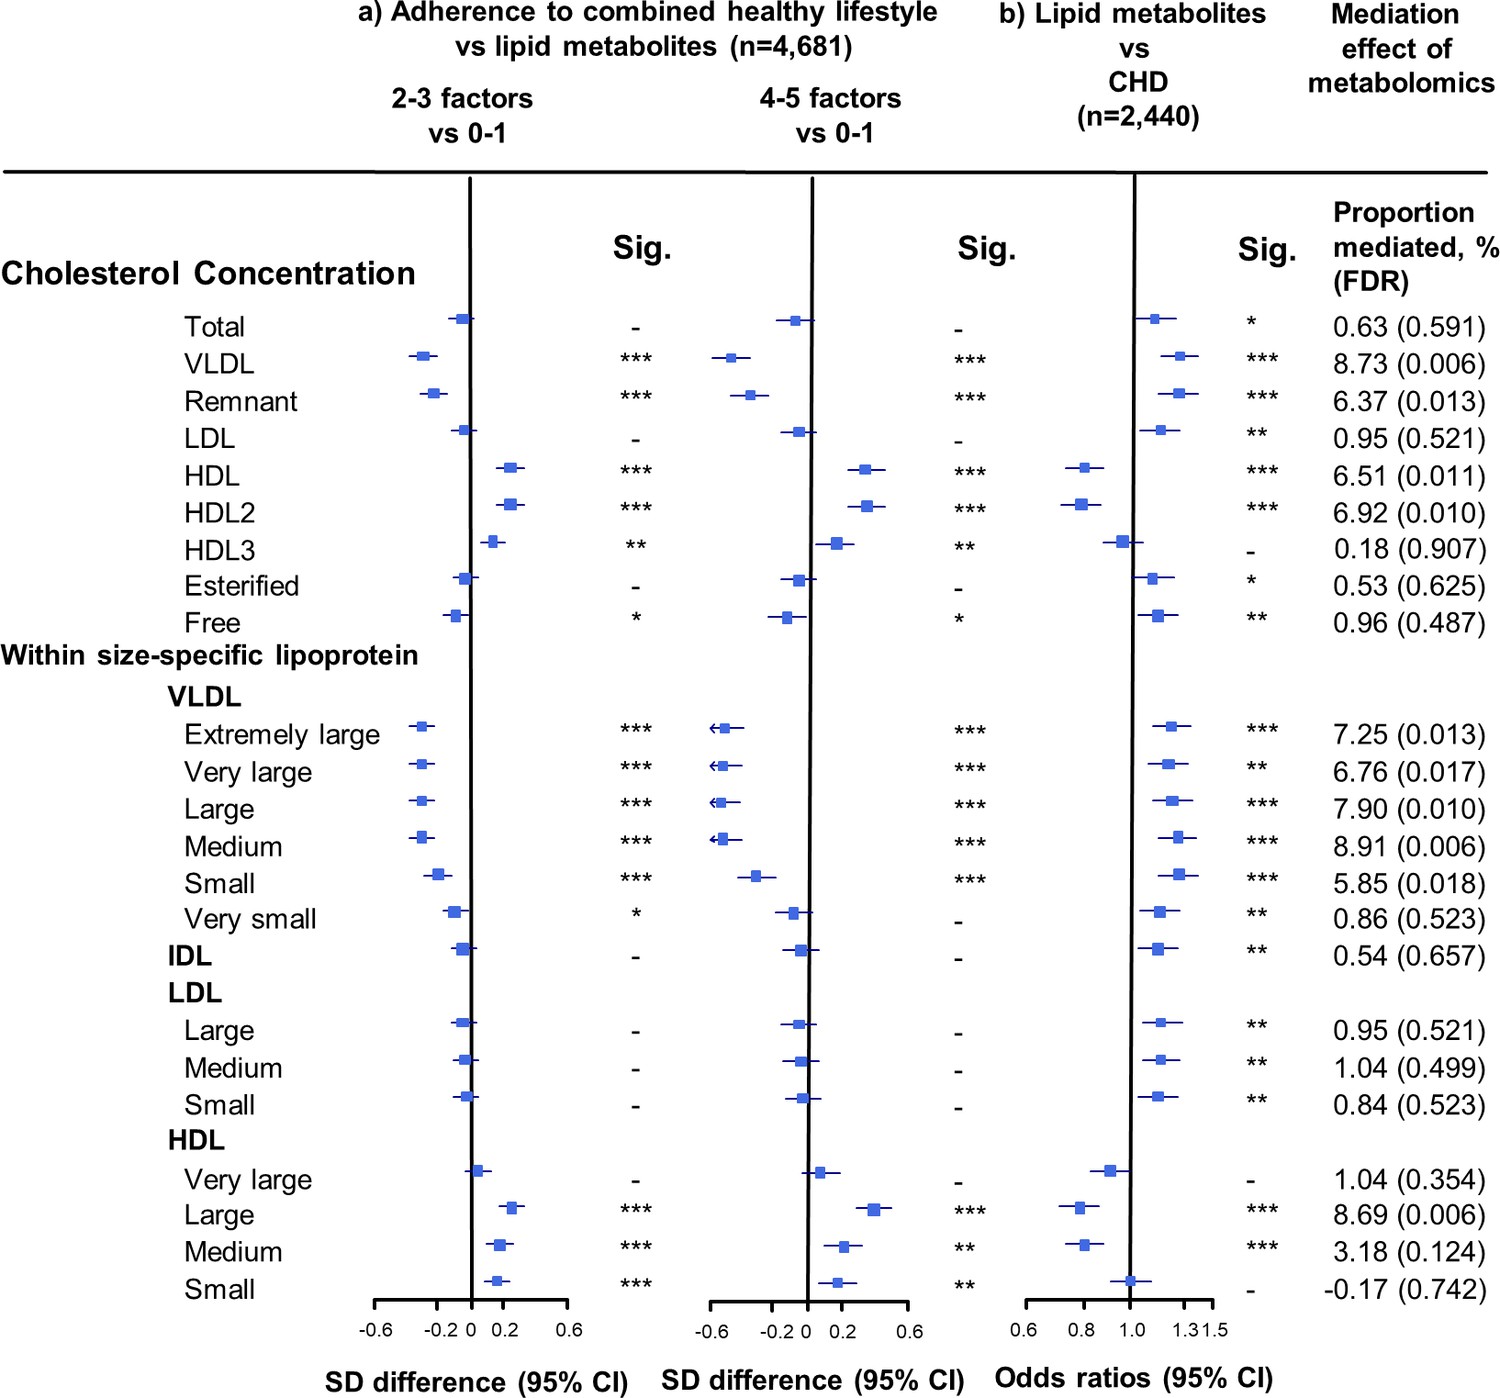
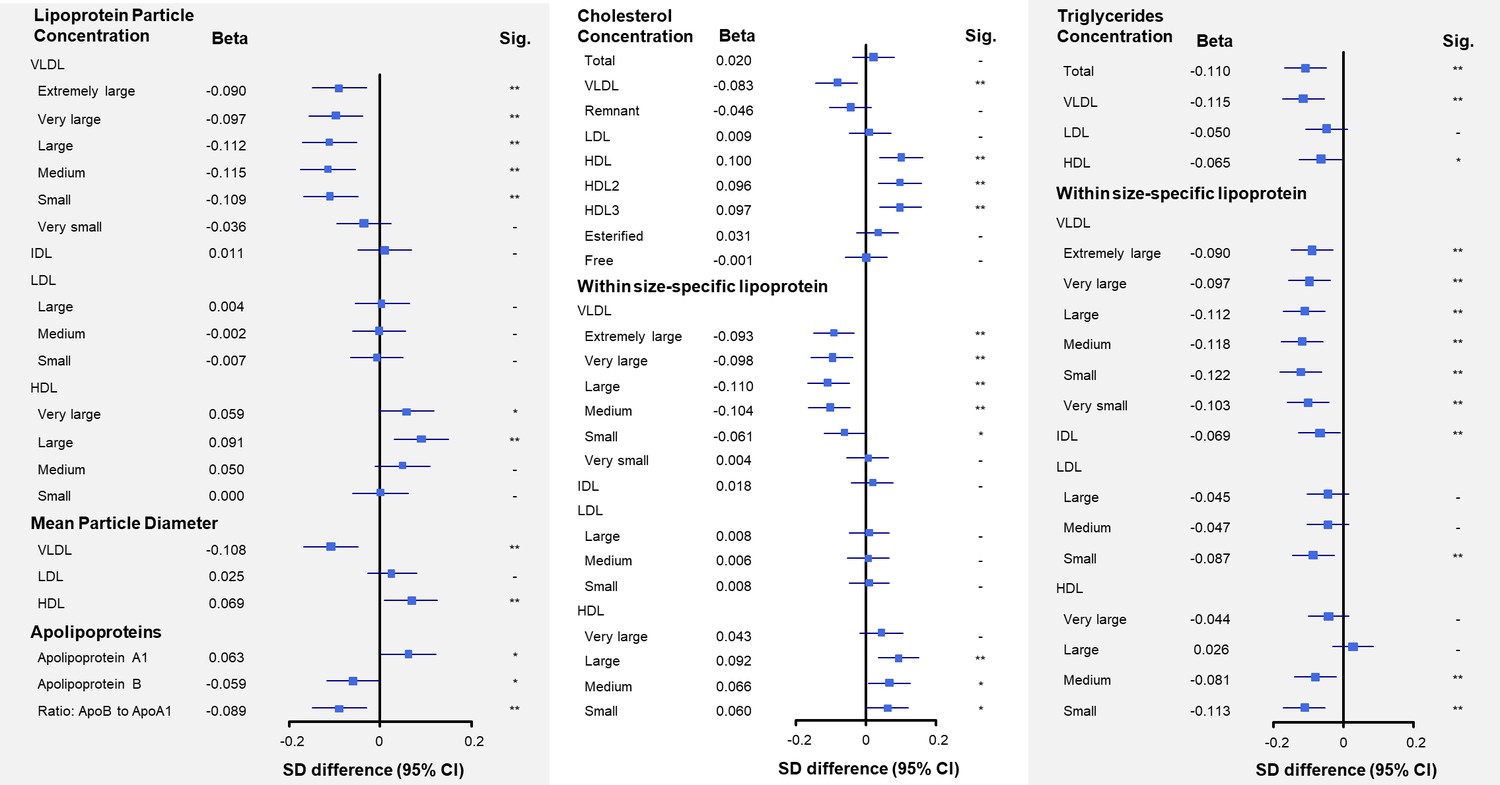
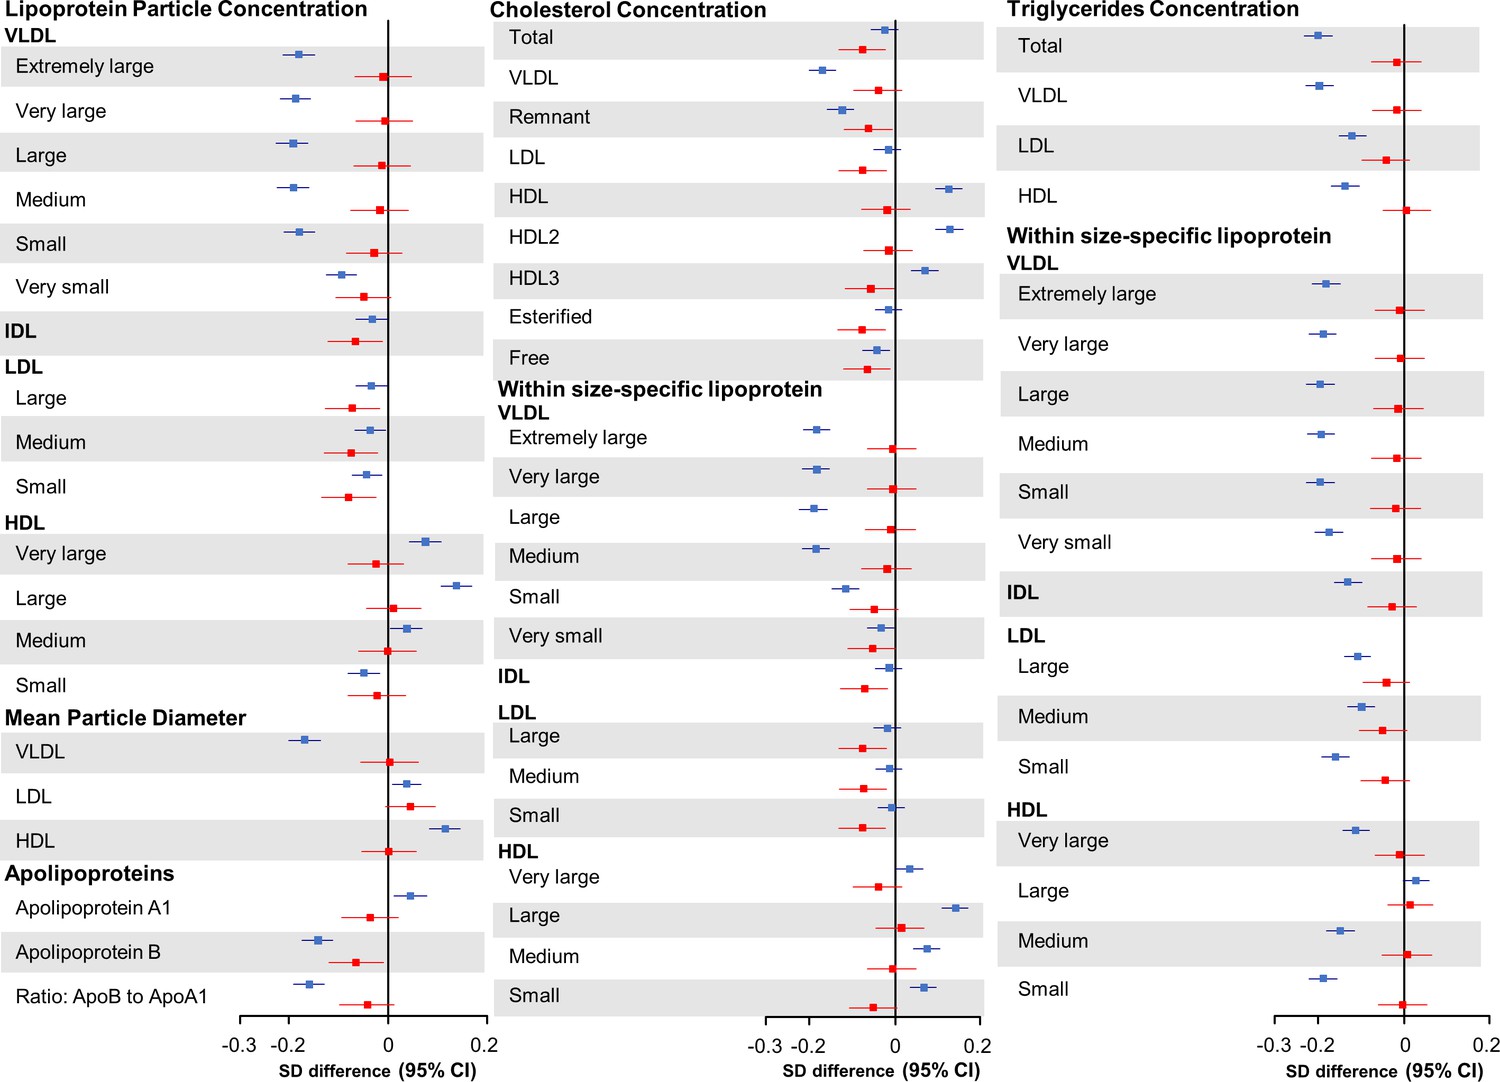
Associations of cholesterol concentrations in lipoprotein subfractions with combined healthy lifestyle and risk of coronary heart disease.
(a) SD difference and 95% CI are for comparison of participants who adopted two to three or four to five combined healthy lifestyles with participants who adopted zero to one. Multivariable model was adjusted for: age, sex, fasting time, study areas, education level, and case/control status. (b) Odds ratio and 95% CI are for the associations of 1-SD metabolic markers increasing with CHD risk. Multivariable model was adjusted for: age, sex, fasting time, study areas, education level, and smoking status. Horizontal lines represent 95% CIs. CHD = coronary heart disease; HDL2 = larger HDL particles; HDL3 = smaller HDL particles; Sig. = significance ***p≤0.0001, **p≤0.01, *p≤0.05, – p>0.05 (false discovery rate [FDR]–adjusted p-values); other abbreviations as in Figure 1.
-
Figure 2—source data 1
Associations of cholesterol concentrations in lipoprotein subfractions with combined healthy lifestyle and risk of coronary heart disease.
- https://cdn.elifesciences.org/articles/60999/elife-60999-fig2-data1-v1.docx
Figure 3
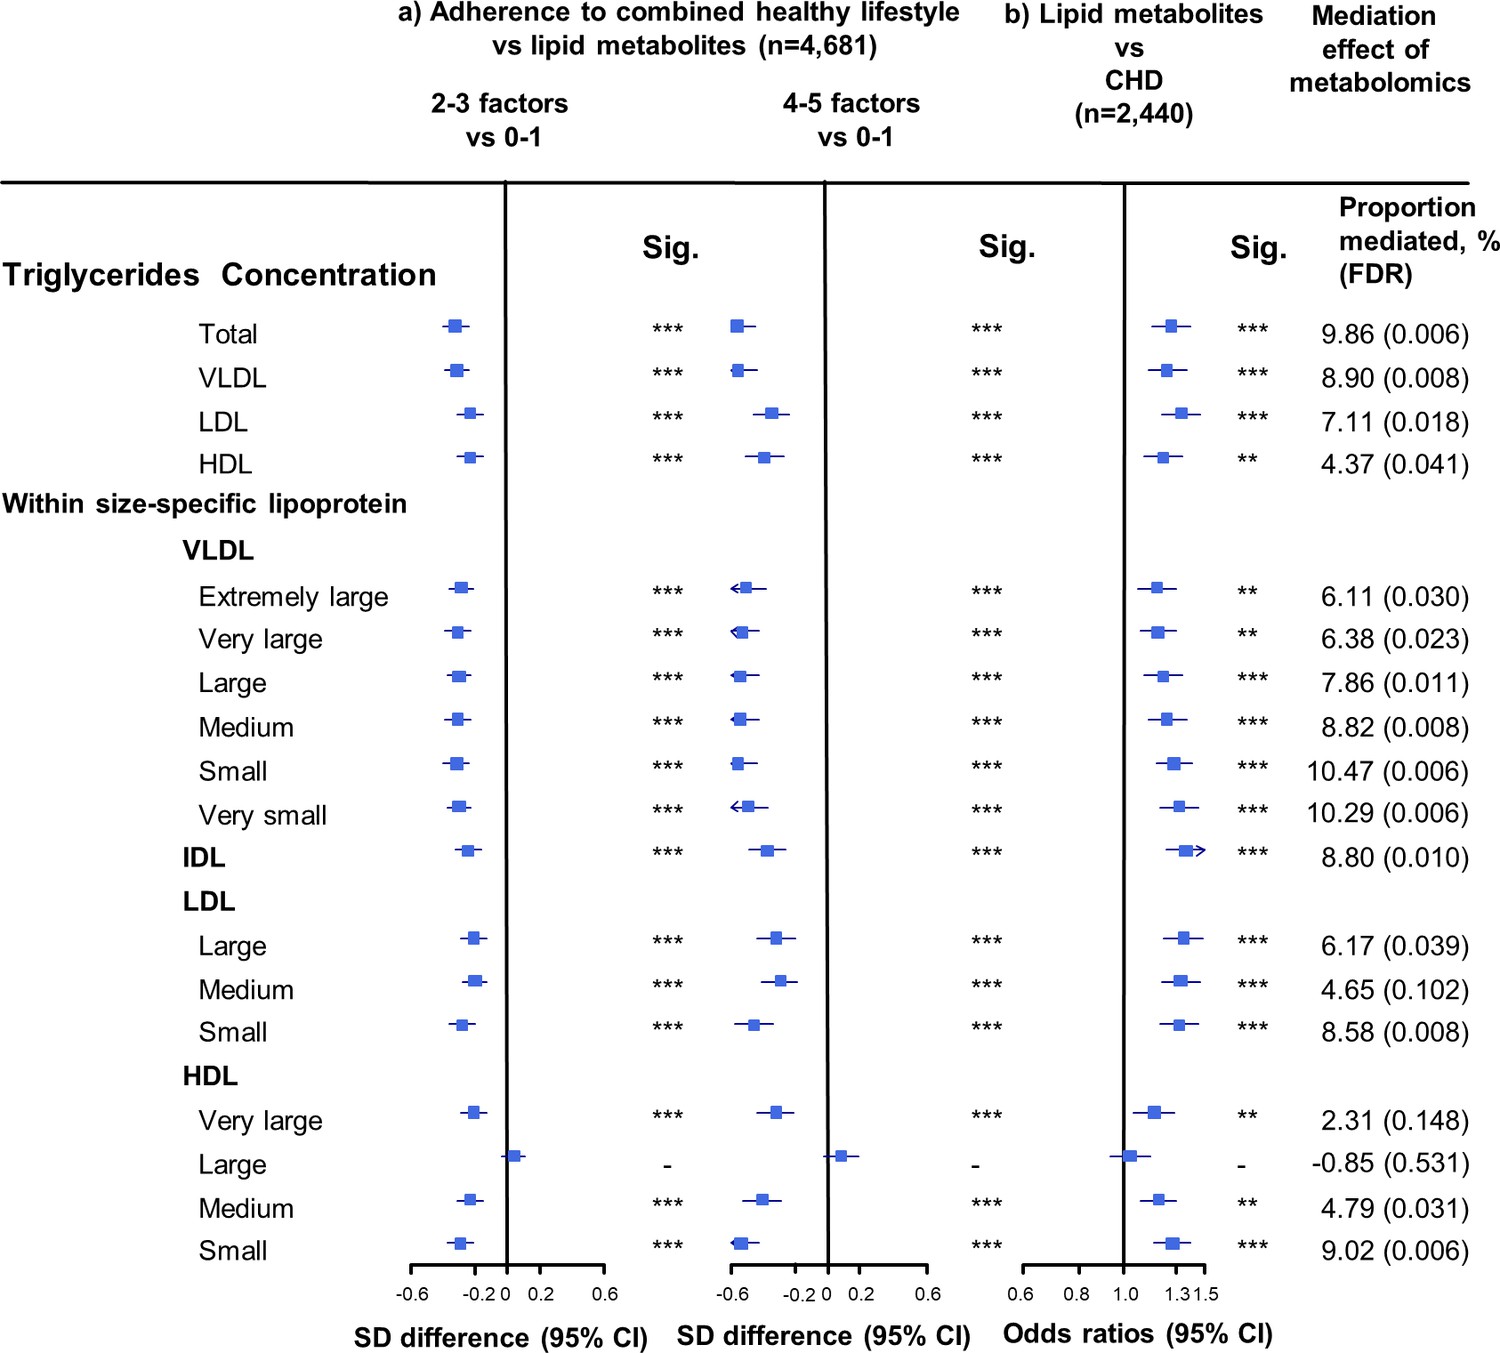
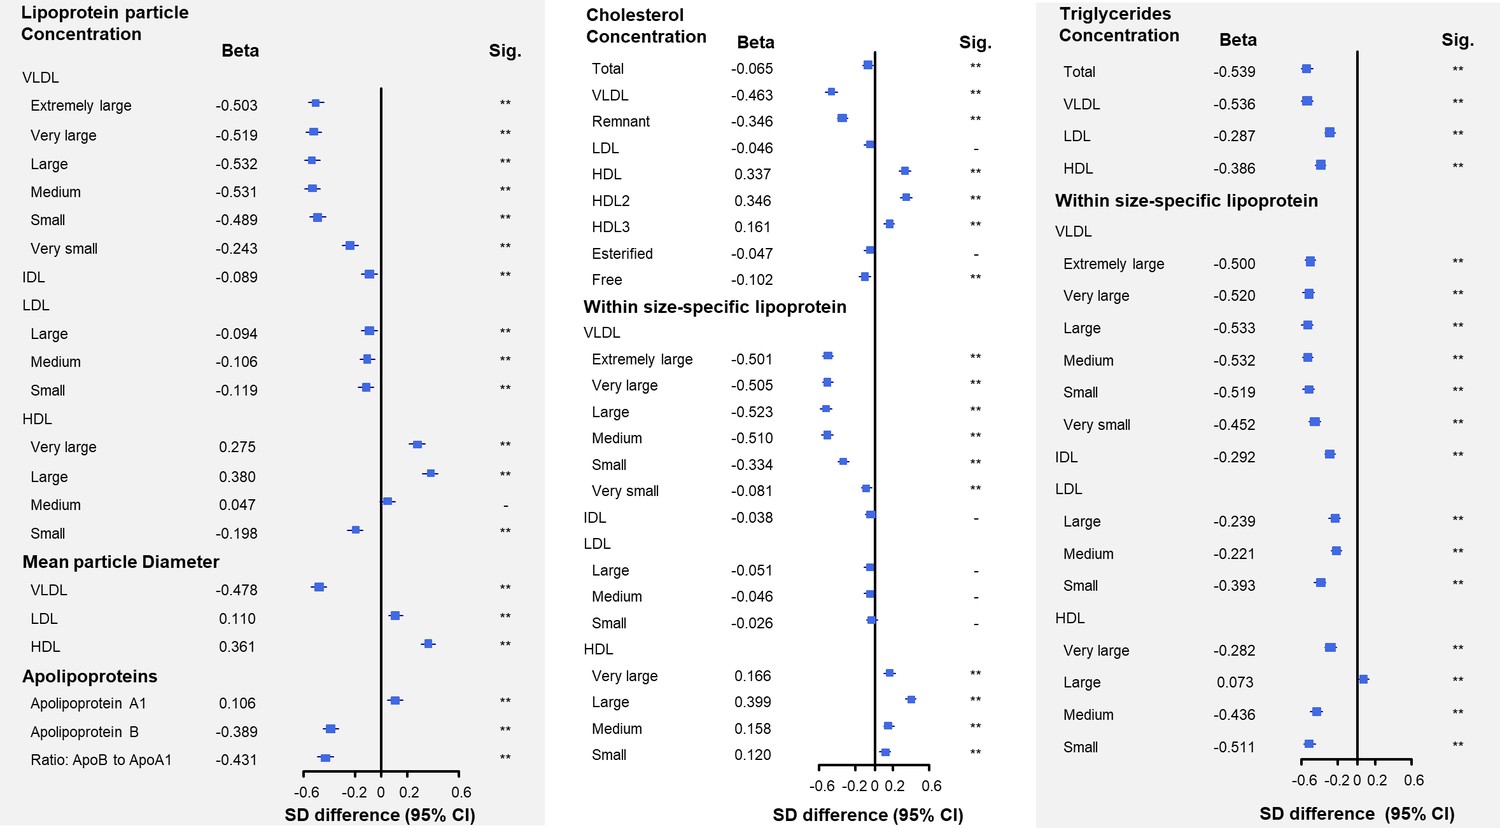
Associations of triglyceride concentrations in lipoprotein subfractions with combined healthy lifestyle and risk of coronary heart disease.
(a) SD difference and 95% CI are for comparison of participants who adopted two to three or four to five combined healthy lifestyles with participants who adopted zero to one. Multivariable model was adjusted for: age, sex, fasting time, study areas, education level, and case/control status. (b) Odds ratio and 95% CI are for the associations of 1-SD metabolic markers increasing with CHD risk. Multivariable model was adjusted for: age, sex, fasting time, study areas, education level, and smoking status. Horizontal lines represent 95% CIs. CHD = coronary heart disease; Sig. = significance ***p≤0.0001, **p≤0.01, *p≤0.05, – p>0.05 (false discovery rate [FDR]–adjusted p-values); Abbreviations as in Figure 1.
-
Figure 3—source data 1
Associations of triglyceride concentrations in lipoprotein subfractions with combined healthy lifestyle and risk of coronary heart disease.
- https://cdn.elifesciences.org/articles/60999/elife-60999-fig3-data1-v1.docx
Figure 4 with 3 supplements
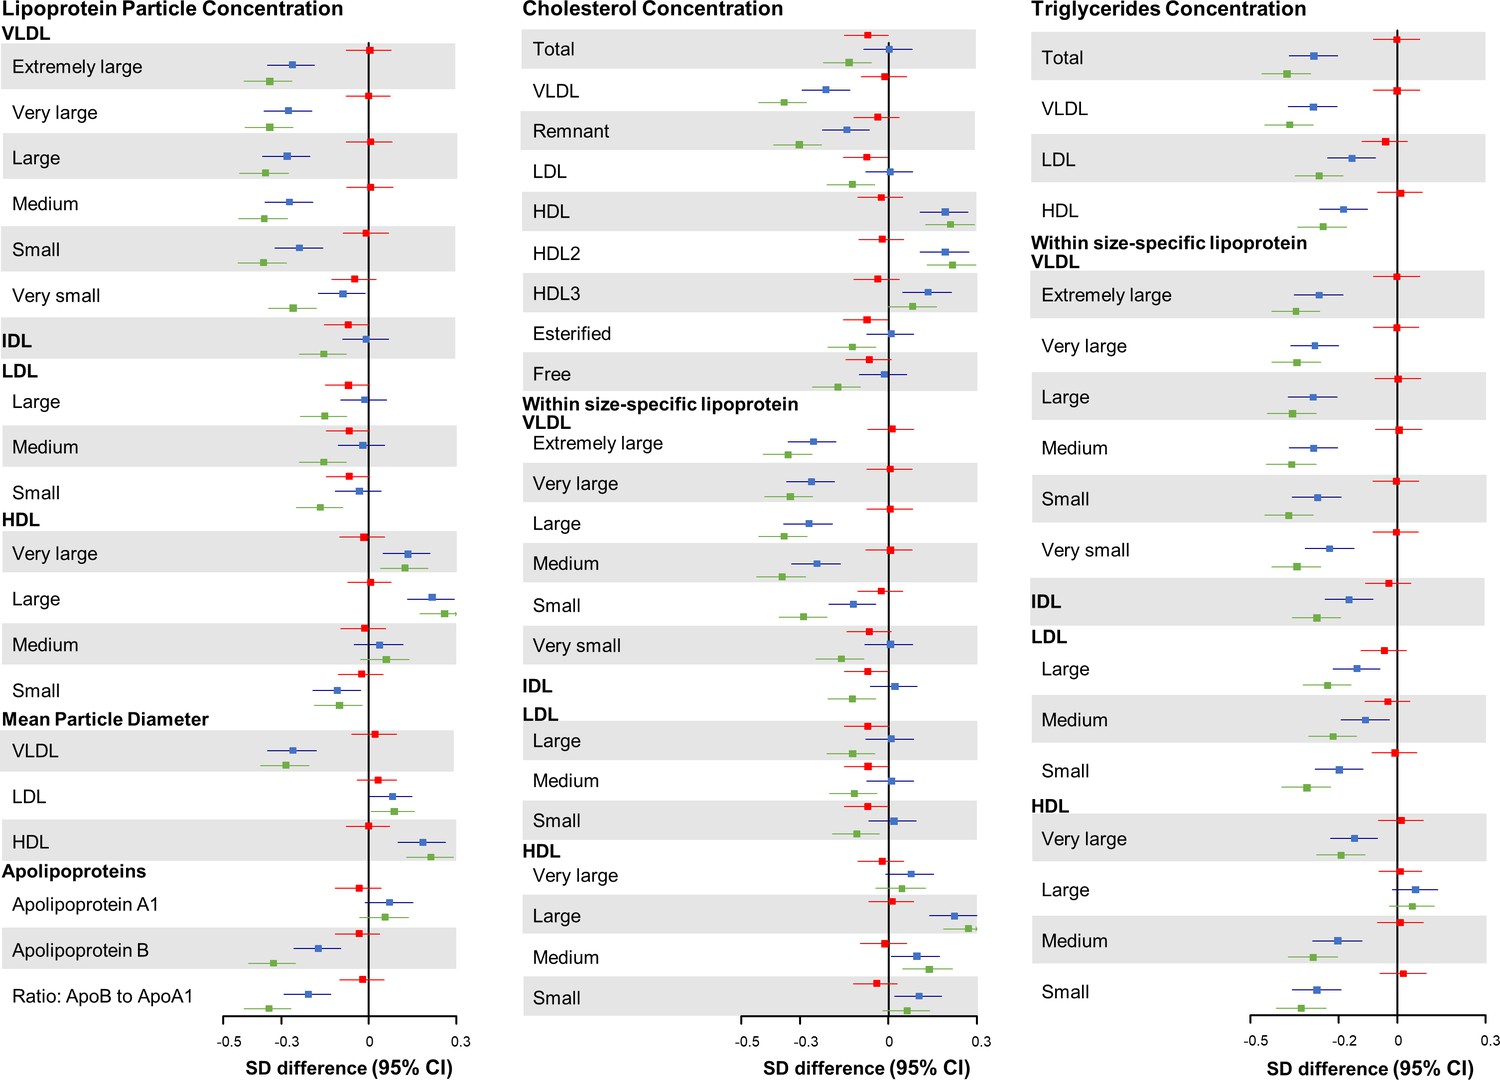
Joint association of combined healthy lifestyle and HMGCR scores based on Chinese population with lipid metabolites.
Participants who had higher genetic risk regarding HMGCR (3-hydroxy-3-methylglutaryl–coenzyme A reductase) and adhered to zero to two healthy lifestyle factors (HLFs) were reference group. SD difference and 95% CI of log-transformed lipid metabolites for participants with lower genetic risk and 0-2 HLFs, higher genetic risk and 3-5 HLFs, and lower genetic risk and 3-5 HLFs were shown in red, blue, and green, respectively. Abbreviations as in Figure 1.
Figure 4—figure supplement 1
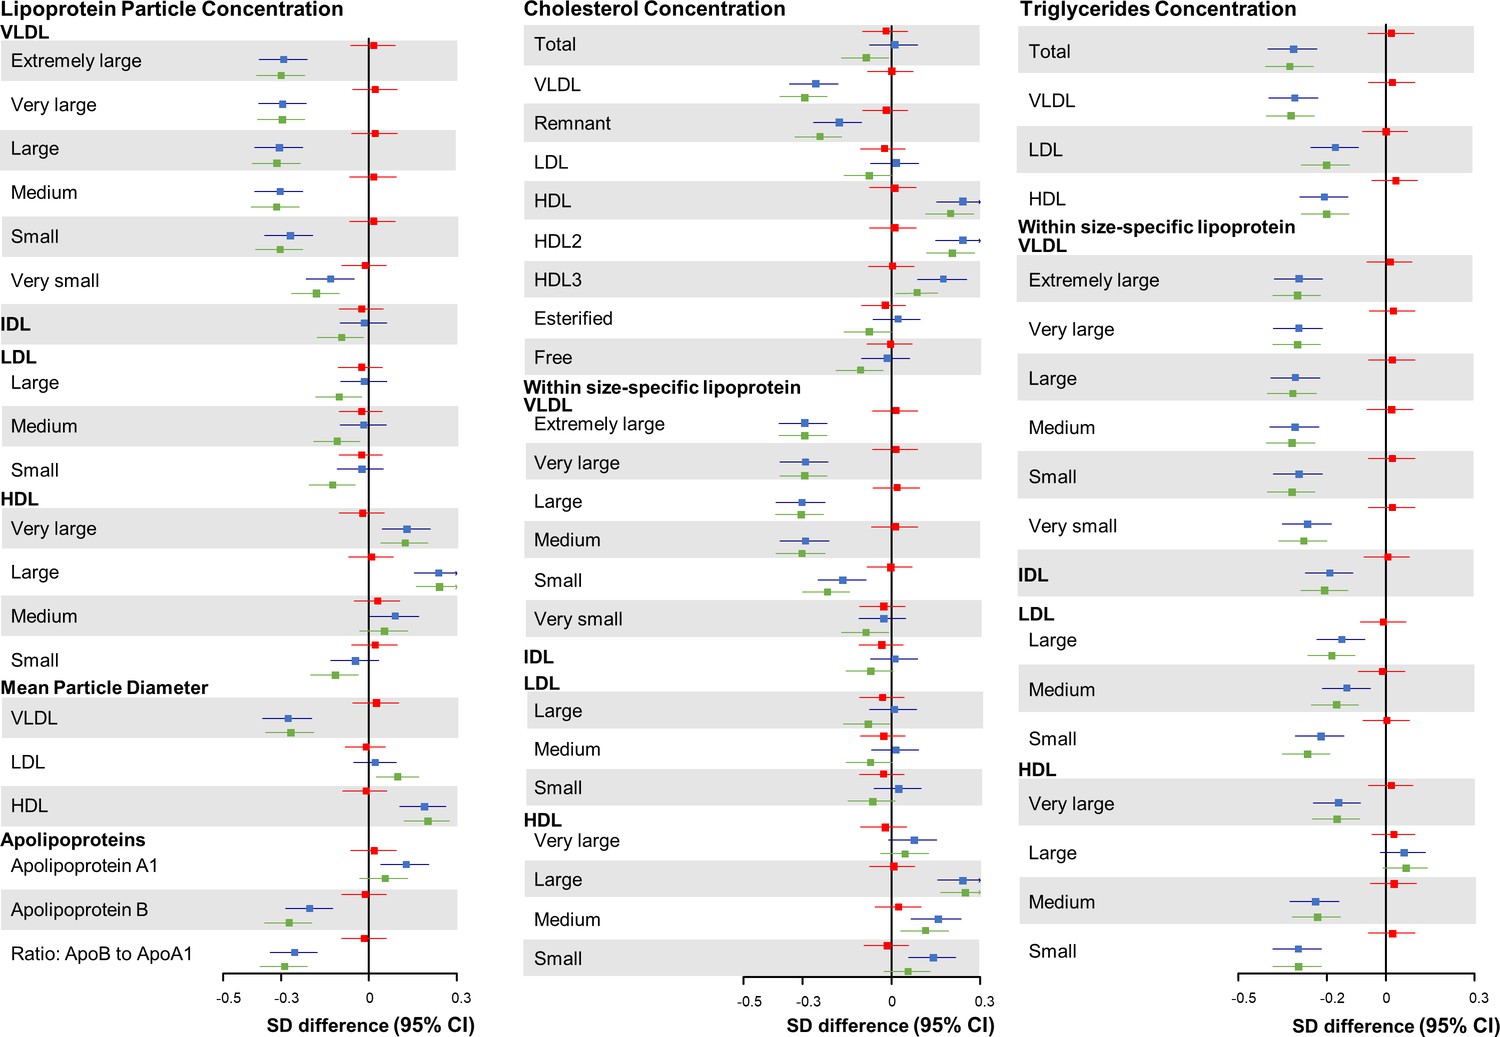
Joint association of combined healthy lifestyle and ACLY score based on Chinese population with lipid metabolites.
Participants who had higher genetic risk regarding ACLY (ATP citrate lyase) and adhered to zero to two healthy lifestyle factors (HLFs) were reference group. SD difference and 95% CI of log-transformed lipid metabolites for participants with lower genetic risk and 0–2 HLFs, higher genetic risk and 3–5 HLFs, and lower genetic risk and 3–5 HLFs were shown in red, blue, and green, respectively. Abbreviations as in Figure 1.
Figure 4—figure supplement 2
Associations of combined healthy lifestyle and HMGCR score based on Chinese population with changes in the lipid metabolites.
SD difference and 95% CI of log-transformed lipid metabolites per one factor increase in healthy lifestyle factors were shown in blue. SD difference and 95% CI of log-transformed lipid metabolites per 2-SD higher HMGCR (3-hydroxy-3-methylglutaryl–coenzyme A reductase) score were shown in red. Abbreviations as in Figure 1.
Figure 4—figure supplement 3
Associations of combined healthy lifestyle and ACLY score based on Chinese population with changes in the lipid metabolites.
SD difference and 95% CI of log-transformed lipid metabolites per one factor increase in healthy lifestyle factors were shown in blue. SD difference and 95% CI of log-transformed lipid metabolites per 2-SD higher ACLY (ATP citrate lyase) score were shown in red. Abbreviations as in Figure 1 .
Author response image 1
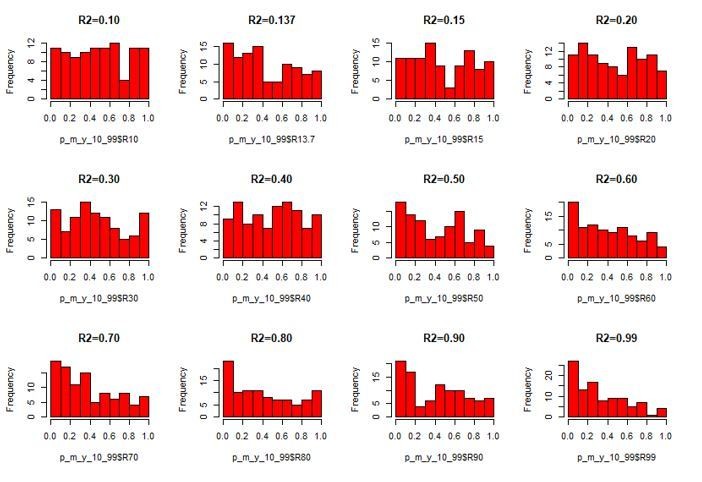
The p value frequency for the association between the mediator and the outcome among the 100 simulations.
Author response image 2

The p value frequency for the mediation effect among the 100 simulations.
Tables
Table 1
Age-, sex-, and study area-adjusted baseline characteristics of 4681 participants according to the number of healthy lifestyle factors (HLFs).
The results are presented as adjusted means or percentages, with adjustment for age, sex, and study area, as appropriate. All baseline characteristics were associated with the number of HLFs, with p<0.05 for trend across categories, except for urban or rural residence (0.155), family history of heart attack (p=0.905), and consumption of fresh vegetables (0.065).
| Baseline characteristics | |||||
|---|---|---|---|---|---|
| 0 | 1 | 2 | 3 | ≥4 | |
| No. of participants, n (%) | 118 (2.5) | 688 (14.7) | 1656 (35.4) | 1698 (36.3) | 521 (11.1) |
| Age, year | 49.6 | 49.0 | 47.5 | 45.8 | 43.8 |
| Female, % | 5.1 | 22.6 | 46.4 | 62.9 | 67.5 |
| Urban area, % | 42.6 | 33.5 | 27.8 | 25.1 | 36.6 |
| Middle school and above, % | 51.5 | 53.6 | 53.8 | 57.9 | 58.2 |
| Married, % | 91.3 | 92.9 | 94.6 | 95.3 | 95.2 |
| Prevalent hypertension, % | 62.6 | 52.6 | 48.7 | 40.6 | 38.5 |
| Prevalent diabetes, % | 13.8 | 12.0 | 7.1 | 4.1 | 3.8 |
| Family history of heart attack, % | 2.8 | 5.0 | 4.7 | 4.2 | 4.8 |
| Having HLFs*, % | |||||
| Never smoking | – | 47.1 | 57.0 | 70.6 | 85.9 |
| Moderate alcohol consumption | – | 3.5 | 8.6 | 15.9 | 28.3 |
| Being physically active | – | 13.3 | 37.6 | 66.2 | 96.0 |
| Healthy dietary pattern | – | 23.9 | 41.4 | 60.2 | 94.0 |
| Vegetables 7 days/week | 90.8 | 93.2 | 92.5 | 93.0 | 97.6 |
| Fruit 7 days/week | 2.6 | 7.6 | 10.2 | 16.3 | 24.8 |
| Read meat <7 days/week | 52.9 | 65.7 | 73.7 | 76.7 | 84.8 |
| Soybean product ≥4 days/week | 2.4 | 4.0 | 7.0 | 10.7 | 19.2 |
| Fish ≥1 day/week | 18.3 | 23.9 | 30.3 | 38.5 | 50.3 |
| Coarse grains ≥4 days/week | 7.9 | 21.1 | 22.7 | 23.7 | 25.0 |
| Healthy adiposity level | – | 25.8 | 55.5 | 89.0 | 98.0 |
-
*HLFs were defined as: never smoking; weekly but not daily drinking or daily drinking less than 30 g of pure alcohol; engaging in a sex-specific median or higher level of physical activity; engaging in more than or equal to 4 of total six healthy diet components; having a body mass index between 18.5 and 27.9 kg/m2 and having a waist circumference <90 cm in men and <85 cm in women.
Author response table 1
The Bonferroni-corrected minimum p value in 100 simulations.
| Bonferroni-corrected minimum p value for the mediator – outcome association | Bonferroni-corrected minimum p value for the mediation effect | |
|---|---|---|
| R2=0.10 | 0.215 | 0.227 |
| R2=0.137 | 0.258 | 0.216 |
| R2=0.15 | 0.124 | 0.117 |
| R2=0.20 | 0.133 | 0.189 |
| R2=0.30 | 0.114 | 0.154 |
| R2=0.40 | 0.153 | 0.198 |
| R2=0.50 | 0.290 | 0.234 |
| R2=0.60 | 0.217 | 0.247 |
| R2=0.70 | 0.057 | 0.096 |
| R2=0.80 | 0.020 | 0.047 |
| R2=0.90 | 0.014 | 0.018 |
| R2=0.99 | 0.011 | 0.005 |
Author response table 2
| Detailed distribution | No. of participants | Percent | |
|---|---|---|---|
| Non-regular alcohol consumption | Not regular (less than weekly) drinker | 3,626 | 77.5 |
| Former regular drinker | 205 | 4.4 | |
| Moderate alcohol consumption | Weekly but not daily drinker | 439 | 9.4 |
| Daily drinker with <15g pure alcohol per day | 3 | 0.1 | |
| Daily drinker with 15-29g pure alcohol per day | 80 | 1.7 | |
| Heavy alcohol consumption | Daily drinker with 30-59g pure alcohol per day | 120 | 2.6 |
| Daily drinker with ≥60g pure alcohol per day | 208 | 4.4 |
Additional files
-
Source code 1
Association between lifestyle and metabolites.
- https://cdn.elifesciences.org/articles/60999/elife-60999-code1-v1.zip
-
Source code 2
Association between metabolites and CHD.
- https://cdn.elifesciences.org/articles/60999/elife-60999-code2-v1.zip
-
Source code 3
Joint effect of genetic score and HLFs on CHD.
- https://cdn.elifesciences.org/articles/60999/elife-60999-code3-v1.zip
-
Source code 4
Mediation analysis.
- https://cdn.elifesciences.org/articles/60999/elife-60999-code4-v1.zip
-
Source code 5
Construction of genetic scores.
- https://cdn.elifesciences.org/articles/60999/elife-60999-code5-v1.zip
-
Source code 6
Simulation of mediation analysis.
- https://cdn.elifesciences.org/articles/60999/elife-60999-code6-v1.zip
-
Supplementary file 1
Members of the China Kadoorie Biobank collaborative group.
- https://cdn.elifesciences.org/articles/60999/elife-60999-supp1-v1.docx
-
Supplementary file 2
Baseline characteristics according to case or control status, results of sensitivity analysis, and other useful materials in the methods section.
(A) Age-, sex-, and study area-adjusted baseline characteristics of 4681 participants according to case or control status. (B) Sensitivity analysis of association between combined healthy lifestyle and lipid metabolites. (C) Associations of the HMGCR score with changes in the lipid metabolites, and subgroup analysis of the association between healthy lifestyle and lipid metabolites according to HMGCR score. (D) Associations of the ACLY score with changes in the lipid metabolites, and subgroup analysis of the association between healthy lifestyle and lipid metabolites according to ACLY score. (E) Associations of the sum of HMGCR and ACLY score with changes in the lipid metabolites, and subgroup analysis of the association between healthy lifestyle and lipid metabolites according to the sum score. (F) Associations of the genetic scores* with changes in the lipid metabolites. (G) Food frequency questionnaire used in the CKB study at baseline. (H) Variants included in the genetic scores and their associations with plasma low-density lipoprotein cholesterol.
- https://cdn.elifesciences.org/articles/60999/elife-60999-supp2-v1.docx
-
Transparent reporting form
- https://cdn.elifesciences.org/articles/60999/elife-60999-transrepform-v1.docx
Download links
A two-part list of links to download the article, or parts of the article, in various formats.
Downloads (link to download the article as PDF)
Open citations (links to open the citations from this article in various online reference manager services)
Cite this article (links to download the citations from this article in formats compatible with various reference manager tools)
Improved lipidomic profile mediates the effects of adherence to healthy lifestyles on coronary heart disease
eLife 10:e60999.
https://doi.org/10.7554/eLife.60999


