Neural mechanisms underlying expectation-dependent inhibition of distracting information
- Department of Psychology, University of Amsterdam, Netherlands
- Amsterdam Brain and Cognition, University of Amsterdam, Netherlands
- Department of Experimental and Applied Psychology, Vrije Universiteit Amsterdam, Netherlands
- Institute of Brain and Behaviour Amsterdam, Netherlands
Figures
Figure 1
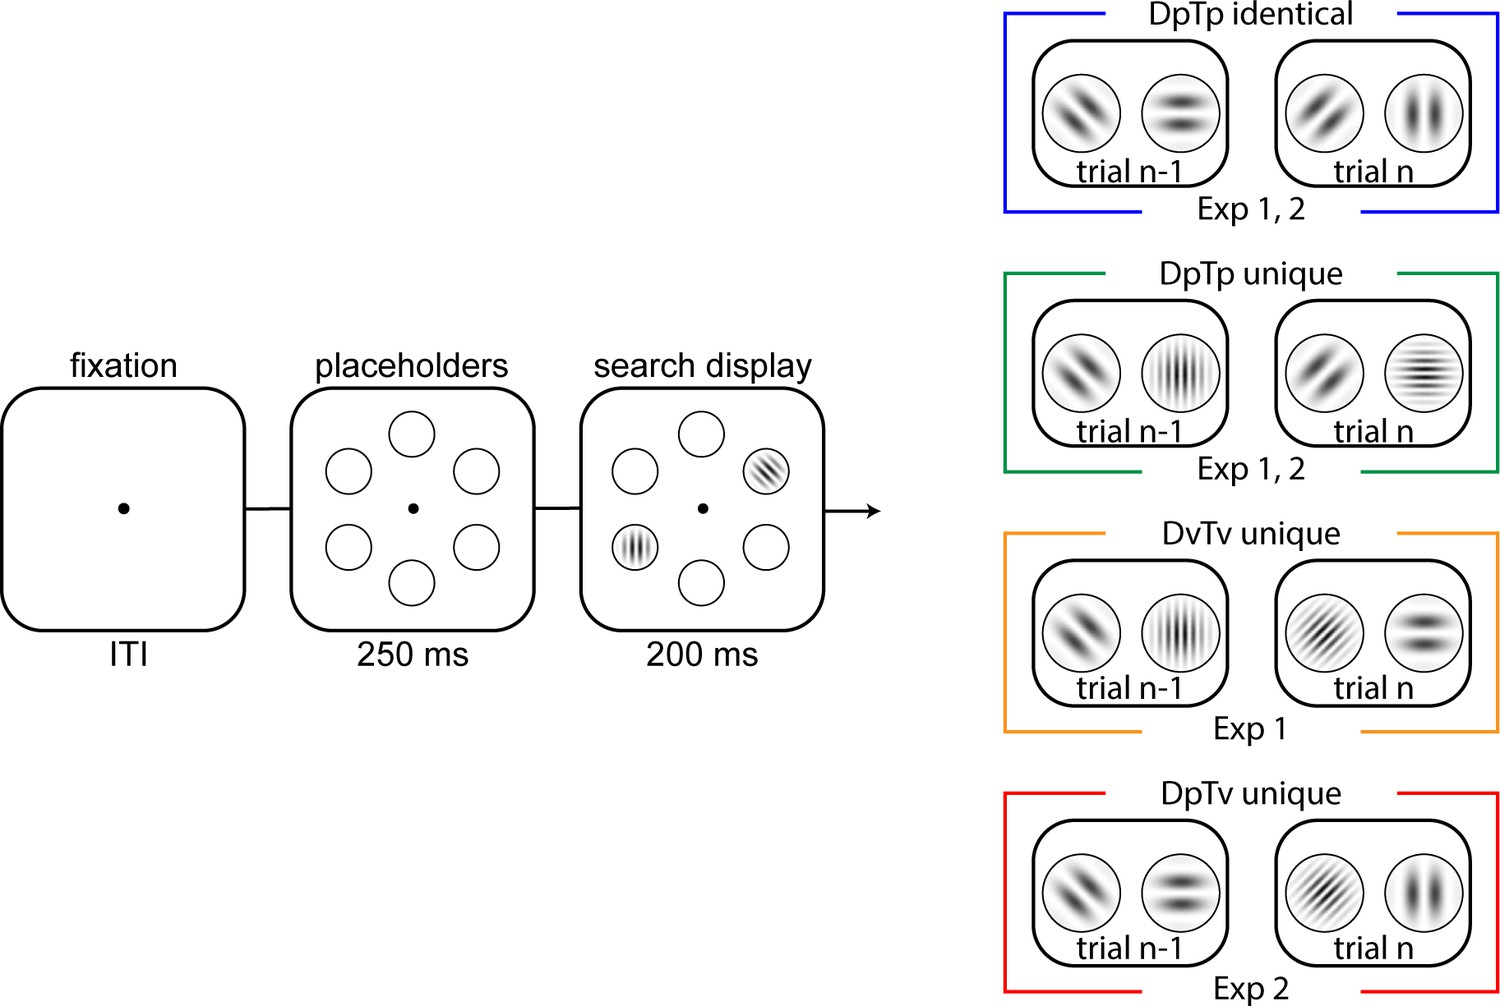
Task design of Experiments 1 and 2.
Across conditions (colored boxes on the right), in each trial, participants had to indicate the orientation tilt (left or right) of a target gabor. In all conditions, a distractor (a gabor that was horizontally or vertically oriented) could be concurrently presented, which appeared with 70% probability on one specific location. The search display was presented for 200 ms, and participants had 1000 ms to respond. In the DpTp identical and DpTP unique (Experiments 1 and 2) conditions, the spatial frequency of the target and distractor were fixed within an experimental block of trials, with targets and distractors having the same spatial frequency in the former and different spatial frequencies in the latter. In DvTv unique condition (Experiment 1), the target and distractor had different spatial frequencies, which were randomly selected across trials. Finally, in the DpTv condition (Experiment 2), the target and distractor had different spatial frequencies, but only the distractor spatial frequency was fixed across trials in an experimental block. The visualized spatial frequencies do not correspond to the frequencies used in the experiment. Note further that the colors of each condition correspond to condition-specific colors in subsequent figures.
Figure 2
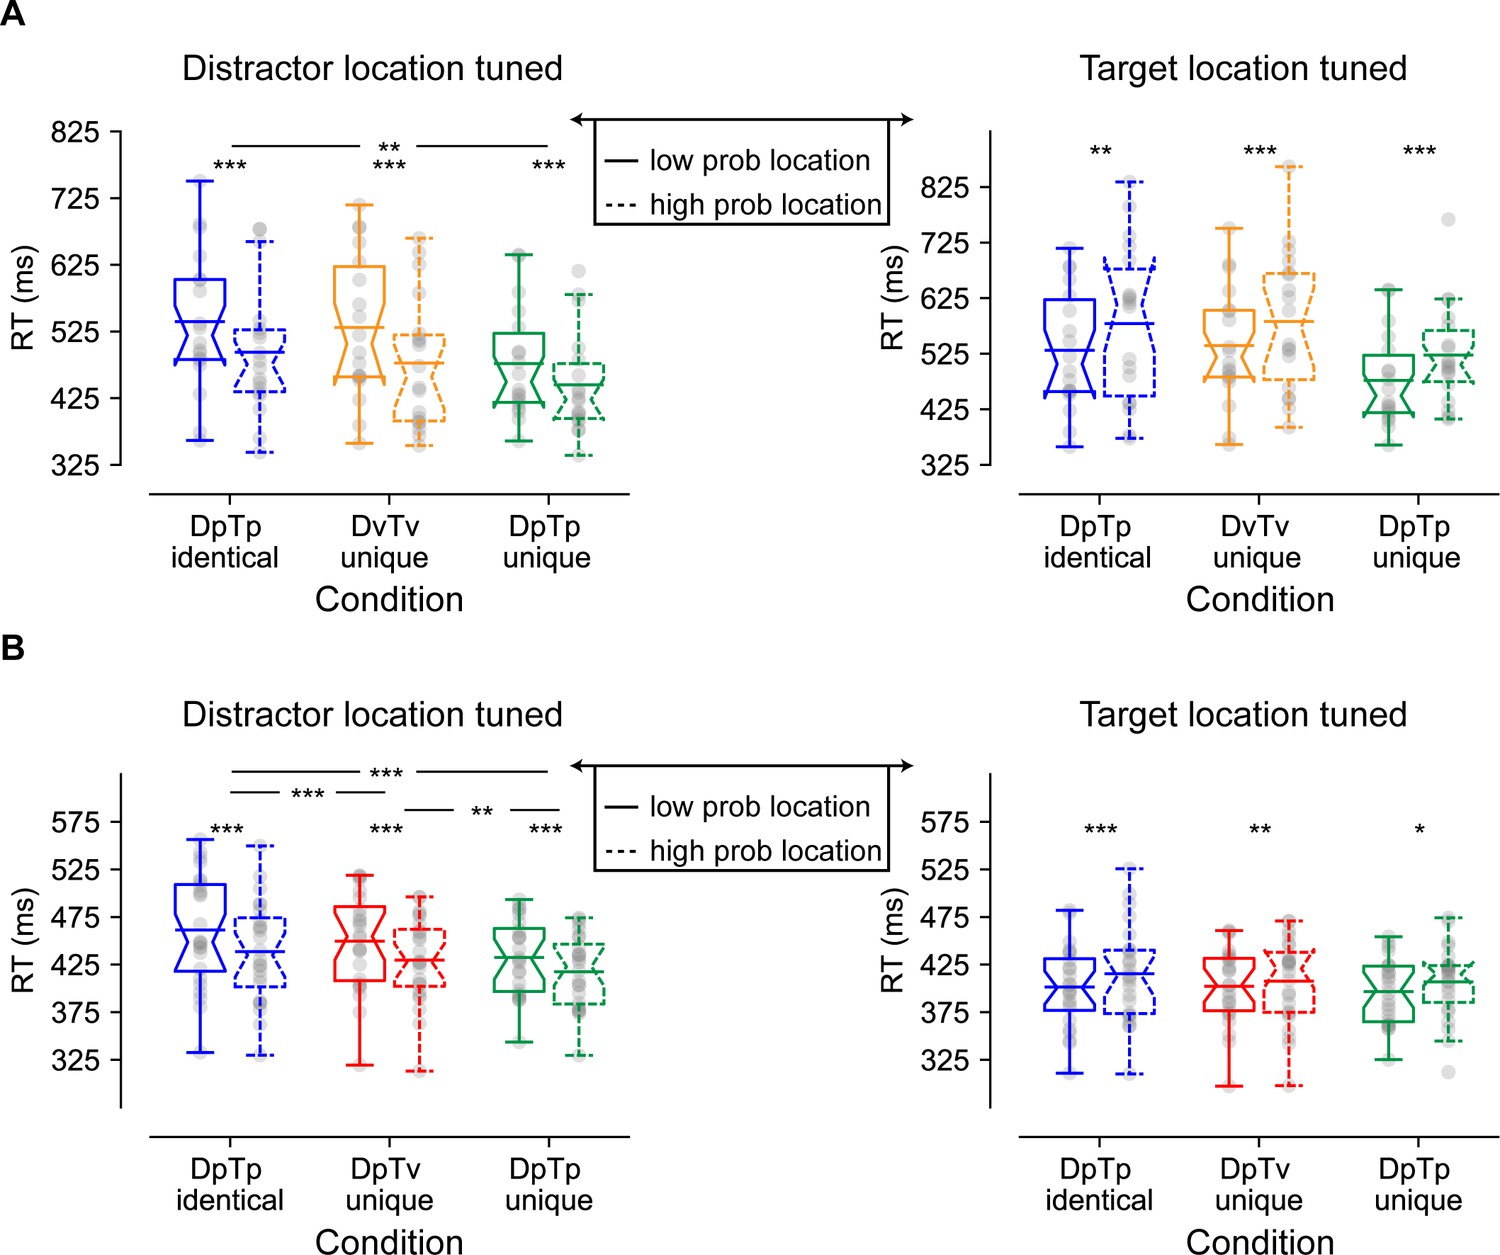
Behavioral findings of Experiments 1 (A) and 2 (B) visualized by notched boxplots with solid horizontal lines corresponding to the mean.
(A) Reaction times as a function of distractor location (left) and target location (right) in Experiment 1. (B) Reaction times as a function of distractor location (left) and target location (right) in Experiment 2, where the target location tuned plot only is based only on distractor absent trials. All distractor location tuned plots do not contain trials with the target at the high-probability location, and the target location tuned plots do not contain distractors at high-probability locations. DpTp indentical: the distractor and the target had the same predictable spatial frequency (fixed across a sequence of trials); DvTv unique: targets and distractors had different, but unpredictable spatial frequencies (varied across a sequence of trials). DpTp unique: targets and distractors had different and predictable spatial frequencies (fixed across a sequence of trials). DpTv unique: targets and distractors had different spatial frequencies, but only the distractor spatial frequency was predictable (fixed across a sequence of trials).
Figure 3

Anticipatory alpha-activity.
(A) These panels show the lateralization index relative to the high-probability distractor location averaged over PO7/8 and O1/2 separately per condition. (B) Time-series of lateralization index averaged within the alpha-band (8–12 Hz). Insets show topographic distribution averaged over the entire anticipatory window. Although numerically, pre-stimulus alpha-band activity was higher over visual regions contralateral to the predicted distractor location in the DpTp indentical condition in which the distractor and the target had the same fixed spatial frequency, permitting only the development of spatial distractor expectations, this effect was not statistically significant. DpTv unique: targets and distractors had different spatial frequencies, but only the distractor spatial frequency was predictable (fixed across a sequence of trials); DpTp unique: targets and distractors had different and predictable spatial frequencies (fixed across a sequence of trials).
Figure 4

Multivariate decoding of the target and distractor spatial frequency across conditions using broad-band EEG of all 64 electrodes.
(A) AUC scores of target (left) and distractor (right) decoding across time. Colored bars on the x-axis (blue; red; green) indicate clusters where conditions differ significantly from chance after cluster correction (p<0.05). Red and green dashed lines indicate clusters with a significant difference between DpTv unique and DpTp unique conditions after cluster correction (p<0.05). (B) Averaged auc scores during the pre_search display (−250–0 ms; left) and the post-search display (0–550 ms; right) visualized by notched boxplots with solid horizontal lines corresponding to the mean. Horizontal black dashed lines across plots indicates chance performance, whereas the vertical dashed black lines in the upper plots indicate the onset of placeholder (−250 ms) and the search display (0 ms).
Figure 5
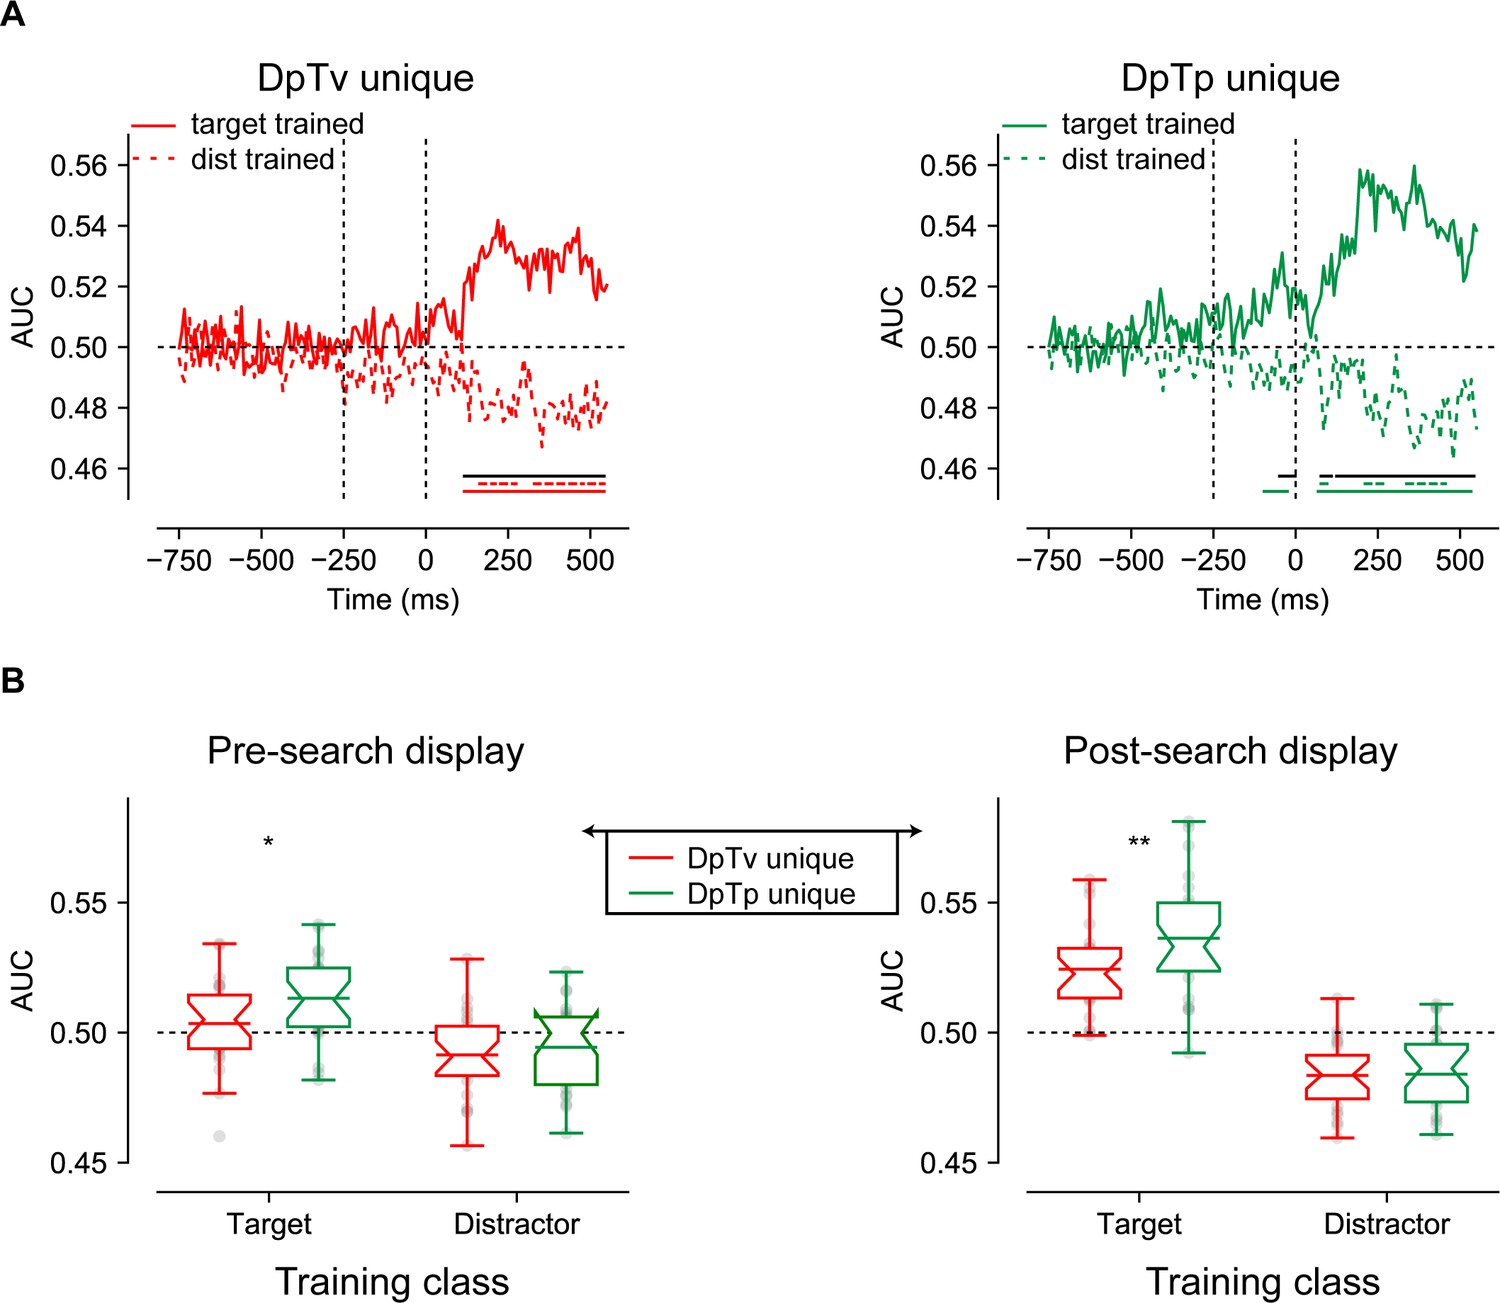
Multivariate decoding of the target using either weights from a model trained on targets spatial frequencies and distractor spatial frequencies.
(A) AUC scores of DpTv unique (left) and DpTp unique (right) decoding across time. Colored bars on the x-axis indicate clusters where conditions differ significantly from chance after cluster correction (p<0.05). Solid black lines indicate clusters with a significant difference between models trained on targets and distractors after cluster correction (p<0.05). (B) Averaged auc scores during the pre_search display (−250 to 0 ms; left) and the post-search display (0–550 ms; right) visualized by notched boxplots with solid horizontal lines corresponding to the mean. Horizontal black dashed lines across plots indicates chance performance, whereas the vertical dashed black lines in the upper plots indicate the onset of placeholder (−250 ms) and the search display (0 ms).
Figure 6
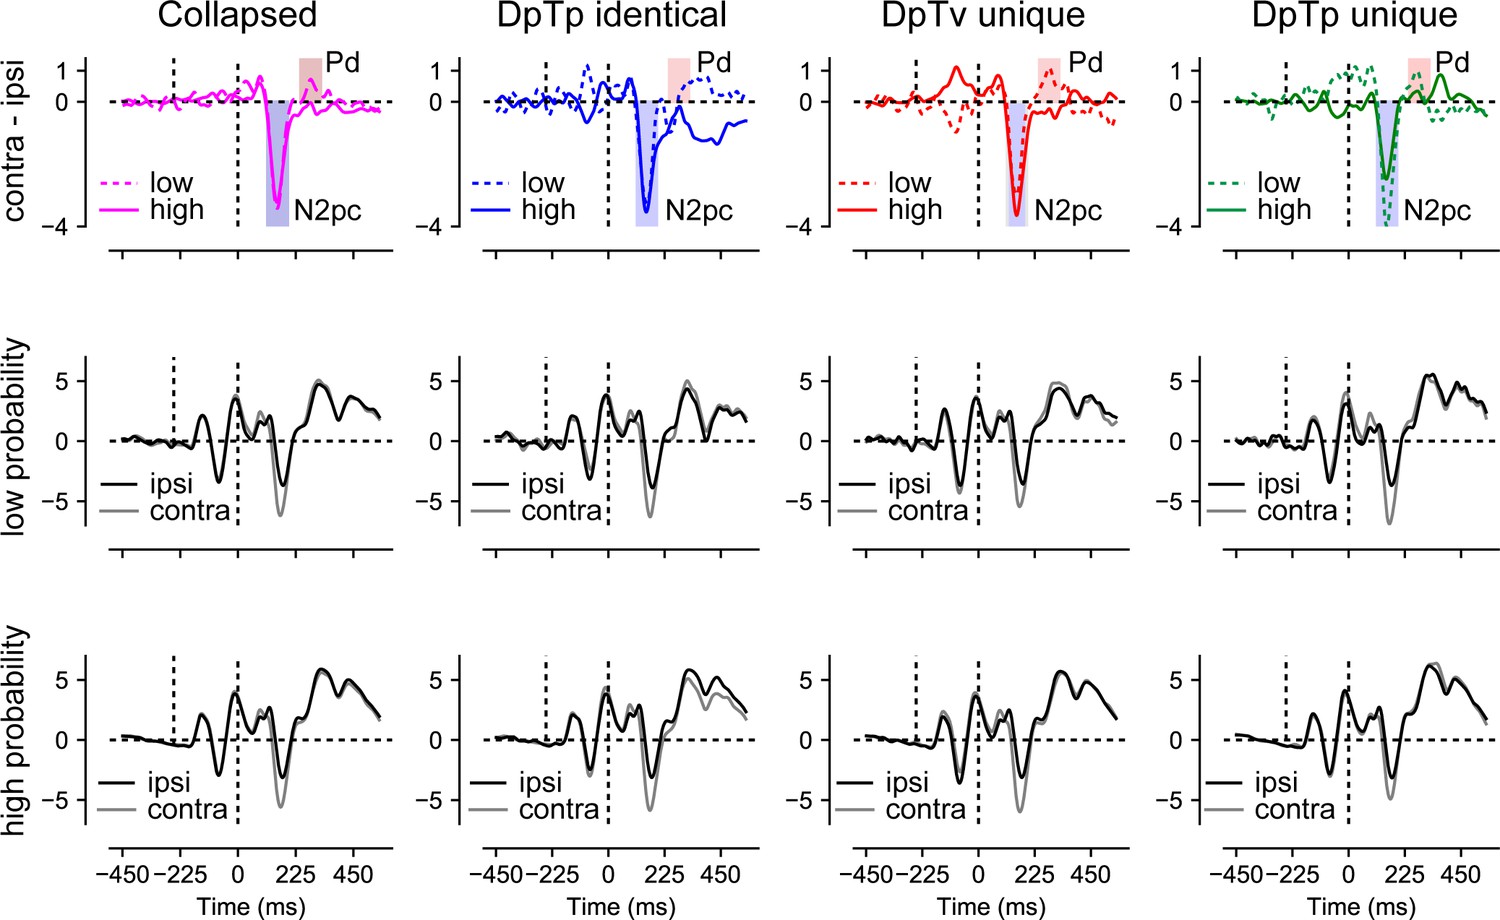
Distractor Pd reduces as a function of distractor location expectations.
ERP results from search trials with lateral distractors collapsed across all conditions (column 1) and separately for each condition (columns 2–4). Row one shows the difference between contra- and ipsilateral waveforms for the low and high-probability distractor location. Only the distractor-evoked Pd, not the N2pc, was reduced at high- vs. low-probability distractor locations (top left figure). Rows 2 and 3 show the contra- and ipsilateral waveforms for the low- and high-probability distractor locations, respectively. Microvolts are plotted on the y-axes. Blue and red transparent rectangles in row one show the mean averaging windows for N2pc and Pd analyses.
Figure 7
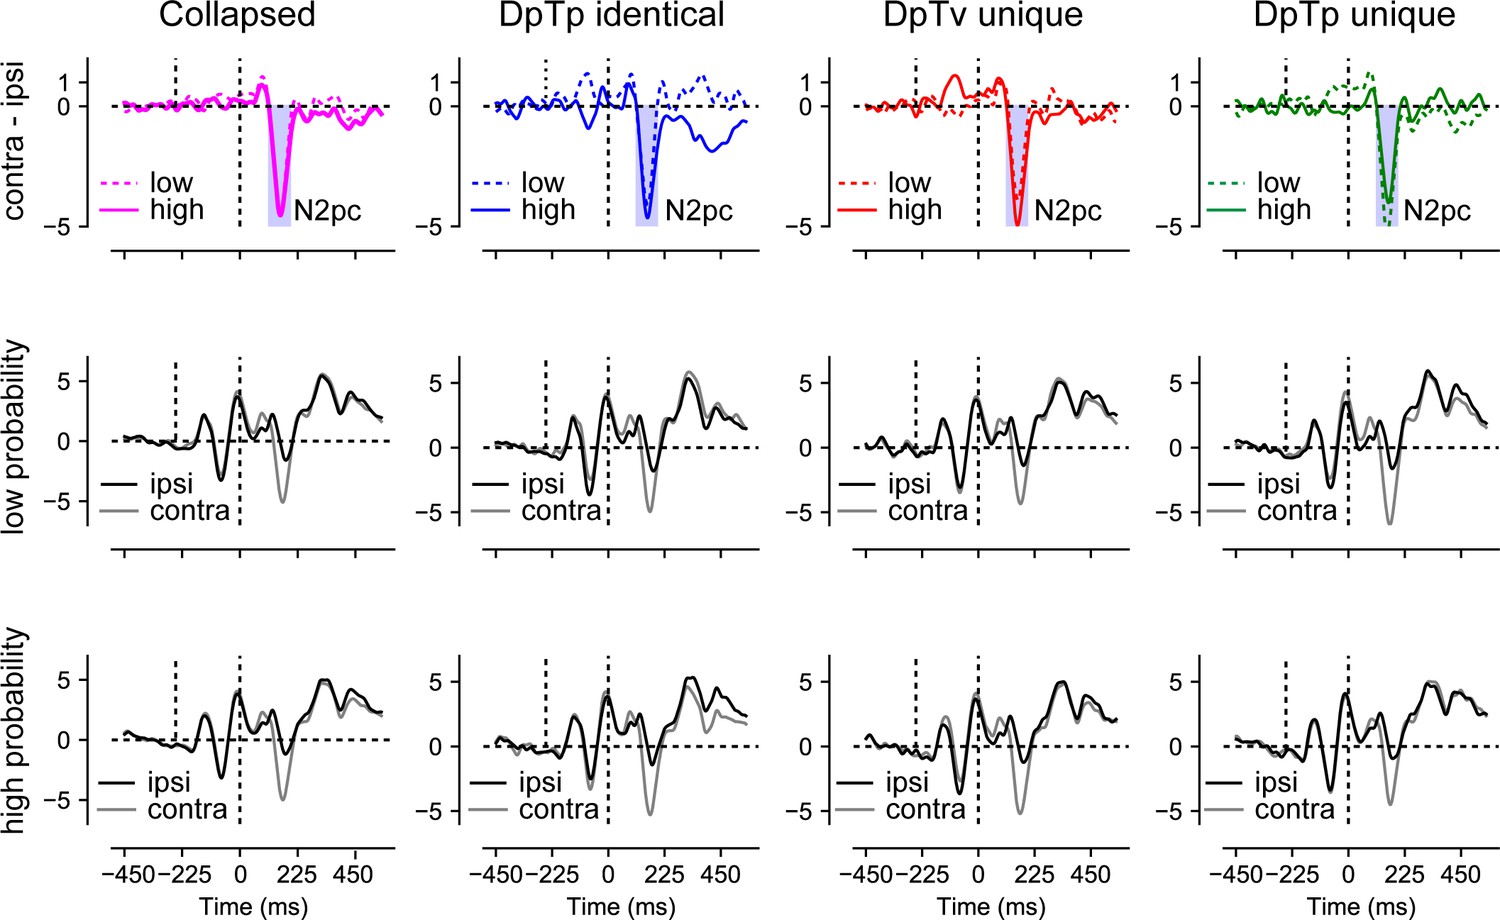
No effect of distractor or target expectations on the target-evoked N2pc.
This figure displays ERP results from search trials with lateral targets collapsed across all conditions (column 1) and separately for each condition (columns 2–4) and the low- and high-probability distractor locations (rows 2 and 3, respectively). Row one shows the difference between contra- and ipsilateral waveforms for low- and high-probability location. Microvolts are plotted on the y-axes. Blue transparent rectangles in row one show the mean averaging windows for N2pc analyses.
Author response image 1

Multivariate decoding of the target and distractor spatial frequency across conditions using broad-band EEG of all 64 electrodes.
(A) AUC scores of target (left) and distractor (right) decoding across time without a pre-stimulus baseline. (B) AUC scores of target (left) and distractor (right) decoding across time with a condition specific pre-stimulus baseline. Colored bars on the x-axis (blue; red; green) indicate clusters where conditions differ significantly from chance after cluster correction (p <0.05). Black lines indicate clusters with a significant difference between DpTv unique and DpTp unique conditions after cluster correction (p <0.05).
Additional files
Download links
A two-part list of links to download the article, or parts of the article, in various formats.
Downloads (link to download the article as PDF)
Open citations (links to open the citations from this article in various online reference manager services)
Cite this article (links to download the citations from this article in formats compatible with various reference manager tools)
Neural mechanisms underlying expectation-dependent inhibition of distracting information
eLife 9:e61048.
https://doi.org/10.7554/eLife.61048


