Increasing heart vascularisation after myocardial infarction using brain natriuretic peptide stimulation of endothelial and WT1+ epicardial cells
- Division of Angiology, Heart and Vessel Department, Centre Hospitalier Universitaire Vaudois and University of Lausanne, Switzerland
Figures
Figure 1 with 1 supplement
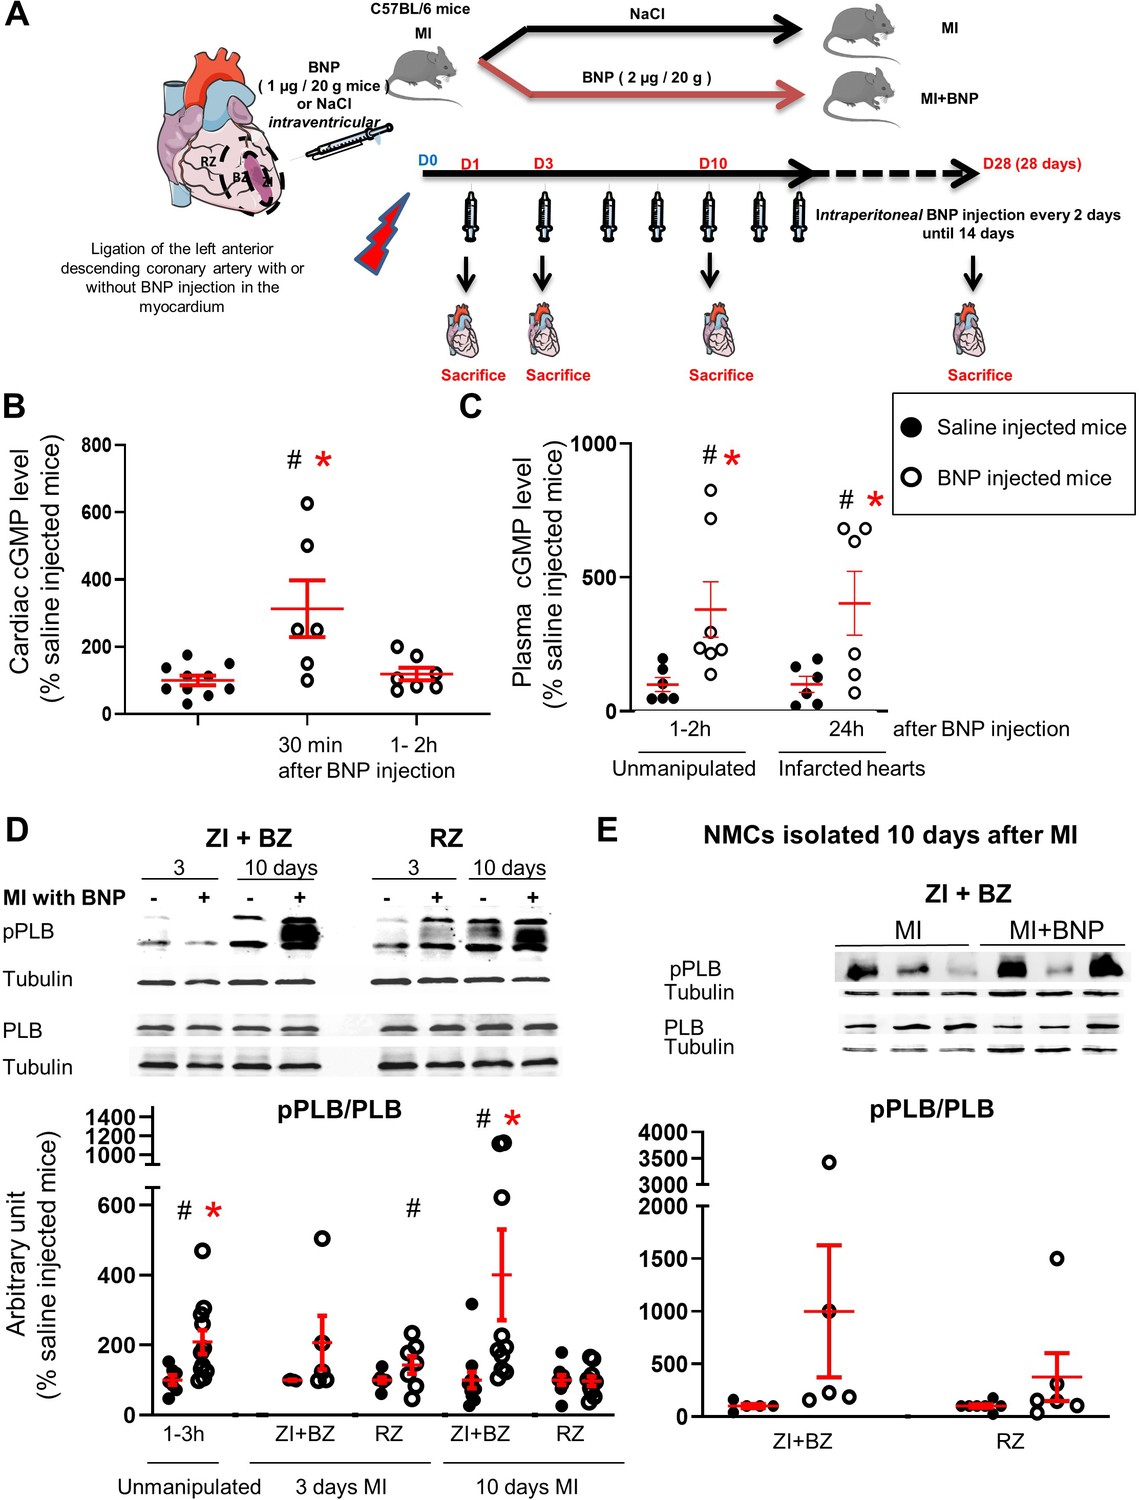
Intraperitoneal BNP injection acts on cardiac non-myocyte cells (NMCs).
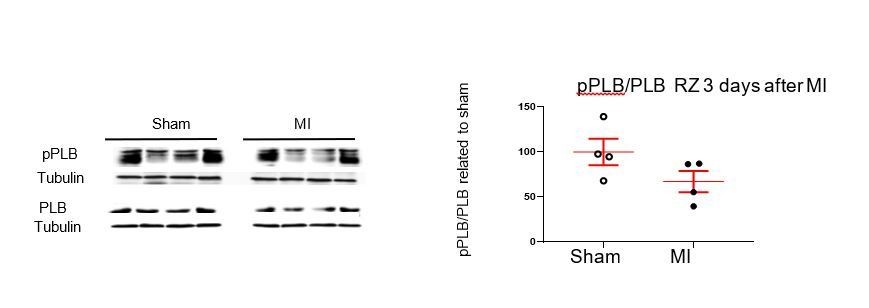
(A) Experimental protocol as described in details in Material and methods section. (B) cGMP level measurement in cardiac tissue of unmanipulated mice injected or not with BNP for 30 min and 1–2 hr. n = at least six mice. (C) cGMP plasma level measurement in unmanipulated or infarcted mice injected or not with BNP. n = 6–7 mice for unmanipulated hearts, n = 6 infarcted mice 24 hr after injection. (D) Representative western blots of total proteins isolated hearts of saline or BNP-injected mice, 3 and 10 days after surgery. Blots were stained with antibodies against phospho phospholamban (pPLB), phospholamban (PBL) and Tubulin (used as loading control). Only the bands at the adequate molecular weight were represented here: Tubulin 55 kDa, pPLB between 17 and 26 kDa and PLB 25 kDa. Quantification of the pPLB/PLB ratio. Data obtained from western blot analysis on unmanipulated (n = 7–11 mice per group) and infarcted hearts of mice treated or not with BNP. Results of BNP-treated hearts expressed relatively to the average of saline-treated hearts. 3 days after MI: n = 5 mice for the ZI+BZ and 7–8 mice for the RZ 10 days after MI: n = 10–11 mice for the ZI+BZ and n = 9–10 mice for the RZ. (E) NMCs were isolated from both areas of infarcted hearts treated or not with BNP 10 days after surgery. Proteins were extracted from these cells (n = 5 independent isolation per group for the ZI+BZ and n = 6–7 for the RZ) and pPLB/PLB ratio was evaluated. Only the western blots obtained for NMCs isolated from the ZI+BZ were represented. For B, C, D and E: Individual values are represented and the means ± SEM are represented in red. Statistical analysis was performed only for groups with n ≥ 6. # p<0.05 for different variance between groups, *p<0.05 using unpaired T tests with or without Welch’s corrections.
Figure 1—figure supplement 1
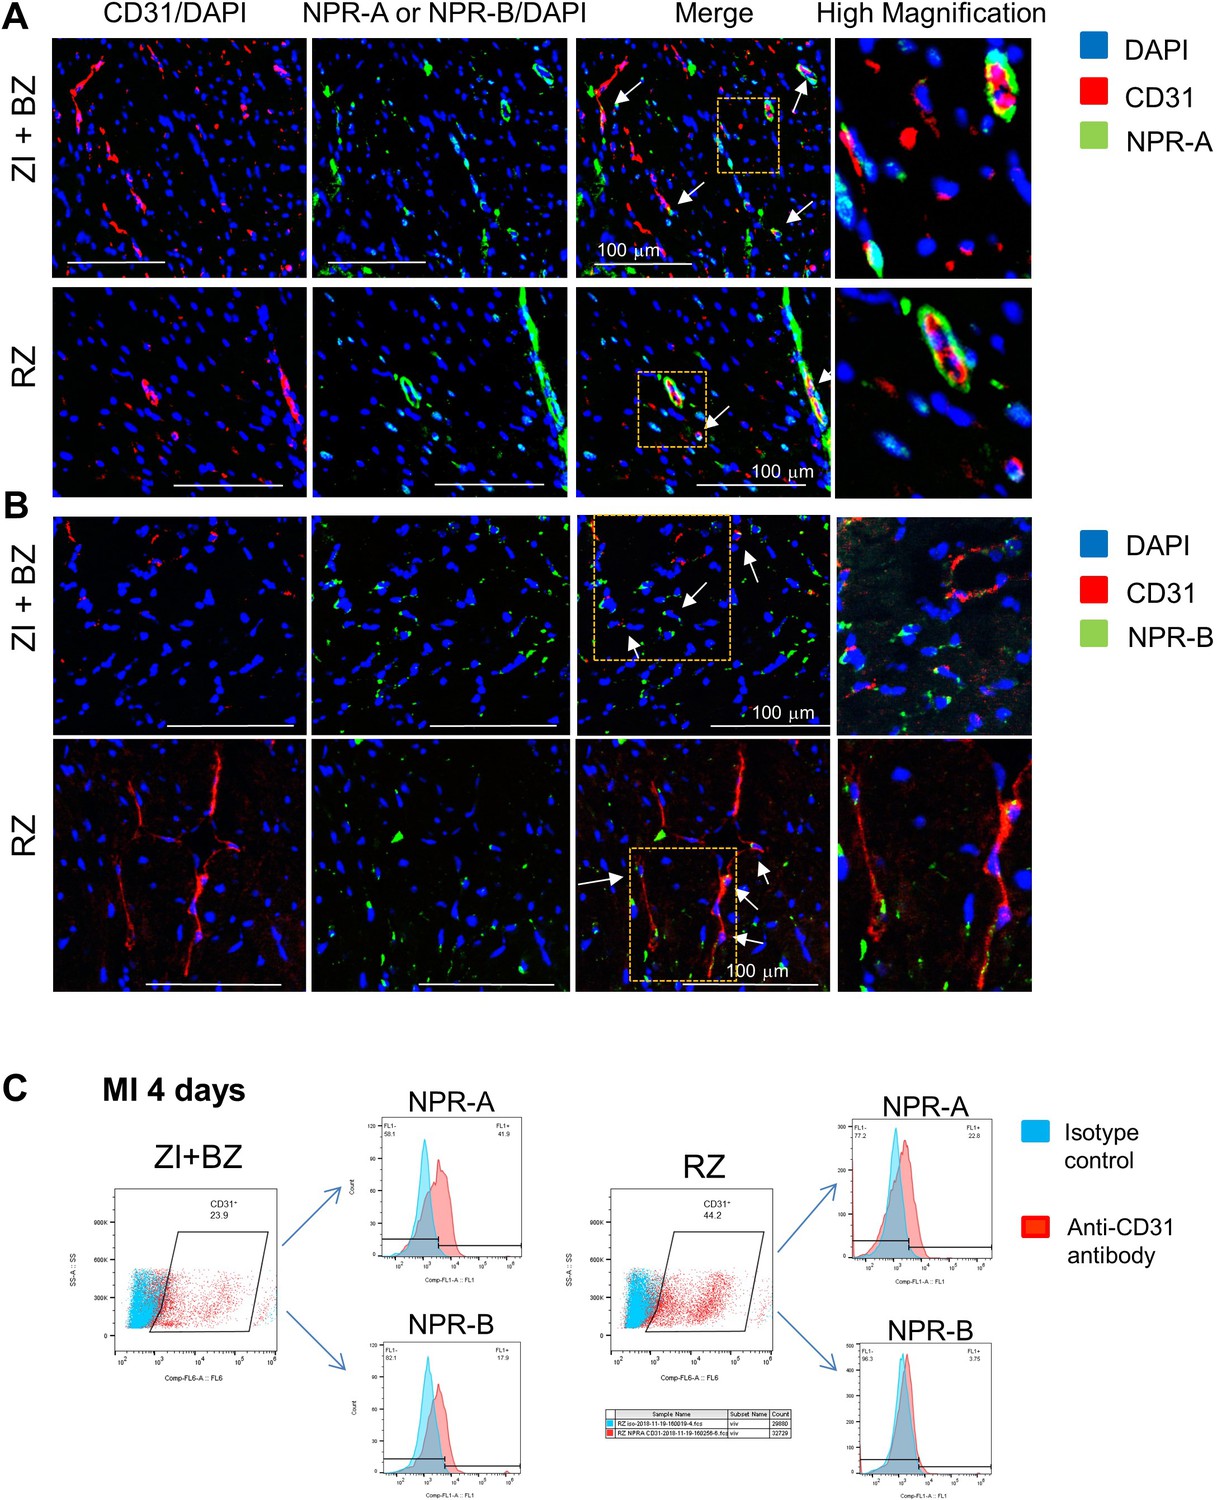
Adult cardiac endothelial cells express BNP receptors in both infarcted and border (ZI+BZ) and remote (RZ) zones.
The presence of NPR-A (A) or NPR-B (B) was assessed by immunostainings on adult hearts 24 hr after MI or by flow cytometry analysis (C) on adult non-myocytes cells isolated from hearts 4 days after MI. Antibody against CD31 was used in combination with anti-NPR-A or NPR-B antibodies. The percentages of NPR-A or NPR-B expressing cells were evaluated on CD31+ cells.
Figure 2
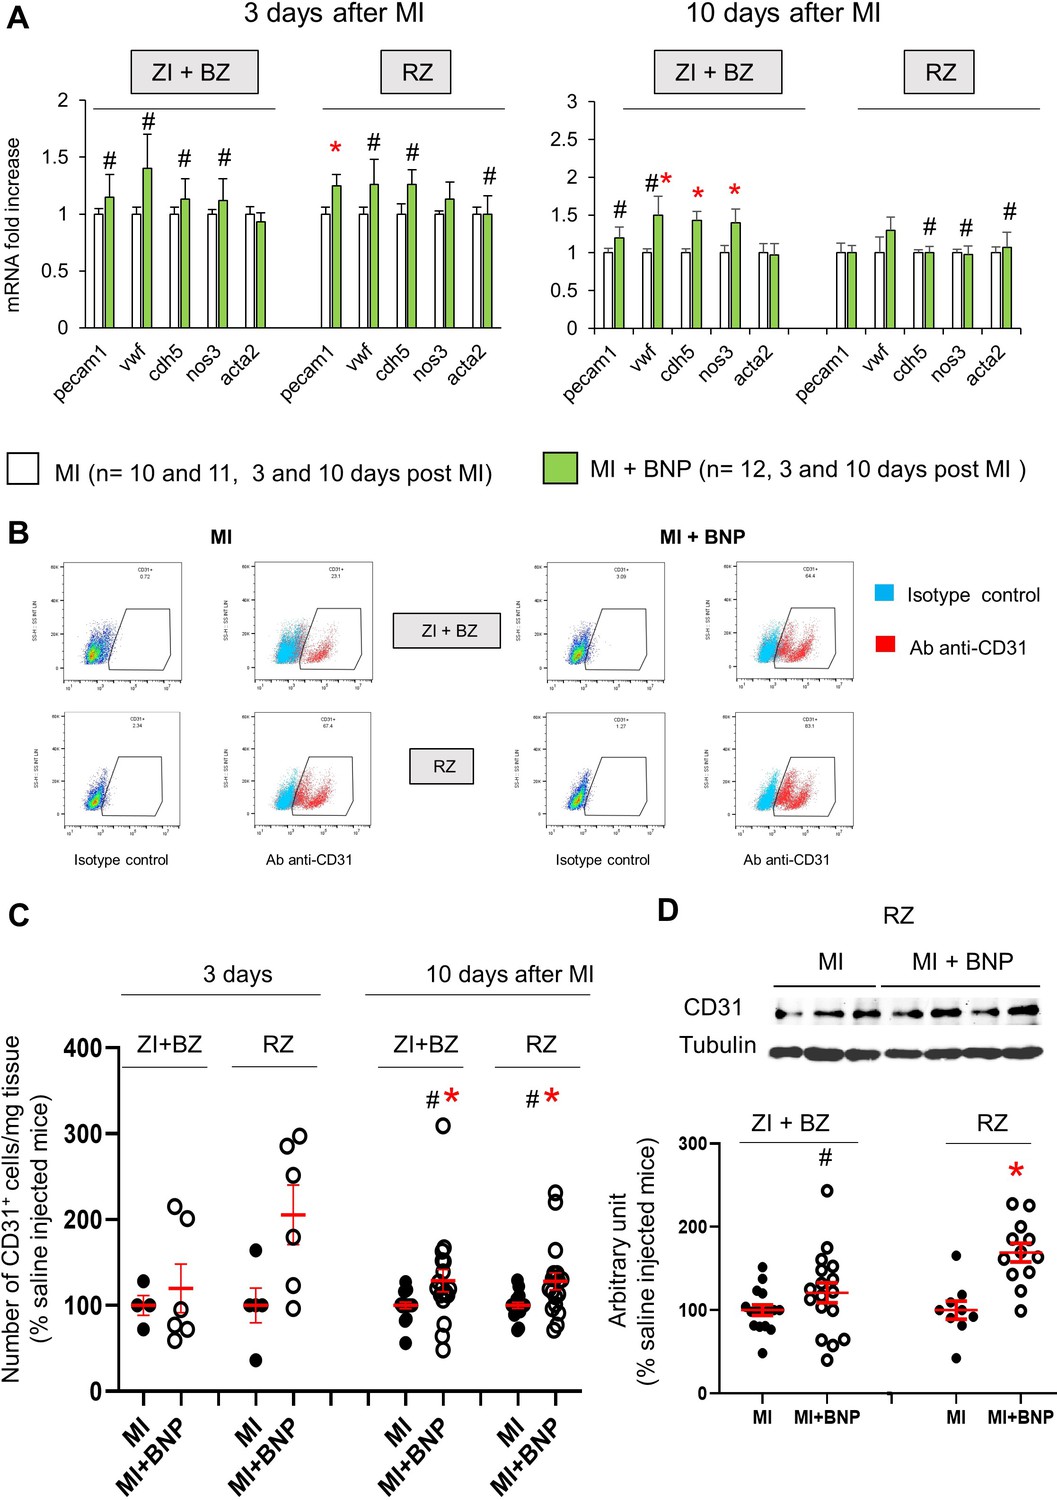
Increased endothelial cell number in infarcted hearts after BNP treatment.
(A) Quantitative relative expression of mRNAs coding for endothelial cell specific proteins (CD31 (pecam1 gene), von Willbrand factor (vwf gene), Ve-cadherin (cdh5 gene), eNOS (nos3 gene)), alpha smooth muscle actin (alpha SMA) (acta2 gene) in the ZI+BZ and RZ areas of saline (MI) and BNP-injected hearts (MI+BNP) 3 and 10 days after surgery. Results expressed as fold-increase above the levels in saline-injected infarcted mice. Results are represented as mean ± SEM. *p<0.05. (B) Representative flow cytometry analysis of NMCs isolated from the ZI+BZ or RZ of infarcted hearts after BNP or saline treatments 10 days after MI. NMCs stained with control isotype or antibody against CD31 protein. Analysis performed on DAPI negative cells (i.e. living cells). (C) Quantification of the data obtained by flow cytometry analysis on NMCs isolated from infarcted hearts 3 and 10 days after MI. The number of CD31+ cell in BNP-treated hearts related to the number obtained in saline-injected hearts. 3 days after MI: n = 4 MI and 6 MI + BNP mice. 10 days after MI: n = 16 MI and 15 MI +BNP mice. (D) Representative western blot of proteins extracted from the ZI+BZ of MI and MI+BNP hearts 10 days after surgery. Blots were stained with antibodies against CD31 and Tubulin (used as loading control). Only the bands at the adequate molecular weight were represented here: Tubulin (55 kDa), CD31 (130 kDa). Quantification of the data from western blot analysis expressed relative to the average of MI hearts. Results were from n = 15–16 different hearts for the ZI+BZ and n = 9–12 hearts for the RZ. (C, D) Individual values are represented and the means ± SEM are represented in red. Statistical analysis was performed only for groups with n ≥ 6. # p<0.05 for different variance between groups, *p<0.05 using unpaired T tests with or without Welch’s corrections.
Figure 3 with 2 supplements
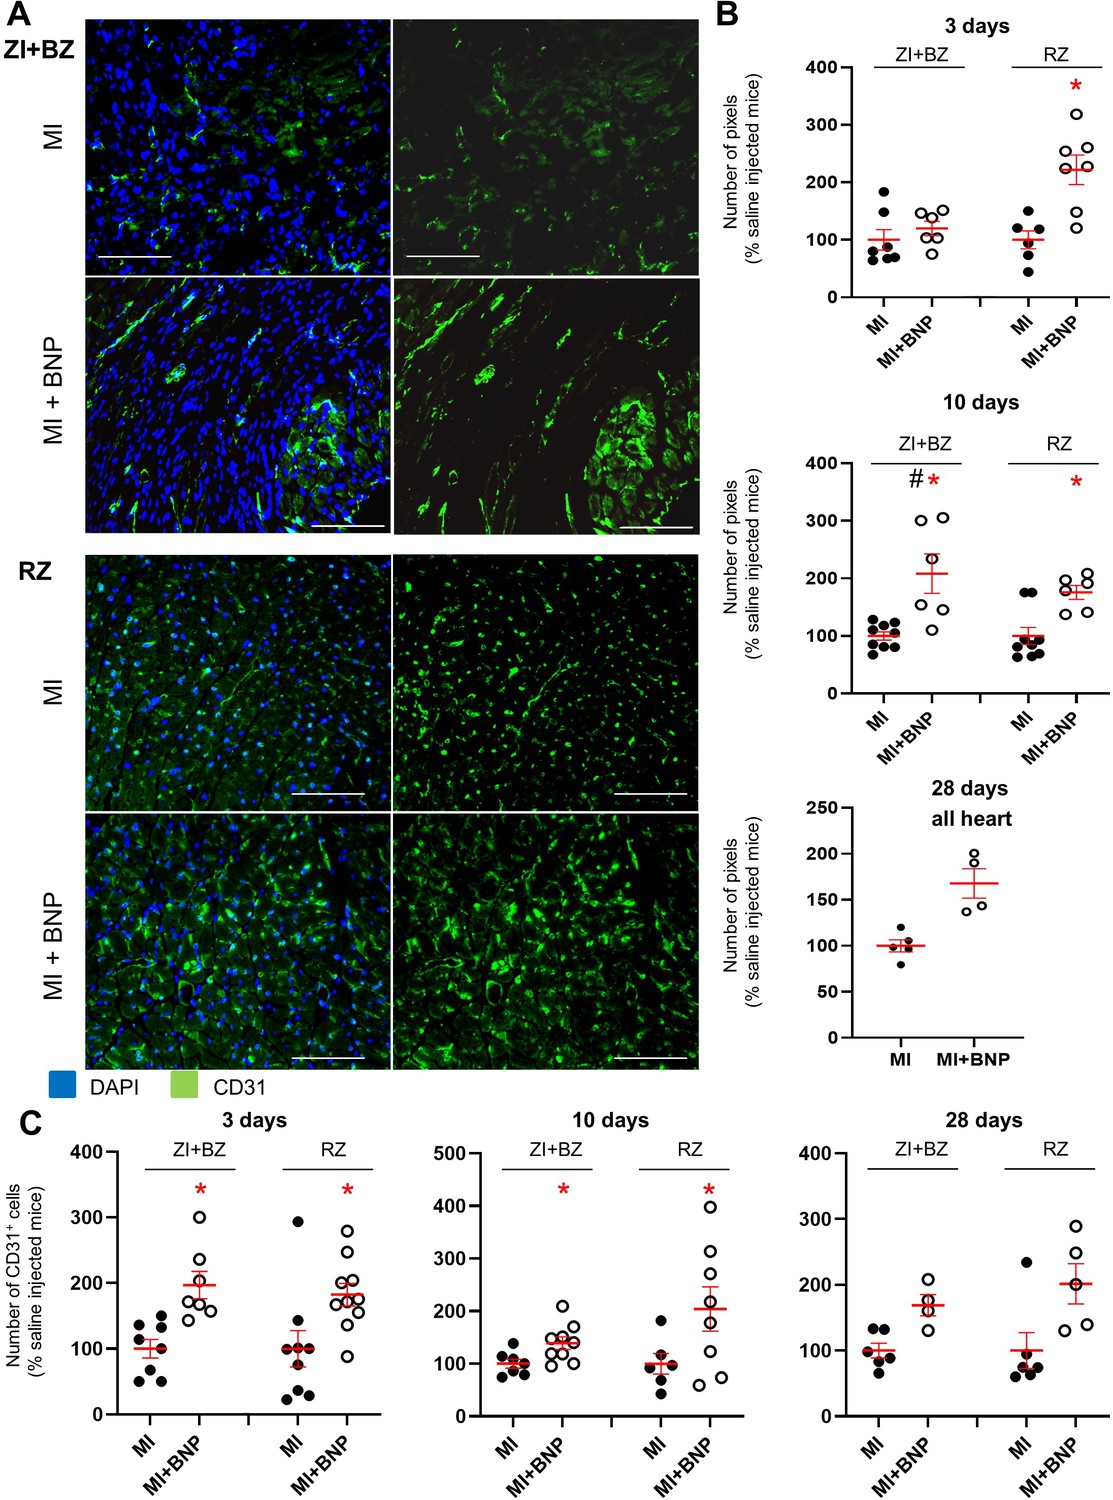
Increased vascularisation in BNP-treated infarcted hearts.
(A) Representative immunostainings against CD31 protein (green) on hearts removed from saline-(MI) and BNP-treated infarcted mice (MI + BNP) 10 days after surgery. Nuclei stained in blue with DAPI. Scale bars: 100 μm. (B) CD31 staining intensity measured on at least 10 different pictures per heart and per area 3, 10 and 28 days after MI. Number of pixel in BNP-injected mice related to the numbers of saline-injected mice. (C) CD31+ cell number counted on heart sections of the different area of saline- and BNP-treated infarcted hearts. Cells counted on at least 10 different pictures per area and mouse. (B–C): Individual values are represented and the means ± SEM are represented in red. Statistical analysis was performed only for groups with n ≥ 6. # p<0.05 for different variance between groups, *p<0.05 using unpaired T tests with or without Welch’s corrections.
Figure 3—figure supplement 1
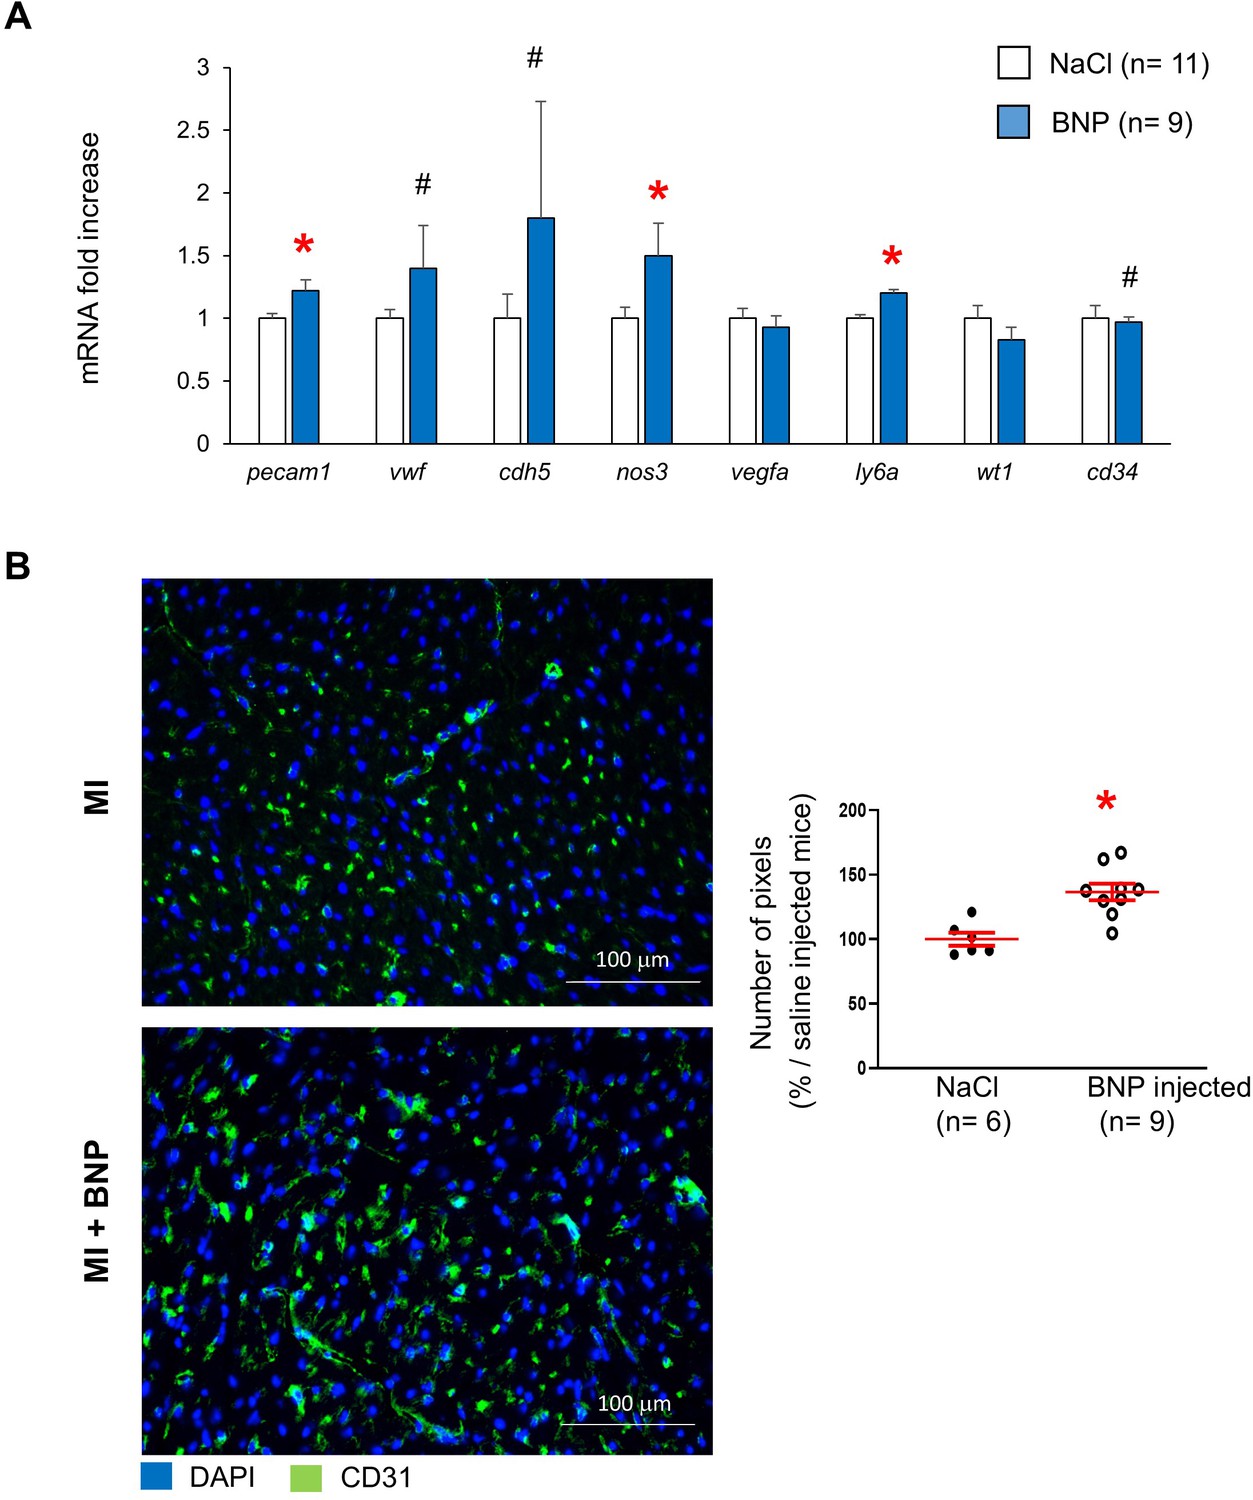
BNP injection led to increased vascularisation in unmanipulated hearts.
(A). Quantitative relative expression of mRNAs coding for CD31 (pecam1 gene), von Willbrand factor (vwf gene), Ve-cadherin (cdh5 gene), eNOS (nos3 gene), VEGF (vegfa gene), Stem Cell antigen 1 (Sca-1) (ly6a gene), Wilms’ tumour 1 (wt1 gene) and CD34 (cd34 gene). (B) Representative immunostainings against CD31 protein (green) of saline and BNP-treated unmanipulated hearts. Nuclei stained in blue with DAPI. CD31 staining intensity measured on at least 10 different pictures per heart and per area. The numbers of pixel obtained for saline-treated hearts related to the numbers obtained in BNP injected hearts. All the results are means ± SEM, # p<0.05 for different variance between groups, *p≤0.05 using unpaired T tests with or without Welch’s corrections.
Figure 3—figure supplement 2
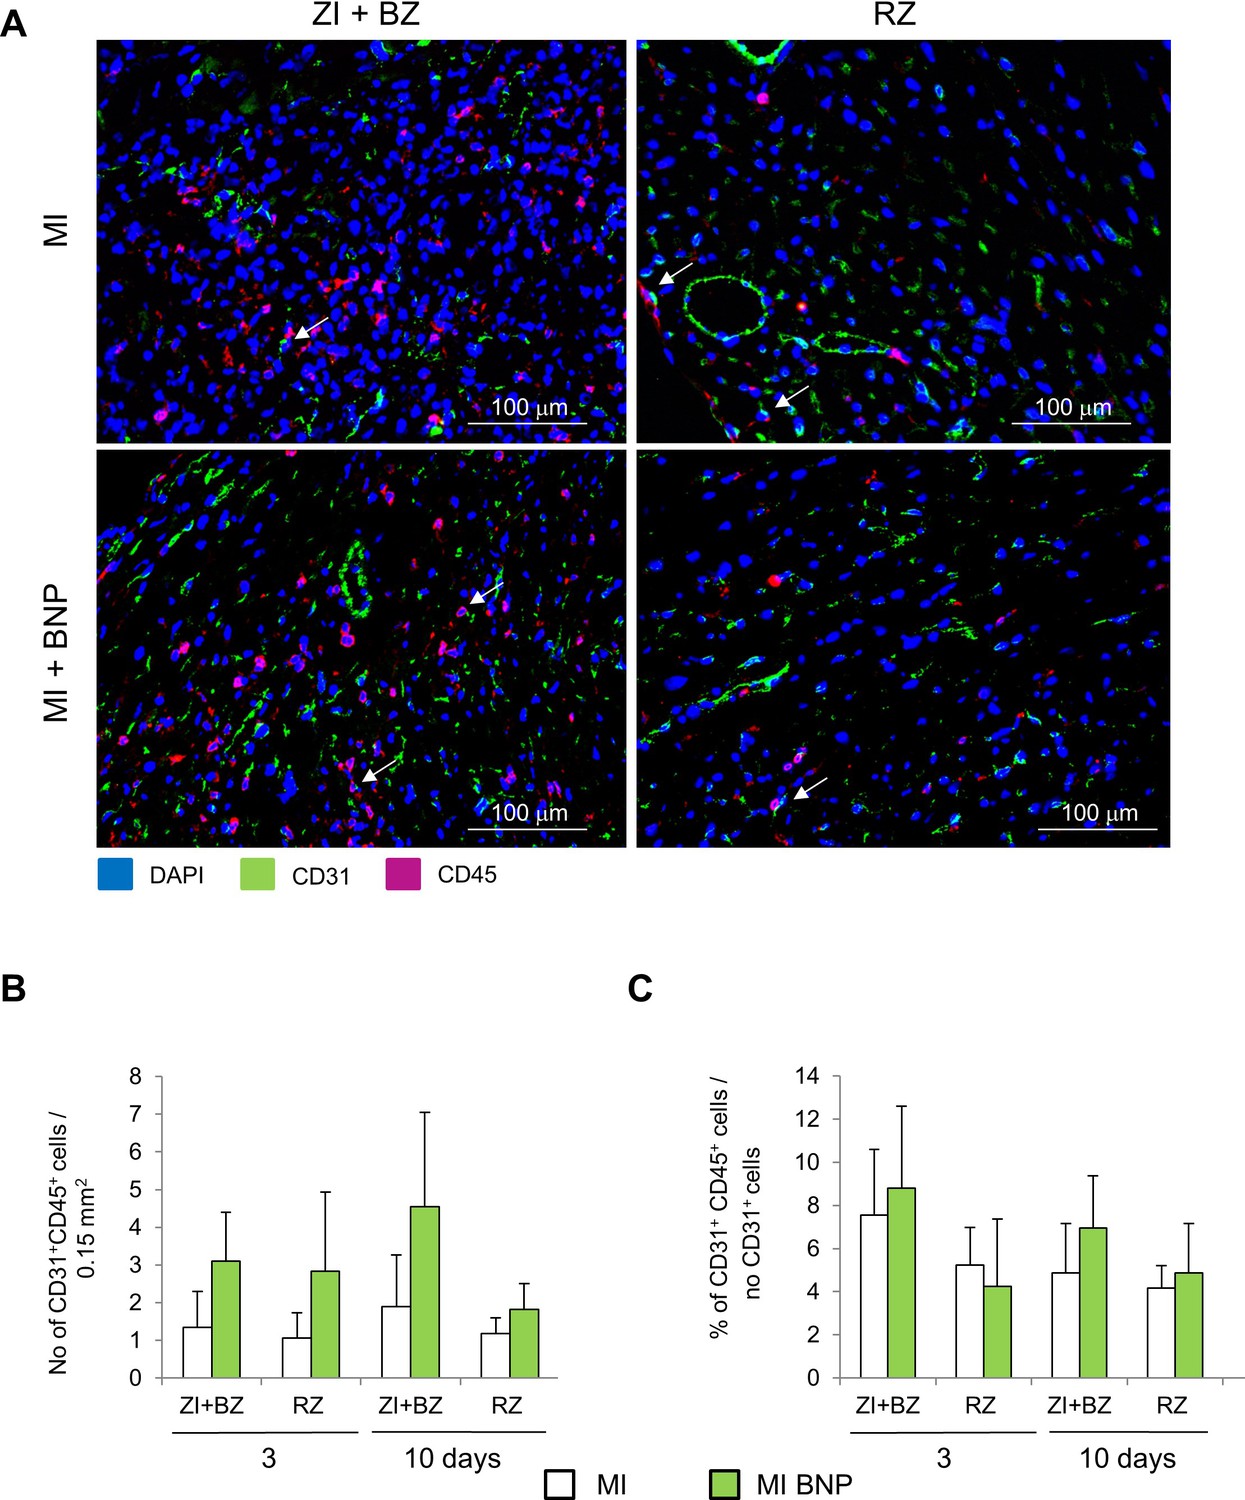
Few cardiac endothelial cells in infarcted and remote zone 3 and 10 days after infarction express the CD45 protein.
The presence of CD31+ CD45+ cells was assessed by immunostainings on adult hearts 3 and 10 days after MI. (A) Representative pictures of the stainings 10 days after MI. (B–C) The numbers of double positive cells were counted (B) on heart sections (0.15 mm2) of the different area of saline (MI) and BNP-treated infarcted hearts (MI + BNP) and related (C) to the total number of CD31+ cells. Cells were counted on at least 10 different pictures per area and mouse. n = 4–6 mice per group. All the results are means ± SEM.
Figure 4
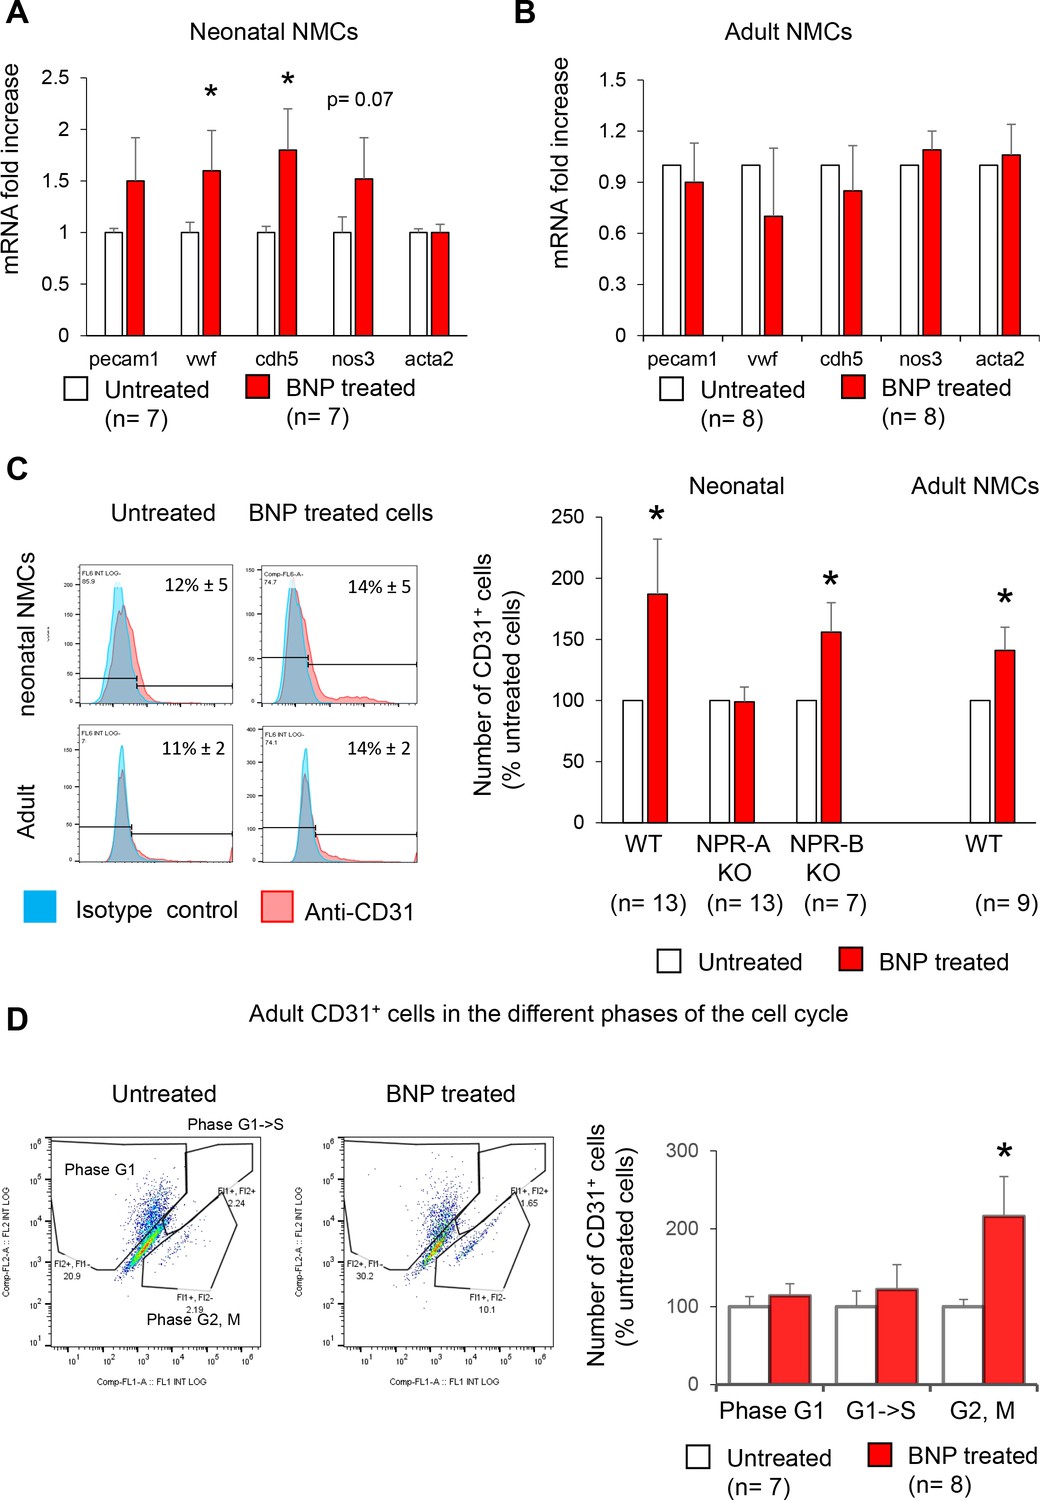
Increased number of endothelial cells in vitro after BNP treatment.
(A–B) Quantitative relative expression of mRNAs coding for endothelial cell specific proteins CD31 (pecam1 gene), von Willbrand factor (vwf gene), Ve-cadherin (cdh5 gene), eNOS (nos3 gene), alpha smooth muscle actin (alpha SMA) (acta2 gene) in NMCs isolated from neonatal (A) or adult (B) hearts cultured until confluence with or without BNP. Results expressed as fold-increase above the levels in untreated cells. (C) Flow cytometry analysis to determine the percentage of CD31+ cells (left: Representative histograms) in untreated or BNP-treated NMCs isolated from neonatal or adult hearts. Right: Quantification of the number of CD31+ cells. Results expressed as fold-increase above the number obtained in untreated cells. Neonatal NMCs were isolated from heart of C57BL/6 (WT), NPR-A or NPR-B deficient pups. Adult NMCs were isolated only from C57BL/6 hearts. (D) Adult NMCs isolated from FUCCI mice and treated with or without BNP. Flow cytometry analysis (left: representative dot plots) to determine among the CD31+ cells, the percentages of cells in the G1 phase (Fl2+ Fl1-), in the G1- > S phase (Fl2+Fl1+) and in the G2, M phase (Fl2-Fl1+). Right: Quantification of the number of CD31+ cells in the different phases of the cell cycle. Results expressed as fold-increase above the numbers obtained in untreated cells. For all quantifications, the results are means ± SEM, paired T tests were used, *p<0.05.
Figure 5 with 1 supplement
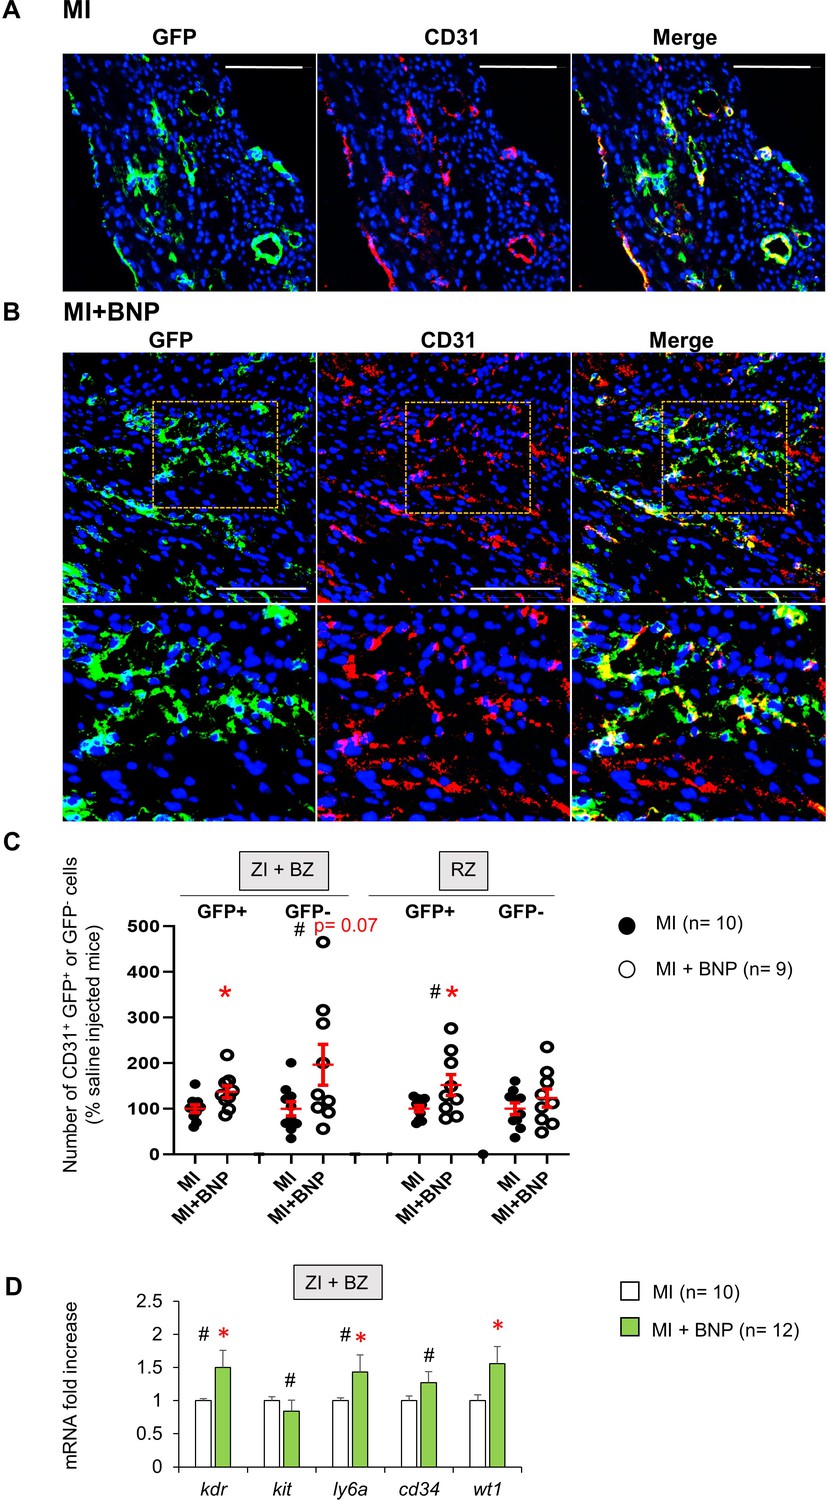
Mobilisation of resident mature endothelial and precursor cells in BNP-treated hearts.
(A) Representative pictures of the ZI+BZ area of Cdh5:ROSA26 infarcted hearts 10 days after surgery, treated (B) or not (A) with BNP and stained with DAPI (nuclei in blue) and antibody against CD31 protein (red). Endothelial cells or cells originating from CD31+ cells express GFP protein. Scale bars represent 100 μm. (B) Orange rectangles are represented at high magnification below. (C) Quantification of the number of GFP+ and GFP- CD31+ cells. Results expressed in BNP-injected mice as fold-increase above the numbers obtained in saline-injected mice. Individual values are represented and the means ± SEM are represented in red. (D) Quantitative relative expression of mRNAs coding for endothelial precursor specific proteins (Flk-1 (kdr gene), c-kit (kit gene), stem cell antigen 1 (Sca-1) (ly6a gene), CD34 (cd34 gene) and Wilms’ tumour 1 (WT1) (wt1 gene)) in ZI+BZ 3 days after MI. Results expressed as fold-increase above the levels in saline-injected mice. Results are means ± SEM. (C–D): # p<0.05 for different variance between groups, *p≤0.05 using unpaired T tests with or without Welch’s corrections.
Figure 5—figure supplement 1

Characterisation of the Cdh5:ROSA mouse model.
(A) Heterozygous Cdh5 Cre x ROSA mice were used to follow the Ve-Cadherin expressing cells. (B) Without tamoxifen injection no CD31+ cells expressed the GFP protein. (C) At time of surgery, 2 weeks after the first tamoxifen injection, 94% of CD31+ cells were GFP positive. (D) Representative pictures of infarcted hearts 10 days after MI. Only DAPI staining. The ZI+BZ in orange rectangles are represented at high magnification.
Figure 6
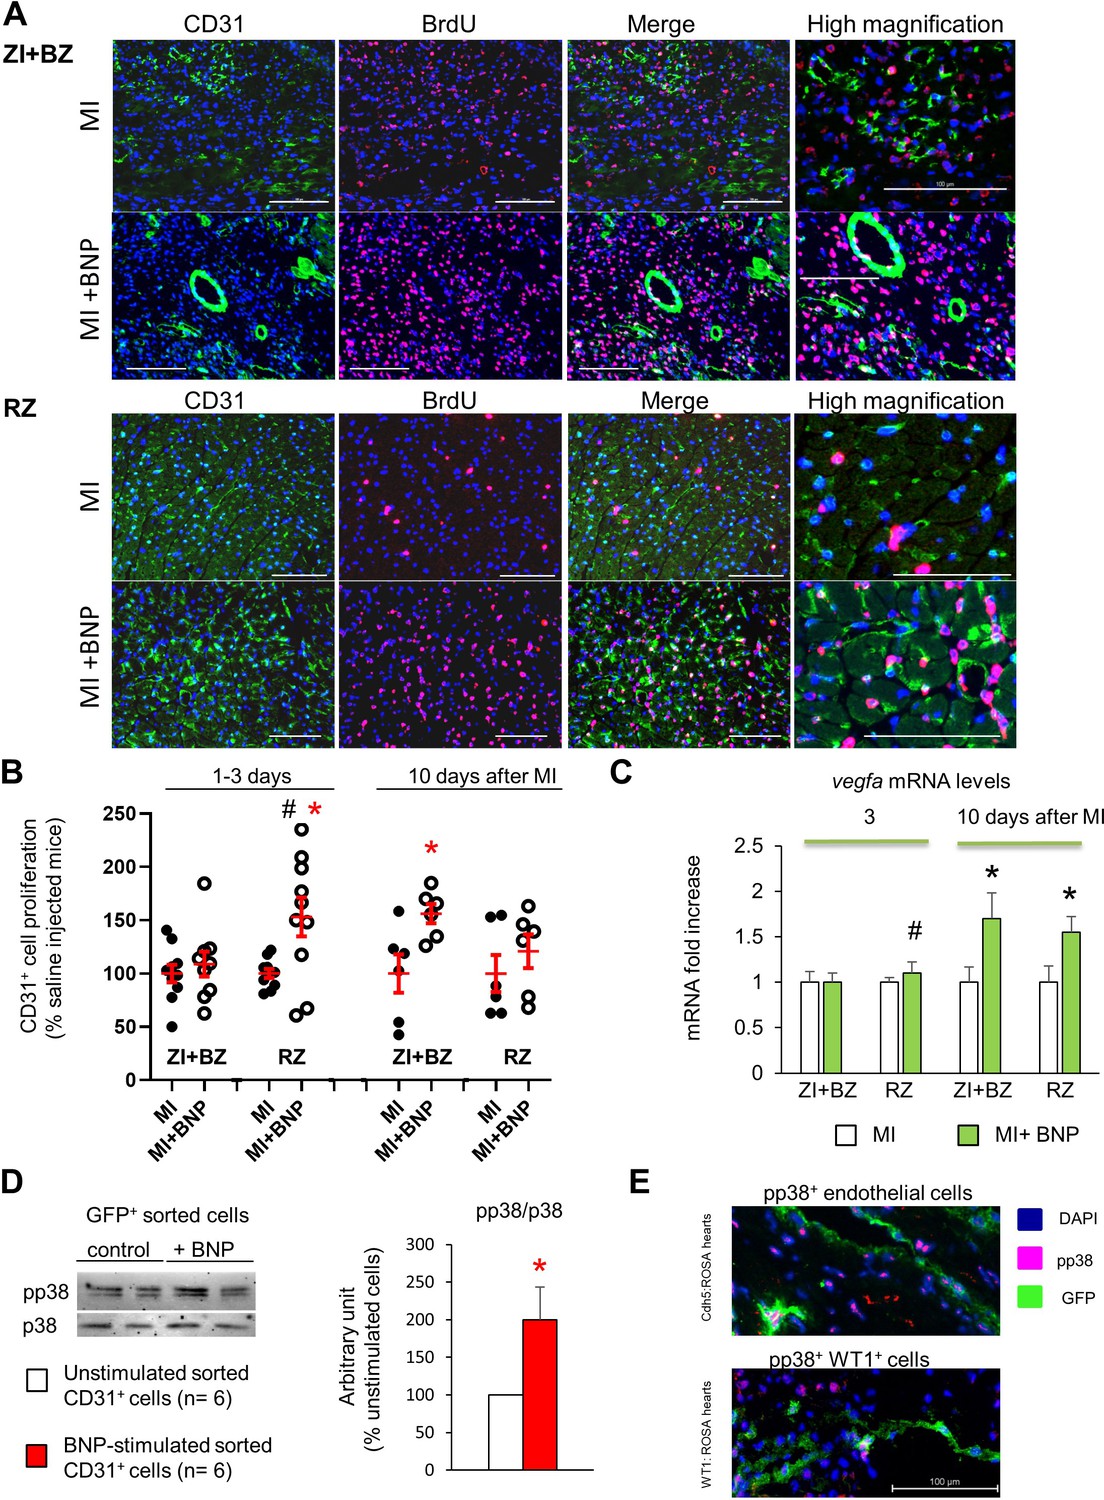
BNP stimulation of endothelial cell proliferation.
(A) Representative pictures of the ZI+BZ and RZ of C57BL/6 infarcted hearts, 10 days after surgery, treated or not with BNP and stained with DAPI (nuclei in blue) and antibodies against CD31 protein (green) and BrdU (pink). Scale bars: 100 µm. (B) Percentage of proliferating endothelial cells/per pictures in each area of the infarcted hearts (number of CD31+BrdU+ cells/CD31+ cells). Results in BNP-treated hearts related to those obtained in saline-treated hearts. At least 10 different pictures evaluated per mouse and per area. n = 10–9 mice per group 1–3 days after MI, n = 6 mice per group 10 days after MI. Individual values are represented. (C) Quantitative relative expression of mRNA coding for VEGF-A in ZI+BZ and RZ 3 and 10 days after MI. Results expressed as fold-increase above the levels in the hearts of saline-injected mice. n = 11–14 hearts per group. (B–C) Results are means ± SEM (represented in red). # p<0.05 for different variance between groups, *p≤0.05 using unpaired T tests with or without Welch’s corrections. (D) NMCs isolated from unmanipulated Cdh5:ROSA26 mice injected 2 weeks before with tamoxifen. GFP+ cells were sorted and stimulated immediately with or without BNP (5 µg/ml) during 1h30 at room temperature. Western bot analysis was then performed on these cells to evaluate p38 MAP kinase activation. Blots were stained with antibodies against phospho p38 (pp38) (43 kDa), p38 (43 kDa) and Tubulin (55 kDa). Quantification of the pp38/p38 ratio obtained from six independent cell sorting experiments. Results are means ± SEM, *p<0.05 using paired T test. (E) Representative pictures of BNP-treated infarcted hearts 10 days after surgery and stained with antibody against pp38. GFP+ cells represent either endothelial cells (in Cdh5:ROSA mice, picture at the top) or WT1+ cells (in WT1:ROSA mice, picture at the bottom).
Figure 7 with 1 supplement
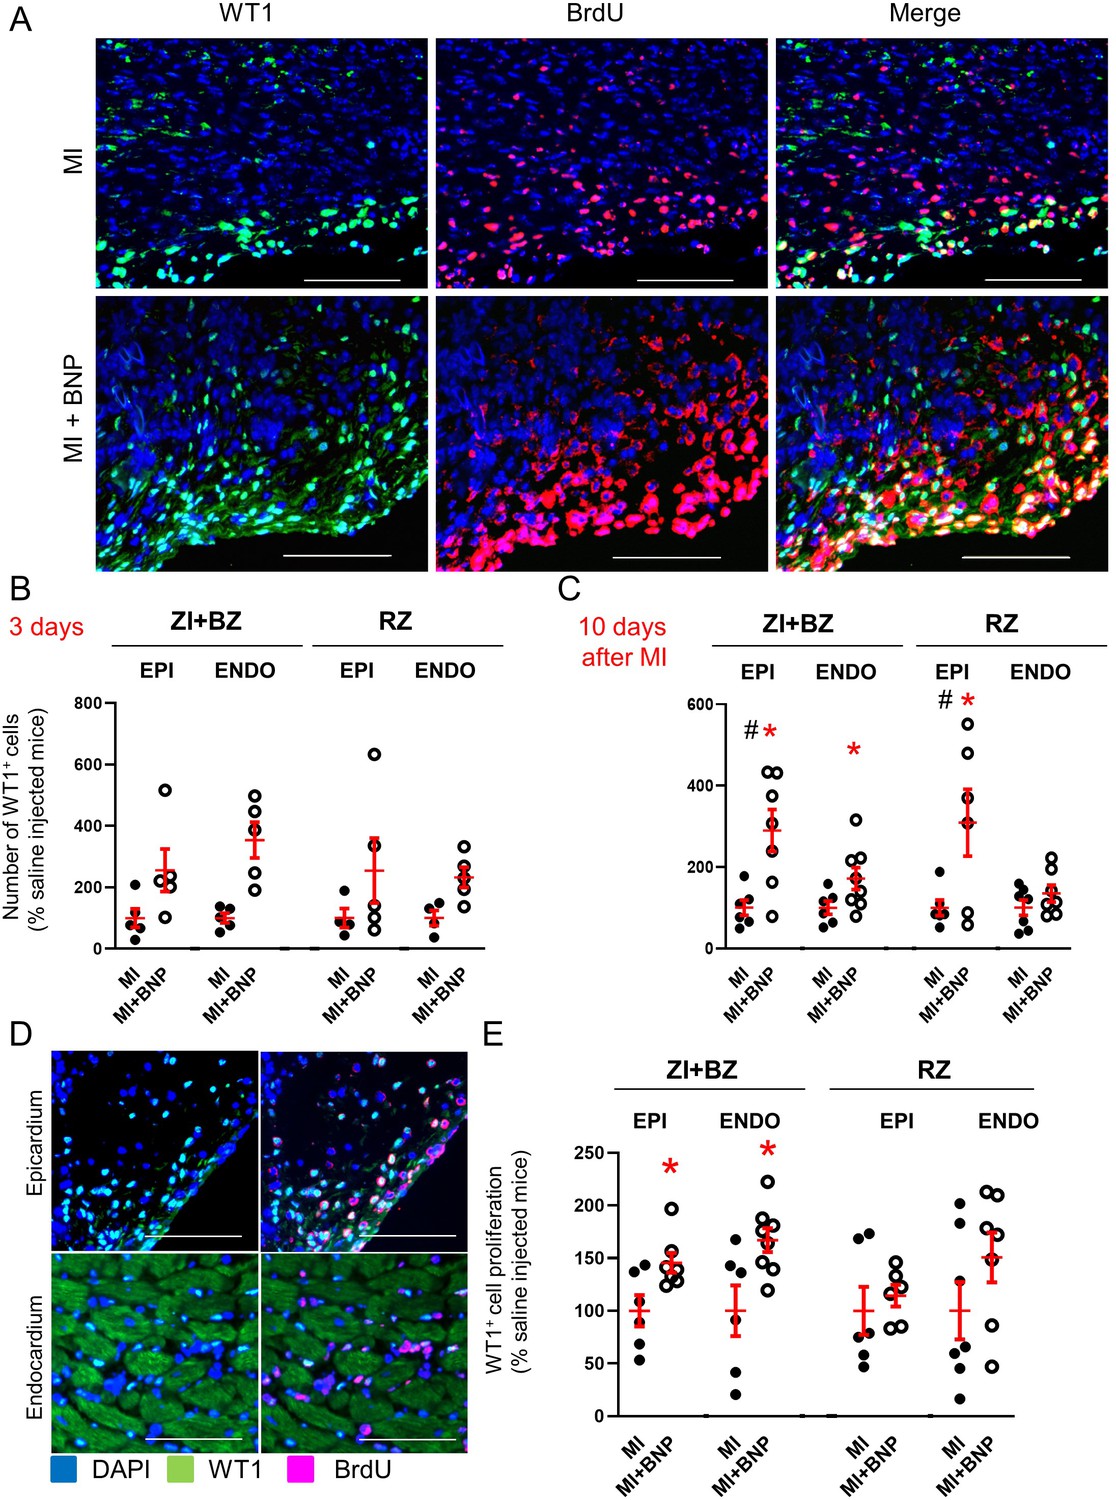
Increased number of WT1+ cells in infarcted BNP-treated hearts.
(A) Representative pictures of the epicardium of the ZI+BZ area of C57BL/6 infarcted hearts treated or not with BNP 10 days after MI and stained with DAPI (nuclei in blue) and antibodies against WT1 protein (green) and BrdU (red). Scale bars: 100 μm. (B–C) WT1+ cell number per pictures in the ZI+BZ and RZ of infarcted hearts treated or not with BNP 3 (B) and 10 (C) days after surgery. (D:) Representative immunostainings of proliferating WT1+ cells in the epicardium and endocardium of the ZI+BZ area of BNP-treated infarcted heart 10 days after MI. Scale bars: 100 μm. (E) Percentages of proliferating WT1+ cells (number of WT1+BrdU+ cells/total number of WT1+ cells) 10 days after MI. B, C, E: Results obtained in the epicardium separated from those obtained in the endocardium. Individual values are represented and the means ± SEM are represented in red. # p<0.05 for different variance between groups, *p≤0.05 using unpaired T tests with or without Welch’s corrections only for groups with n ≥ 6. EPI: epicardium, ENDO: endocardium.
Figure 7—figure supplement 1
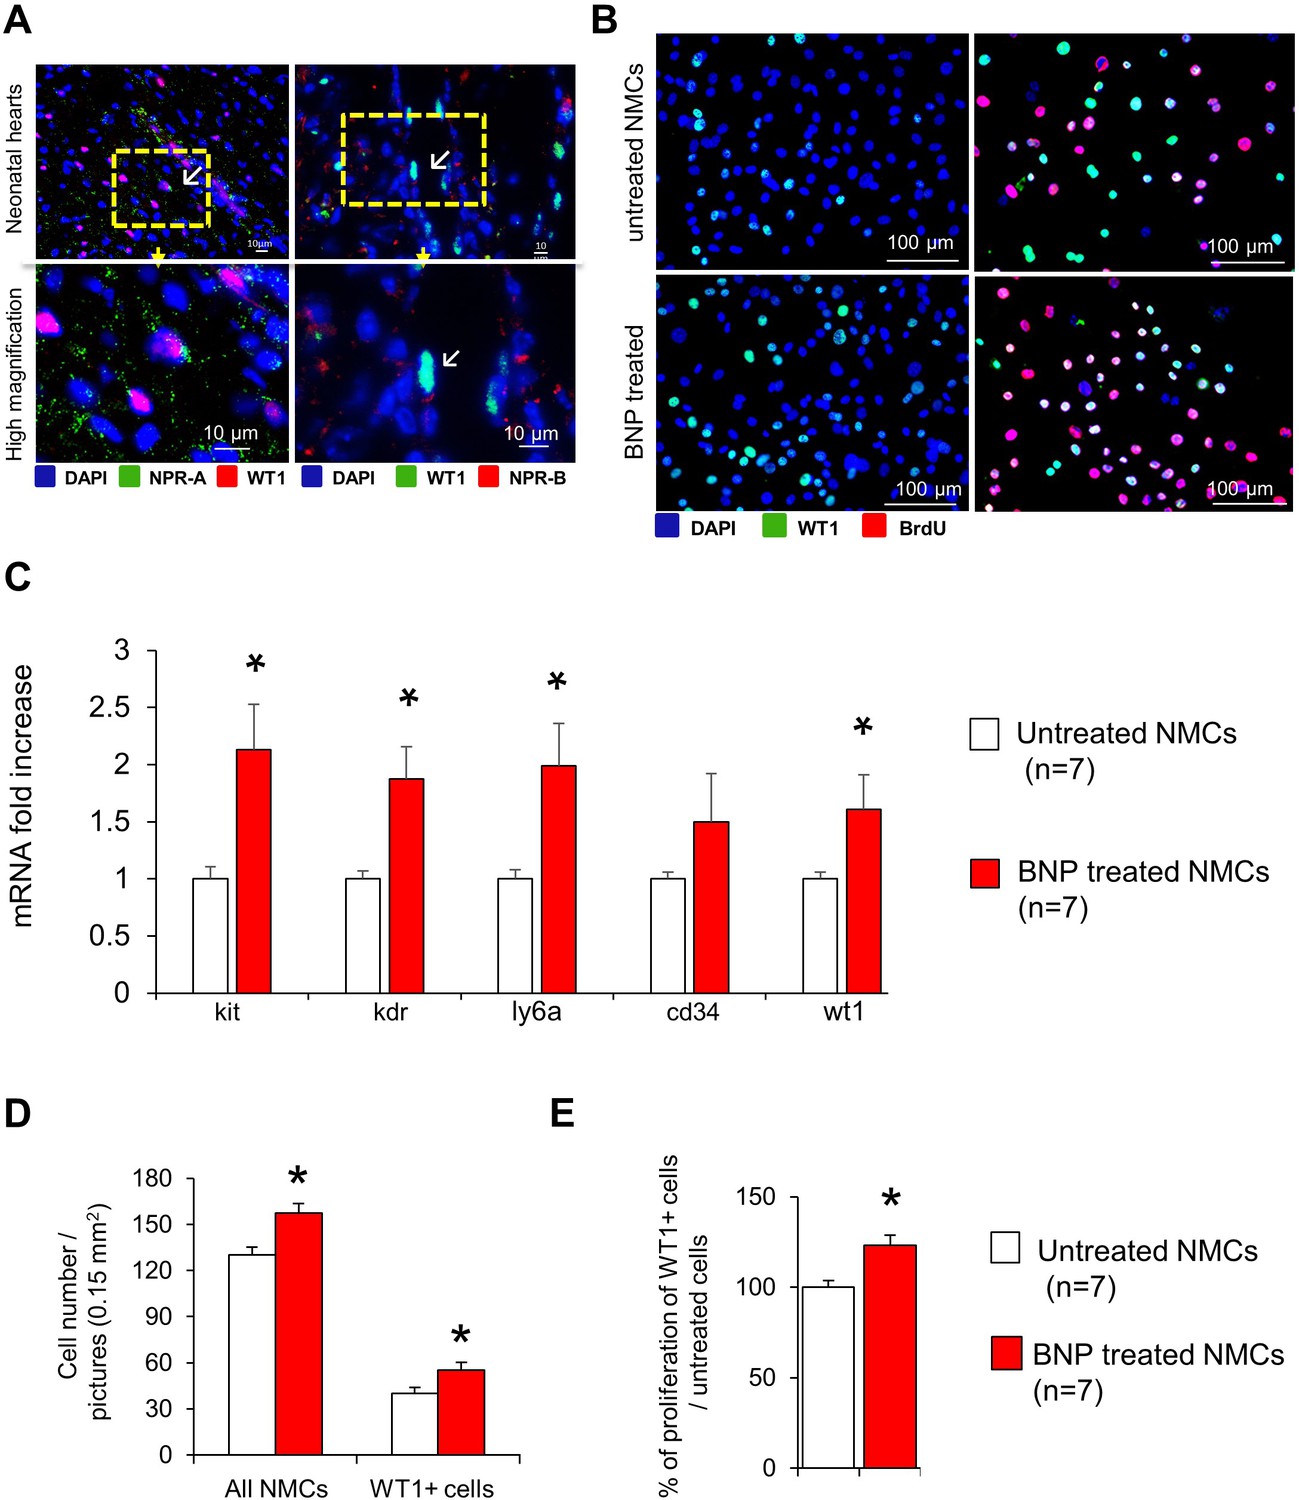
BNP treatment stimulated WT1+ cell proliferation in vitro.
(A) WT1+ cells isolated from neonatal hearts express NPR-A and NPR-B. ( B). Representative immunostainings of NMC cultures treated or not with BNP (5 mg/ml) and stained with DAPI (Nuclei in blue), antibodies against WT1 (green) and BrdU (red). (C) Quantitative relative expression of mRNAs coding for endothelial precursor specific genes (Flk-1, c-kit, stem cell antigen 1 (Sca-1), CD34 and Wilms’ tumour 1 (WT1)) in NMCs isolated from neonatal hearts and treated or not with BNP (5 mg/ml) for 10 days. Results expressed as fold-increase above the levels in untreated cells. (D) Quantification of the number of WT1+ cells per pictures (0.15 mm2) after 7–10 days of culture. At least 10 different pictures were evaluated per cell culture. (E) The percentages of WT1+ cell proliferation were obtained by dividing the number of WT1+ BrdU+ cells per the total WT1+ cell number. Results expressed as fold-increase above the levels in untreated cells All the results are means ± SEM, *p<0.05 using paired Student T test.
Figure 8 with 1 supplement
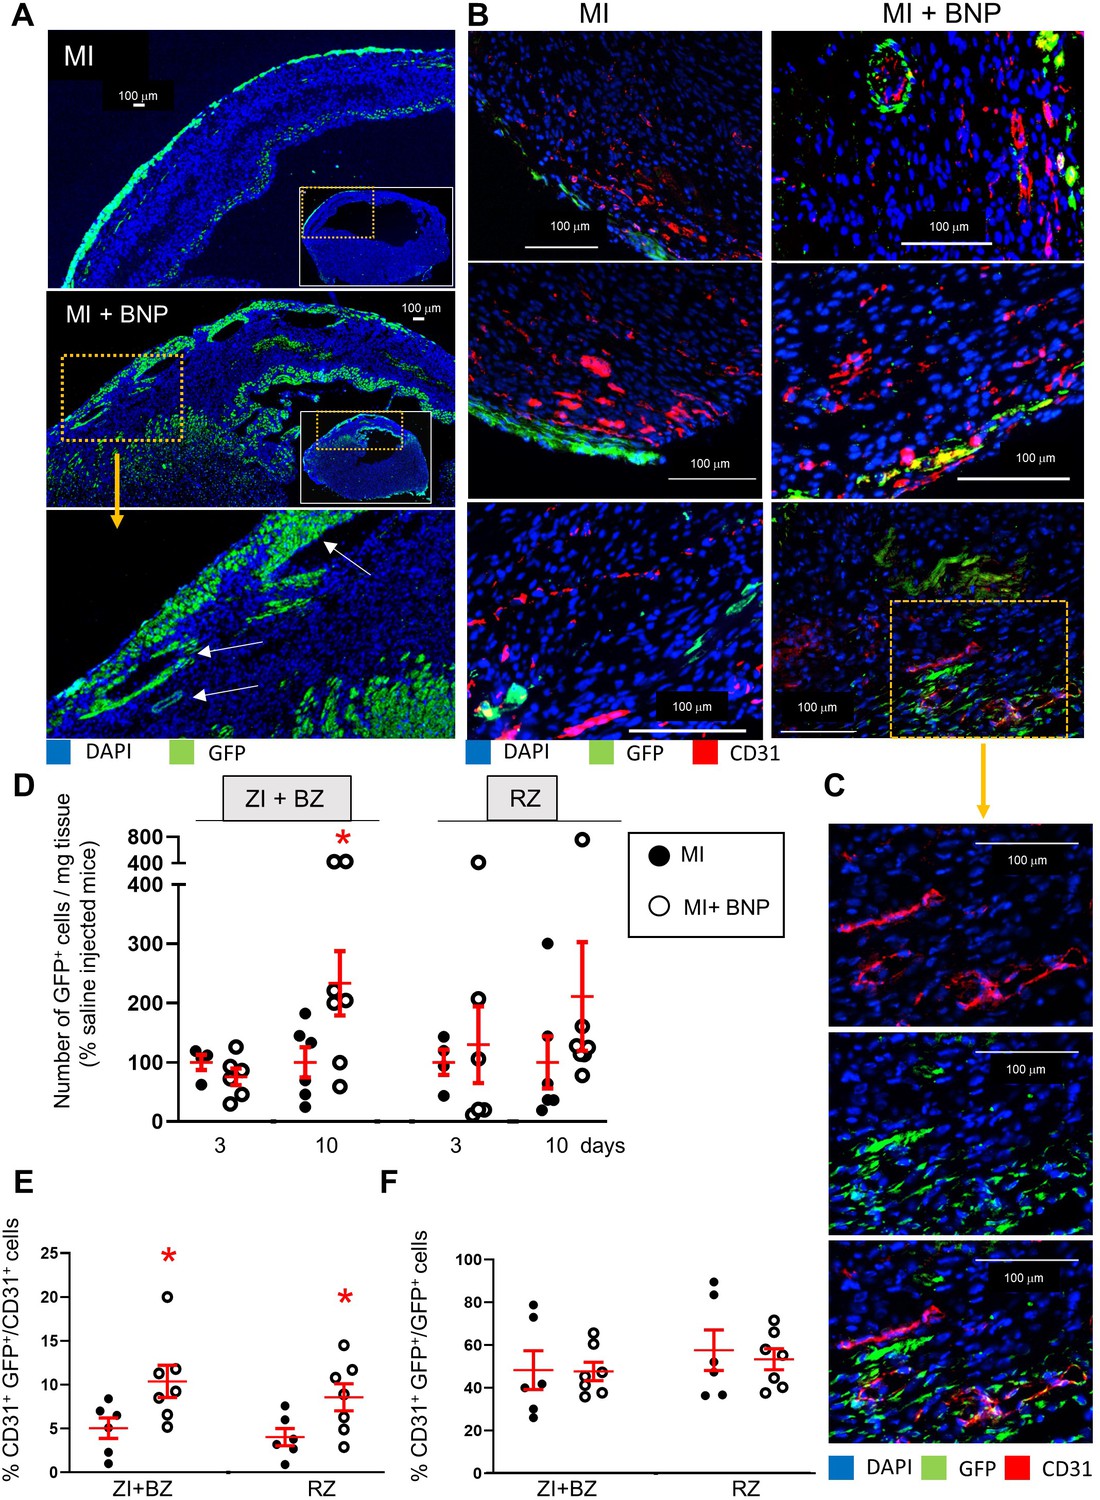
Increased WT1+ cell proliferation after BNP treatment in infarcted hearts.
(A) Representative immunostainings of ZI+BZ of WT1:ROSA hearts treated or not with BNP 10 days after surgery and stained with DAPI (nuclei in blue) and antibody against GFP protein (green). Hearts represented in full in the small inserts. The orange rectangles delimited the enlarged area below. (B) Representative immunostainings of WT1:ROSA hearts treated or not with BNP 10 days after MI and stained with DAPI (nuclei in blue) and antibodies against CD31 protein (red) and GFP (green). White arrows represented GFP+ CD31+ cells, that is endothelial cells originating from WT1+ cells. (C) High magnification of a part of the ZI+BZ of infarcted BNP-treated hearts where WT1+ cells contributed to the vessel formation (orange rectangle). (D) GFP+ cell number per mg of cardiac tissue 3 or 10 days after surgery, determined by flow cytometry analysis. Results in BNP-treated hearts related to those obtained in saline-treated hearts. E and F. Flow cytometry analysis on isolated NMCs stained with antibodies against CD31 and GFP. (E) Percentages of CD31+ cells originating from WT1+ precursor cells (GFP+CD31+ cells). The percentages of GFP+ cells determined among the selected CD31+ cells. (F) Percentages of differentiating WT1+ cells into CD31+ cells. The percentages of CD31+ cells determined among the selected GFP+ cells. (D:) 3 days after surgery: MI: n = 4, MI+BNP: n = 6. (D–F:) 10 days after surgery: MI: n = 6, MI+BNP: n = 7 different mice. Individual values are represented and the means ± SEM are represented in red. *p≤0.05 only for groups with n ≥ 6. No difference of variance between groups.
Figure 8—figure supplement 1
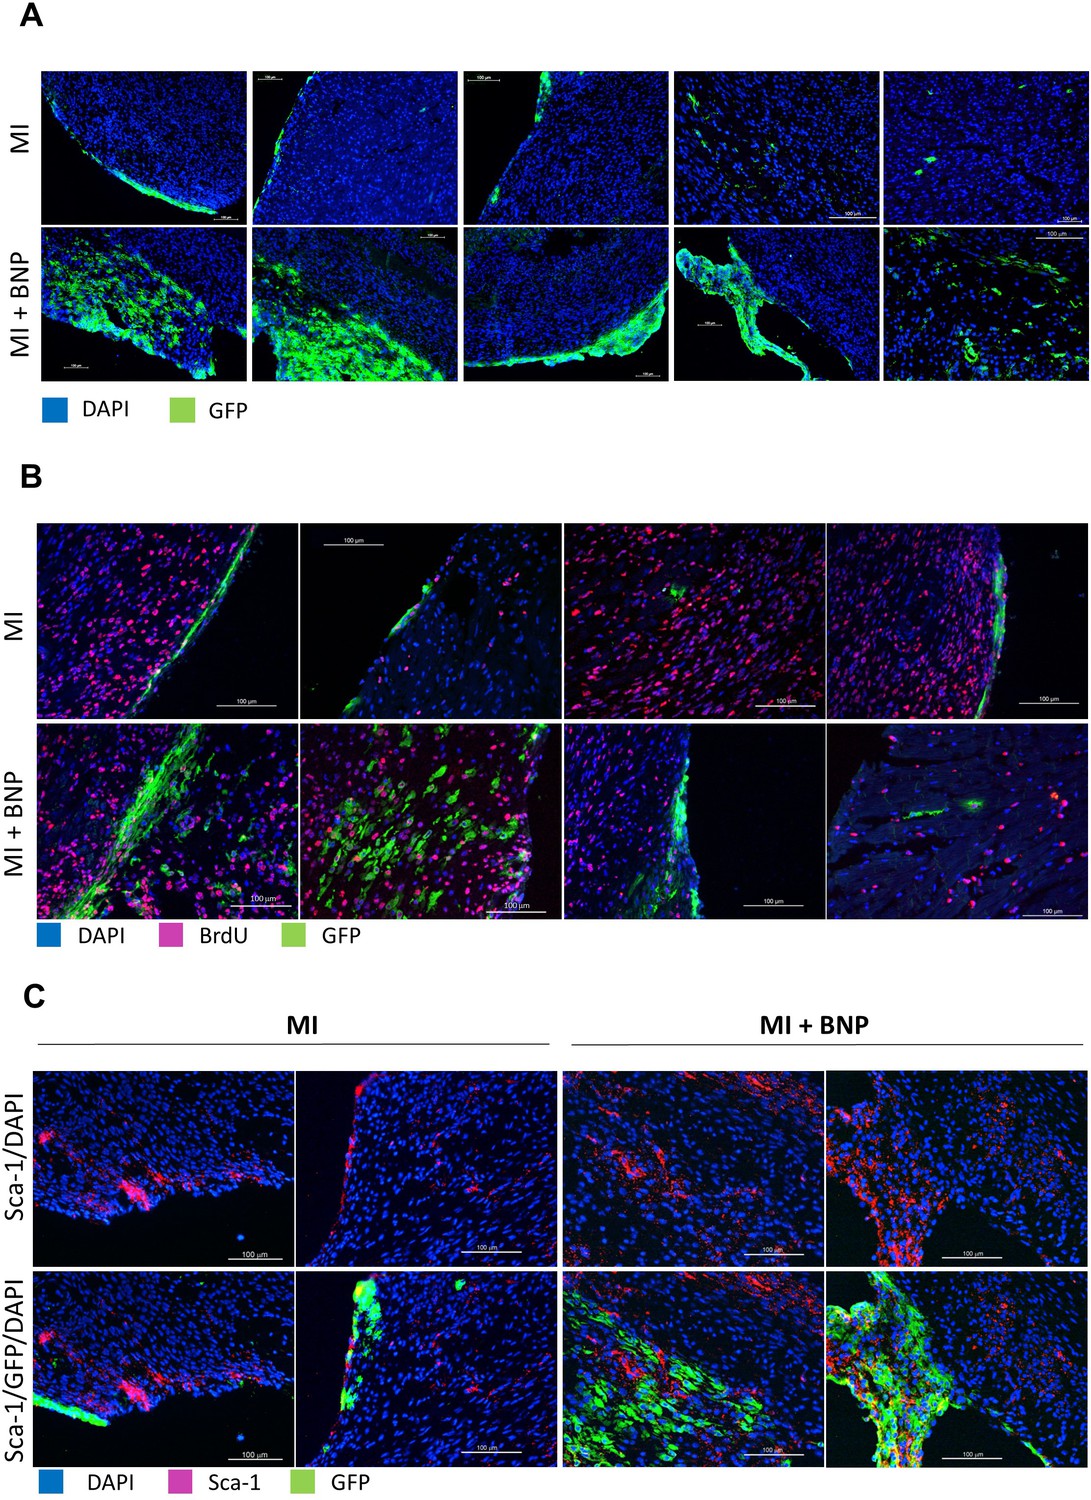
Representative pictures of infarcted WT1:ROSA mice treated or not with BNP, 10 days after surgery.
(A) Cells expressing the GFP protein were mainly localized in the epicardium in MI hearts and migrate to the endocardium in BNP-treated infarcted hearts. (B) Some GFP+ cells proliferated and/or expressed the Sca-1 protein (C).
Figure 9
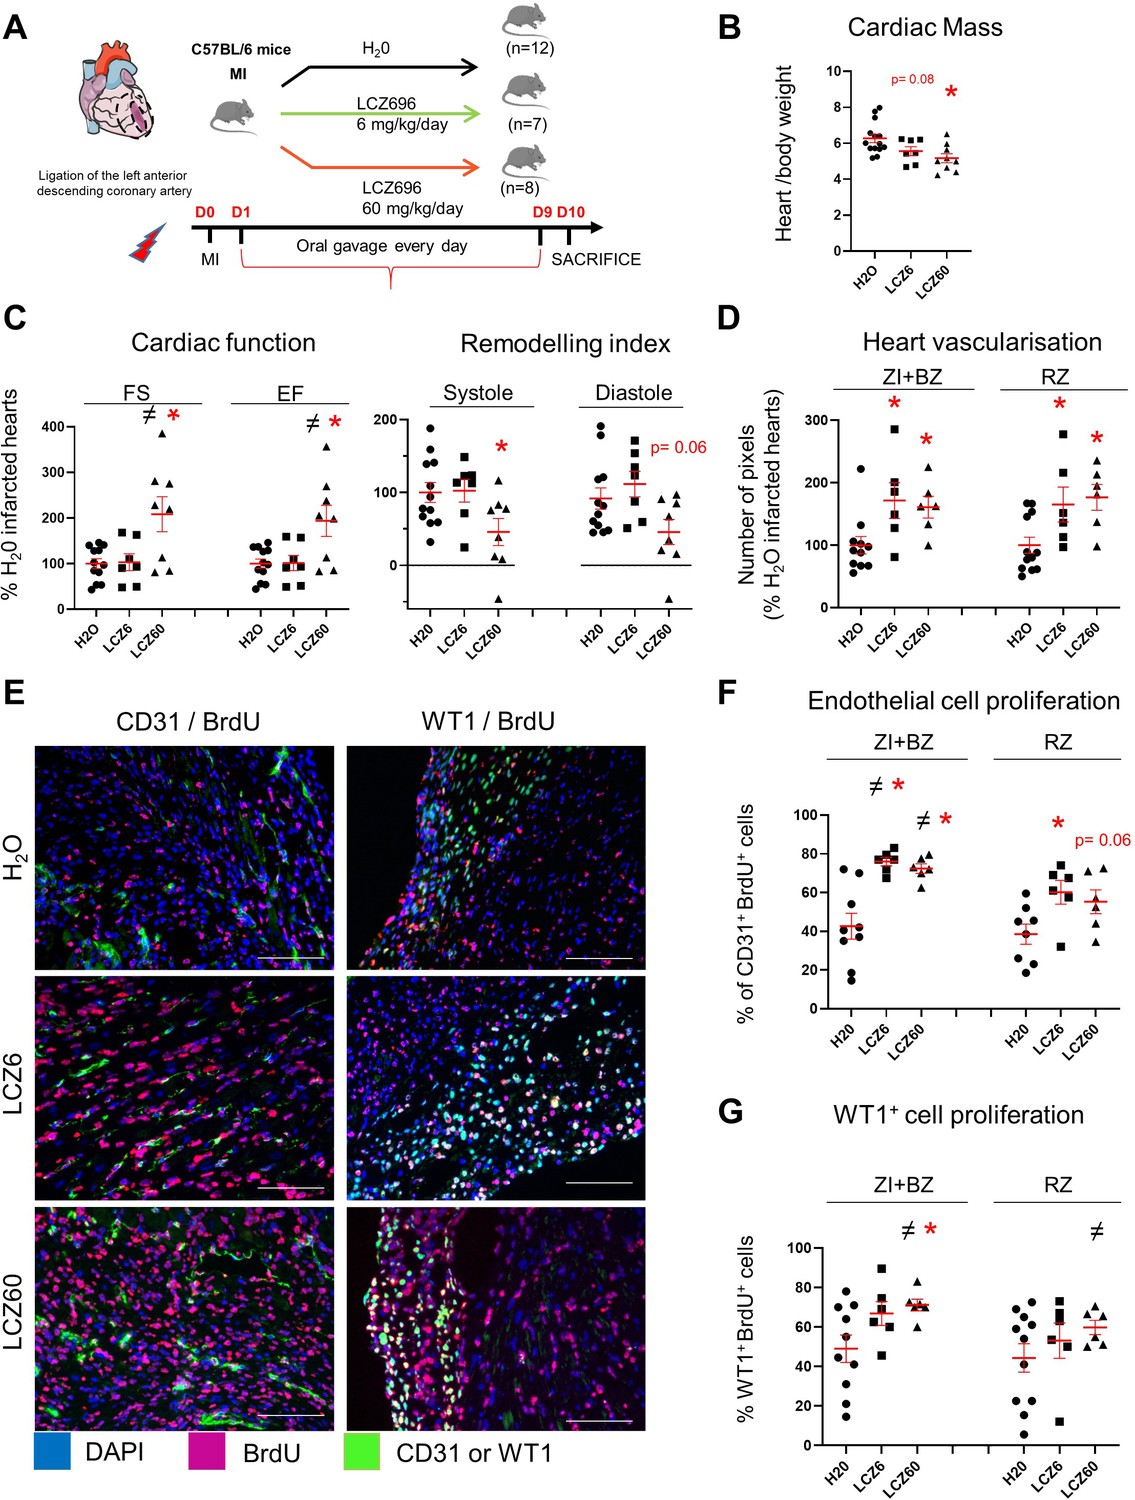
Increased vascularisation in infarcted hearts after LCZ696 treatment.
(A) Experimental protocol as described in details in Material and methods section. (B) Cardiac mass (heart weight (mg)/body weight (g)) of infarcted mice 10 days after MI. (C) Cardiac function and remodelling index measured by echocardiography 8–9 days after MI (i.e. 1 day before sacrifice). FS: fractional shortening; EF: ejection fraction. Two sets of experiment were performed. All results of the treated mice were related to their respective control (i.e. H2O-treated infarcted hearts). (D) CD31 staining intensity measured on at least 10 different pictures per heart and per area 10 days after MI. Number of pixels in hearts of LCZ696 treated mice related to the numbers of untreated mice (H20). (E) Representative pictures of the ZI+BZ area of infarcted hearts 10 days after surgery, treated with LCZ696 (6 or 60 mg/kg/day) or H20 and stained with DAPI (nuclei in blue) and antibodies against CD31 or WT1 protein (green) and BrdU (pink). Scale bars represent 100 μm. (F–G) Percentage of proliferating endothelial (F) or WT1+ (G) cells/per pictures in each area of the infarcted hearts (number of CD31+BrdU+ cells/total number of CD31+ cells (F) or WT1+BrdU+ cells/total number of WT1+ cells (G)). At least 10 different pictures evaluated per mouse and per area. B, C, D, F, G: Individual values are represented and the means ± SEM are represented in red. # p<0.05 for different variance between groups, *p≤0.05 using unpaired T tests with or without Welch’s corrections.
Figure 10
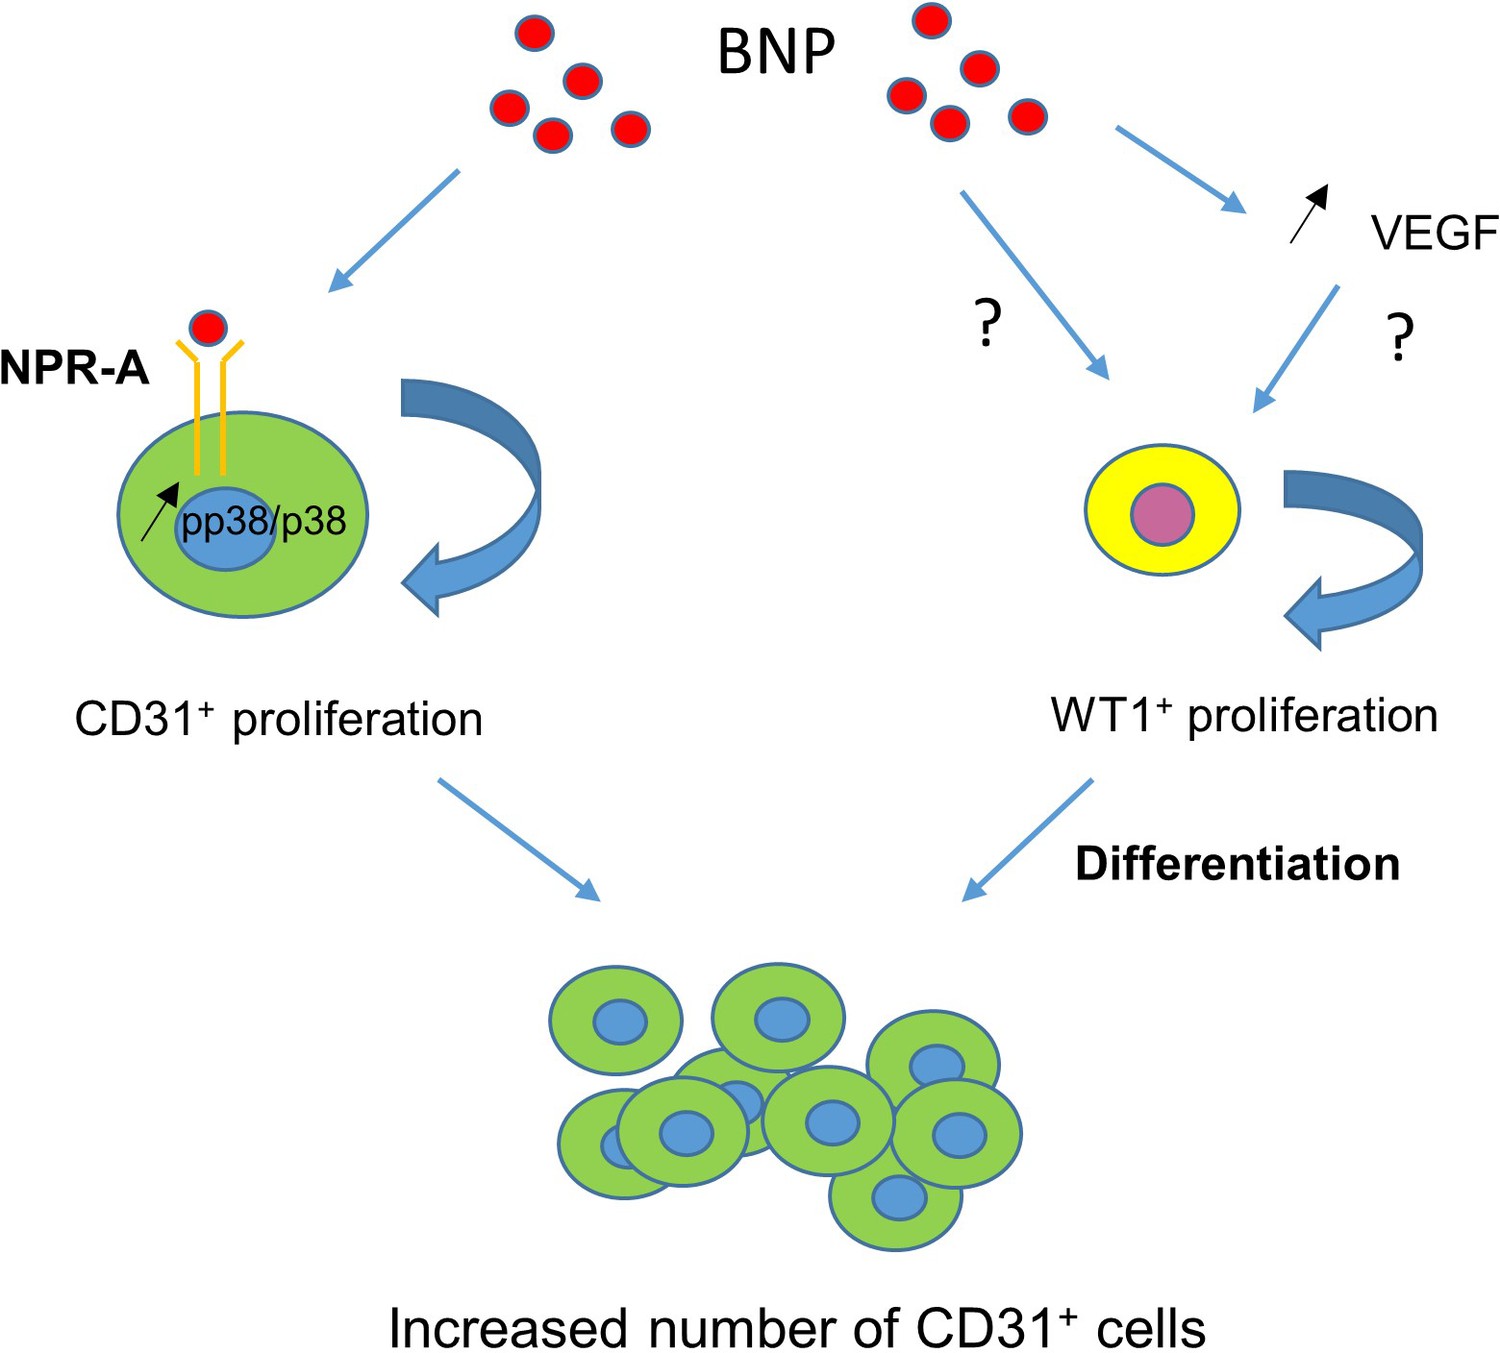
BNP-mediated mechanisms leading to increased number of endothelial cells in infarcted hearts.
BNP binds directly on NPR-A receptor expressed on endothelial cells and activates p38 MAP kinase to induce their proliferation (left). BNP treatment activates also WT1+ EPDC proliferation in the ZI+BZ, either directly or via VEGF increase (right).
Author response image 1
Additional files
-
Supplementary file 1
Antibodies used in flow cytometry analysis, immunohistology and Western blot analysis.
- https://cdn.elifesciences.org/articles/61050/elife-61050-supp1-v1.docx
-
Supplementary file 2
Primer Sequences used in quantitative RT-PCR.
- https://cdn.elifesciences.org/articles/61050/elife-61050-supp2-v1.docx
-
Transparent reporting form
- https://cdn.elifesciences.org/articles/61050/elife-61050-transrepform-v1.docx
Download links
A two-part list of links to download the article, or parts of the article, in various formats.
Downloads (link to download the article as PDF)
Open citations (links to open the citations from this article in various online reference manager services)
Cite this article (links to download the citations from this article in formats compatible with various reference manager tools)
Increasing heart vascularisation after myocardial infarction using brain natriuretic peptide stimulation of endothelial and WT1+ epicardial cells
eLife 9:e61050.
https://doi.org/10.7554/eLife.61050


