Calponin-homology domain mediated bending of membrane-associated actin filaments
- Centre for Mechanochemical Cell Biology and Warwick Medical School, Division of Biomedical Sciences, United Kingdom
- Department of Biochemistry, Division of Biological Sciences, Indian Institute of Science, India
Figures
Figure 1 with 2 supplements
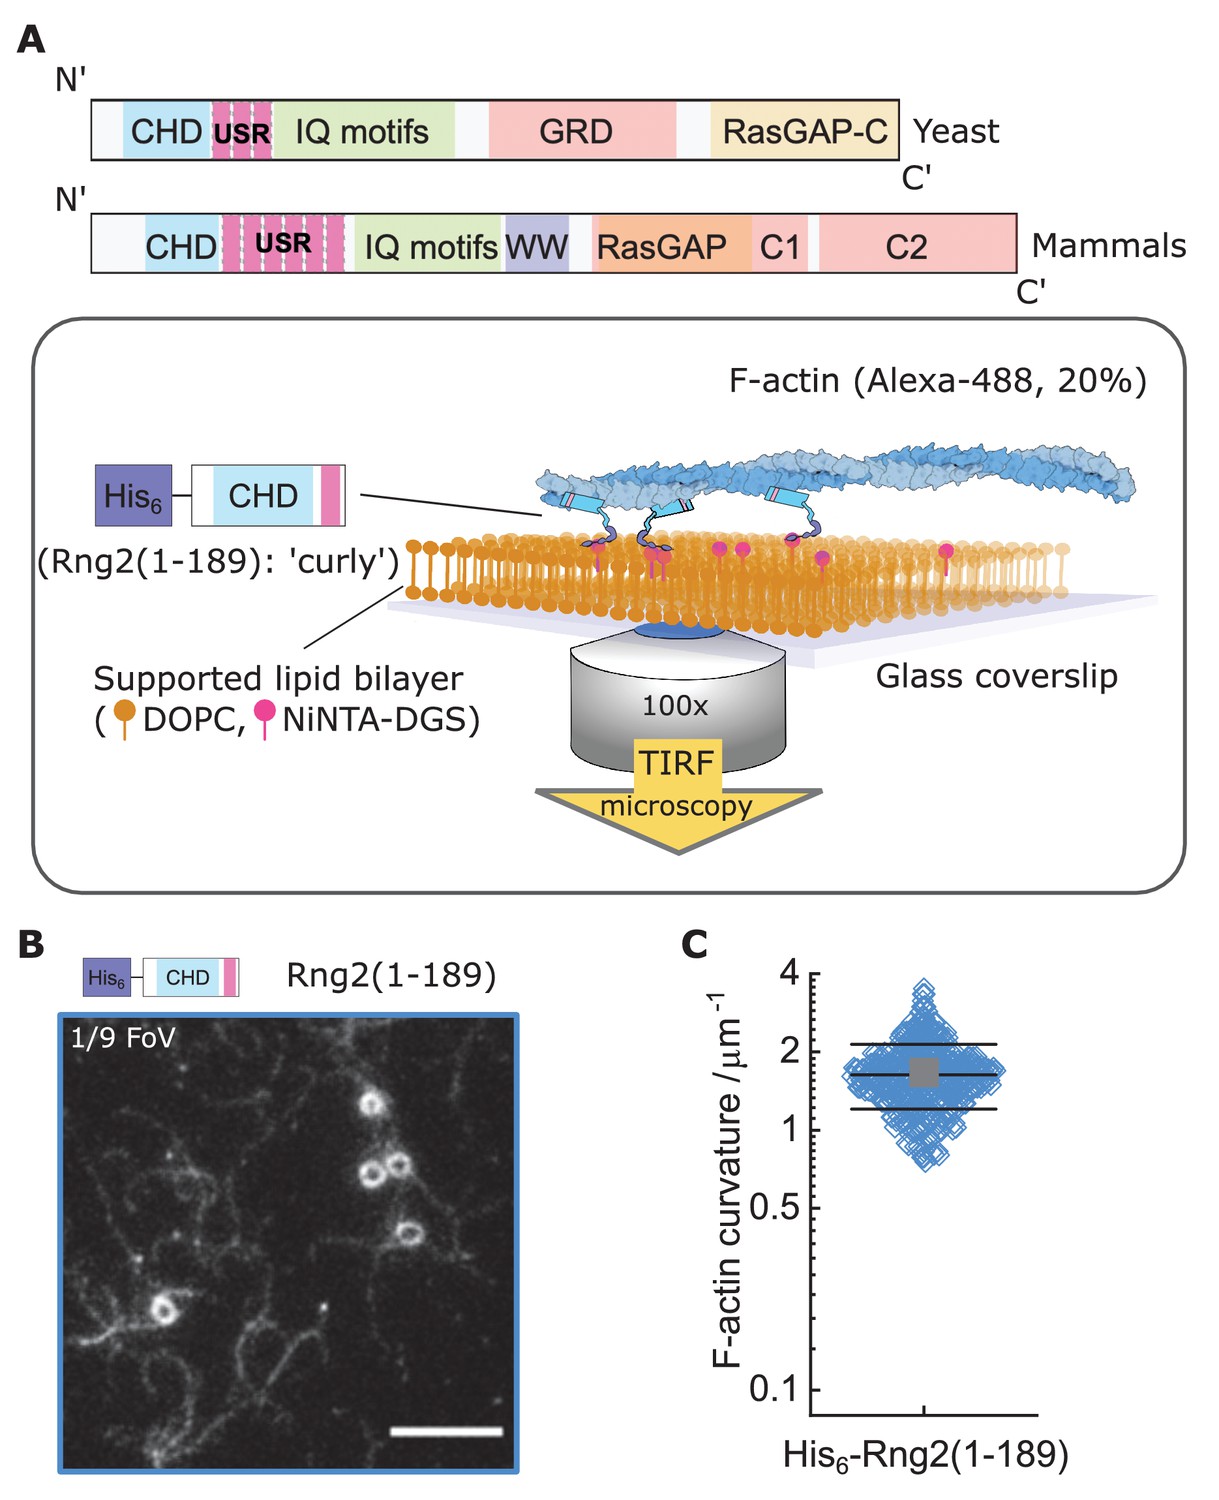
Formation of actin filament rings by membrane tethered curly (His6-Rng2(1-189)).
(A) Schematic representation of (top) the IQGAP proteins Rng2 (yeast, S. pombe) and IQGAP1 (mammals, H. Sapiens) and (bottom) the experimental setup used in this study; CHD - Calponin Homology Domain, USR – Unstructured Region, GRD - GAP Related Domain, RasGAP – Ras GTPase Activating Protein, WW – tryptophan containing protein domain. (B) TIRF microscopy image of actin filaments (Alexa488, Cactin = 100 nM) bound to SLB tethered His6-curly (Ccurly = 10 nM); shown is 1/9 field of view (FoV), scale bar 5 µm. (C) Curvature measurements of actin filament rings and curved segments; shown are the individual data points and their mean ± s.d.; N = 425 obtained from five field of views from each of four independent experiments.
Figure 1—figure supplement 1
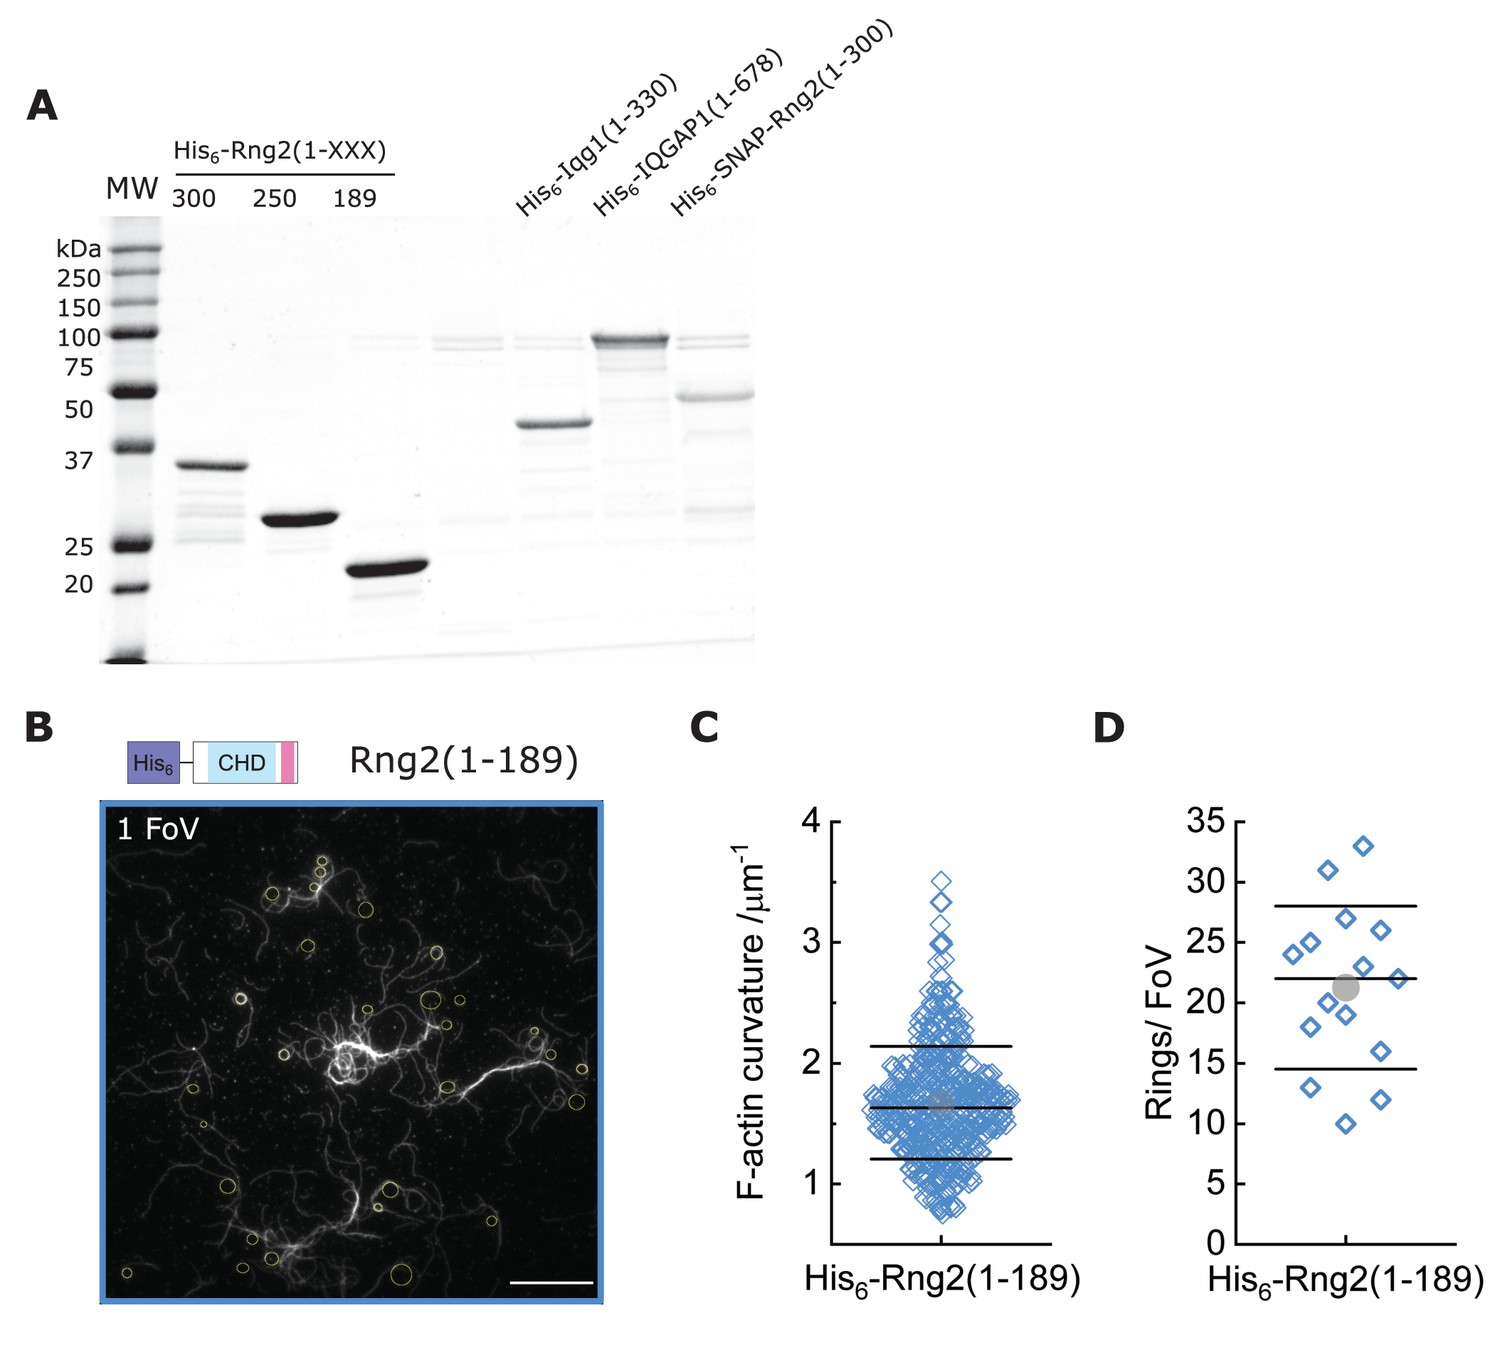
Protein purification and measurements of actin rings induced by curly.
(A) Coomassie stained SDS-PAGE of the different constructs used in this study; MW indicates molecular weight markers. (B) TIRF microscopy image (1 FoV = Field of View) of actin filaments (Alexa488) bound to SLB tethered His6- curly; yellow circles/ellipses show curvature measurements; scale bar 10 µm. (C) Box plot of actin filament curvatures induced by SLB tethered His6- curly (same as in Figure 1C but with linear scale). (D) Box plot depicting the number of full actin rings per field of view (FoV) induced by SLB tethered His6-Rng2(1-189); N = 15 FoVs from three independent samples.
Figure 1—figure supplement 2
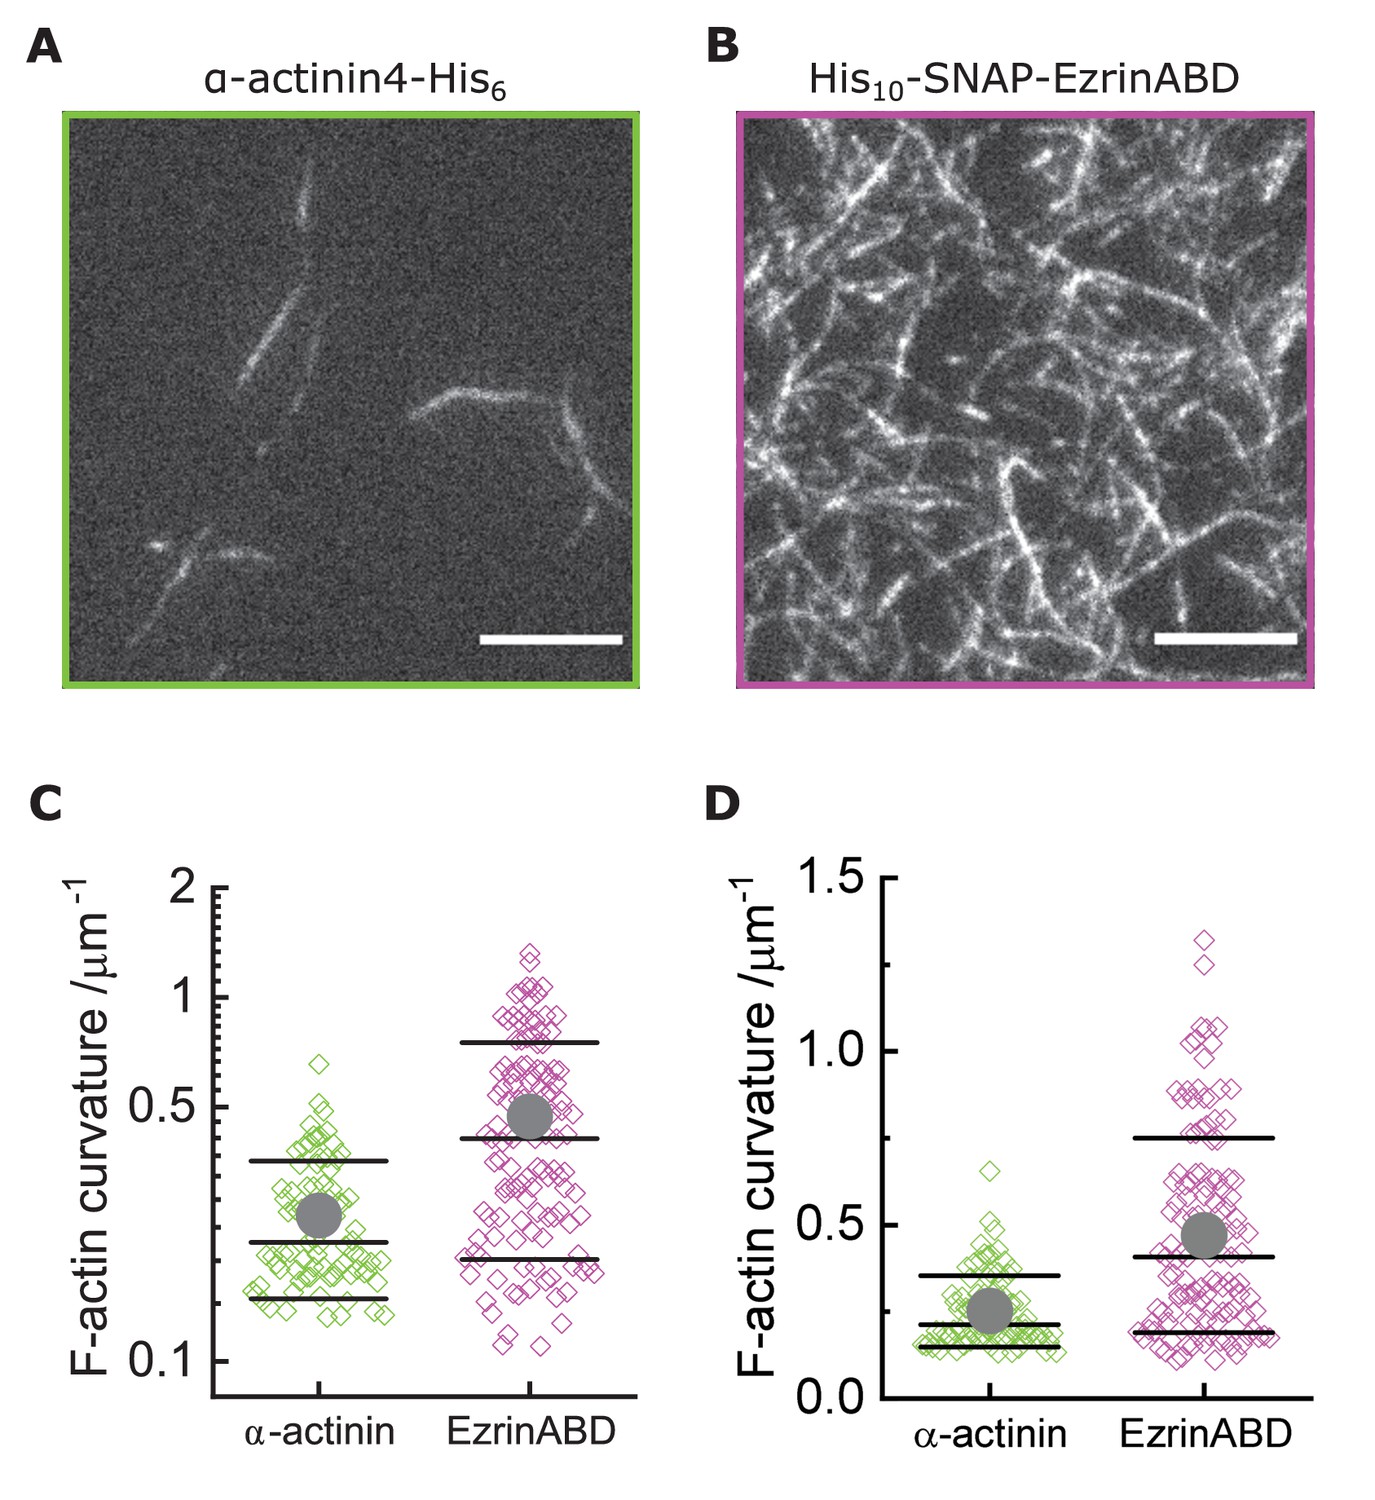
Other actin binding proteins do not bend actin filaments.
(A) TIRF microscopy image of actin filaments (Alexa488, Cactin = 100 nM) bound to SLB tethered α-actinin-His6 (Cα-act = 10 nM); scale bar 5 µm. (B) TIRF microscopy image of actin filaments (Alexa488, Cactin = 100 nM) bound to SLB tethered His10-EzrinABD (CEzrABD = 10 nM); scale bar 5 µm. (C) Curvature measurements of actin filament rings and curved segments; α-actinin-His6: N = 85 obtained from 10 field of views from four individual experiments; His10-EzrinABD: N = 127 obtained from nine field of views from three individual experiments. (D) Same data as (C) but in linear scale.
Figure 2 with 1 supplement

Actin bending is independent of curly orientation but requires lipid membrane tethering.
TIRF microscopy images of actin filaments (Alexa488, Cactin = 100 nM) bound to. (A) Glass adsorbed His6-curly (Ccurly = 10 nM); N = 138 from nine field of views from each of three independent experiments. (B) SLB bound Rng2(1-189)-His6(CCurly-His = 10 nM); N = 658 from 13 field of views from each of four experiments; images show 1/9 field of view (FoV); scale bars: 5 µm. (C) Number of full actin rings per field of view induced by SLB tethered Rng2(1-189)-His6; N = 16 FoVs from three independent samples. (D) Comparison of curvature measurements of actin filament rings and curved segments; diamonds represent individual measurements, lines the median ± standard deviation and the circle the mean value.
Figure 2—figure supplement 1,
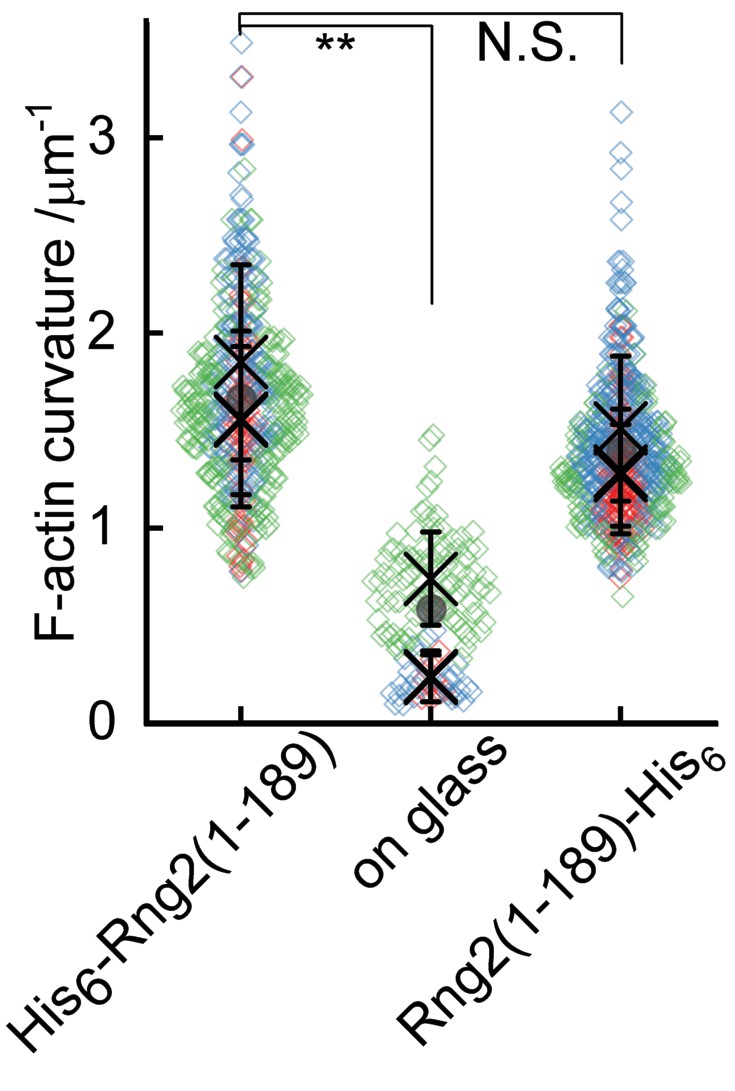
Statistical analysis of data in Figure 2.
(A) Statistical comparison of average actin filament curvatures induced by Rng2 constructs as shown in Figure 2D; plotted are the mean value ± standard deviation of independent experiments, comparison of mean values with Anova one-way test; **: p < 0.005, N.S.: non-significant difference between the mean values.
Figure 3 with 5 supplements
Curly recognizes actin filament orientation and enables actin ring contraction by myosin II.
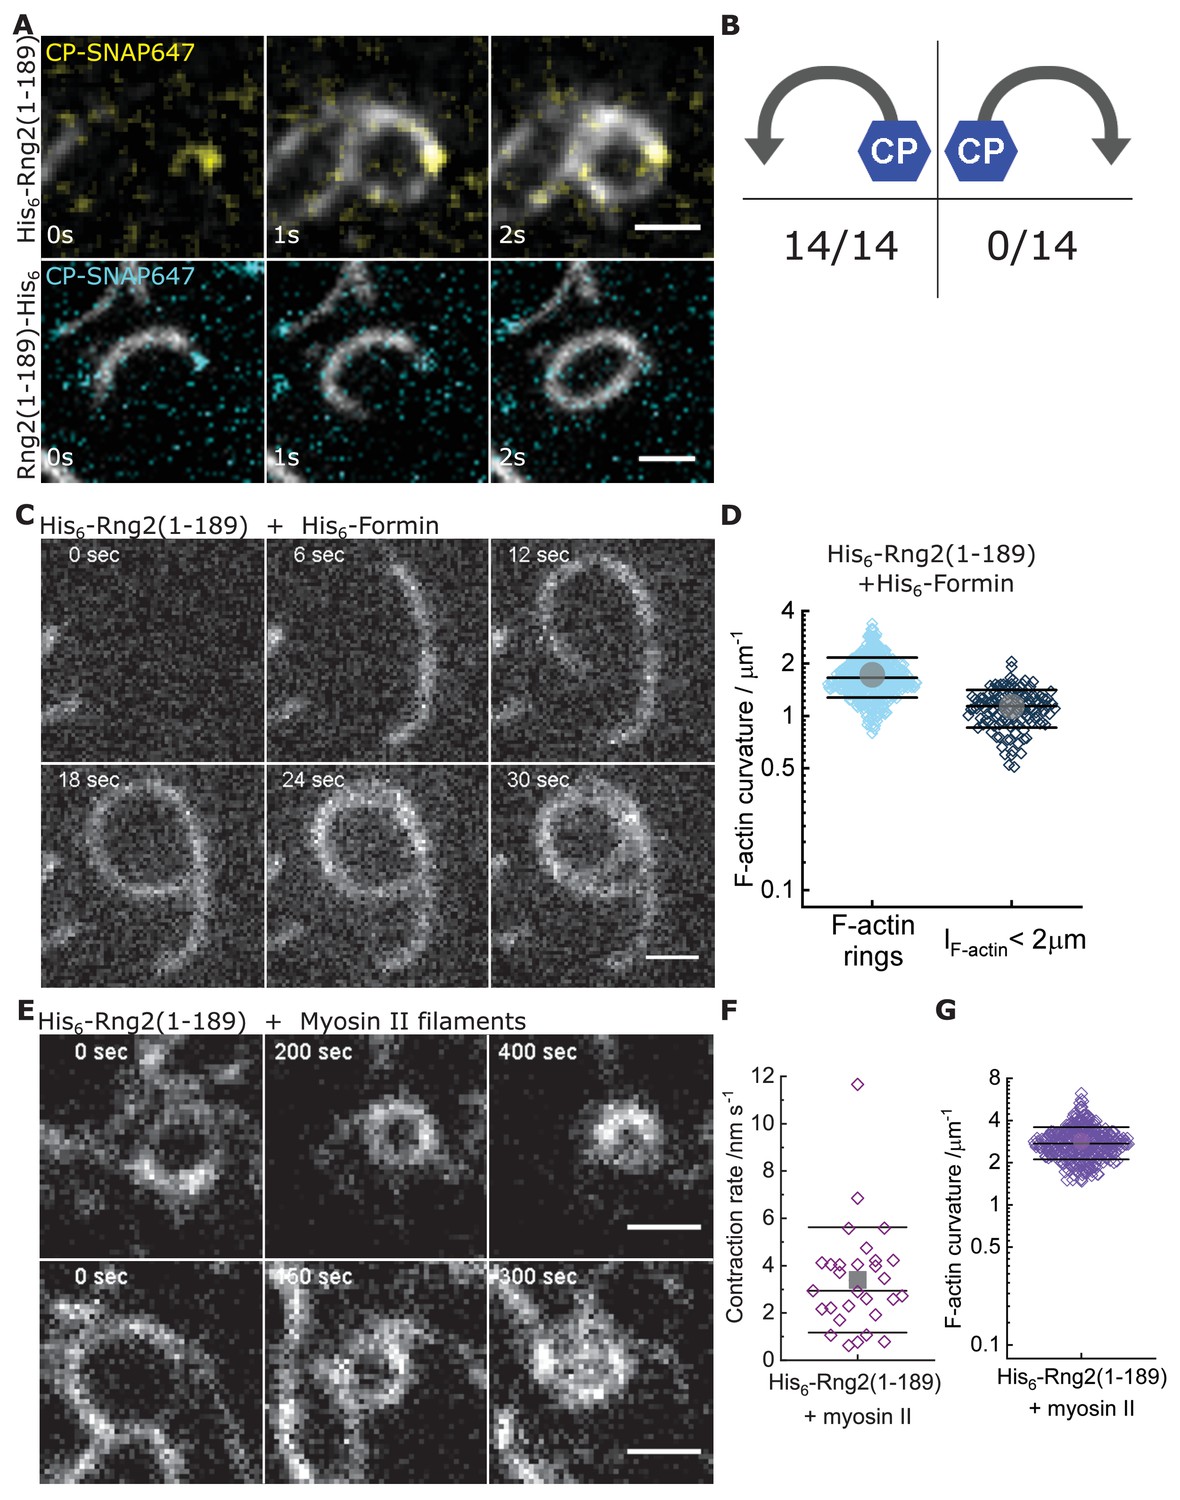
(A) TIRF microscopy images of actin filaments (Alexa488) (Cactin = 100 nM) with the plus end marked with SNAP647-tagged capping protein (CCP = 2 nM) binding to His6-curly (top) and curly-His6 (bottom) (Ccurly = 10 nM); scale bar: 1 µm. (B) Count of actin filament bending orientations with respect to the capping protein where individual actin filaments could be identified. (C) TIRF microscopy images of a polymerizing actin filament (Alexa488) driven by membrane tethered His6-formin in the presence of His6-curly; scale bar: 1 µm. (D) Curvature measurements of actin filament rings (light blue) and curved short actin filaments (< 2 µm; gray-blue); shown are the individual data points and their mean ± s.d.; Nrings = 477, Nshort = 125 from nine field of views of three independent experiments. (E) TIRF microscopy images of actin filament (Alexa488) ring contraction after addition of rabbit muscle myosin II filaments on His6-curly containing SLBs; scale bar: 1 µm. (F) Average contraction rates of actin filament rings after addition of rabbit muscle myosin II filaments; shown are the individual data points and their mean ± s.d.; N = 18 from two individual experiments. (G) Curvature measurements of actin filament rings and curved segments 20 min after addition of rabbit muscle myosin II filaments; shown are the individual data points and their mean ± s.d.; N = 342 from 10 field of views of two individual experiments.
Figure 3—figure supplement 1
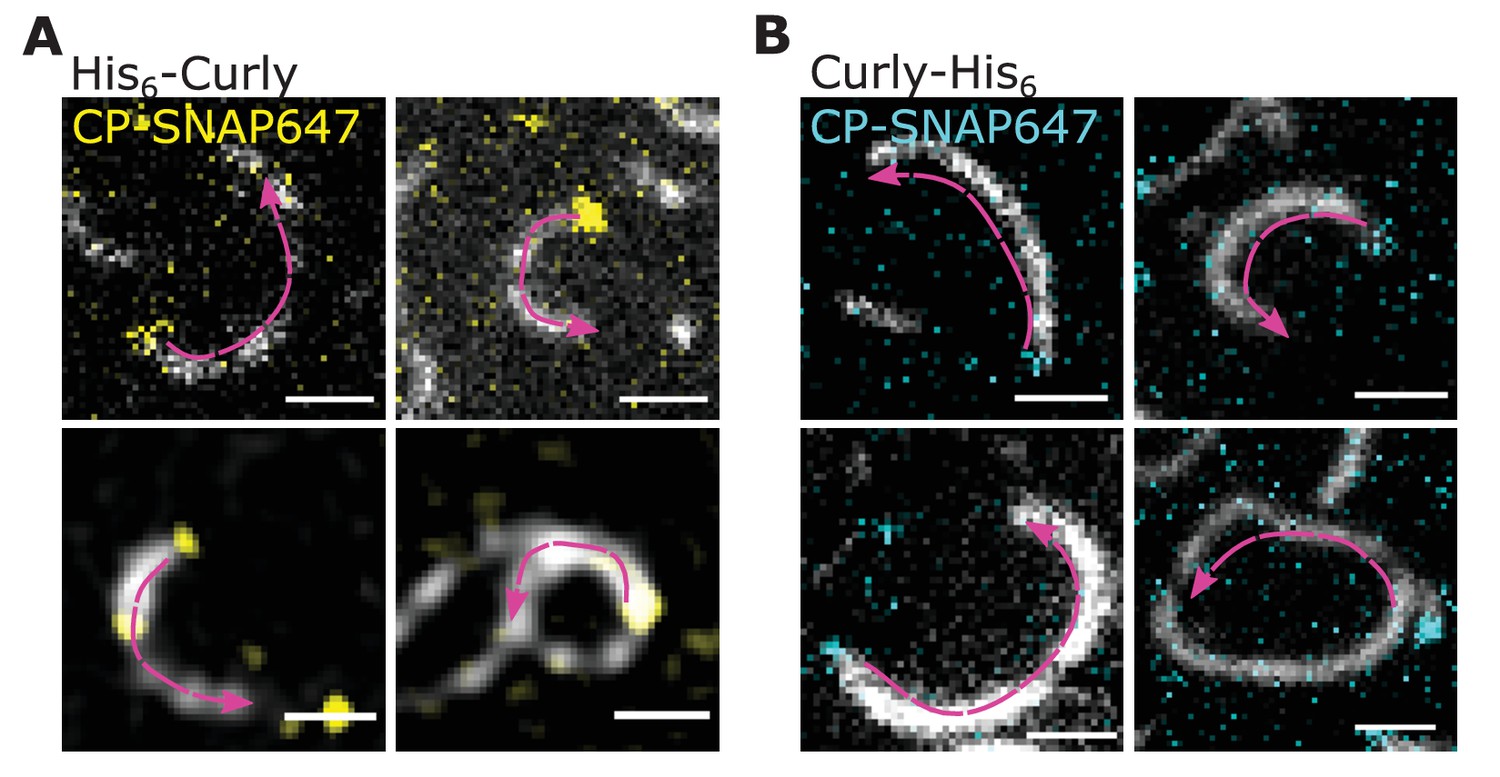
Curly recognizes actin filament orientation as visualised by labelled capping protein.
(A) TIRF microscopy images of actin filaments (Alexa488) with the plus end marked with SNAP647-tagged capping protein binding to His6-Rng2(1-189); scale bar: 1 µm. (B) TIRF microscopy images of actin filaments (Alexa488) with the plus end marked with SNAP647-tagged capping protein binding to Rng2(1-189)-His6; scale bar: 1 µm. Arrows indicate the actin bending orientation.
Figure 3—figure supplement 2
Curly induces actin bending in membrane tethered formin-generated actin filaments.
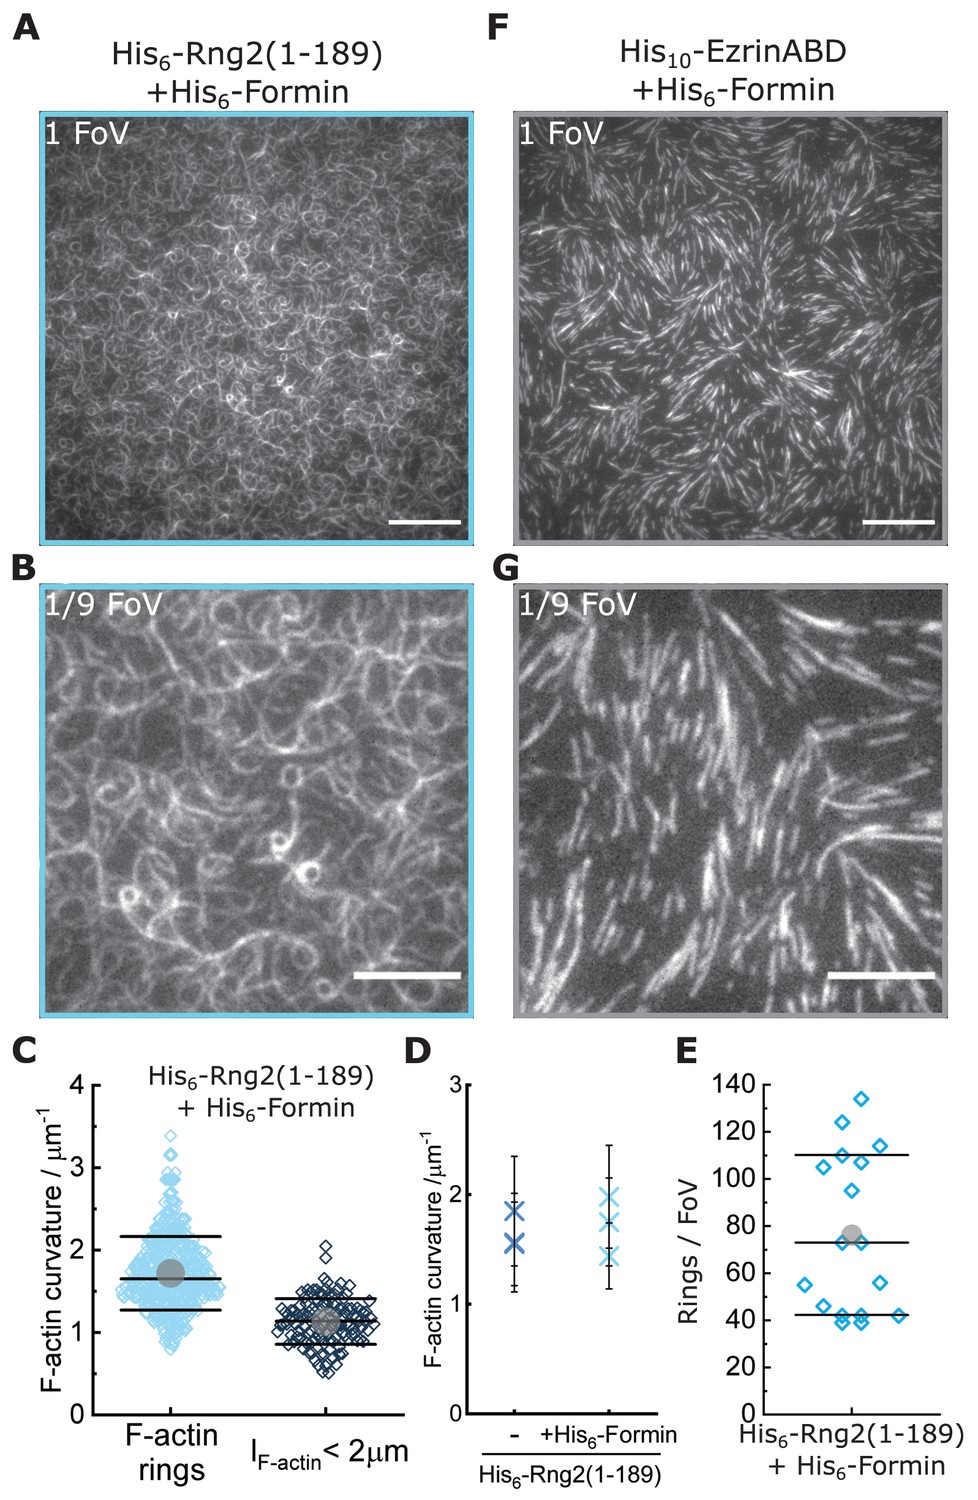
(A) TIRF microscopy image (full field of view) of actin filaments (Alexa488) polymerized by membrane tethered His6-formin in the presence of His6-Rng2(1-189); scale bar: 10 µm. (B) Zoom of (A) showing 1/9 of the field of view; scale bar: 5 µm. (C) Data from Figure 3D plotted in linear scale. (D) Comparison of mean actin ring curvatures of independent experiments with formin induced actin polymerization on curly containing membranes (data from Figure 3D) and with actin filaments landing on curly decorated membranes (data from Figure 1C) indicating that the curly induced ring curvature is independent of the type of actin polymerization. (E) Number of full actin rings per field of view when actin filaments are polymerized by membrane tethered His6-formin in the presence of His6-Rng2(1-189); N = 17 FoVs from three independent samples. (F) TIRF microscopy image (full field of view) of actin filaments (Alexa488) polymerized by membrane tethered His6-formin in the presence of His10-EzrinABD; scale bar: 10 µm. (G) Zoom of (F) showing 1/9 of the field of view; scale bar: 5 µm.
Figure 3—figure supplement 3
Tropomyosin supports actin bending by curly.
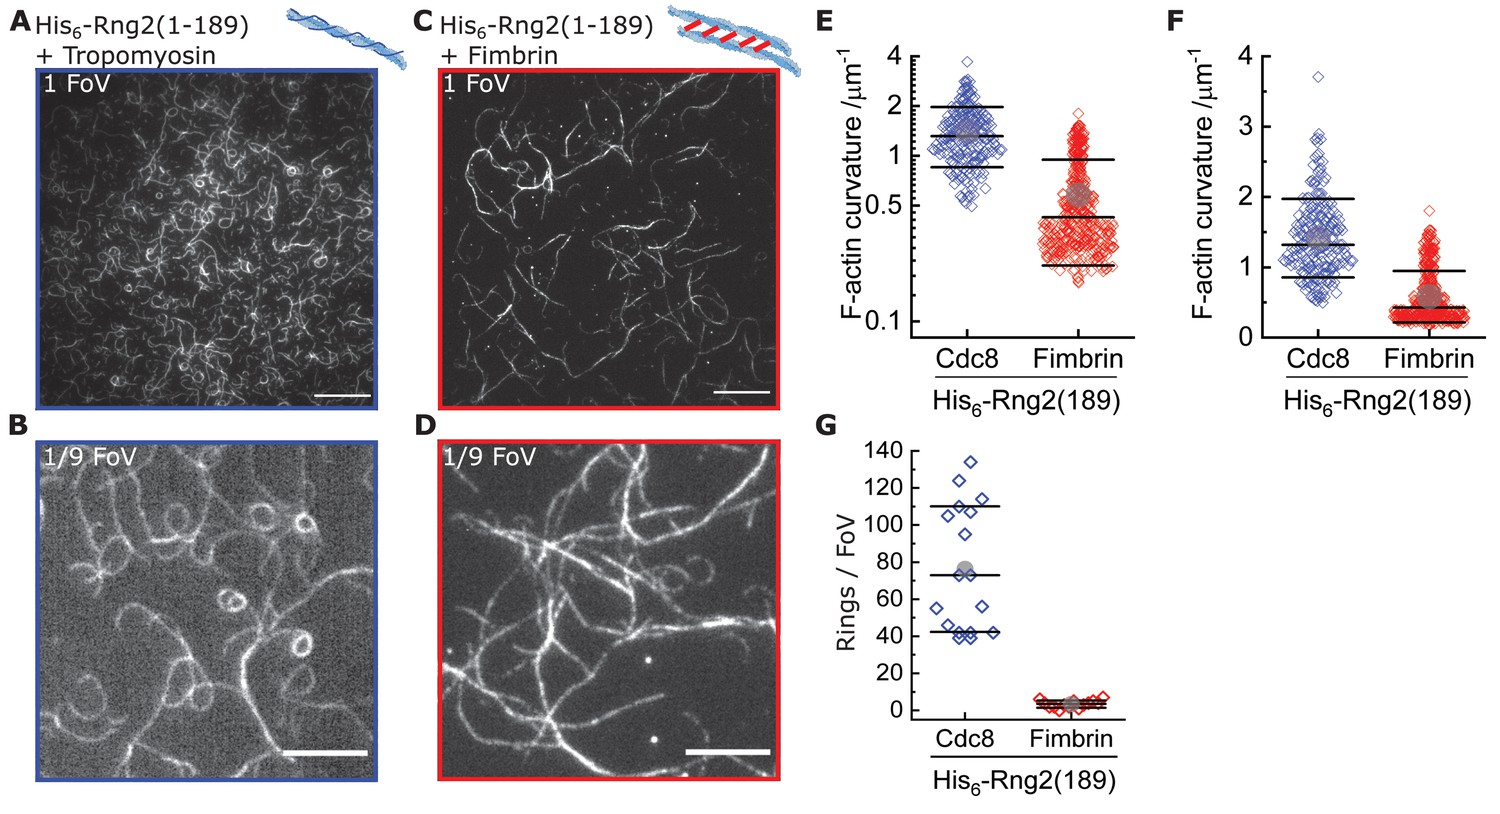
(A) TIRF microscopy image (one field of view) of actin filaments (Alexa488) pre-incubated with tropomyosin (Cdc8) bound to membrane tethered His6- Rng2(1-189); scale bar: 10 µm. (B) TIRF microscopy image (1/9 field of view) of actin filaments (Alexa488) pre-incubated with tropomyosin (Cdc8) bound to membrane tethered His6-Rng2(1-189); scale bar: 5 µm. (C) TIRF microscopy image (representing one field of view) of actin filaments (Alexa488) pre-incubated with fimbrin bound to membrane tethered His6- Rng2(1-189); scale bar: 10 µm. (D) TIRF microscopy image (representing 1/9 field of view) of actin filaments (Alexa488) pre-incubated with fimbrin bound to membrane tethered His6-Rng2(1-189); scale bar: 5 µm. (E) Curvature measurements of actin filament rings and curved segments; Cdc8 (blue): N = 204 from nine field of views of three individual experiments; fimbrin (red): N = 407 from 20 field of views of three independent experiments. (F) Data from (E) plotted in linear scale. (G) Number of full actin rings per field of view, N(Cdc8) = 16, N(fimbrin) = 14 from three independent experiments.
Figure 3—figure supplement 4
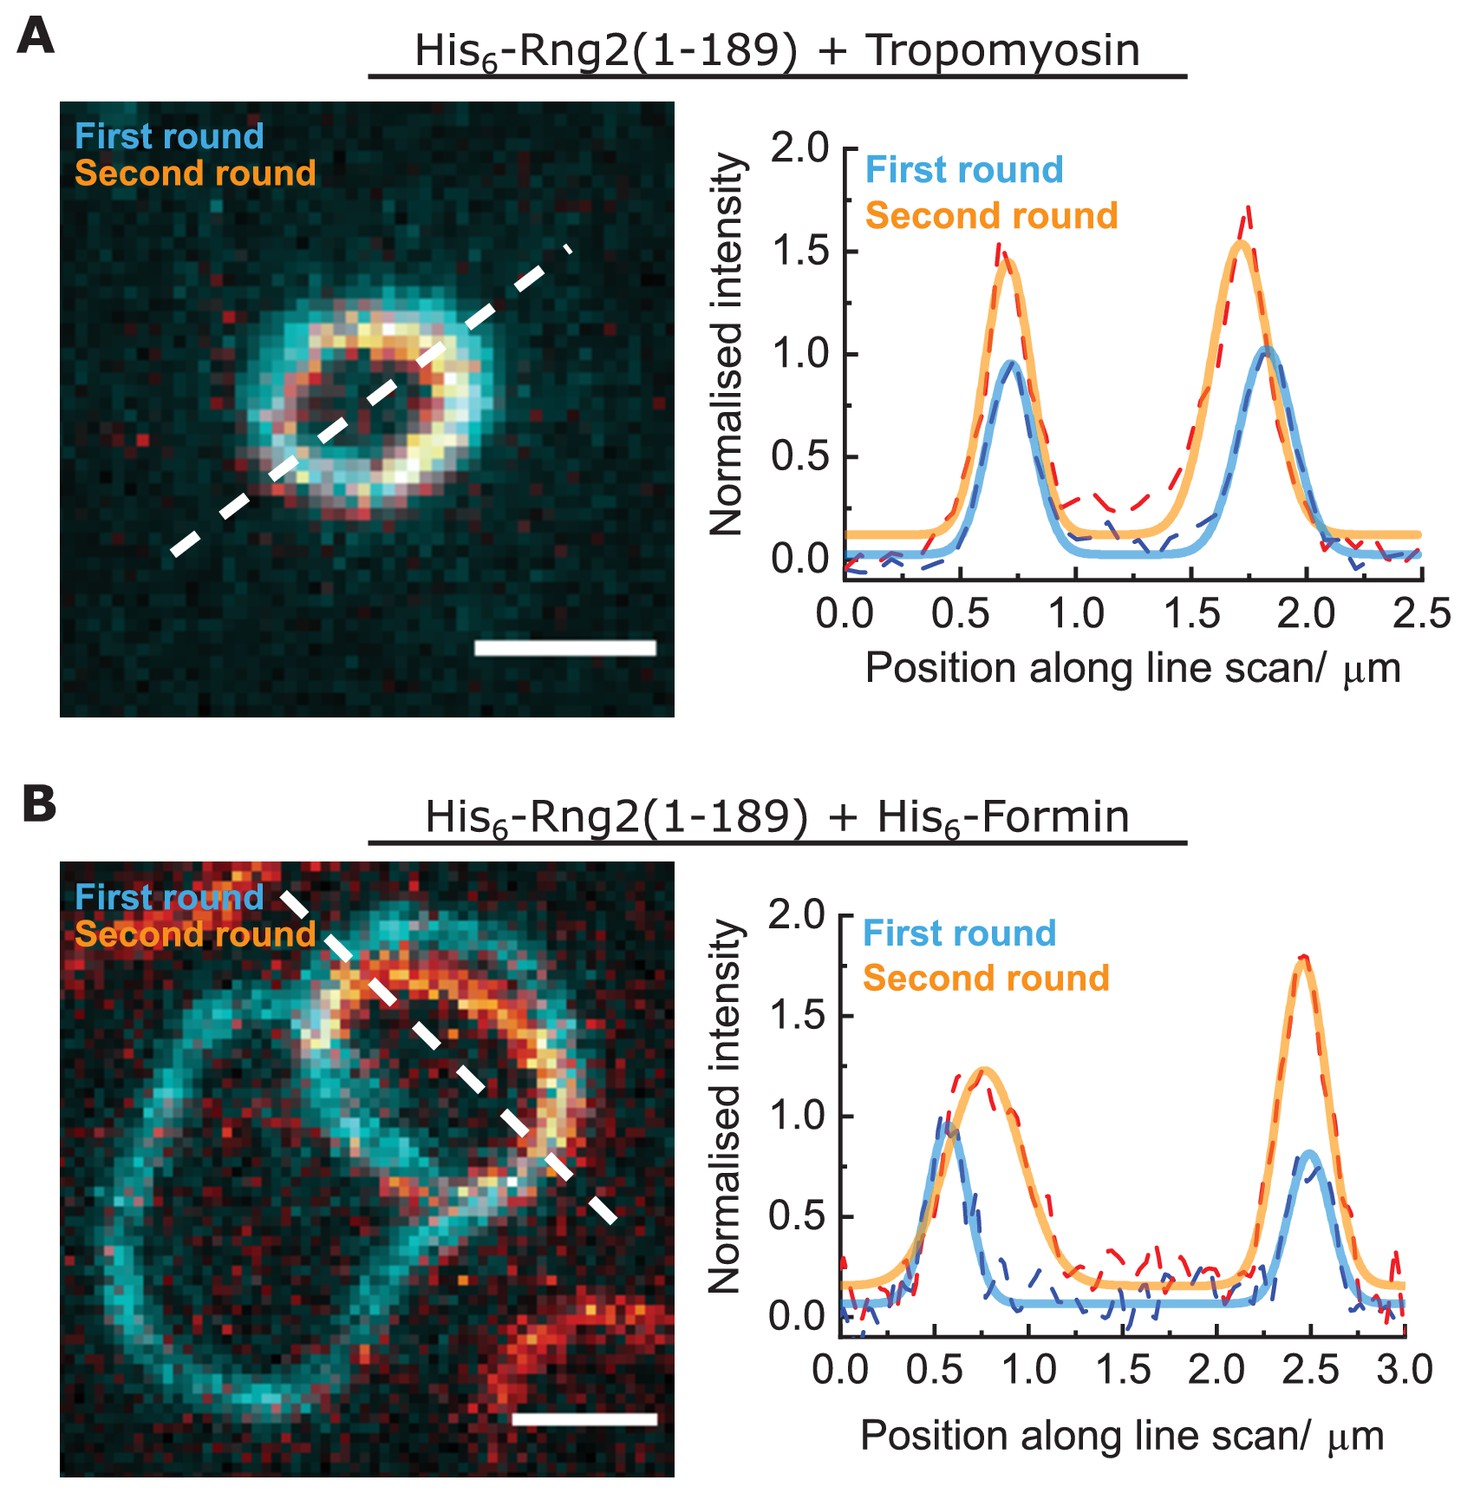
Curly can bend actin filaments multiple times into a ring.
(A) Left: TIRF microscopy image overlay showing multiple ring formation of a tropomyosin coated actin filament (Alexa488) during binding to membrane tethered His6-Rng2(1-189); the first ring formed is colored in cyan, the second ring (in orange) was highlighted by subtracting the image of the first ring from the image stack; scale bar: 1 µm. Right: Intensity line scan (three pixels width) along the white dashed line and corresponding Gaussian peak fits (colored dashed lines). (B) Left: TIRF microscopy image overlay showing multiple ring formation of a polymerizing actin filament (Alexa488) by membrane tethered His6-formin in presence of membrane tethered His6-Rng2(1-189); the first ring formed is colored in cyan, the second ring (in orange) was highlighted by subtracting the image of the first ring from the image stack; scale bar: 1 µm. Right: Intensity line scans (three pixels width) along the white dashed line and corresponding Gaussian peak fits (colored dashed lines).
Figure 3—figure supplement 5
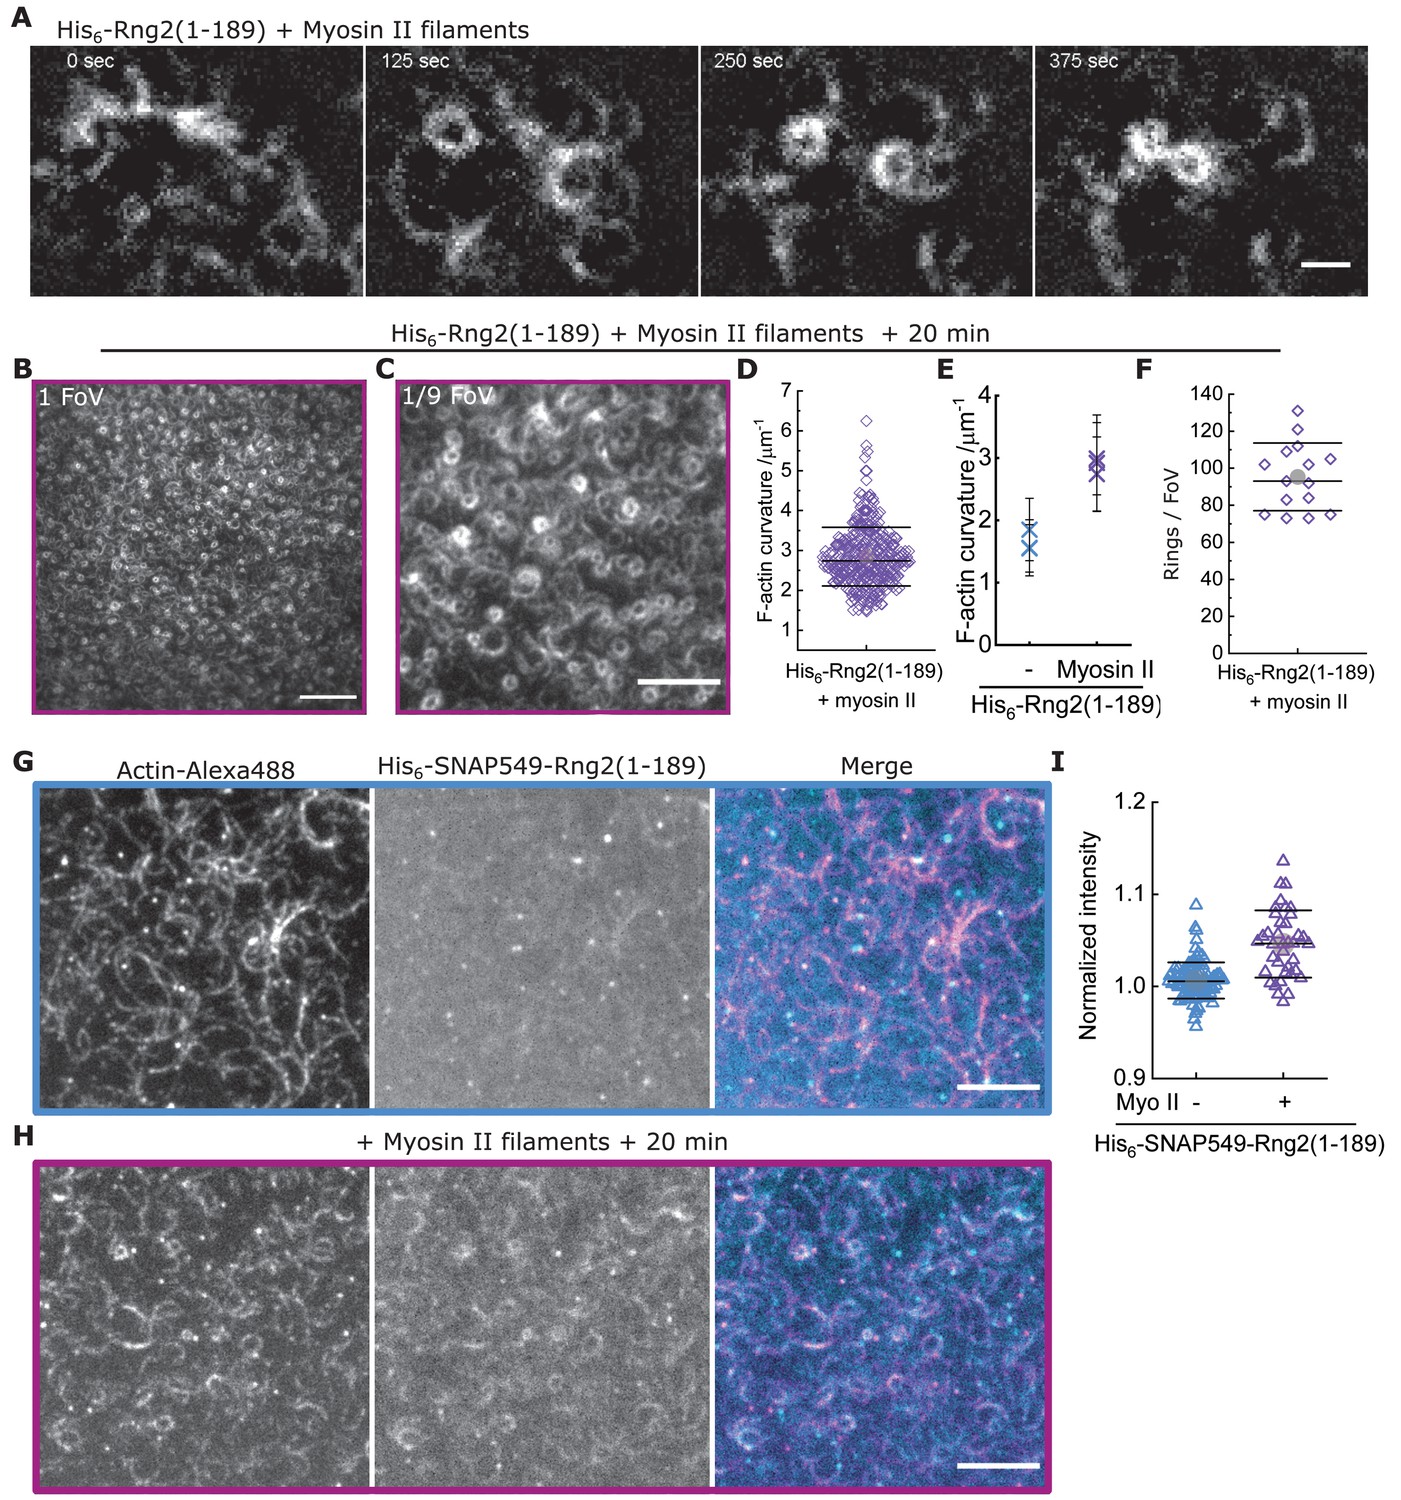
Muscle myosin II filaments contract curly induced actin rings even tighter.
(A) TIRF microscopy image time series showing rabbit muscle myosin II filament driven ring formation, sliding and contraction of actin filaments (Alexa488) bound to membrane tethered His6-Rng2(1-189); scale bar: 1 µm. (B) TIRF microscopy image (representing one field of view) of actin filaments (Alexa488) 20 min after addition of rabbit muscle myosin II filaments on His6-curly containing SLBs; scale bar: 10 µm. (C) Zoom of (B) showing 1/9 field of view; scale bar: 5 µm. (D) Data from Figure 3G plotted in linear scale. (E) Comparison of mean actin ring curvatures of individual experiments induced by His6-Rng2(1-189) alone (data from Figure 1C) and in presence of rabbit muscle myosin II filament after 20 min of incubation (data from Figure 3G). (F) Number of full actin rings per field of view of actin filaments 20 min after addition of rabbit muscle myosin II filaments on His6-Rng2(1-189) containing SLBs; N = 15 from three independent experiments. (G) Two-color TIRF microscopy image of actin filaments (Alexa488, magenta) bound to membrane tethered fluorescently labeled His6-SNAP-Rng2(1-189) (Surface549, cyan) before, and (H) 20 min after addition of rabbit muscle myosin II filaments; scale bar 5 µm. (I) Box plot of His6-SNAP-Rng2(1-189) (Surface549) intensities under curved actin filaments before and after addition of rabbit muscle myosin II filaments; intensities were normalized to the average intensity of the entire field of view.
Figure 4 with 5 supplements
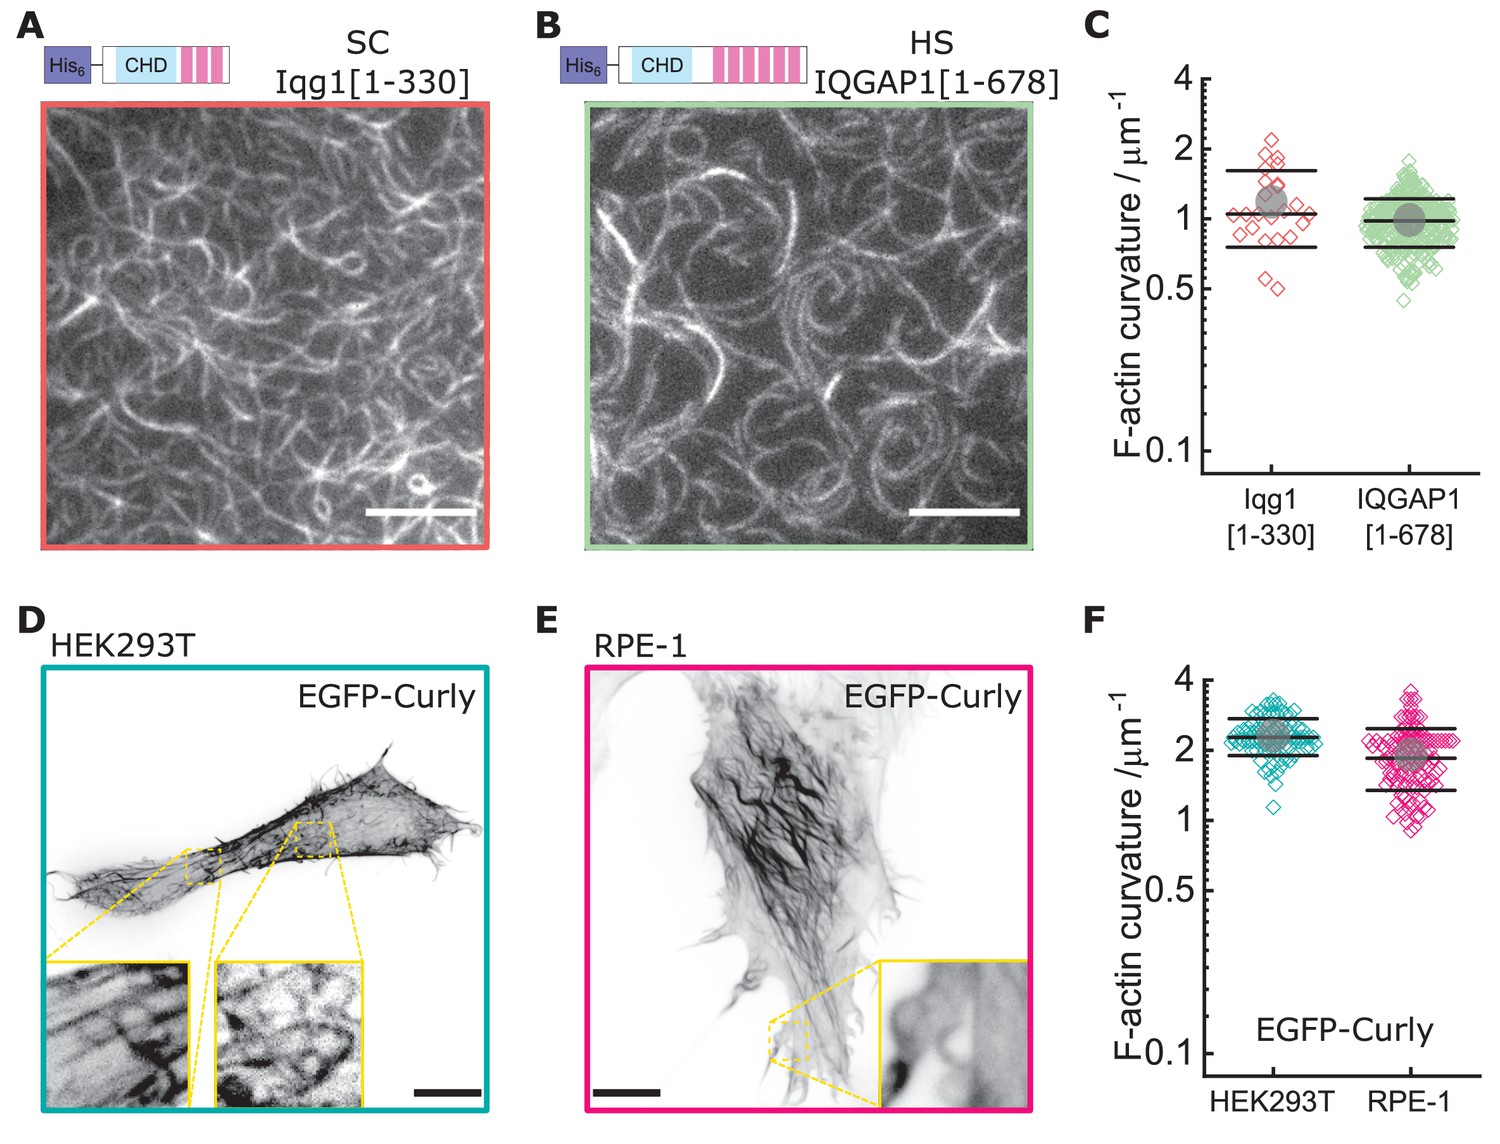
Curly effect is conserved among species and can foster actin bending in mammalian cells.
(A) TIRF microscopy image of actin filaments (Alexa488) bound to membrane tethered His6-Iqg1(1-330) (S. cerevisiae); image shows 1/9 of the field of view, scale bar: 5 µm. (B) TIRF microscopy image of actin filaments (Alexa488) bound to membrane tethered His6-IQGAP1(1–678) (H. sapiens); image shows 1/9 of the field of view, scale bar: 5 µm. (C) Curvature measurements of actin filament rings and curved segments; shown are the individual data points and their mean ± s.d.; Iqg1(1-330) (orange): N = 110 from three field of views of each of three individual experiments; IQGAP1(1–678) (green): N = 407 from 20 field of views of three individual experiments. (D) Confocal microscopy image (maximum intensity projection of the basal cell section) of a HEK293T cell transfected with EGFP-Rng2(1-189), inlet shows zoom of dashed box; scale bar: 5 µm. (E) Confocal microscopy image (maximum intensity projection of the basal cell section) of a RPE-1 cell transfected with EGFP-Rng2(1-189), inlet shows zoom of dashed box; scale bar: 5 µm. (F) Curvature measurements of actin filament rings and curved segments found in EGFP-Rng2(1-189) expressing cells; shown are the individual data points and their mean ± s.d.; HEK293T (teal): N 91 from 14 cells of two independent experiments; REP-1 (fuchsia): N = 113 from 11 cells of two independent experiments.
Figure 4—figure supplement 1
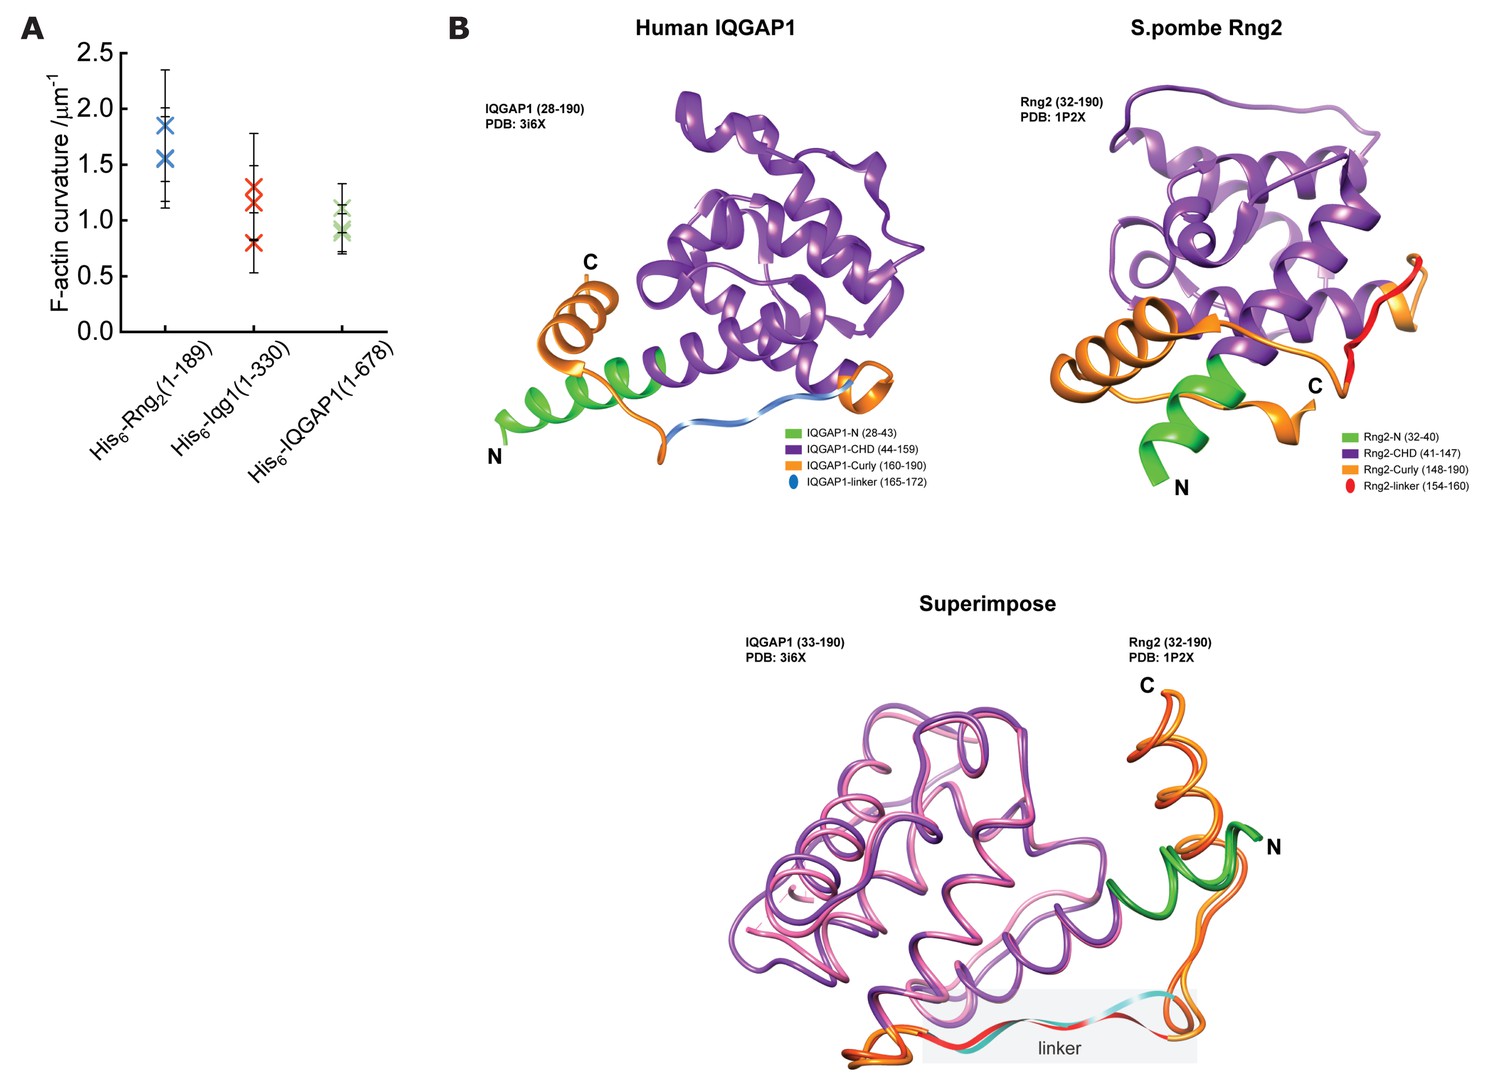
The structures of S. Pombe Rng2(21-190) and H. Sapiens IQGAP1(28-290) are very similar.
(A) Comparison of mean actin ring curvatures of individual experiments induced by His6-Rng2(1-189) (data from Figure 1C), His6-Iqg1(1-330) and His6-IQGAP1(1–678) (data from Figure 4C). (B) Depiction of structure predictions and overlay of H. sapiens IQGAP1(28–190) and S. pombe Rng2(32-190) indicating the strong similarity between the linker regions of both proteins that are thought to be important for actin bending.
Figure 4—figure supplement 2
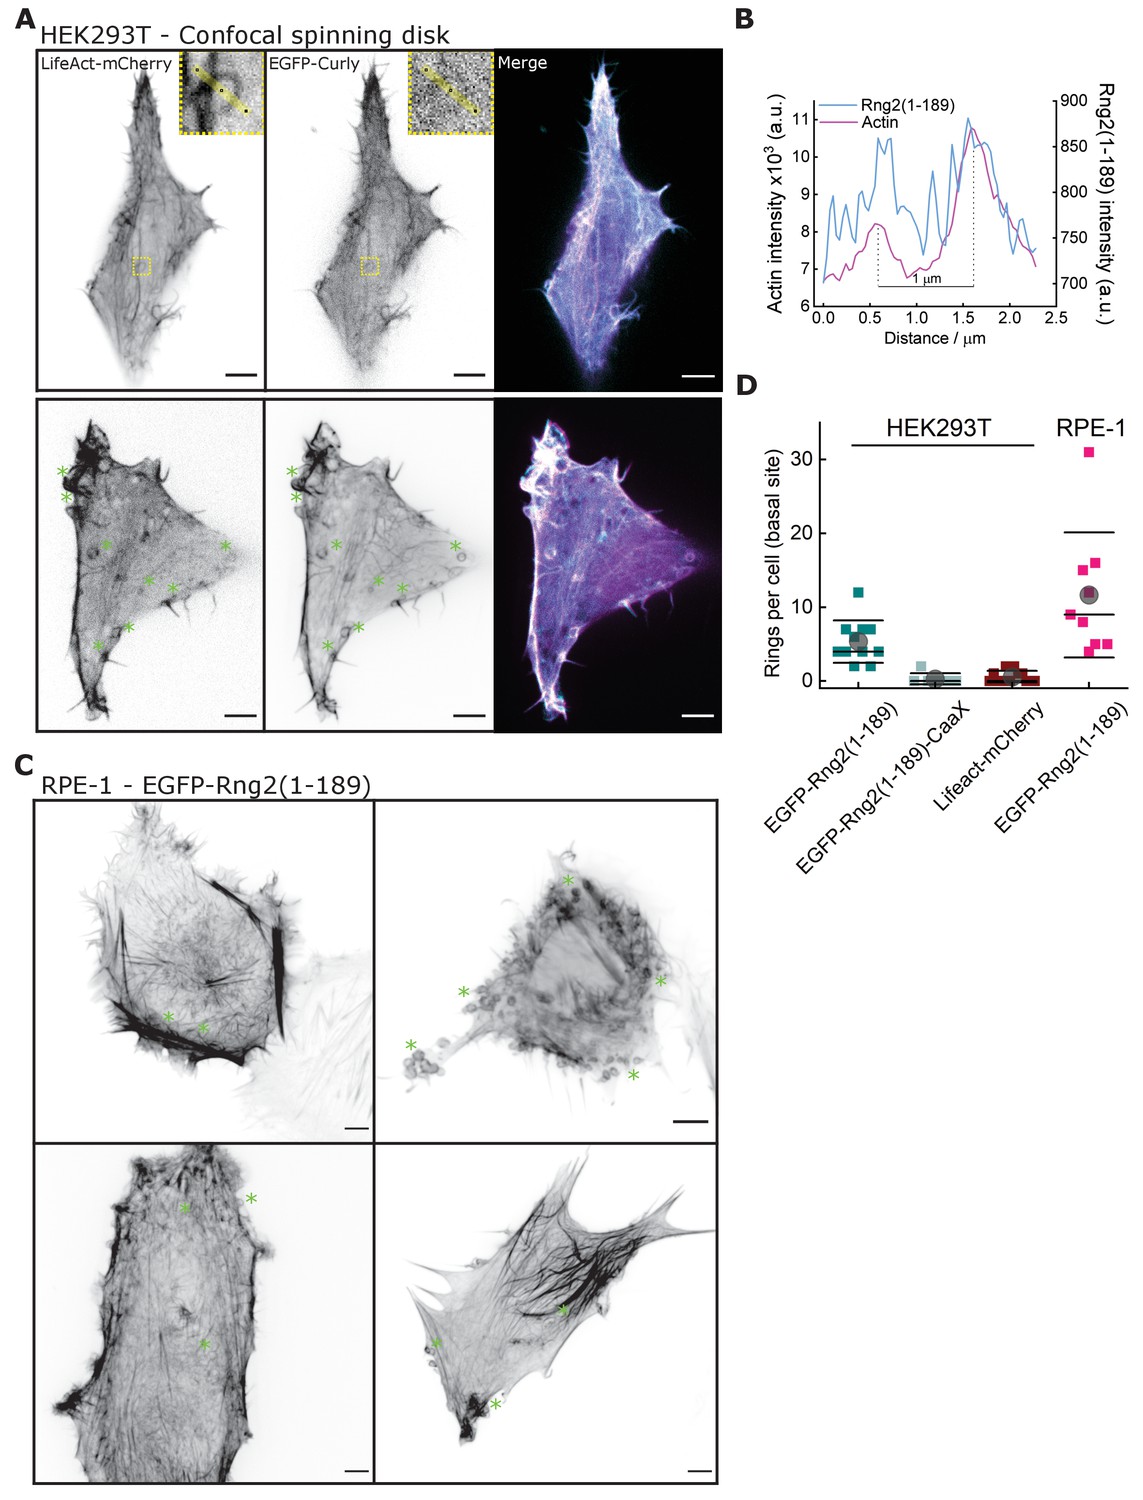
Curly induces actin rings in mammalian cells.
(A) Confocal microscopy images of HEK293T cells transfected with LifeAct-mCherry (magenta) and EGFP-Rng2(1-189) (cyan); inlet shows a ring structure showing both LifeAct and curly labeling; green stars indicate location of ring structures; images show maximum intensity projection of the basal cell section of ~2 μm; scale bar 5 μm. (B) Line scan of the ring in (A) depicting the intensity profile of LifeAct-mCherry and EGFP-Rng2(1-189). (C) Confocal microscopy images of RPE-1 cells transfected with EGFP-Rng2(1-189); green stars indicate location of ring structures; images show maximum intensity projection of the basal cell section of ~2 μm; scale bar 5 μm. (D) Quantification of actin rings found in the basal section of cells expressing EGFP-Rng2(1-189), EGFP-Rng2(1-189)-CaaX or LifeAct-mCherry only; each data point corresponds to one cell.
Figure 4—figure supplement 3, Curly induces highly curved actin filaments inside cells
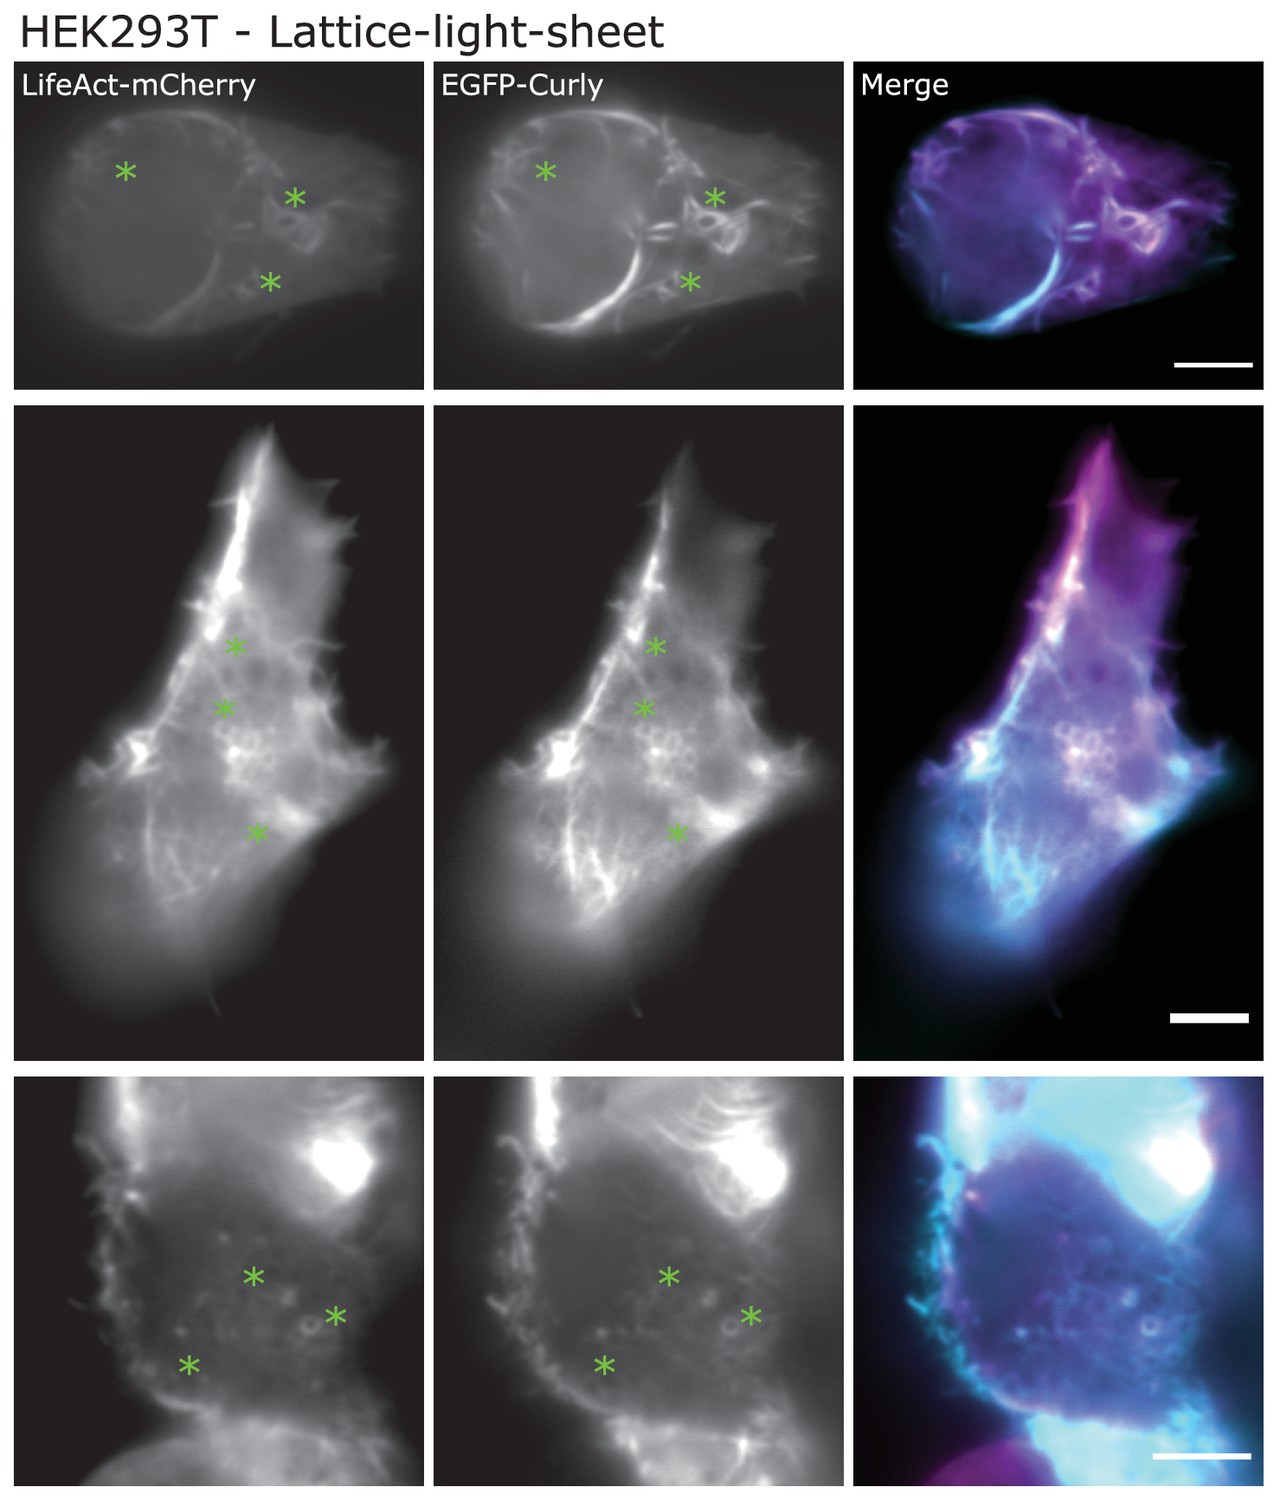
Lattice-light-sheet microscopy images (maximum intensity projections of middle or basal section) of HEK293T cells transfected with LifeAct-mCherry (magenta) and EGFP-Rng2(1-189) (cyan); green stars indicate location of ring structures; scale bar: 5 µm.
Figure 4—figure supplement 4
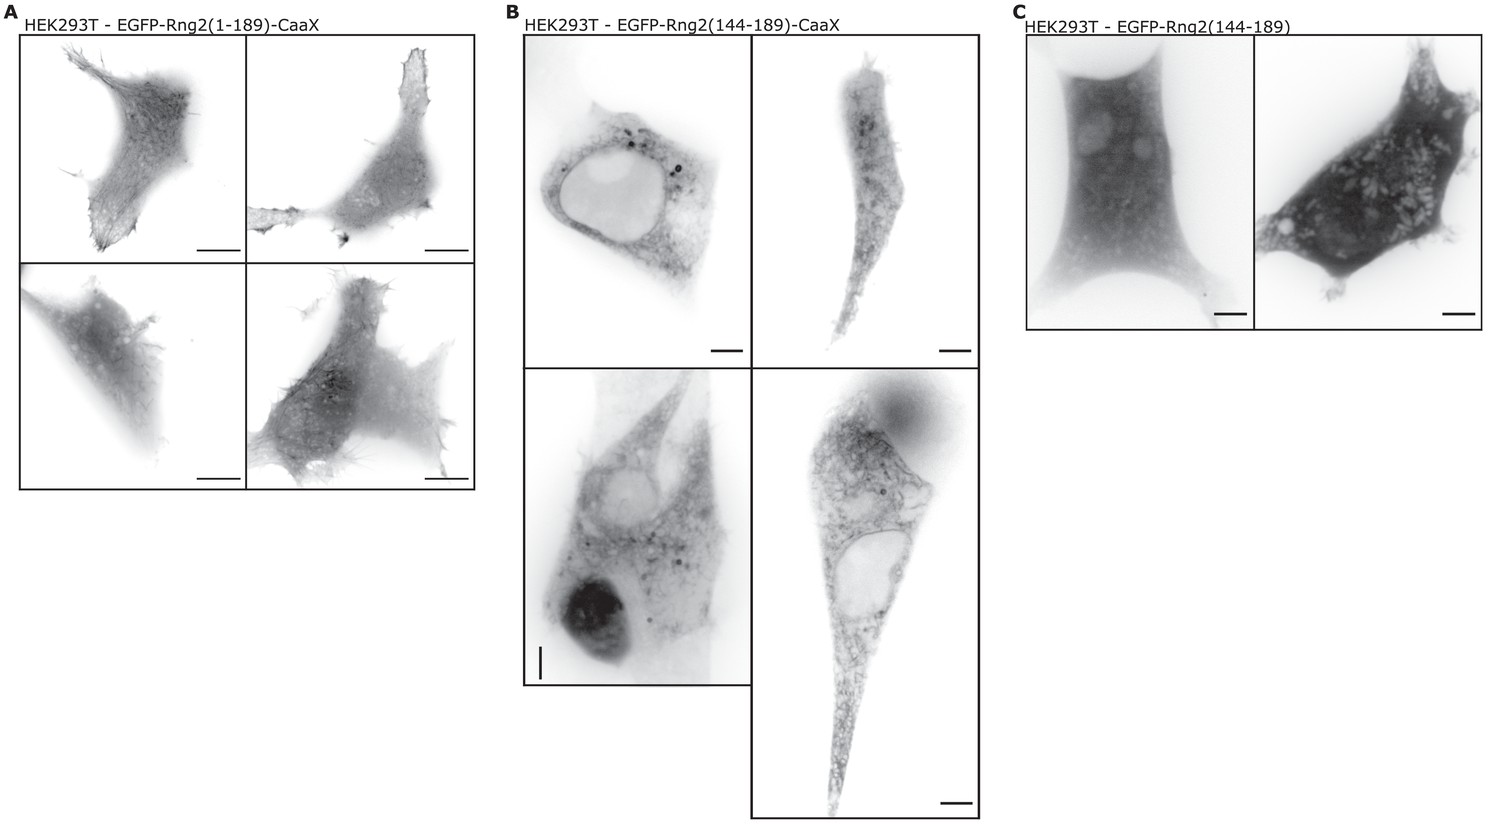
Addition of a CAAX domain to address curly to the plasma membrane is contraproductive.
(A) Confocal microscopy images of HEK293T cells transfected with EGFPRng2(1-189)-CaaX; images show maximum intensity projection of the basal cell section (~2 μm); scale bar 5 μm. (B) Confocal microscopy images of HEK293T cells transfected with EGFP-Rng2(144-189)-CaaX; images show maximum intensity projection of the basal cell section (~2 μm); scale bar 5 μm. (C) Confocal microscopy Example images of HEK293T cells transfected with EGFP-Rng2(44-189); images show maximum intensity projection of the basal cell section (~2 μm); scale bar 5 μm.
Figure 4—figure supplement 5
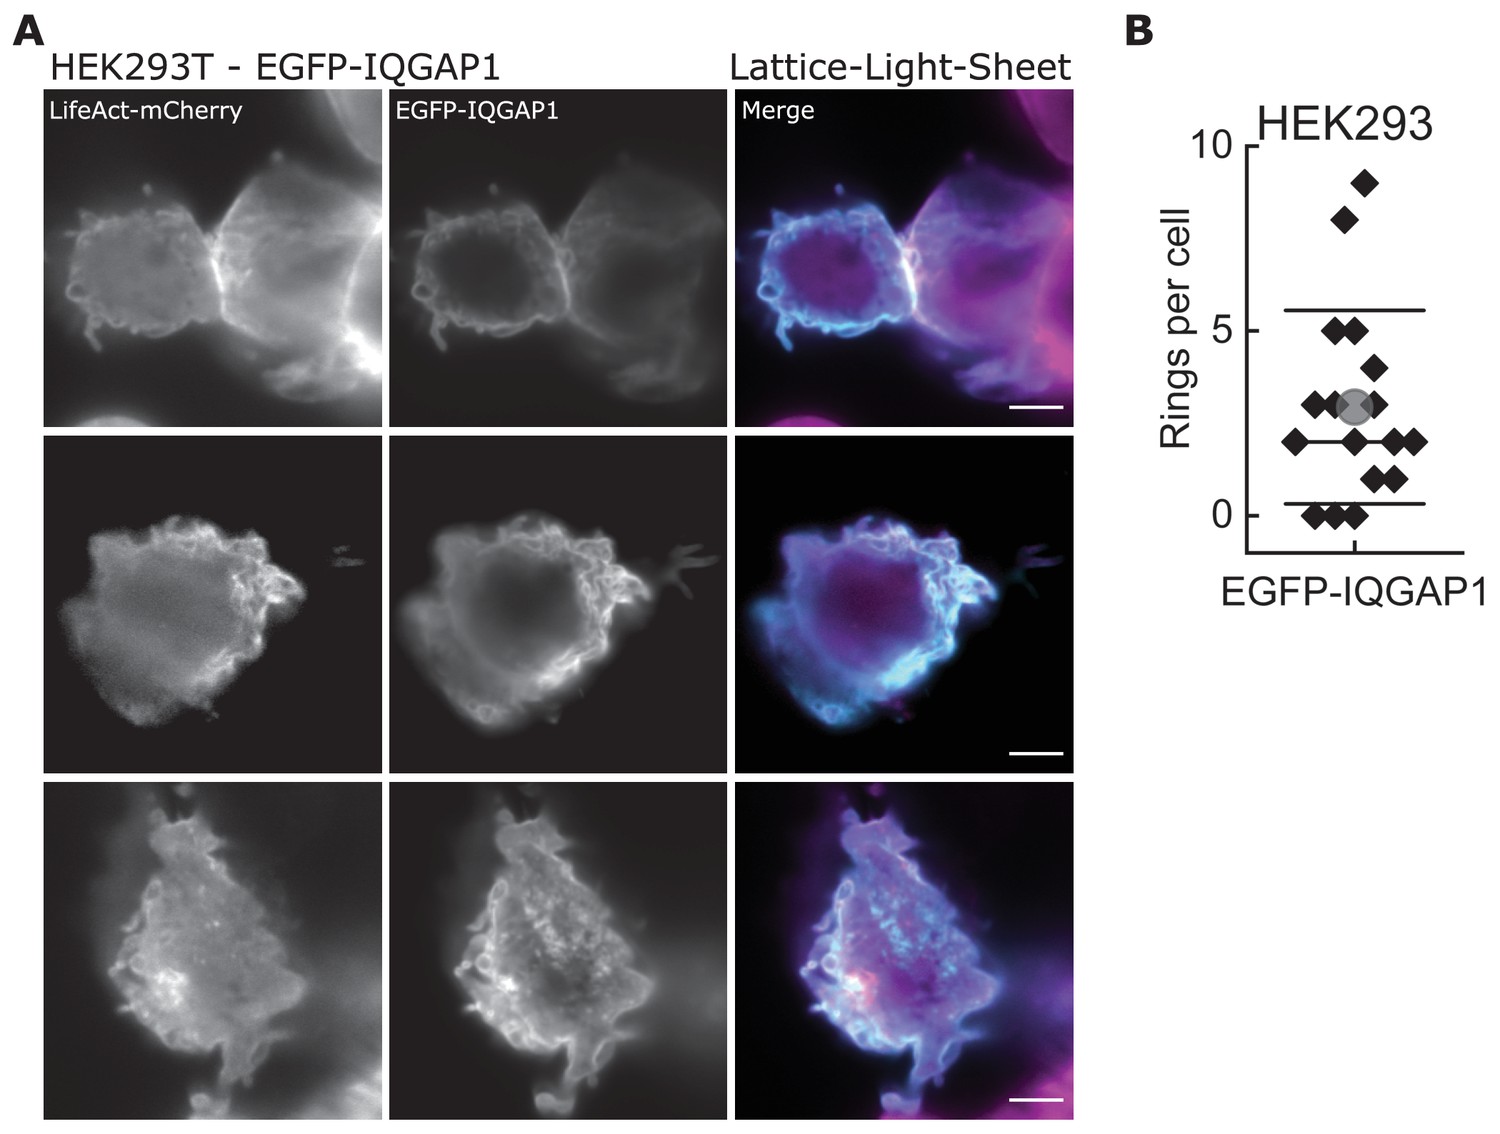
Overexpression of full-length IQGAP1 also leads to the formation of highly curved actin filaments in cells.
(A) Lattice-light-sheet microscopy images (maximum intensity projection) of HEK293T cells transfected with LifeAct-mCherry (magenta) and EGFP-IQGAP1 (cyan); scale bar: 5 µm. (B) Quantification of actin rings found in HEK293T cell expressing EGFP-IQGAP1.
Videos
Video 1
TIRF microscopy image sequence of actin filaments (Alexa488) landing on His6-curly decorated SLBs; scale bar: 5 µm.
Video 2
TIRF microscopy image sequence of an individual actin filament (Alexa488) landing on His6-curly decorated SLBs and displaying multiple rounds of curling; scale bar: 1 µm.
Video 3
Example image sequence of an actin filament (Alexa488, gray) with the plus end labeled by capping protein (SNAP647, yellow) landing on a His6-curly decorated SLB; scale bar: 1 µm.
Video 4
Example image sequences of actin filaments (Alexa488, gray) with the plus end labeled by capping protein (SNAP647, cyan) landing on a curly-His6 decorated SLB; scale bar: 1 µm.
Video 5
Example image sequences of actin filaments (Alexa488) polymerized by SLB tethered formin in the presence of His6-curly bound to the SLB; scale bar 1 µm.
Video 6
Example image sequences of actin filaments (Alexa488) decorated with tropomyosin binding to membrane tethered His6-curly; scale bar: 1 µm.
Video 7
Example image sequence showing formation, translation, and contraction of actin filament (Alexa488) rings on membrane tethered His6-curly after the addition of muscle myosin II filaments; scale bar: 1 µm.
Video 8
Example image sequences of actin filament (Alexa488) ring contraction on membrane tethered His6-curly after the addition of muscle myosin II filaments; scale bar: 1 µm.
Video 9
3D projection of HEK293T cell expressing EGFP-IQGAP1 (cyan) and Lifeact-mCherry (magenta); images obtained by lattice-light-sheet microscopy; scale bar: 10 μm.
Tables
Appendix 1—key resources table
| Reagent type (species) or resource | Designation | Source or reference | Identifiers | Additional information |
|---|---|---|---|---|
| Gene (Schizosaccharomyces pombe) | Rng2 | Pombase | SPAC4F8.13c | |
| Gene (Saccharomyces cerevisiae) | Iqg1 | Saccharomyces Genome Database (SGD) | SGD:S000006163 | |
| Strain, strain background (Escherichia coli) | BL21(DE3) | New England Biolabs | C2527I | Chemical competent cells |
| Cell line (Homo sapiens) | Human Embryonic Kidney (HEK) 293T | ATCC | RRID:CVCL_0063 | |
| Cell line (Homo sapiens) | Retinal Pigment Ephitilial-1 (hTERT-RPE1) | ATCC | RRID:CVCL_4388 | |
| Recombinant DNA reagent | pTK93 Lifeact-mCherry | Unpublished (Dr Iain Cheeseman’s lab) | RRID:Addgene46357 | mCherry version of LifeAct peptide |
| Recombinant DNA reagent | pEGFP-IQGAP1 | Ren et al J Biol Chem. 2005 Oct 14. 280(41):34548–57. | RRID:Addgene30112 | EGFP version of Hs IQGAP1 |
| Recombinant DNA reagent | pET28C (+) | Novagen-Sigma Aldrich | Cat. #: 69866 | |
| Recombinant DNA reagent | pGEX-4T1 | Cytiva (GE Healthcare) | Cat. #: 28-9545-49 | |
| Recombinant DNA reagent | pET-3d-6HIS-SNAP-tagged β1 subunit and untagged α1 subunits of chicken CapZ | Bombardier et al., 2015 | RRID:Addgene69948 | SNAP tagged version of Capping proteins |
| Recombinant DNA reagent | pGEX-alpha actinin4 (acnt4) | Bombardier et al., 2015Ennomani et al., 2016 (Kind gift from Blanchoin’s lab) | 6HIS tagged version of Hsalpha-actinin4 | |
| Recombinant DNA reagent | pET28C-6HIS-Rng2(1-189) | This paper | 6HIS tagged version of SpRng2 (1-189) (Supplementary file 2) | |
| Recombinant DNA reagent | pET28C-6HIS-Rng2(1-250) | This paper | 6HIS tagged version of SpRng2 (1-250) (Supplementary file 2) | |
| Recombinant DNA reagent | pET28C-6HIS-Rng2(1-300) | This paper | 6HIS tagged version of SpRng2 (1-300) (Supplementary file 2) | |
| Recombinant DNA reagent | pETMCN-Rng2(1-189)-C-6HIS | This paper | Cterminal −6HIS tagged version of SpRng2 (1-189) (Supplementary file 2) | |
| Recombinant DNA reagent | pET23a-10HIS-SNAP-Rng2(1-300) | This paper | 10HIS-SNAP tagged version of SpRng2 (1-300) (Supplementary file 2) | |
| Recombinant DNA reagent | pET28C-6HIS-ScIqg1 (1-330) | This paper | 6HIS tagged version of ScIqg1 (1-330) (Supplementary file 2) | |
| Recombinant DNA reagent | pET28C-6HIS-HsIQGAP1 (1–678) | This paper | 6HIS tagged version of HsIQGAP1 (1–678) (Supplementary file 2) | |
| Recombinant DNA reagent | pET28C-6HIS-Cdc12 (740–1391) | This paper | 6HIS tagged version of SpCdc121 (740–1391) (Supplementary file 2) | |
| Recombinant DNA reagent | pETMCN-AScdc8 | Palani et al., 2019, Journal of Cell Biology | untagged version of acetyl mimicking SpCdc8 (Supplementary file 2) | |
| Recombinant DNA reagent | pGEX4T1-GST-Fim1 | This paper | GST tagged version of SpFim1 (Supplementary file 2) | |
| Recombinant DNA reagent | pET23a-10HIS-SNAP-Ezrin-ABD | Unpublished, (Satyajit Mayor’s lab) | 10HIS-SNAP tagged version of Ezrin-ABD (Supplementary file 2) | |
| Recombinant DNA reagent | pCDNA3-EGFP-GSGG-Rng2(1-189) | This paper | EGFP tagged version of SpRng2 (1-189) (Supplementary file 2) | |
| Commercial assay or kit | Gibson cloning (NEBuilder) | New England Biolabs (NEB) | Cat. #: E5520S | |
| Commercial assay or kit | HisPur Ni-NTA agarose resin | ThermoFisher | Cat. #: 88221 | |
| Commercial assay or kit | Glutathione Sepharose 4B | Cytiva (GE healthcare) | Cat. #: 17-0756-01 | |
| Commercial assay or kit | PD MiniTrap G-25 | Cytiva (GE healthcare) | Cat. #: 28918007 | |
| Chemical compound, drug | SNAP-Surface 549 | New England Biolabs (NEB) | Cat. #: S9112S | |
| Chemical compound, drug | SimplyBlue safe Stain | Invitrogen | Cat. #: LC6060 | |
| Other | Opti-MEM | Life Technologies | Cat. #: 31985062 | Reduced Serum Cell medium |
| Chemical compound, drug | Alexa488-maleimide | ThermoFisher | Cat. #: A10254 | |
| Other | poly-prep chromatography columns | Bio-Rad | Cat. #: 7311550 | Column for protein purification |
| Peptide, recombinant protein | Myosin II (Rabbit m. psoas) | Hypermol | Cat. #: 8326–01 | |
| Other | muscle acetone powder form rabbit | Merck (Sigma-Aldrich) | Cat. #: M6890 | Acetone powder from rabbit muscle used as a source for actin purification |
| Chemical compound, drug | 1,2-dioleoyl-sn-glycero-3-phosphocholine (DOPC) | Avanti Polar Lipids, RRID:SCR_016391 | Ca.t #: 850375 | |
| Chemical compound, drug | 1,2-dioleoyl-sn-glycero-3-[(N-(5-amino-1-carboxypentyl)iminodiacetic acid)succinyl] (nickel salt) (DGS-NTA(Ni)) | Avanti Polar Lipids, RRID:SCR_016391 | Cat. #: 790404 | |
| Other | Lipid extruder | Avanti Polar Lipids, RRID:SCR_016391 | Cat. #: 610000 | Tool used for the formation of small unilamellar vesicles (SUVs). |
| Other | µ-Dish 35 mm | IBIDI | Cat. #: 81156 | Cell culture dishes with glass bottom made for fluorescence microscopy. |
| Other | 24 mm x50 mm glass coverslips, #1.5, borosilicate | Menzel/ Fisher Scientific | Cat. #: 11348503 | Basis for the formation of lipid bilayers imaged via fluorescence microscopy. |
| Software, algorithm | ImageJ | NIH | RRID:SCR_003070 | Version 1.53 c |
| Primers | ||||
| Sequence-based reagent | SpRng2_1Fw | This paper | PCR primers | CGGGATCCCGATGGACGTAAATGTGGGATTATC |
| Sequence-based reagent | SpRng2_189Rv | This paper | PCR primers | CCGCTCGAGTCATTAAGCTTTGAAGTTAGGAAGGATTAC |
| Sequence-based reagent | SpRng2_250Rv | This paper | PCR primers | CCGCTCGAGTTAGTCTGAACGAGCGCTAGCATC |
| Sequence-based reagent | SpRng2_300Rv | This paper | PCR primers | CCGCTCGAGTCATTAAGATCGTTGCATATGTCCC |
| Sequence-based reagent | ScIqg1-1Fw | This paper | PCR primers | CGGGATCCCGATGACTGCCTACTCCGGTTCC |
| Sequence-based reagent | ScIqg1-330Fw | This paper | PCR primers | CCGCTCGAGTTACACGTCAAGATTGCTCATTTTAGG |
| Sequence-based reagent | SpFim1-Fw | This paper | PCR primers | CGGGATCCCGGATGTTAGCTCTTAAACTTCAAAAG |
| Sequence-based reagent | SpFim1-Rv | This paper | PCR primers | CCGCTCGAGTTATACGGCCATTAAACTGCC |
| Sequence-based reagent | SpCdc12-740Fw | This paper | PCR primers | CGGGATCCCGATGGGCTCAACTAATTCCAAGGAAAGG |
| Sequence-based reagent | SpCdc12-1391Rv | This paper | PCR primers | CCGCTCGAGTTAATTGTTGACAAGATTCAAACGTC |
Additional files
-
Supplementary file 1
Table summarizing the experimental results.
- https://cdn.elifesciences.org/articles/61078/elife-61078-supp1-v2.xlsx
-
Supplementary file 2
List of the plasmids used in this study.
- https://cdn.elifesciences.org/articles/61078/elife-61078-supp2-v2.docx
-
Transparent reporting form
- https://cdn.elifesciences.org/articles/61078/elife-61078-transrepform-v2.docx
Download links
A two-part list of links to download the article, or parts of the article, in various formats.
Downloads (link to download the article as PDF)
Open citations (links to open the citations from this article in various online reference manager services)
Cite this article (links to download the citations from this article in formats compatible with various reference manager tools)
Calponin-homology domain mediated bending of membrane-associated actin filaments
eLife 10:e61078.
https://doi.org/10.7554/eLife.61078


