Supervised mutational signatures for obesity and other tissue-specific etiological factors in cancer
- Division of Biostatistics and Bioinformatics, Department of Oncology, Sidney Kimmel Cancer Center, Johns Hopkins University School of Medicine, United States
- Department of Biostatistics, Johns Hopkins Bloomberg School of Public Health, United States
- Laboratory of Systems Biology and Computational Genetics, Vavilov Institute of General Genetics, RAS, Russian Federation
- State University of New York at Stony Brook, United States
- Ludwig Center & Howard Hughes Medical Institute, Johns Hopkins Kimmel Cancer Center, United States
Figures
Figure 1 with 1 supplement
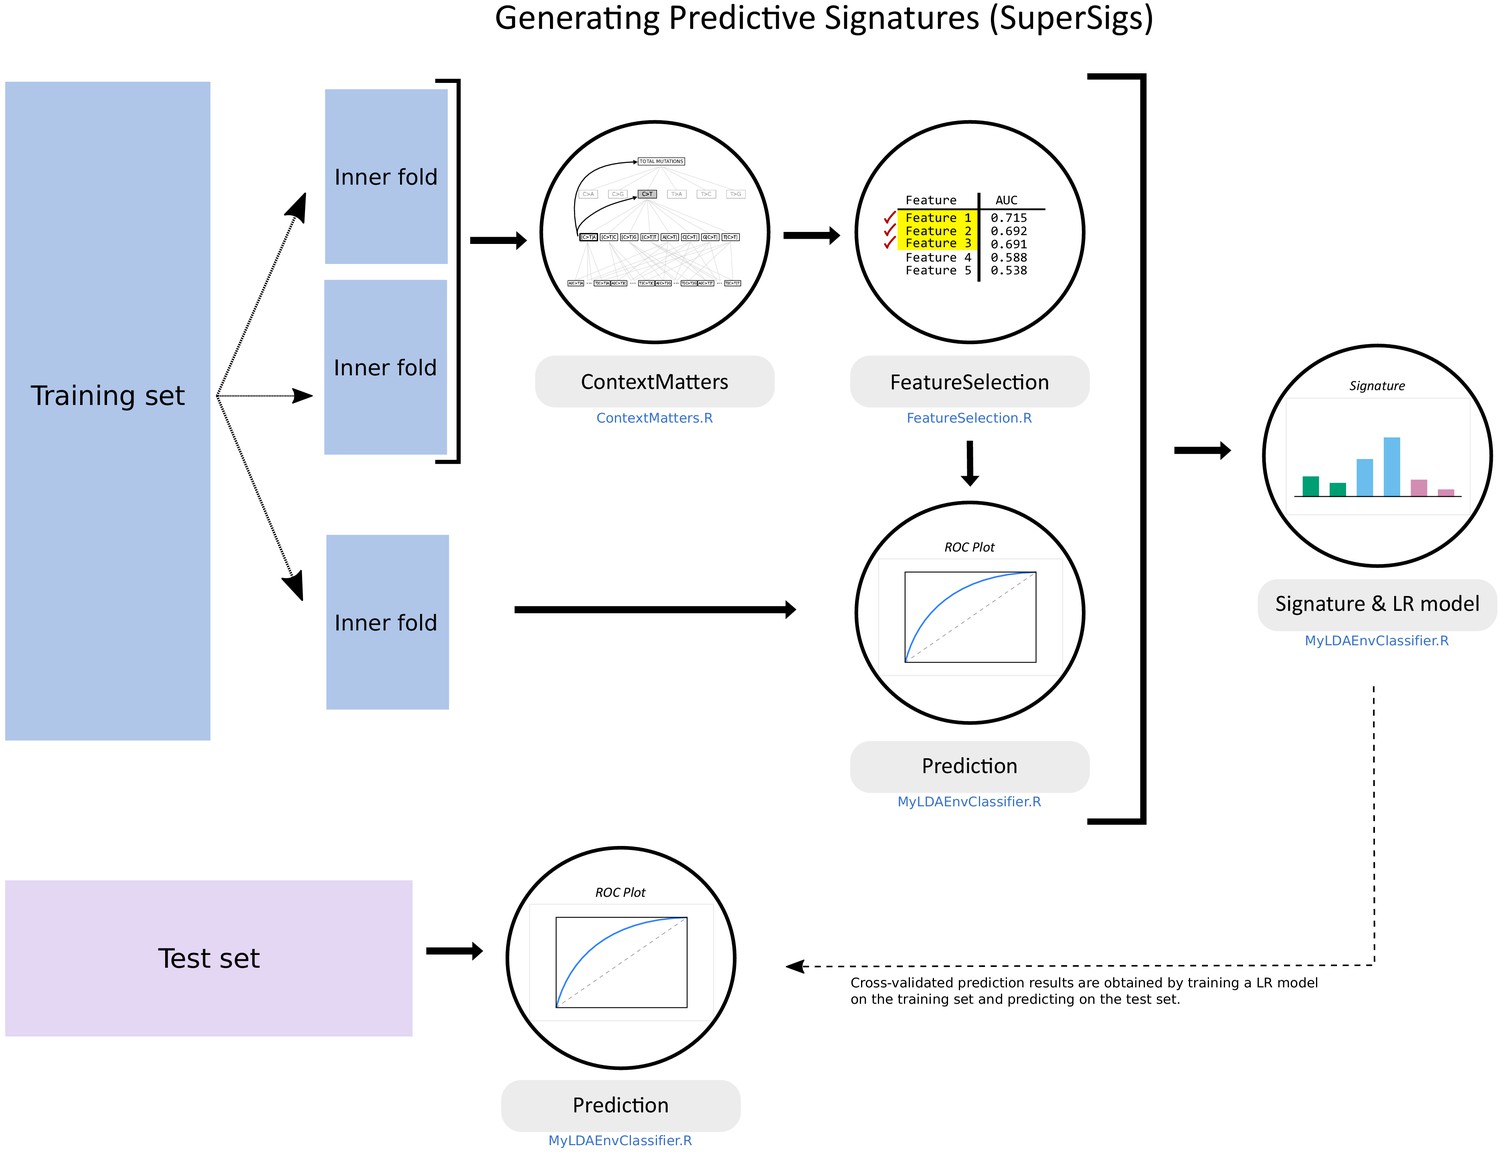
Flowchart of the supervised methodology for predictive mutational signatures.
A schematic representation of the key steps contained in the supervised methodology. After splitting the TCGA dataset into training (80% of data) and test (20%) sets, ‘ContextMatters’ and ‘FeatureSelection’ are used to learn the candidate features. The final predictive features are then selected by learning the mutational differences between exposed and unexposed samples in the ‘Prediction’ step. These predictive features with their corresponding average rates derived during training form the supervised mutational signature (SuperSig), which is then used to predict exposure to an etiological factor in the test set (see Materials and methods for more details).
Figure 1—figure supplement 1
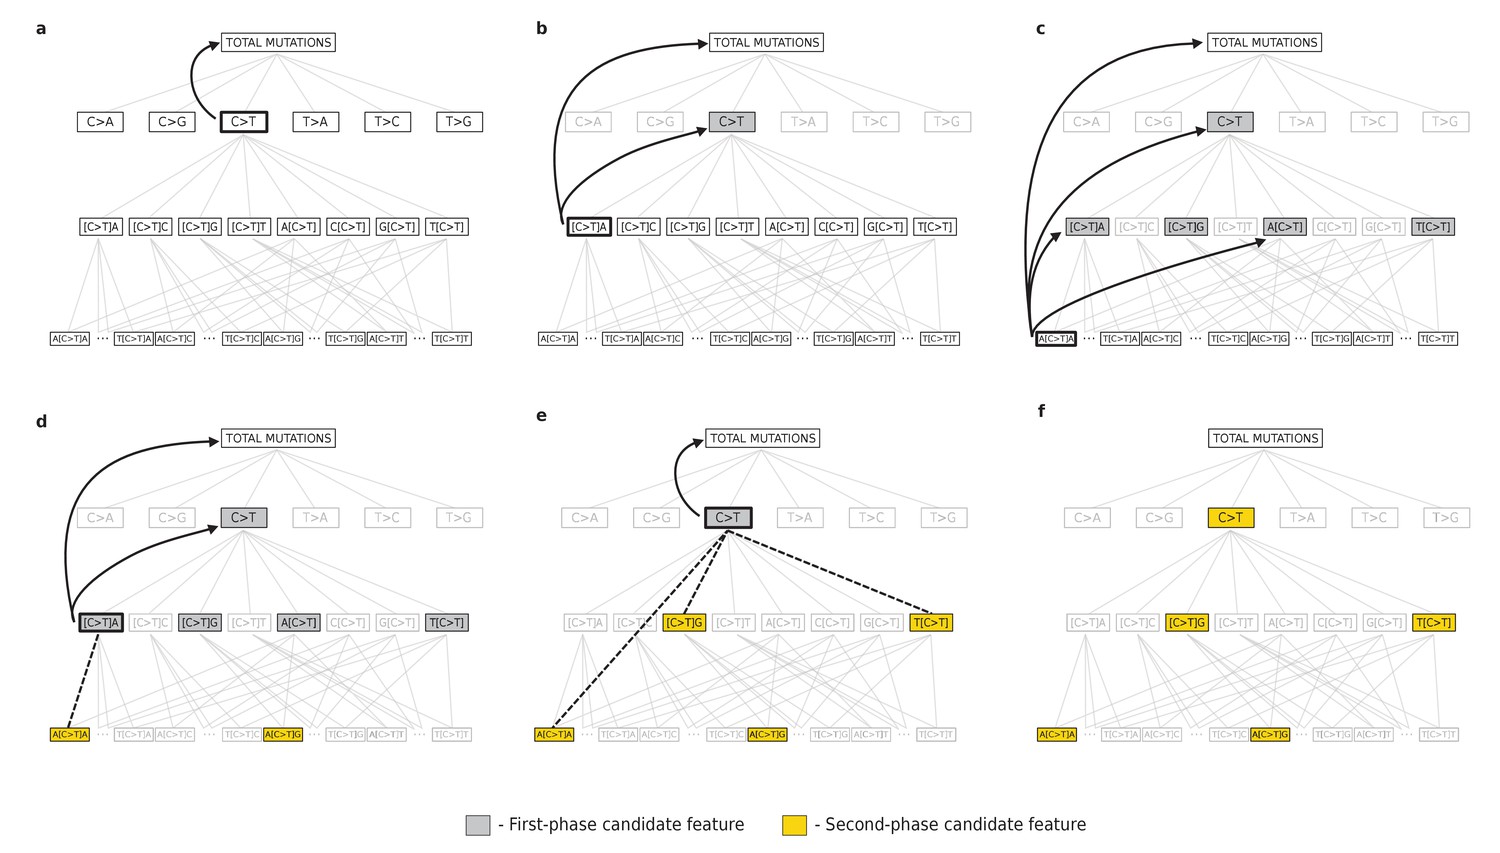
Supervised feature engineering.
Pictorial representation of the process used for determining the ‘candidate features’, by going ‘down and up the tree’, as described in detail in the Materials and method section. Bold line connecting two mutation types indicate statistical testing of significant differences between them.
Figure 2
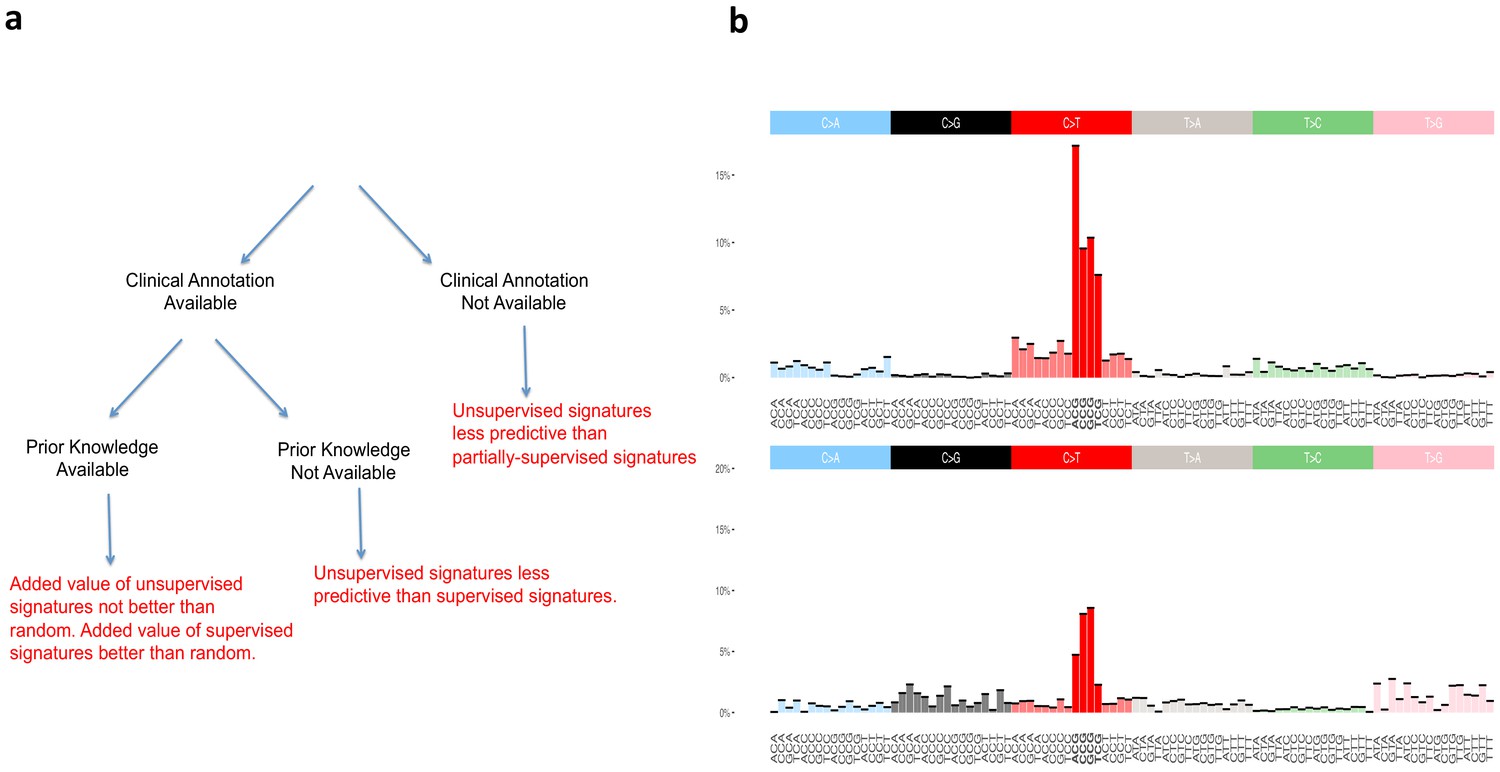
Supervised and unsupervised approaches to mutational signatures.
(a) The three possible scenarios in which the supervised and unsupervised approaches can be compared (black) and a summary of each comparison (red). (b) Unsupervised versus random. The signature at the top of the figure is the unsupervised ‘aging’ Signature one from Alexandrov et al., 2013b. We want to assess the value of this signature beyond the ‘peak’ at [C>T]G (bold red color), that is we want to evaluate how valuable is the rest of the distribution (colors not in bold) as found by the unsupervised method. The signature at the bottom of the figure is an example of randomly generated single peak signatures based on sampling from a uniform distribution. Note that the normalized frequency of the mutation type corresponding to the peak of this randomly generated signature is not a fixed value; it happens to carry by chance the highest weight of the distribution over [C>T]G (bold red color) mutations among a set of 30 signatures generated randomly (see Materials and methods section for their construction).
Figure 3 with 39 supplements
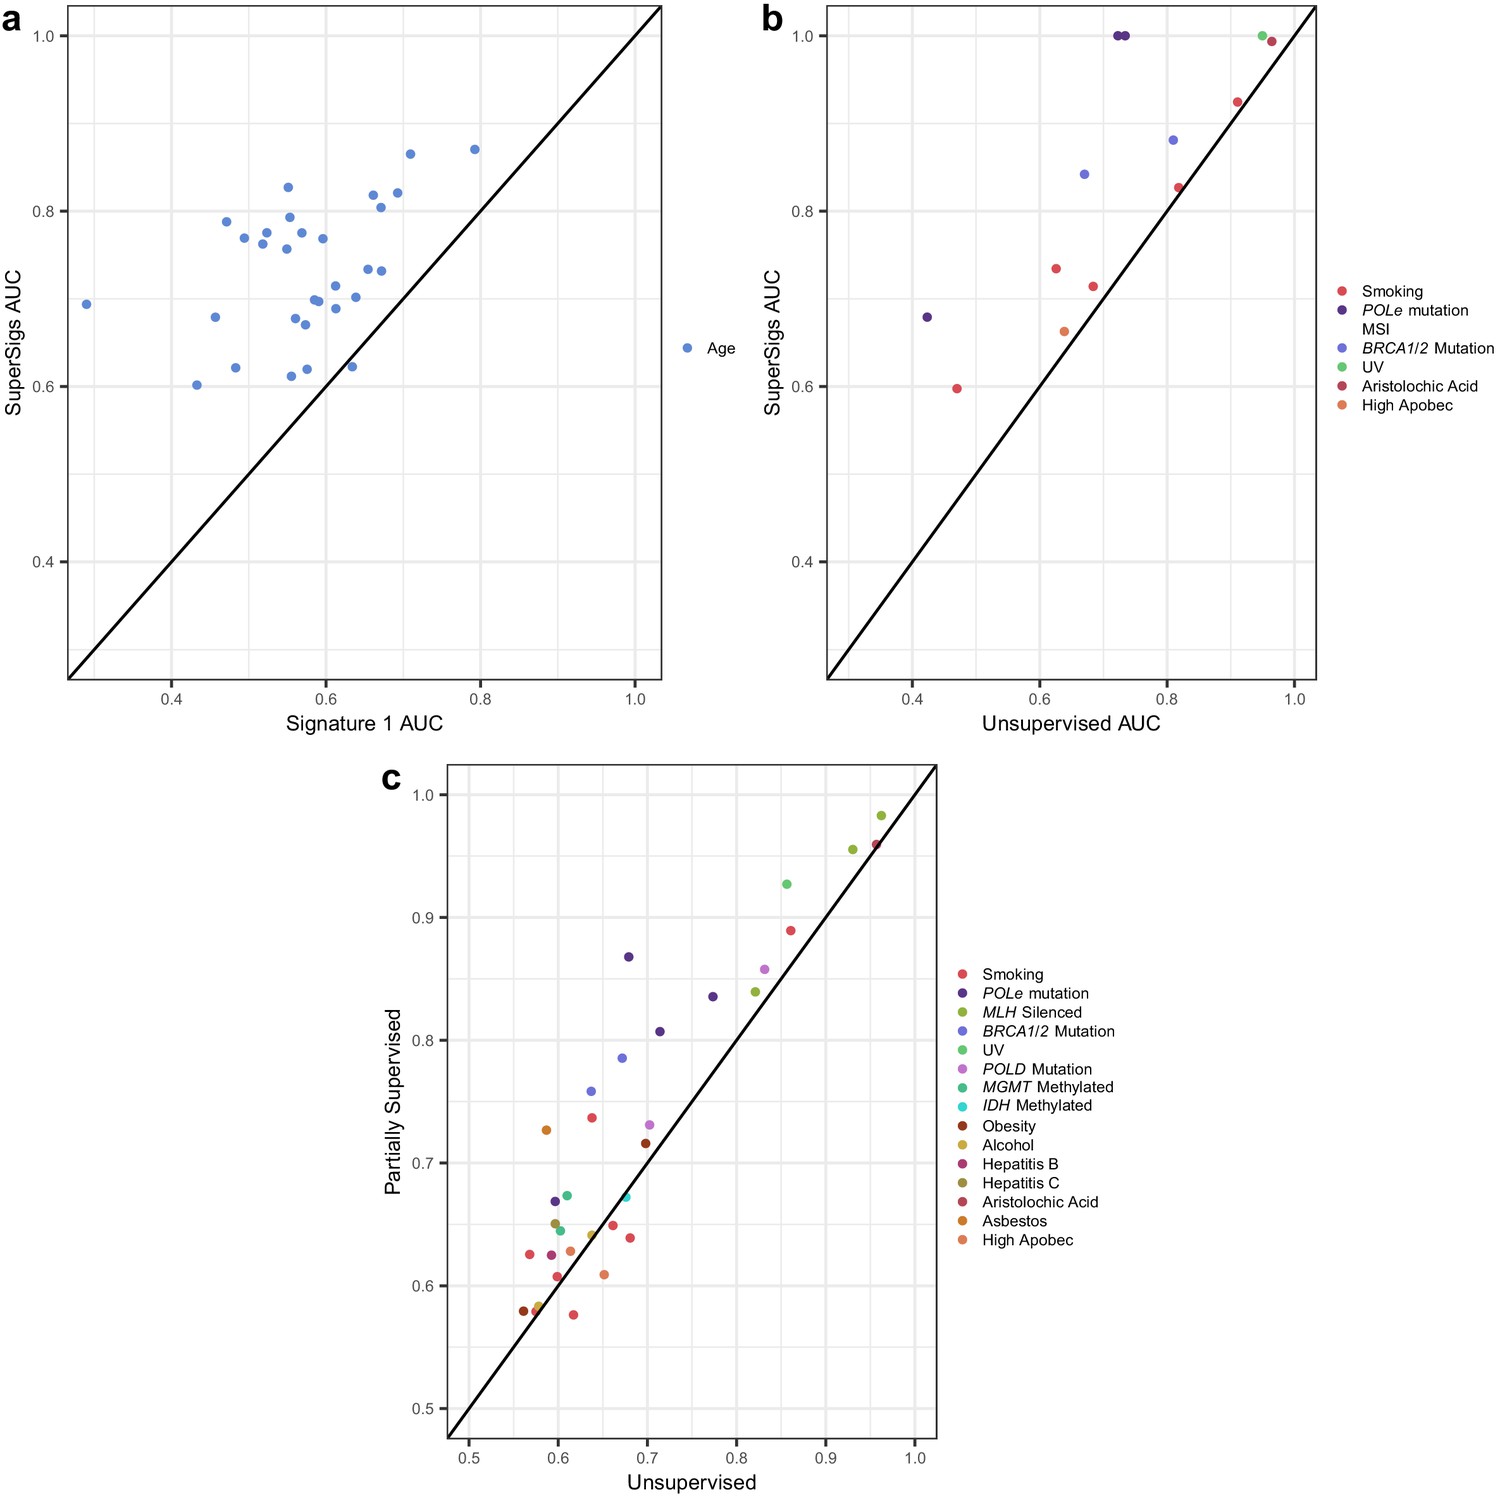
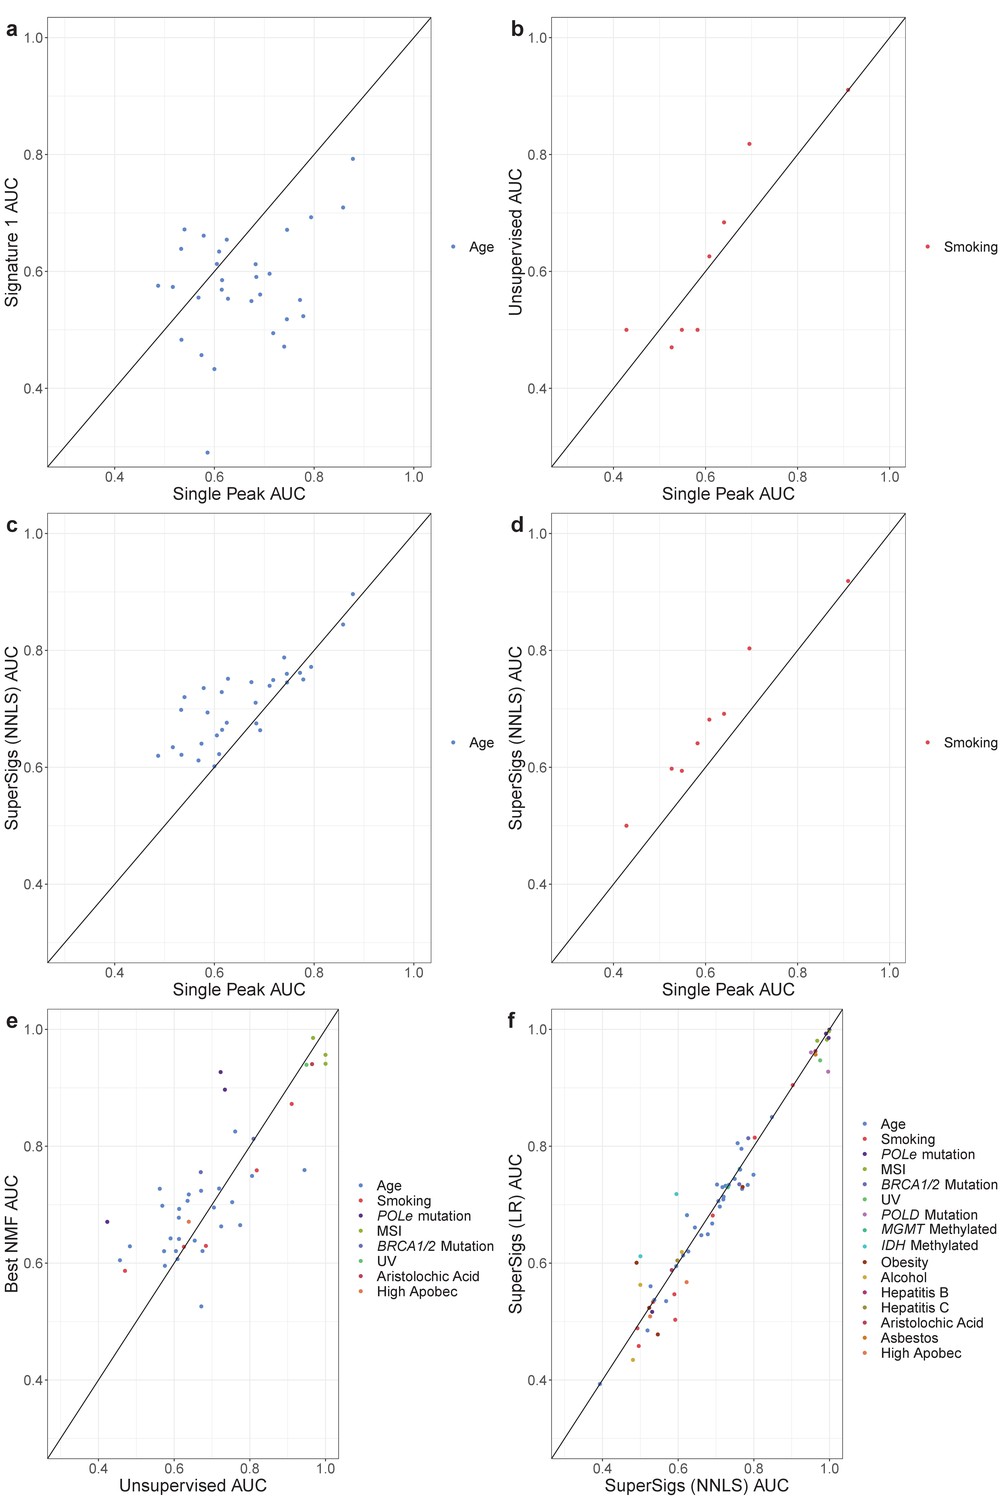
Comparisons of prediction accuracies (AUCs) of supervised, partially supervised, and unsupervised methodologies.
(a) Supervised age SuperSigs vs unsupervised Signature 1 over 30 tumor types; (b) SuperSigs vs unsupervised signatures for all annotated etiological factors other than age found in Alexandrov et al., 2013a, in tumor types for which the unsupervised signature was present (for the full list see Supplementary file 1). (c) Partially supervised vs unsupervised NMF signatures for all annotated etiological factors other than age (see Materials and methods). Each combination of tumor type and risk factor (e.g. lung adenocarcinoma and smoking) yields a signature and is represented by one point, which depicts the prediction accuracies of the unsupervised approach (x-axis coordinate value) versus the supervised (a–b) or partially supervised (c) one (y-axis coordinate value). Apparent AUCs are reported. The great majority (c) or essentially all (a–b) points lie above or on the line, indicating the greater accuracy of the supervised and partially supervised approaches.
Figure 3—figure supplement 1
Unsupervised, random, and supervised methods’ comparisons.
Comparison of the prediction accuracies (in terms of AUC) are reported for all signatures of age, environmental, and inherited factors, for the unsupervised, the randomly generated single peak signatures, and the supervised methodologies. (a) Random Single Peak (Single Peak) vs Alexandrov’s Signature one for age; (b) Random Single Peak (Single Peak) vs Alexandrov’s Unsupervised for smoking; (c) Random Single Peak (Single Peak) vs Non-negative Least Square (NNLS) SuperSigs for age; (d) Random Single Peak (Single Peak) vs Non-negative Least Square (NNLS) SuperSigs for smoking; (e) Alexandrov’s Unsupervised vs Best NMF for the indicated exposures; (f) Non-negative Least Square (NNLS) SuperSigs vs standard SuperSigs, that is the ones using logistic regression (LR) (see Materials and methods for details). All comparisons based on apparent AUC except for f.
Figure 3—figure supplement 2
The tissue dependence of the mutational signatures.
Figure 3—figure supplement 3
The tissue dependence of the mutational signatures.
Figure 3—figure supplement 4
The tissue dependence of the mutational signatures.
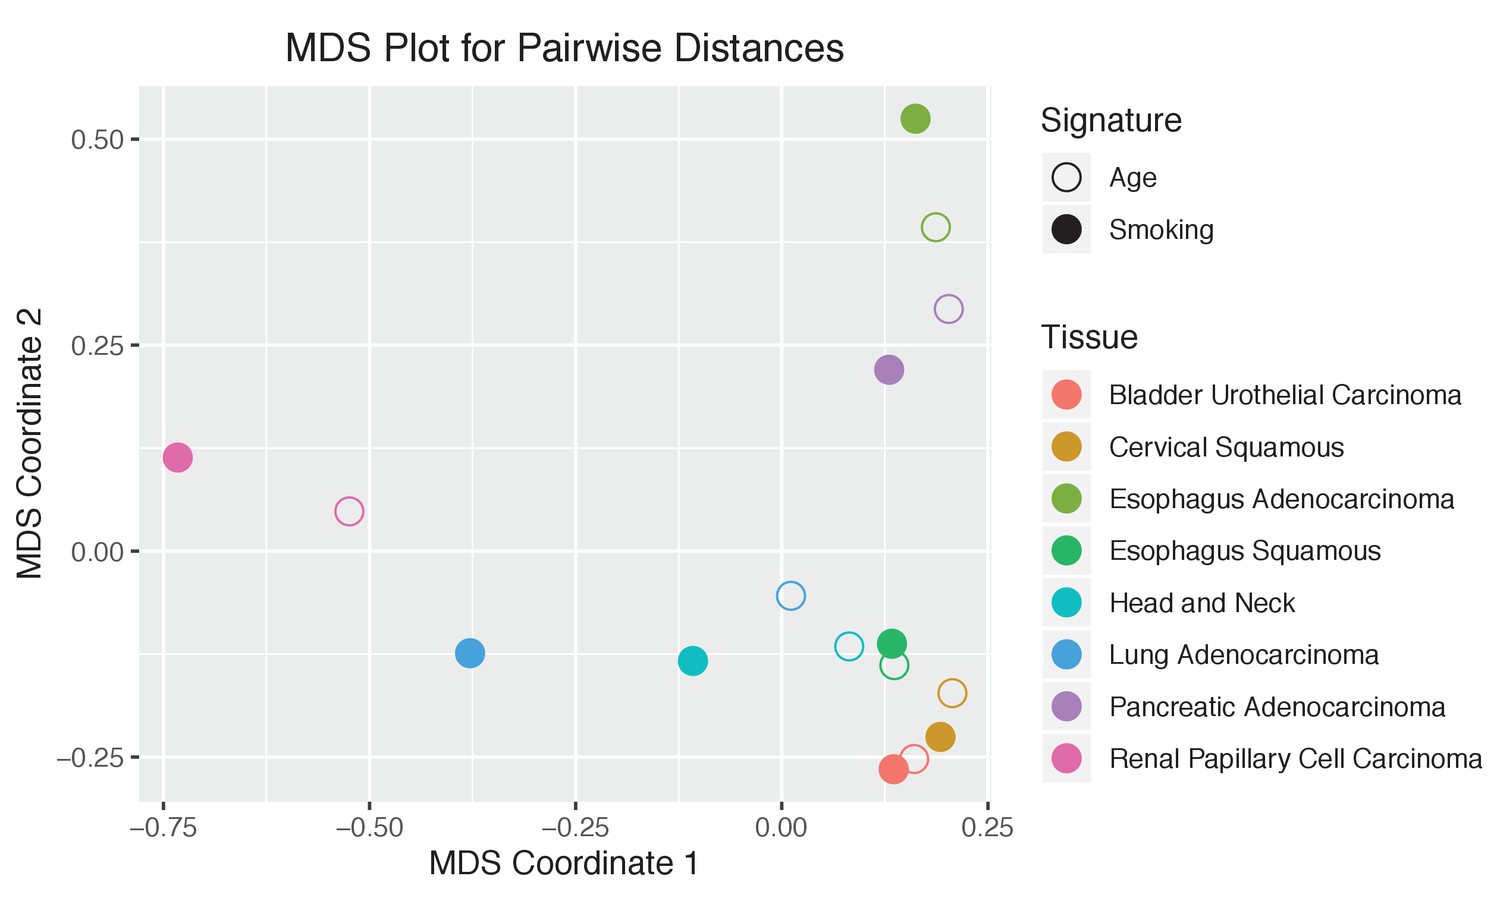
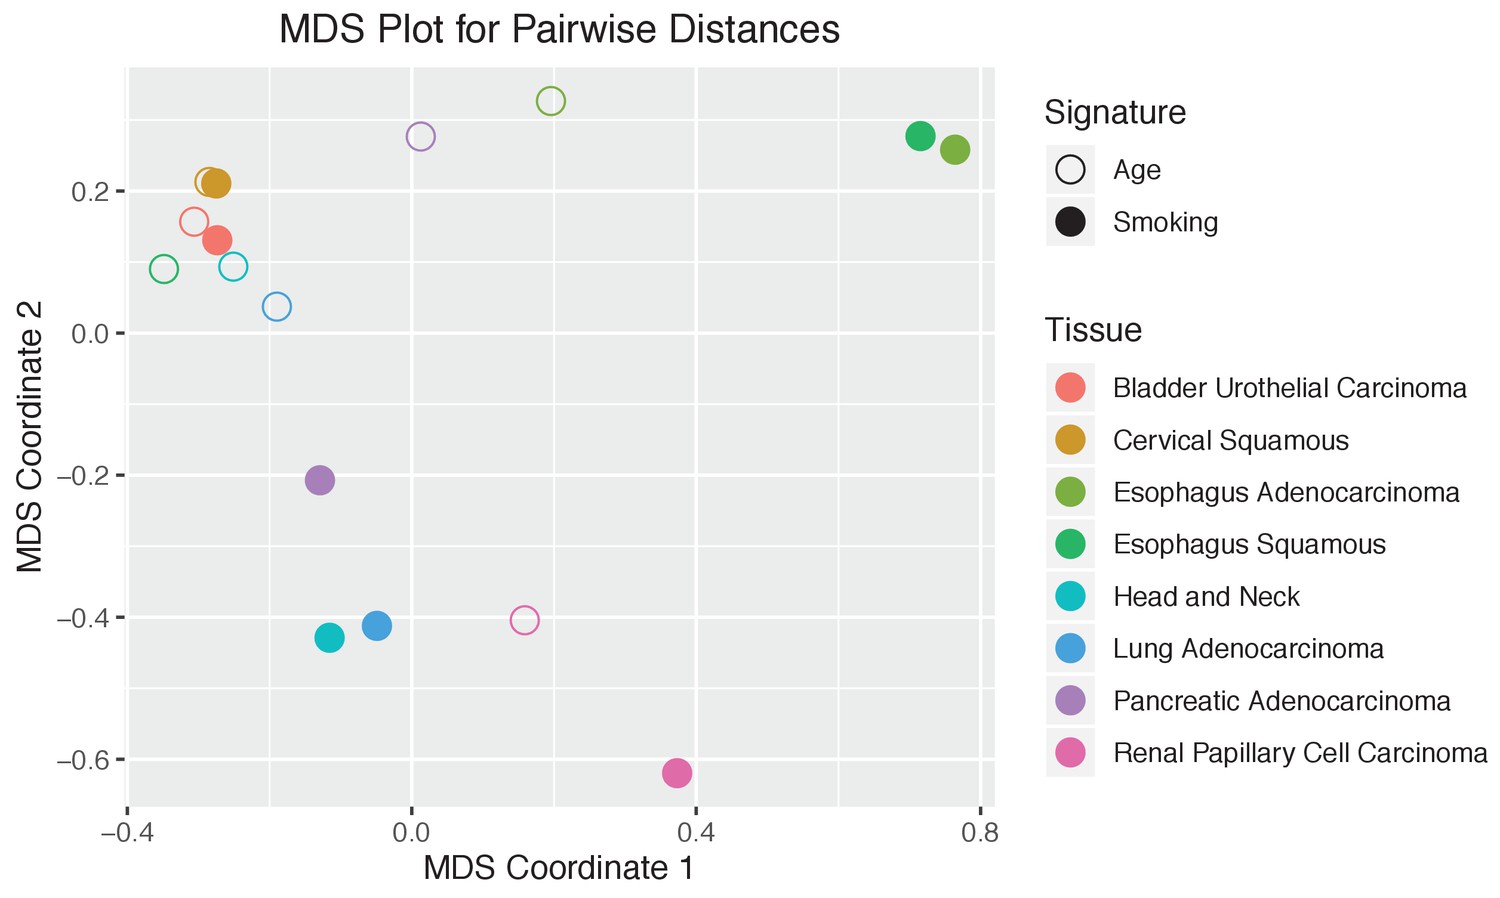
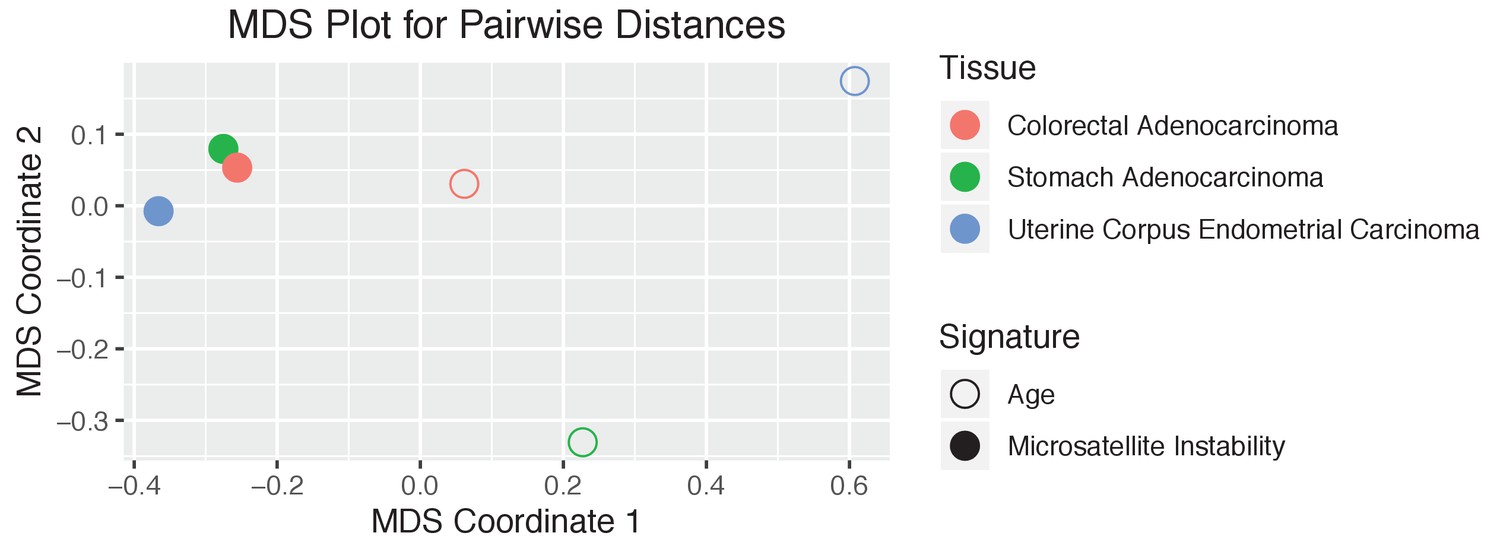
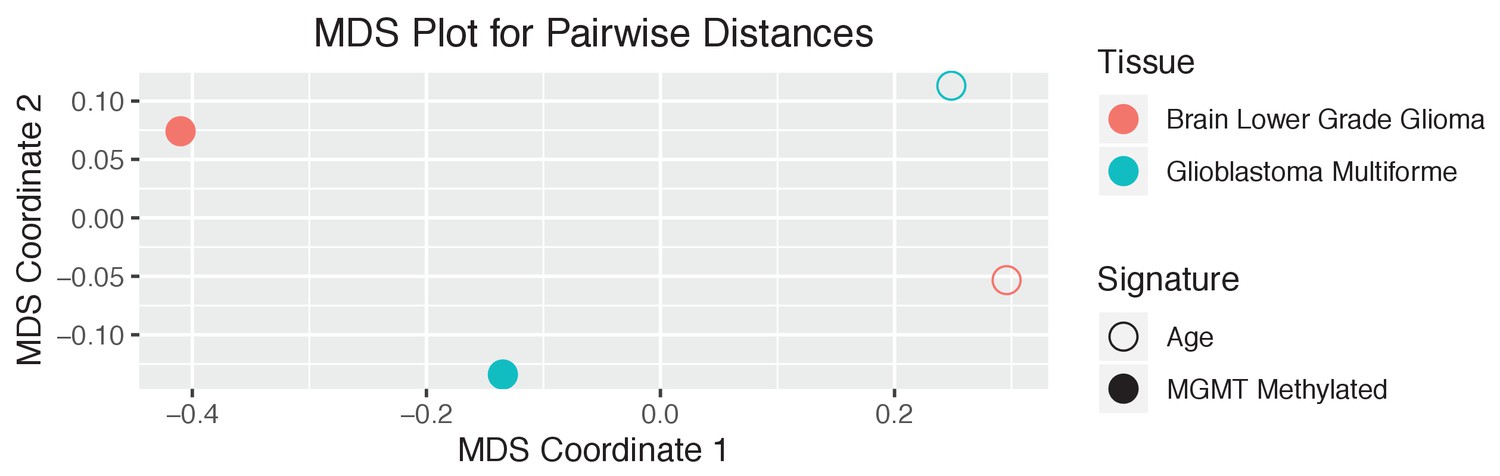
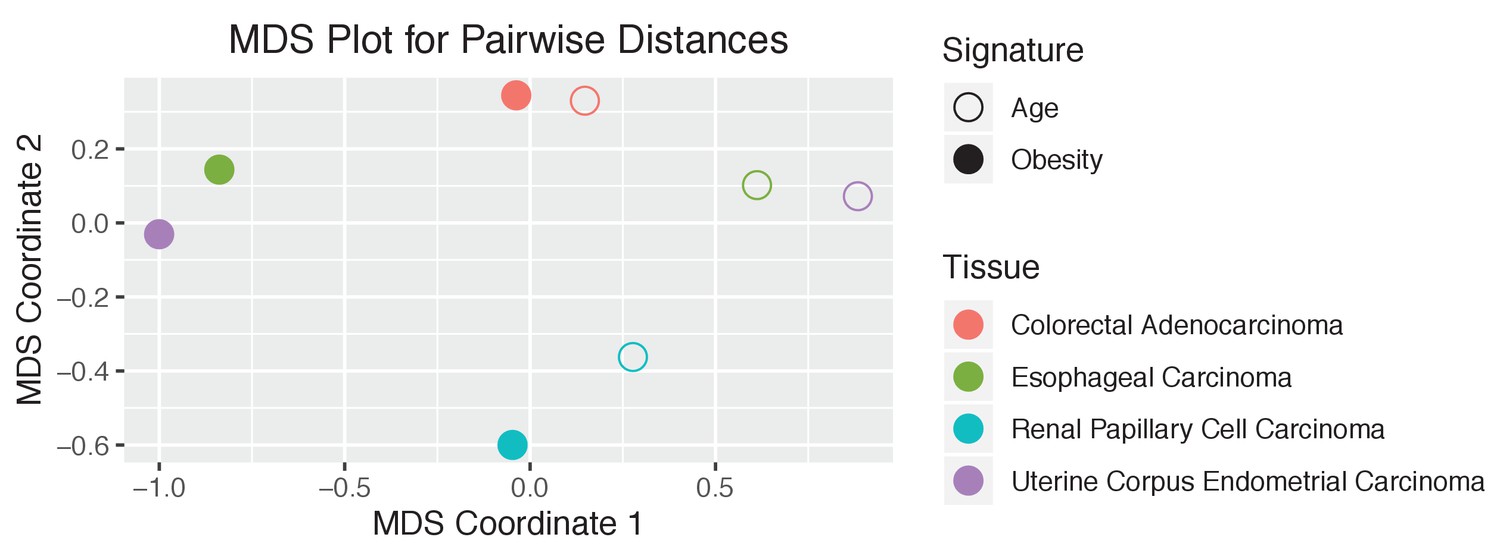
Multidimensional Scaling (MDS) plot of indicated etiological factors’ mutational landscapes in the corresponding tissues. Not discounted for age. See Materials and method section for details.
Figure 3—figure supplement 5
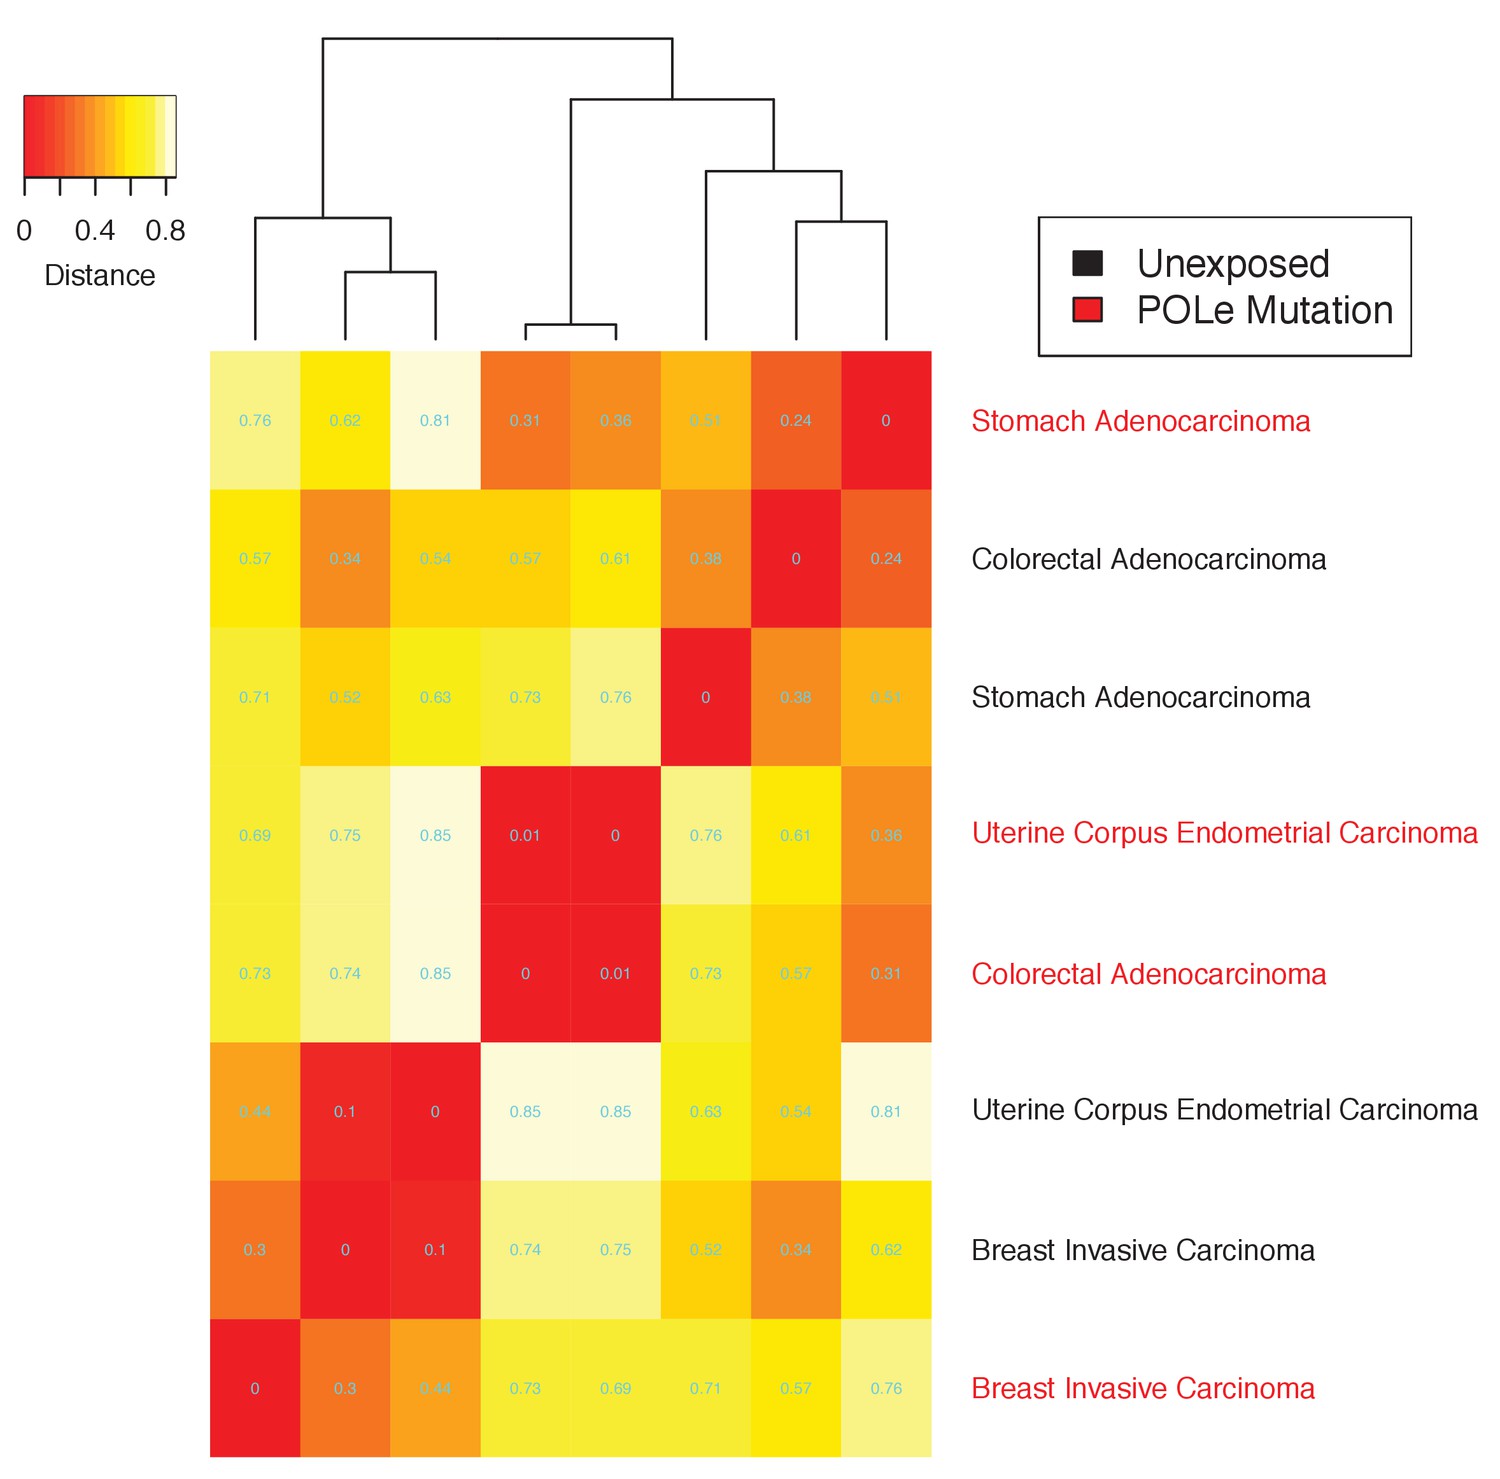
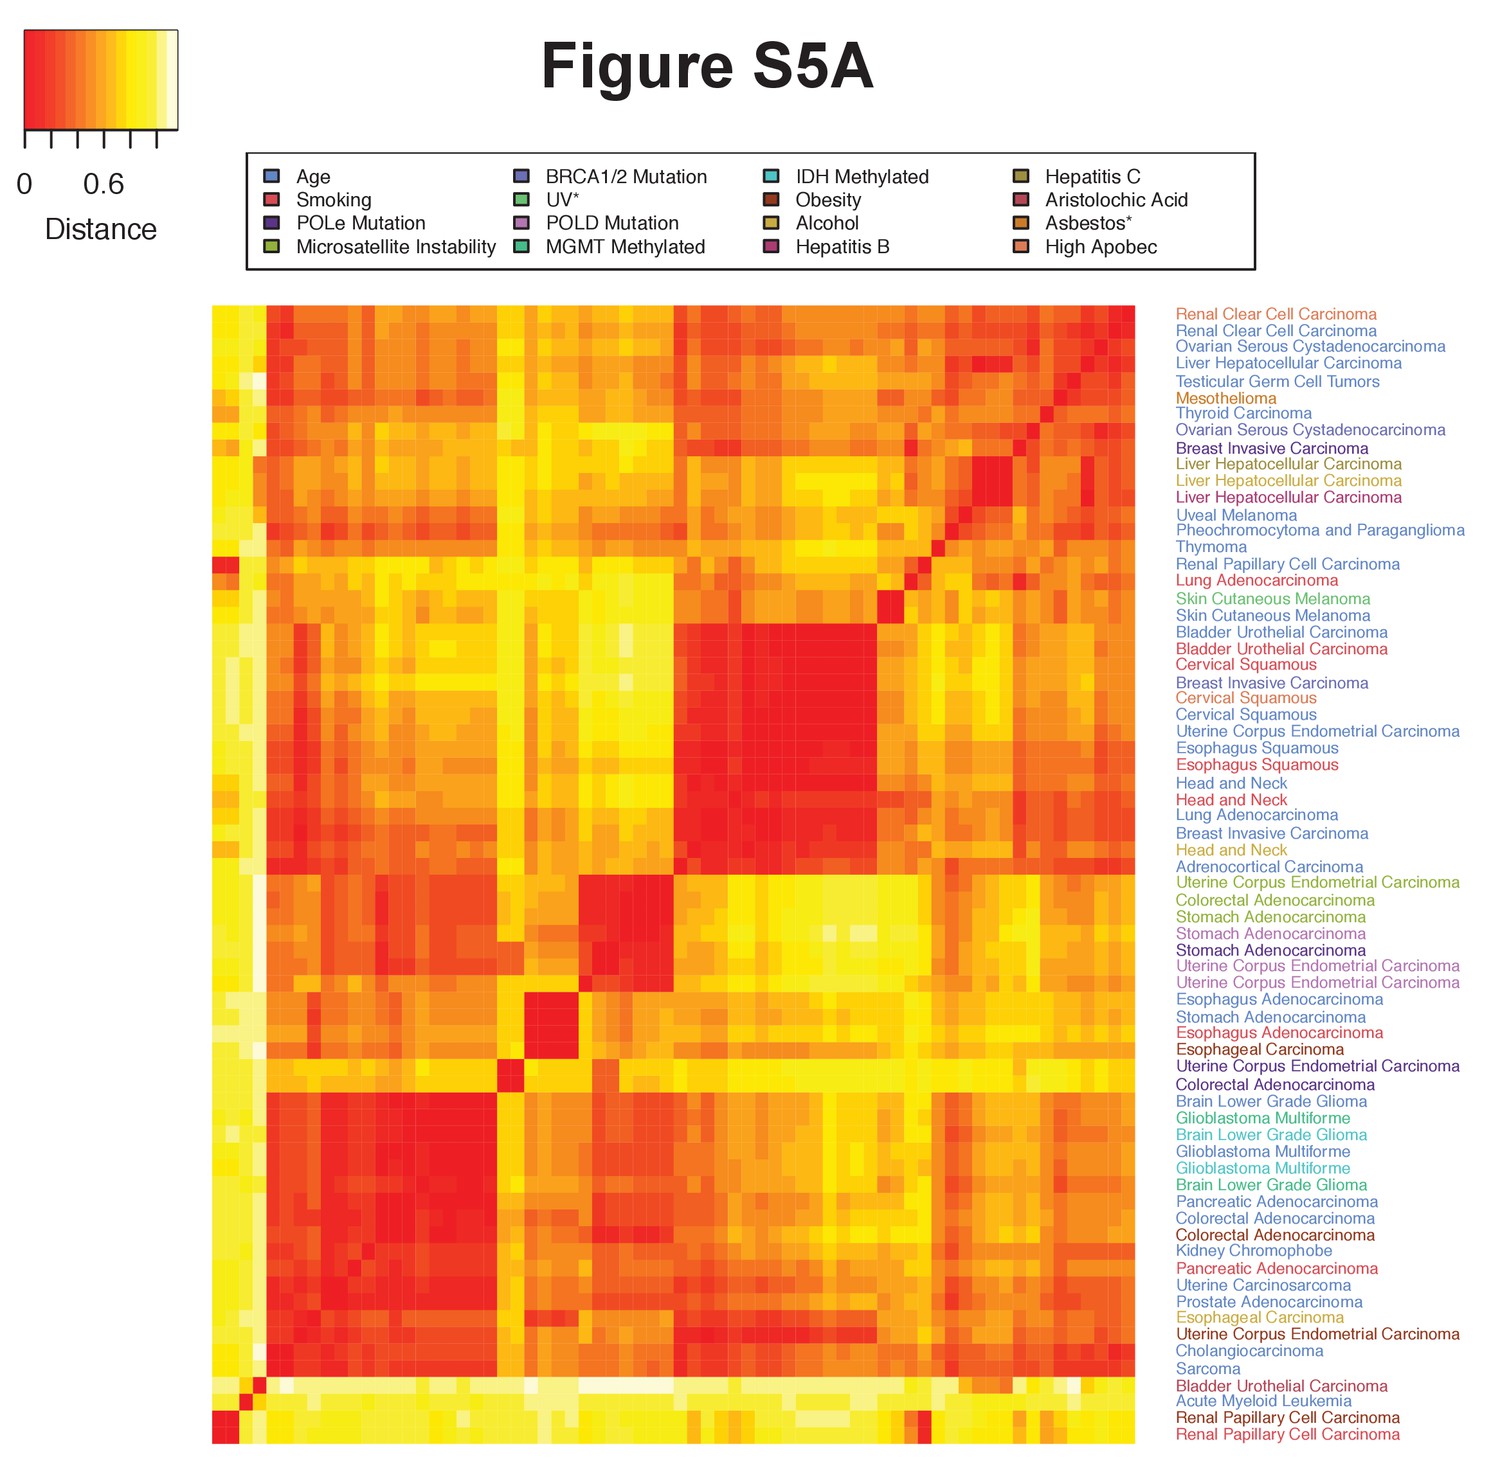
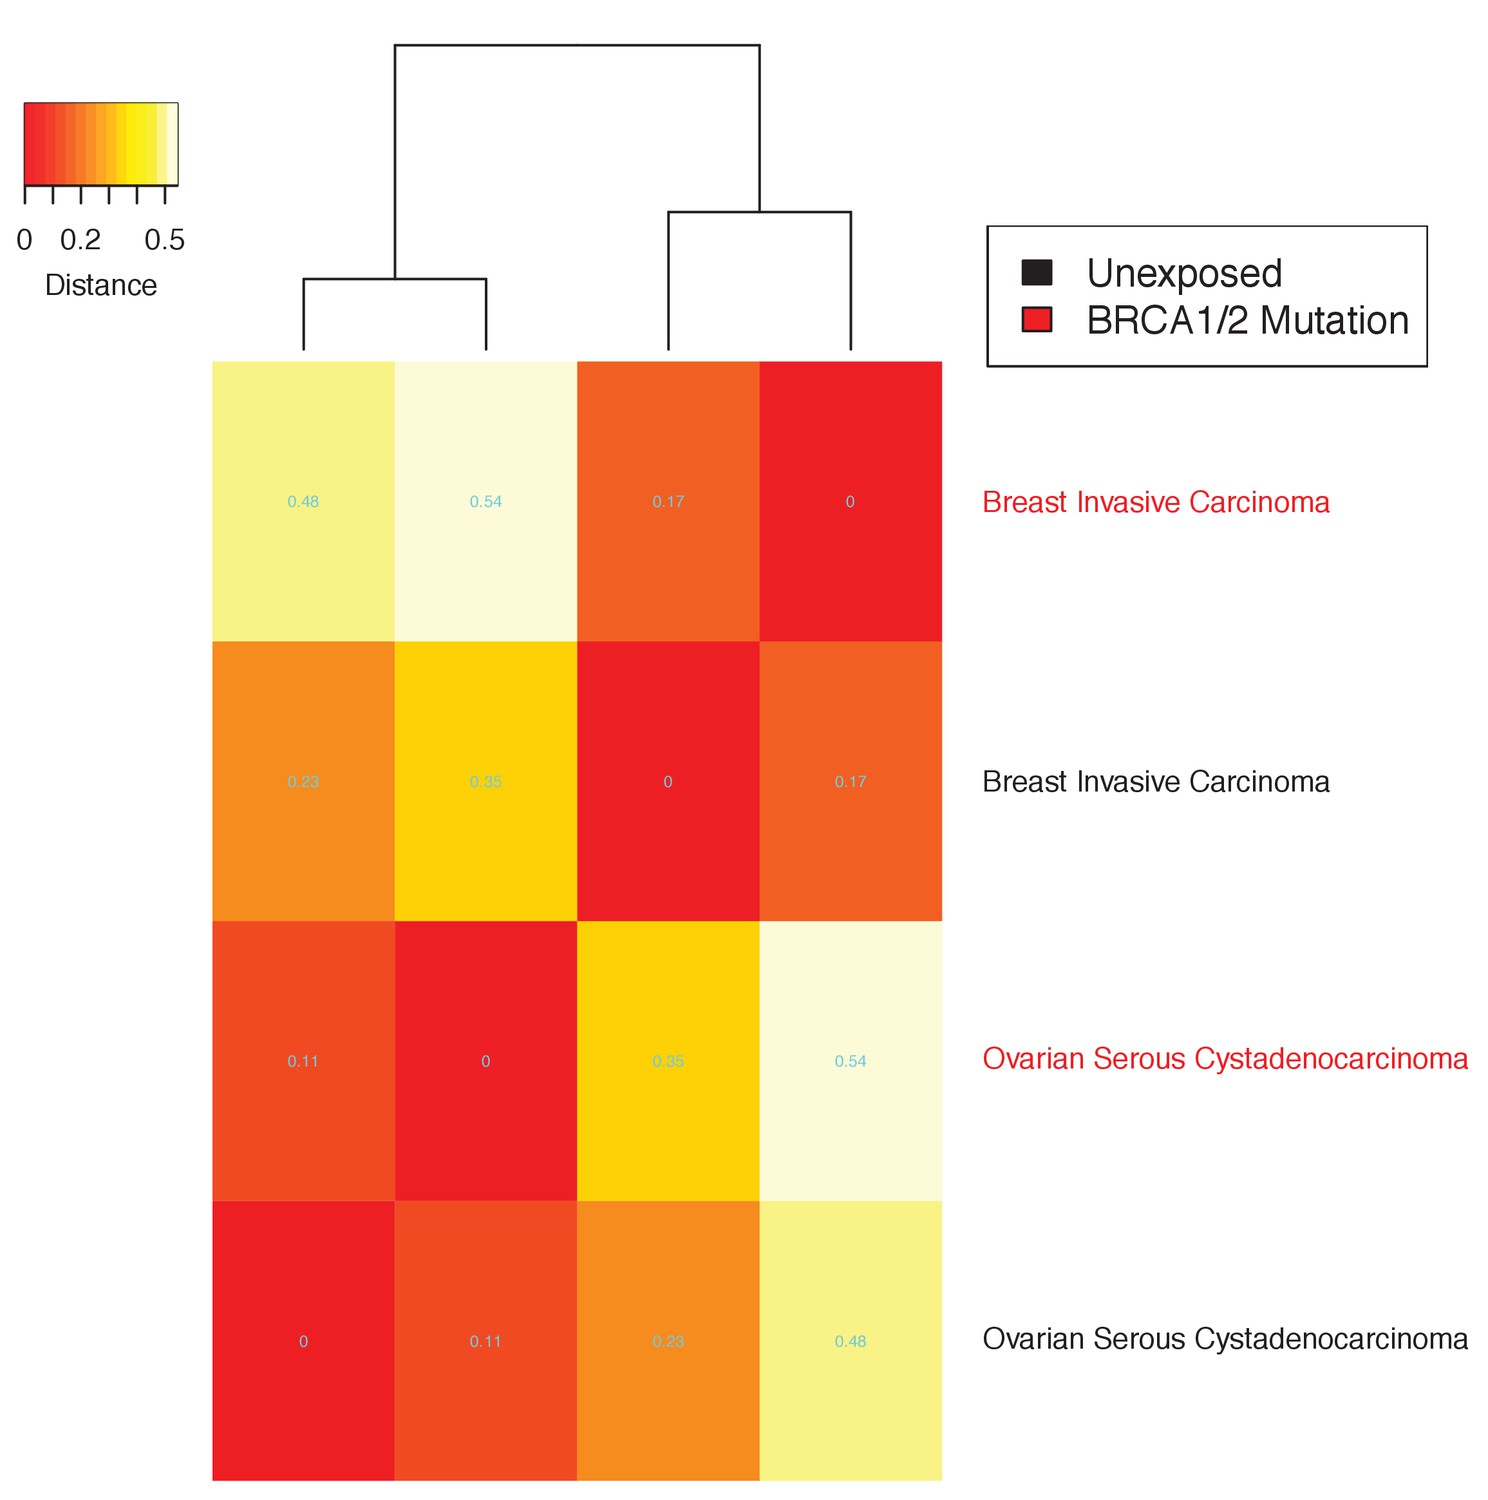
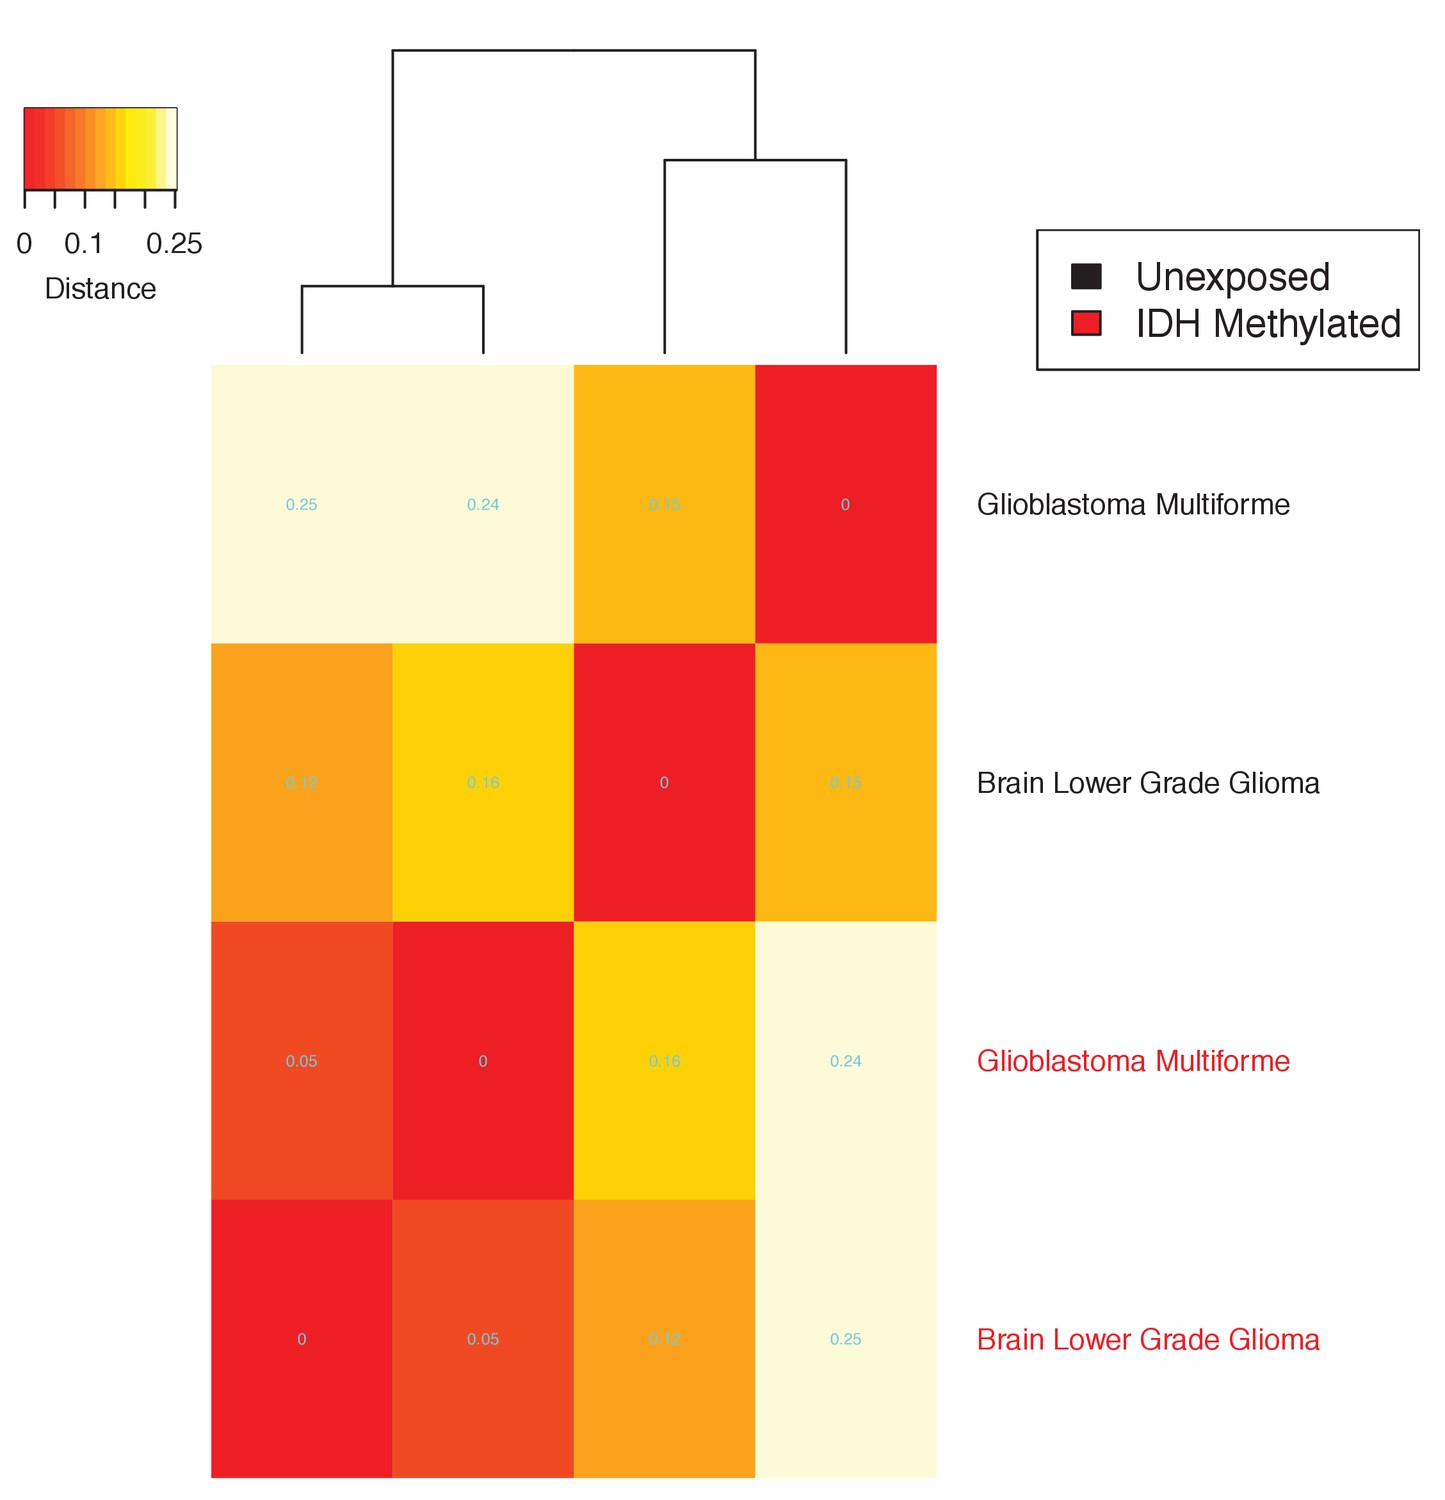
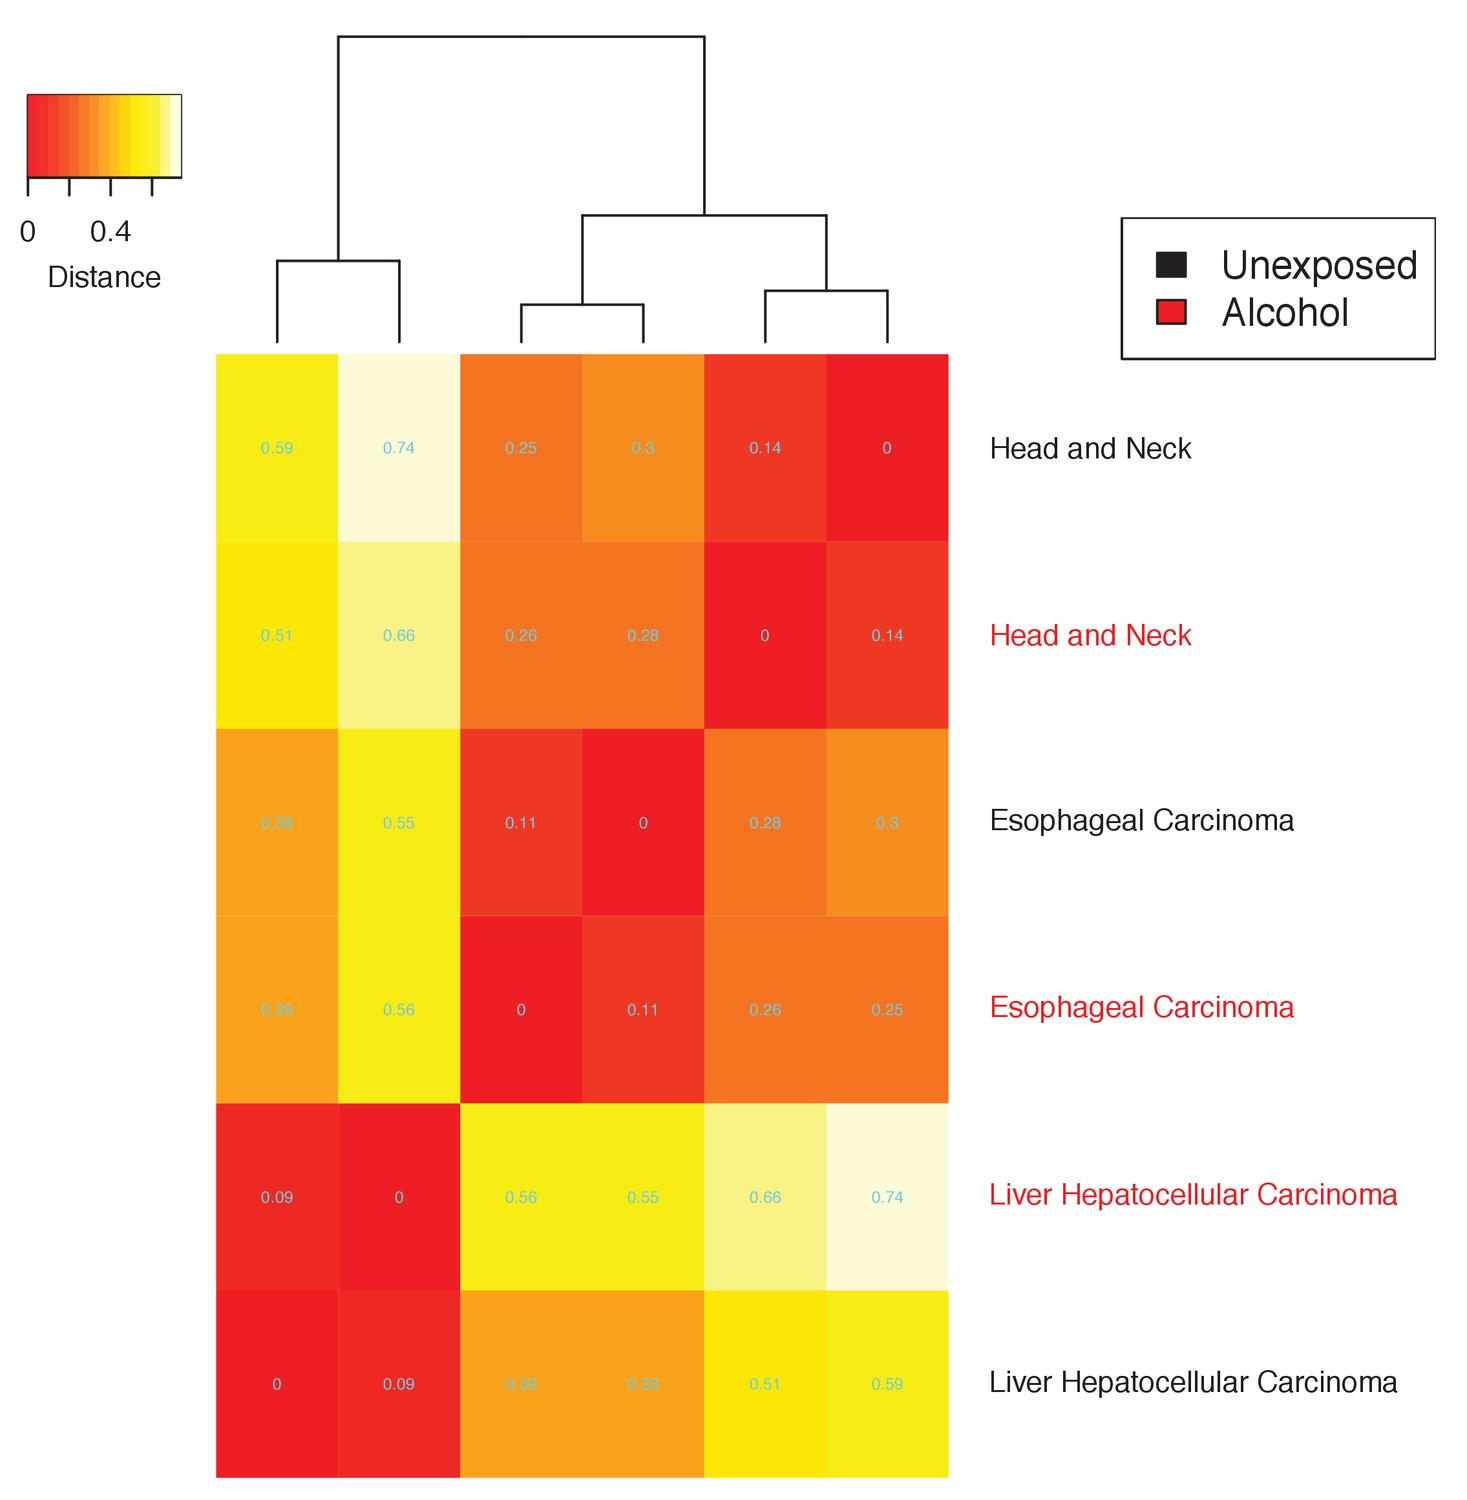
The tissue dependence of the mutational signatures.
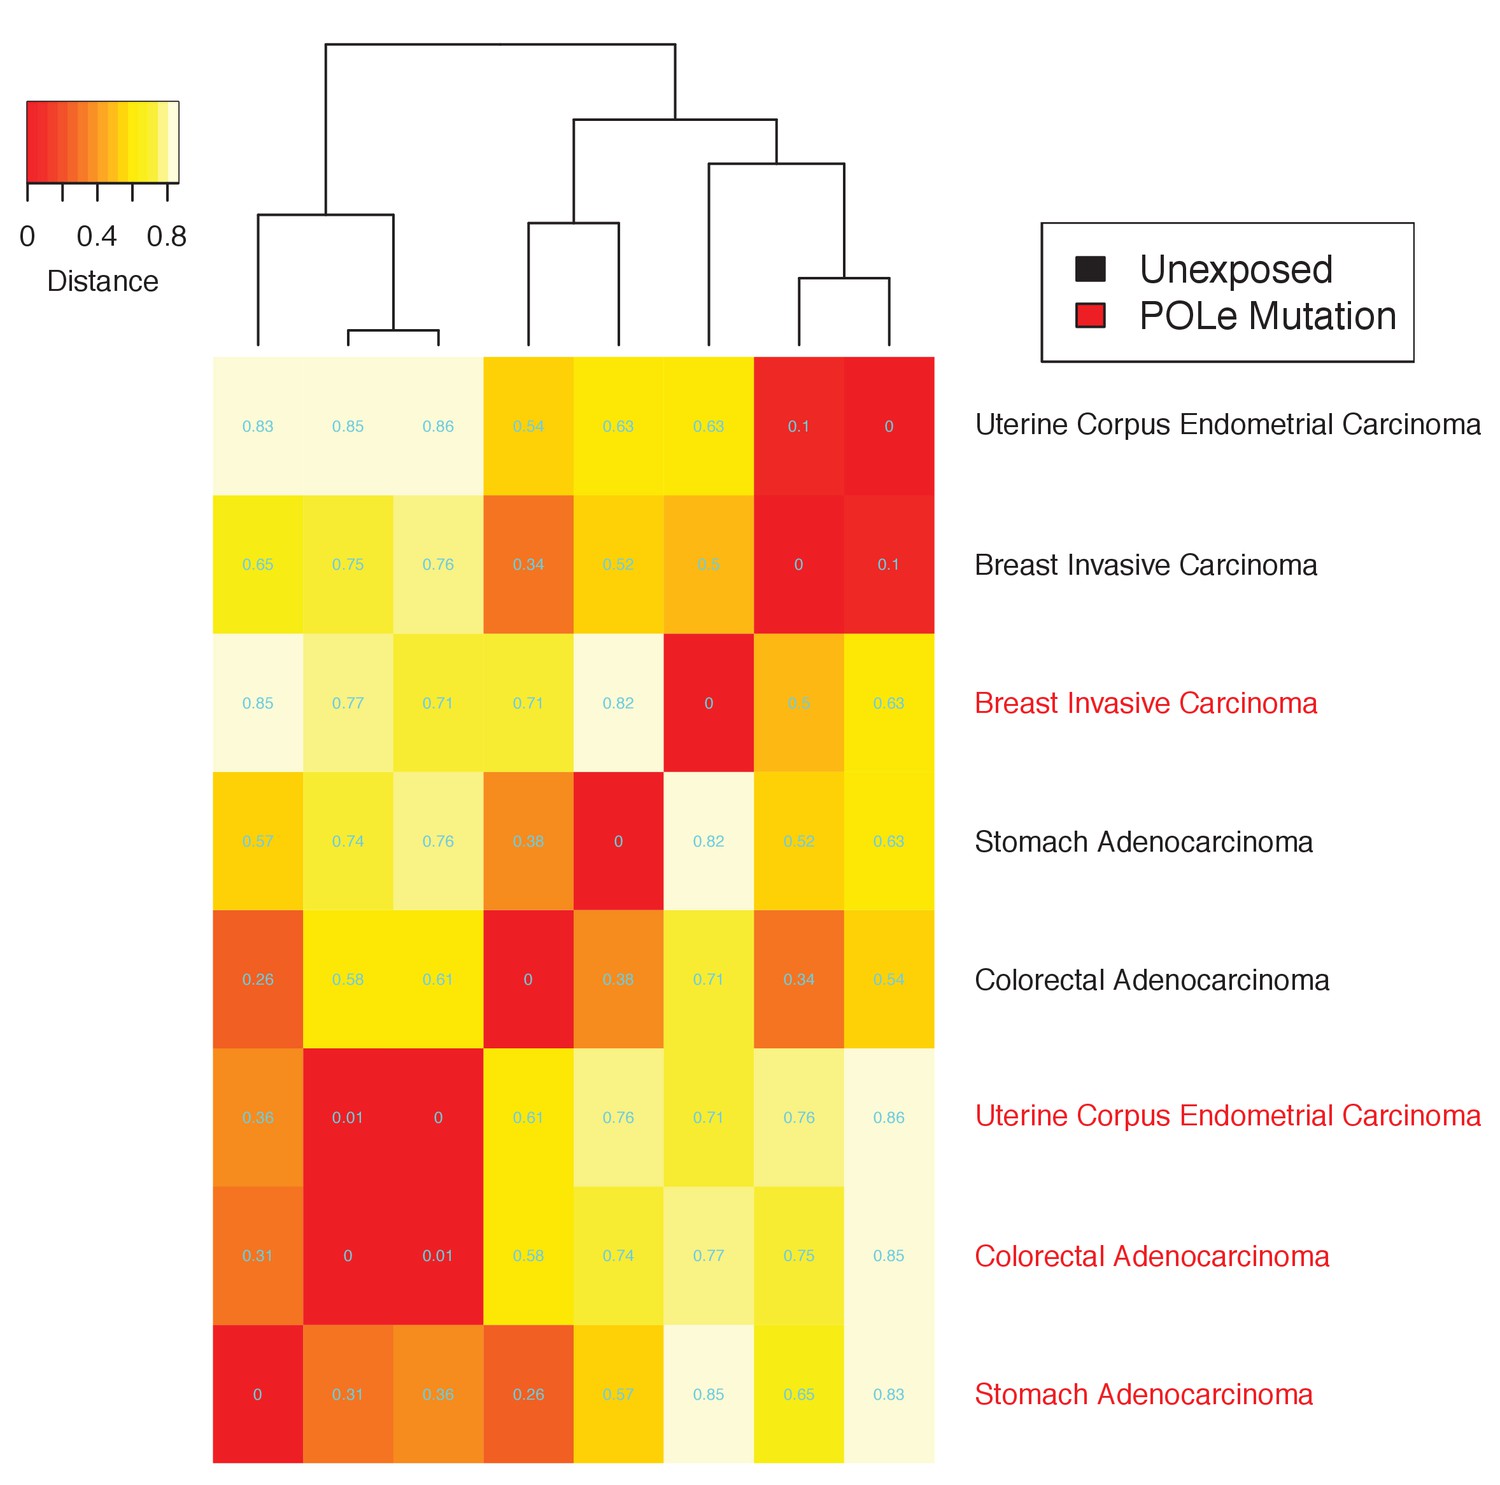
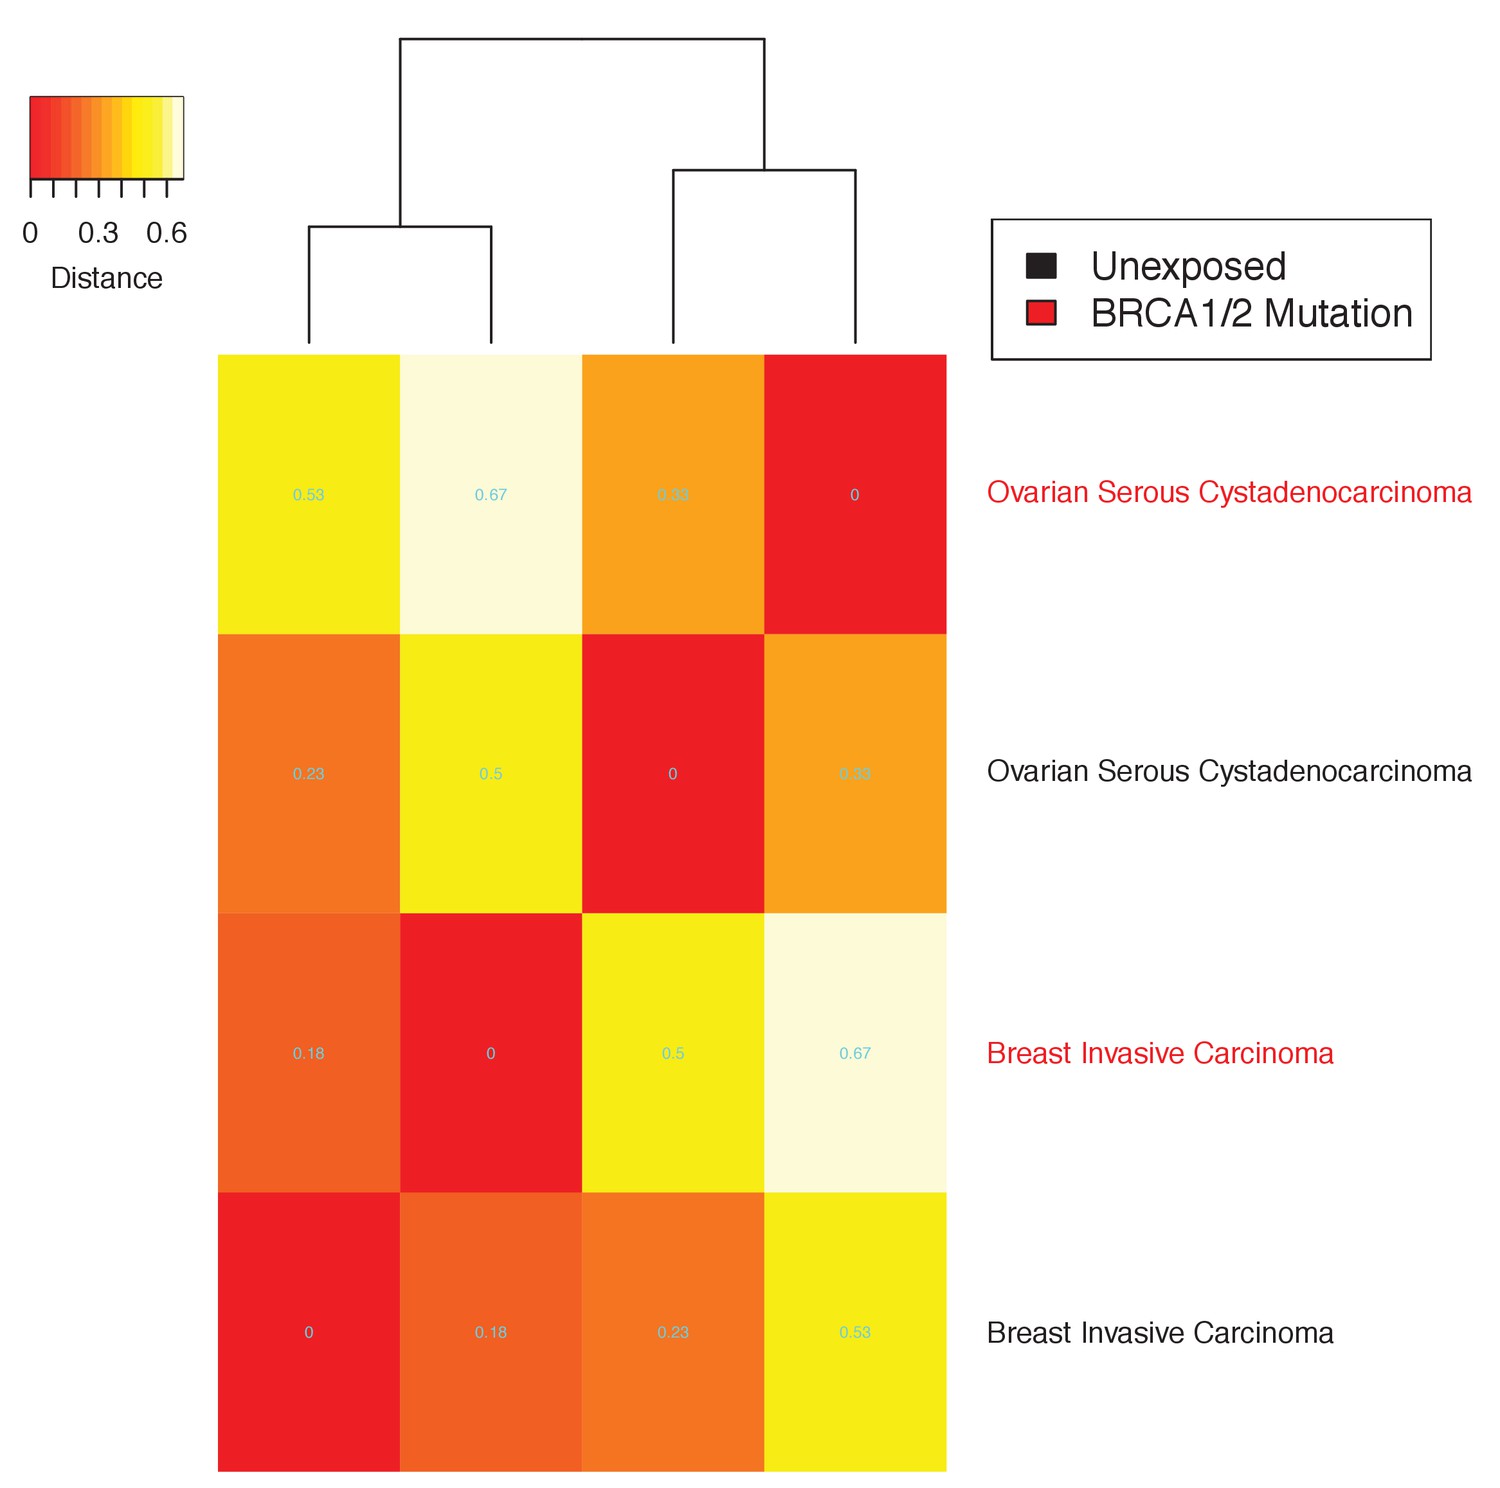
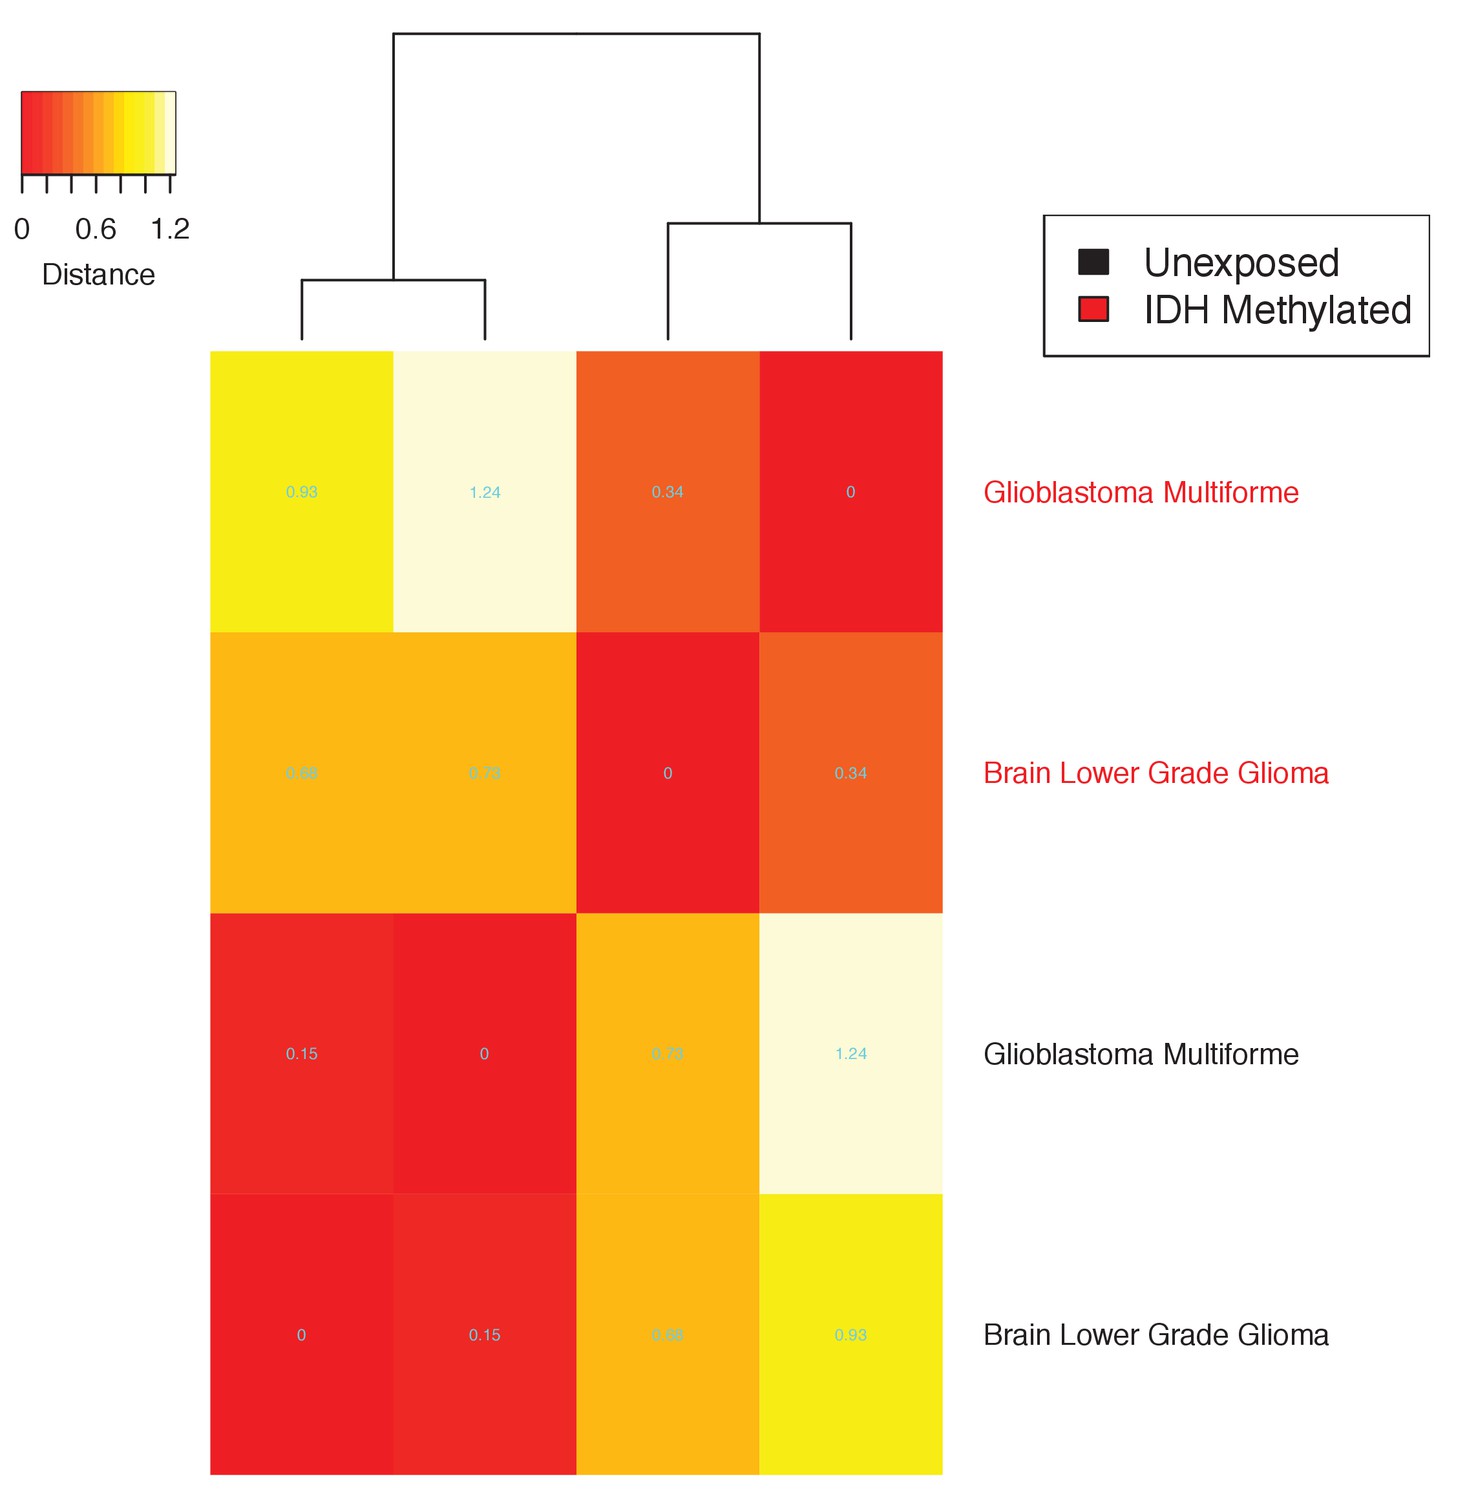
Heatmap of the distance, in terms of correlation, between any two etiological factors’ mutational landscapes in the corresponding tissues. Distance not discounted for age. The distance between any two mutational landscapes is given by 1- the Pearson’s correlation between the two mutational landscapes. See Materials and method section for details.
Figure 3—figure supplement 6
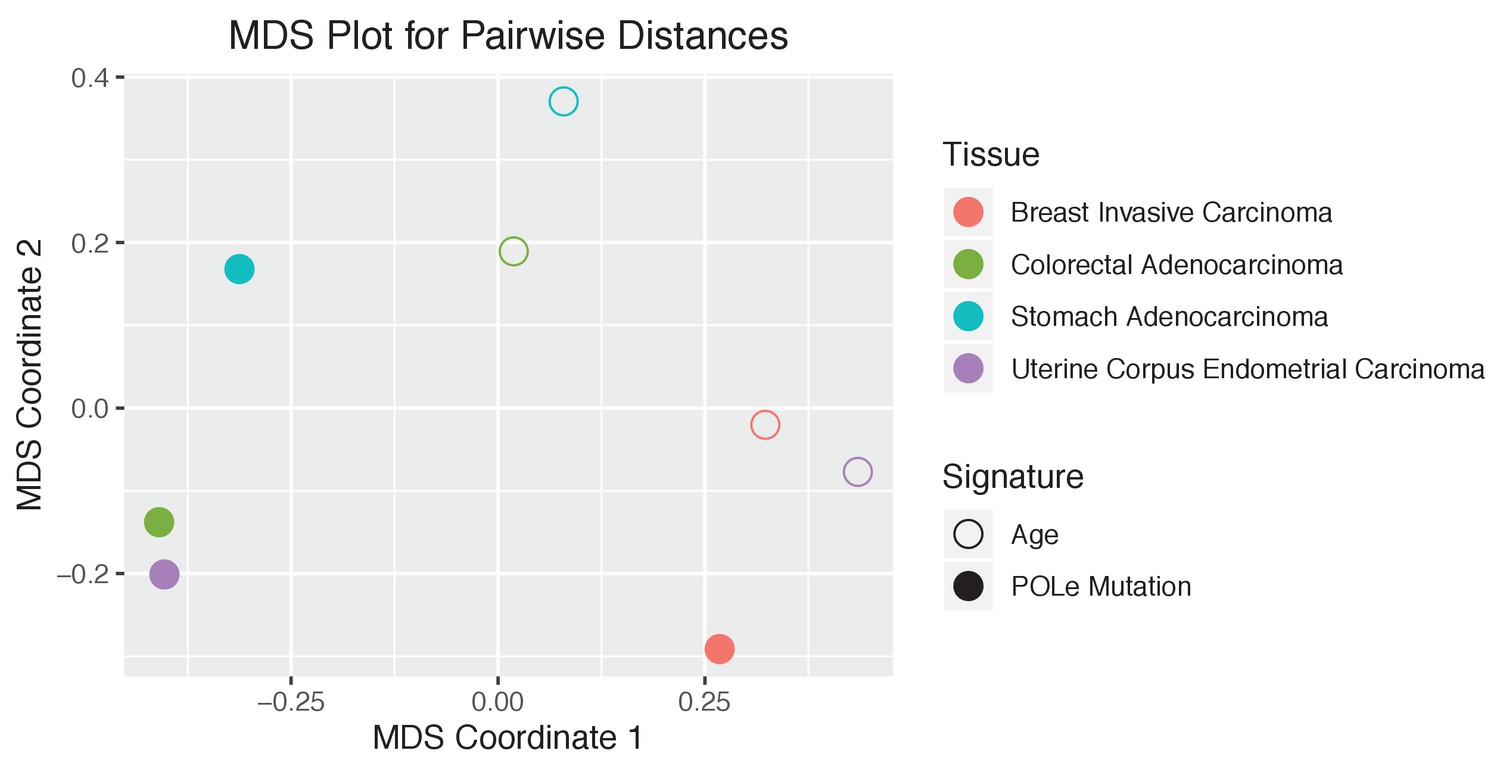
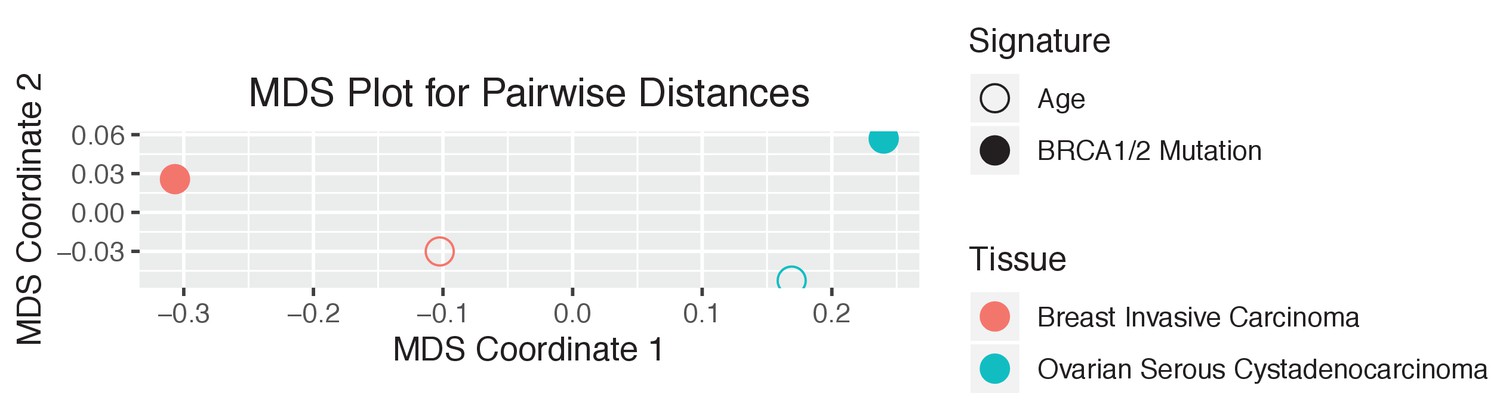
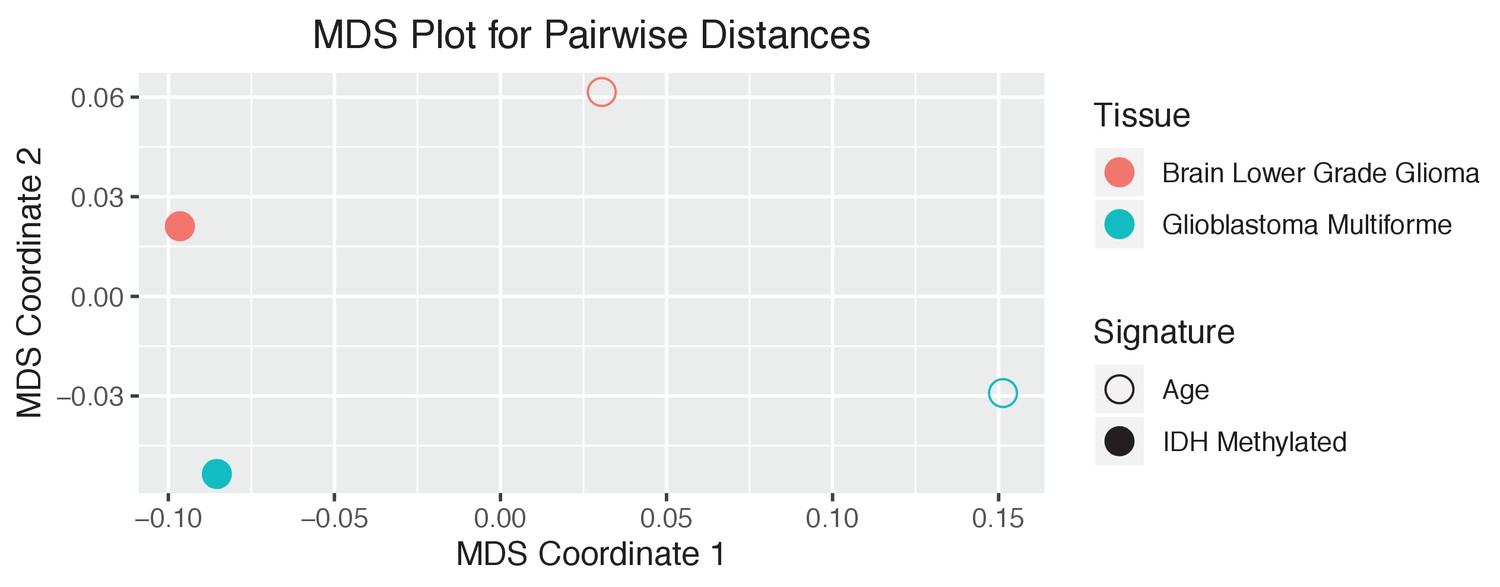
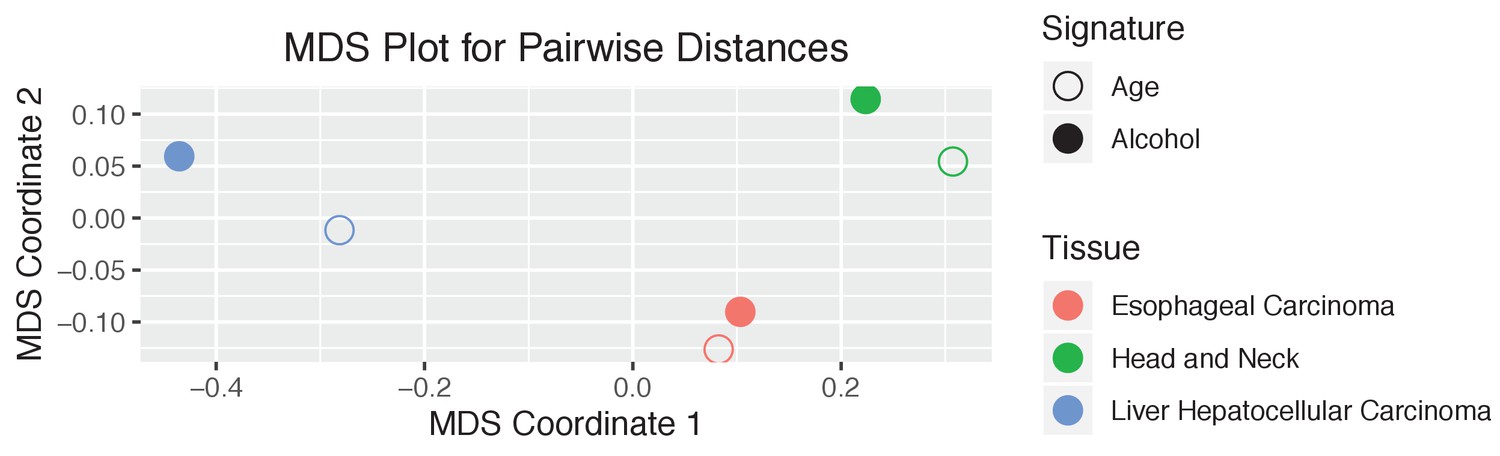
The tissue dependence of the mutational signatures.
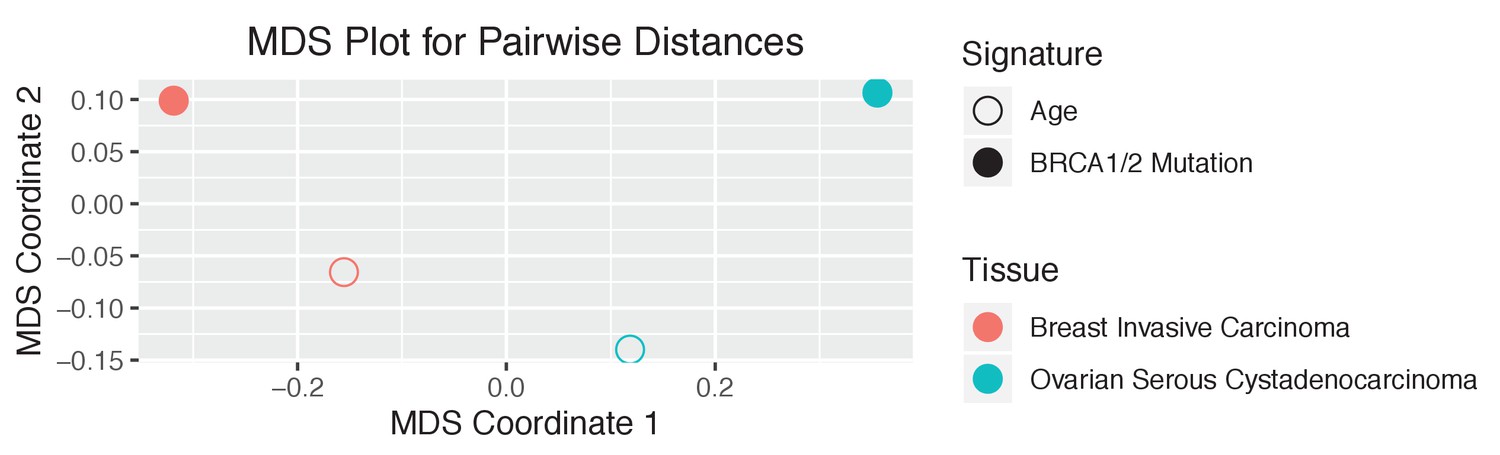
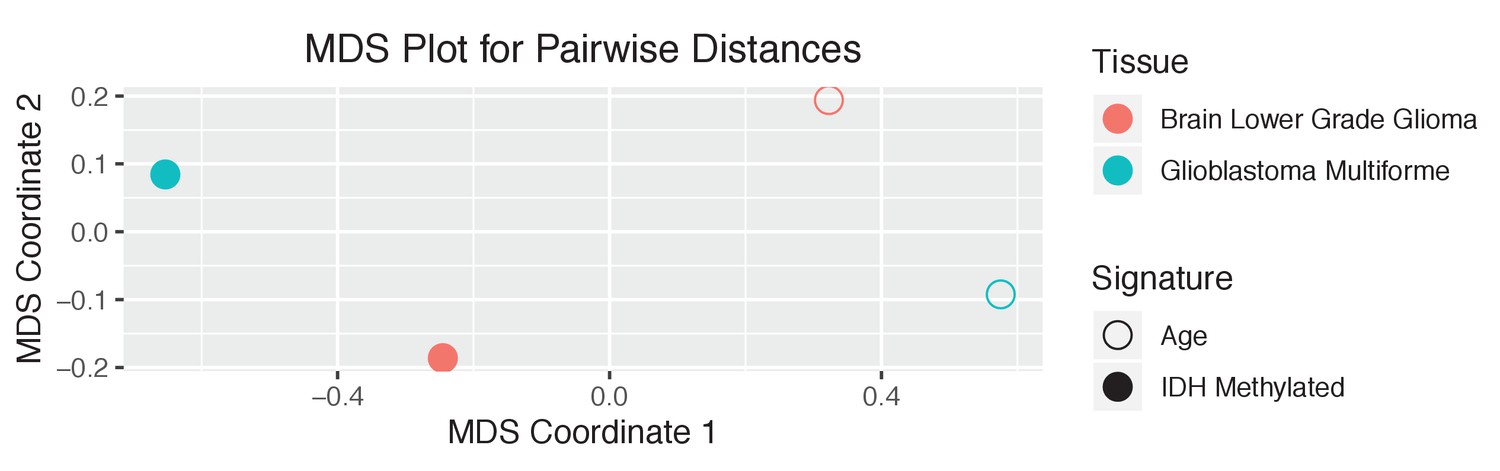
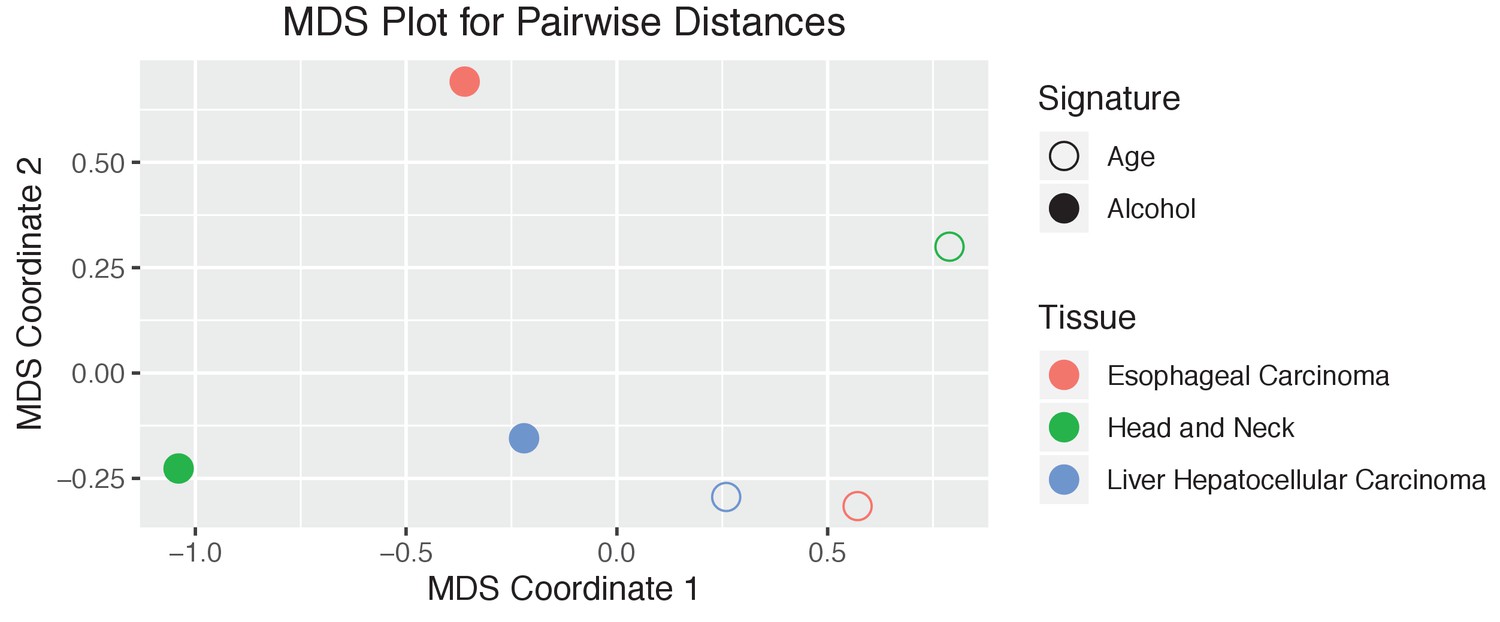
Multidimensional Scaling (MDS) plot of indicated etiological factors’ mutational landscapes in the corresponding tissues. Not discounted for age. See Materials and method section for details.
Figure 3—figure supplement 7
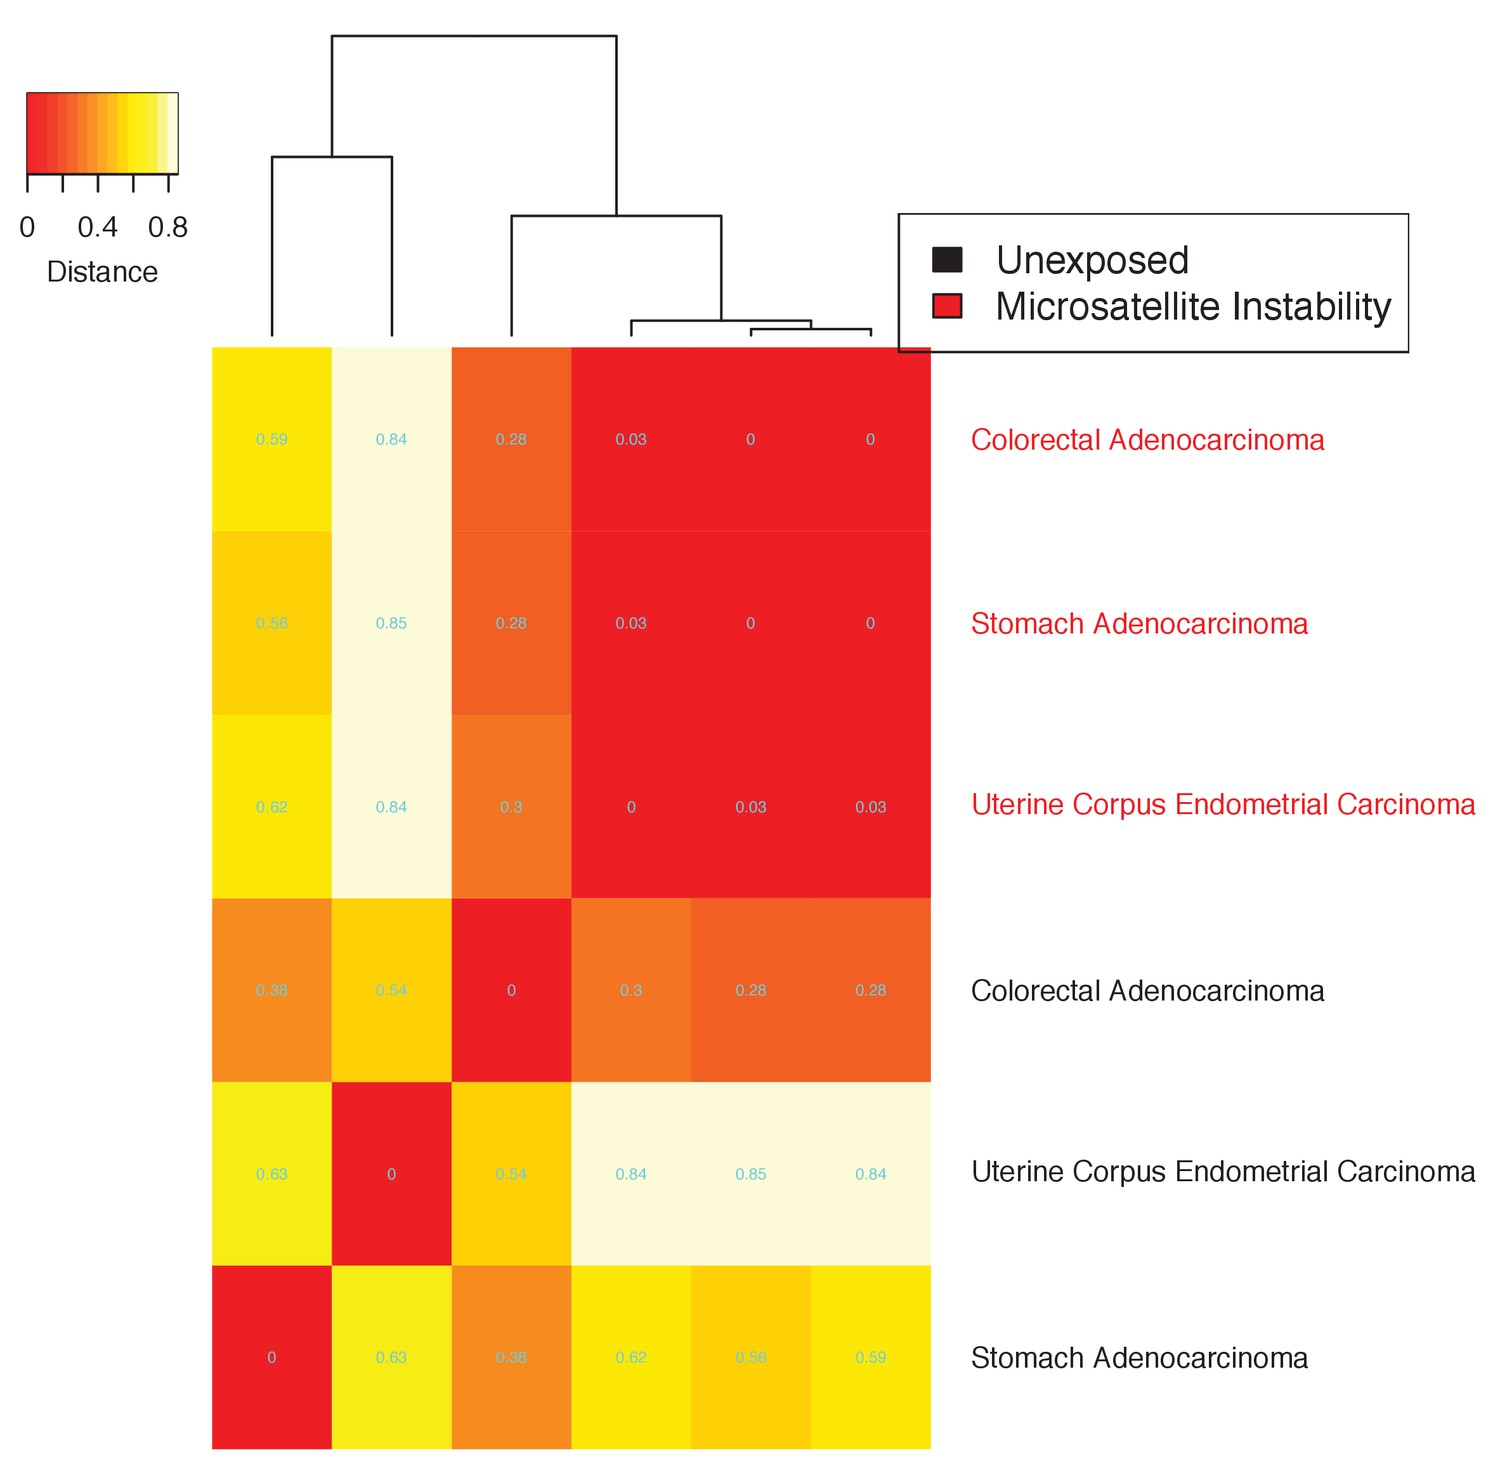
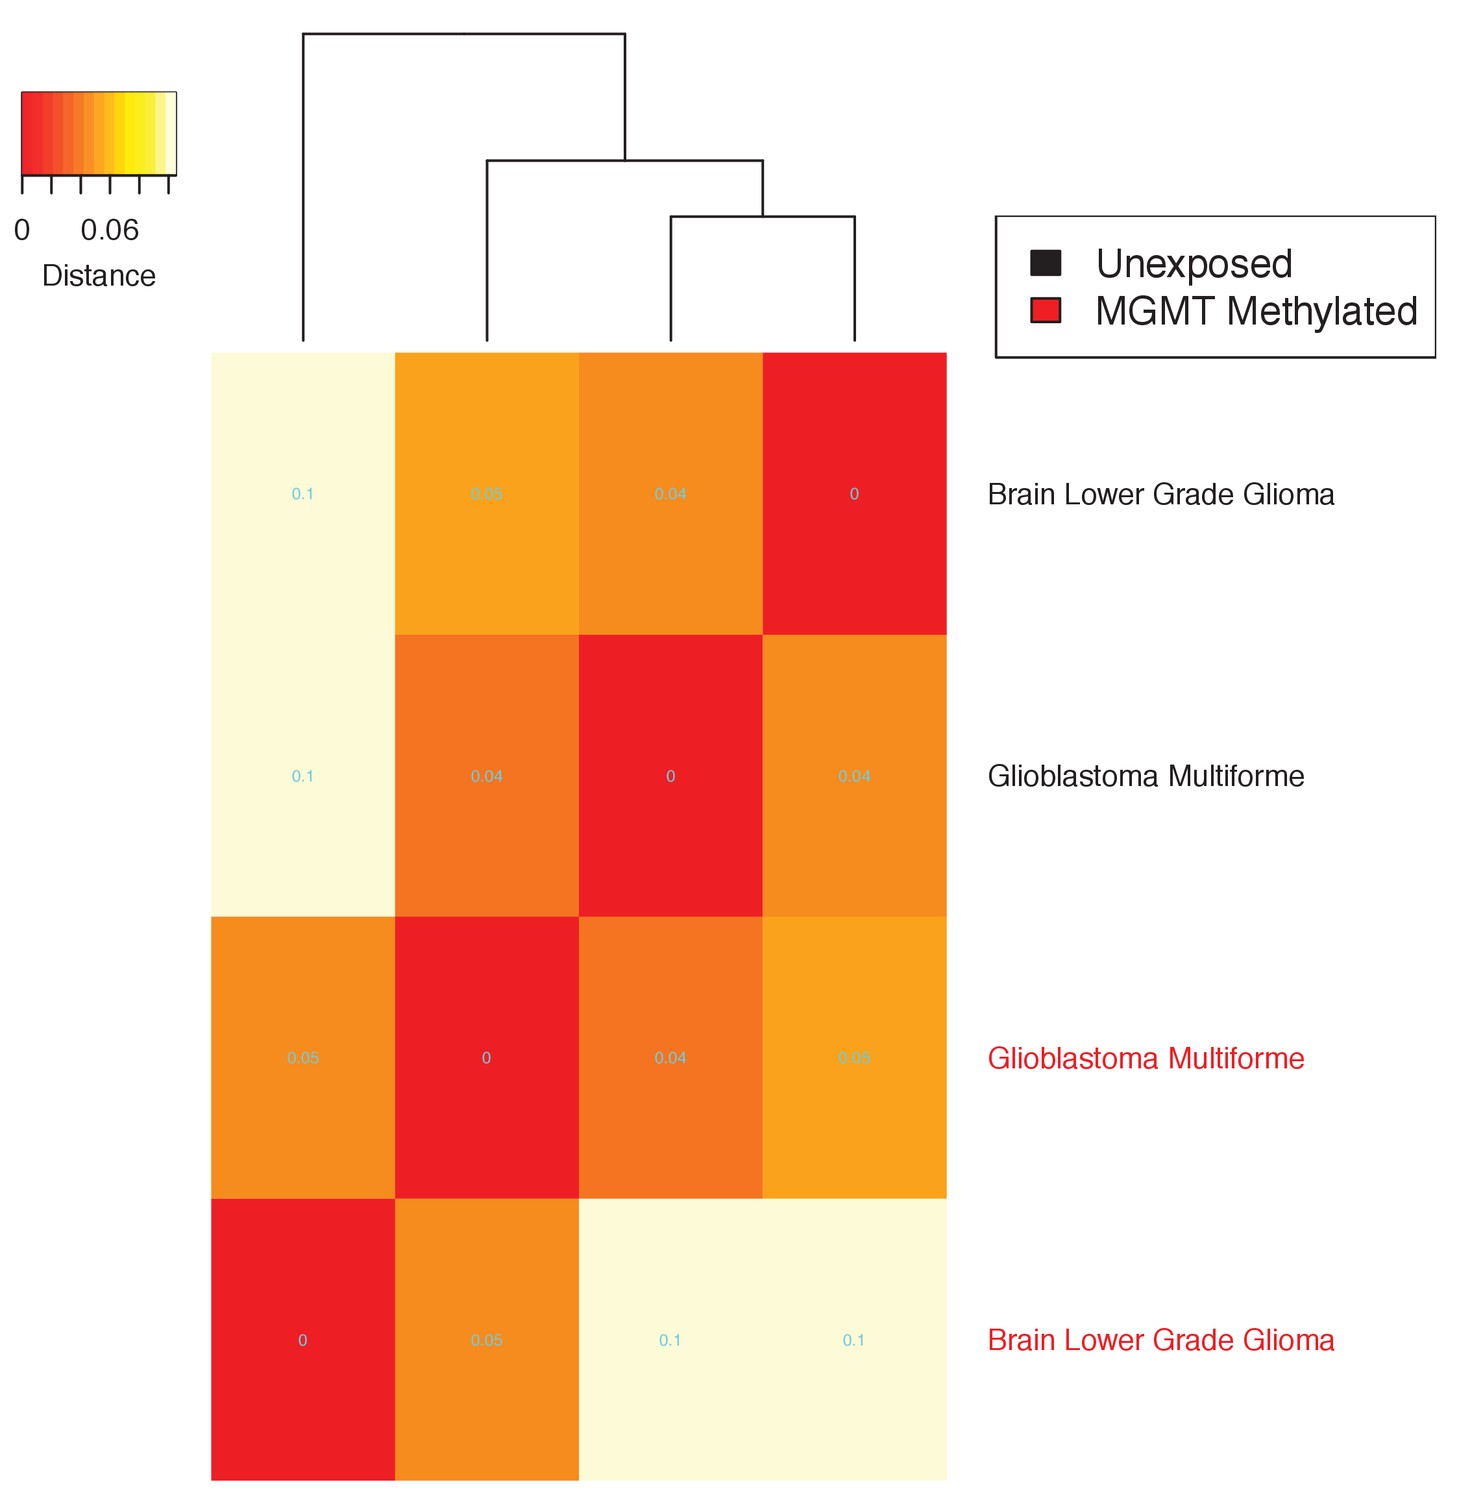
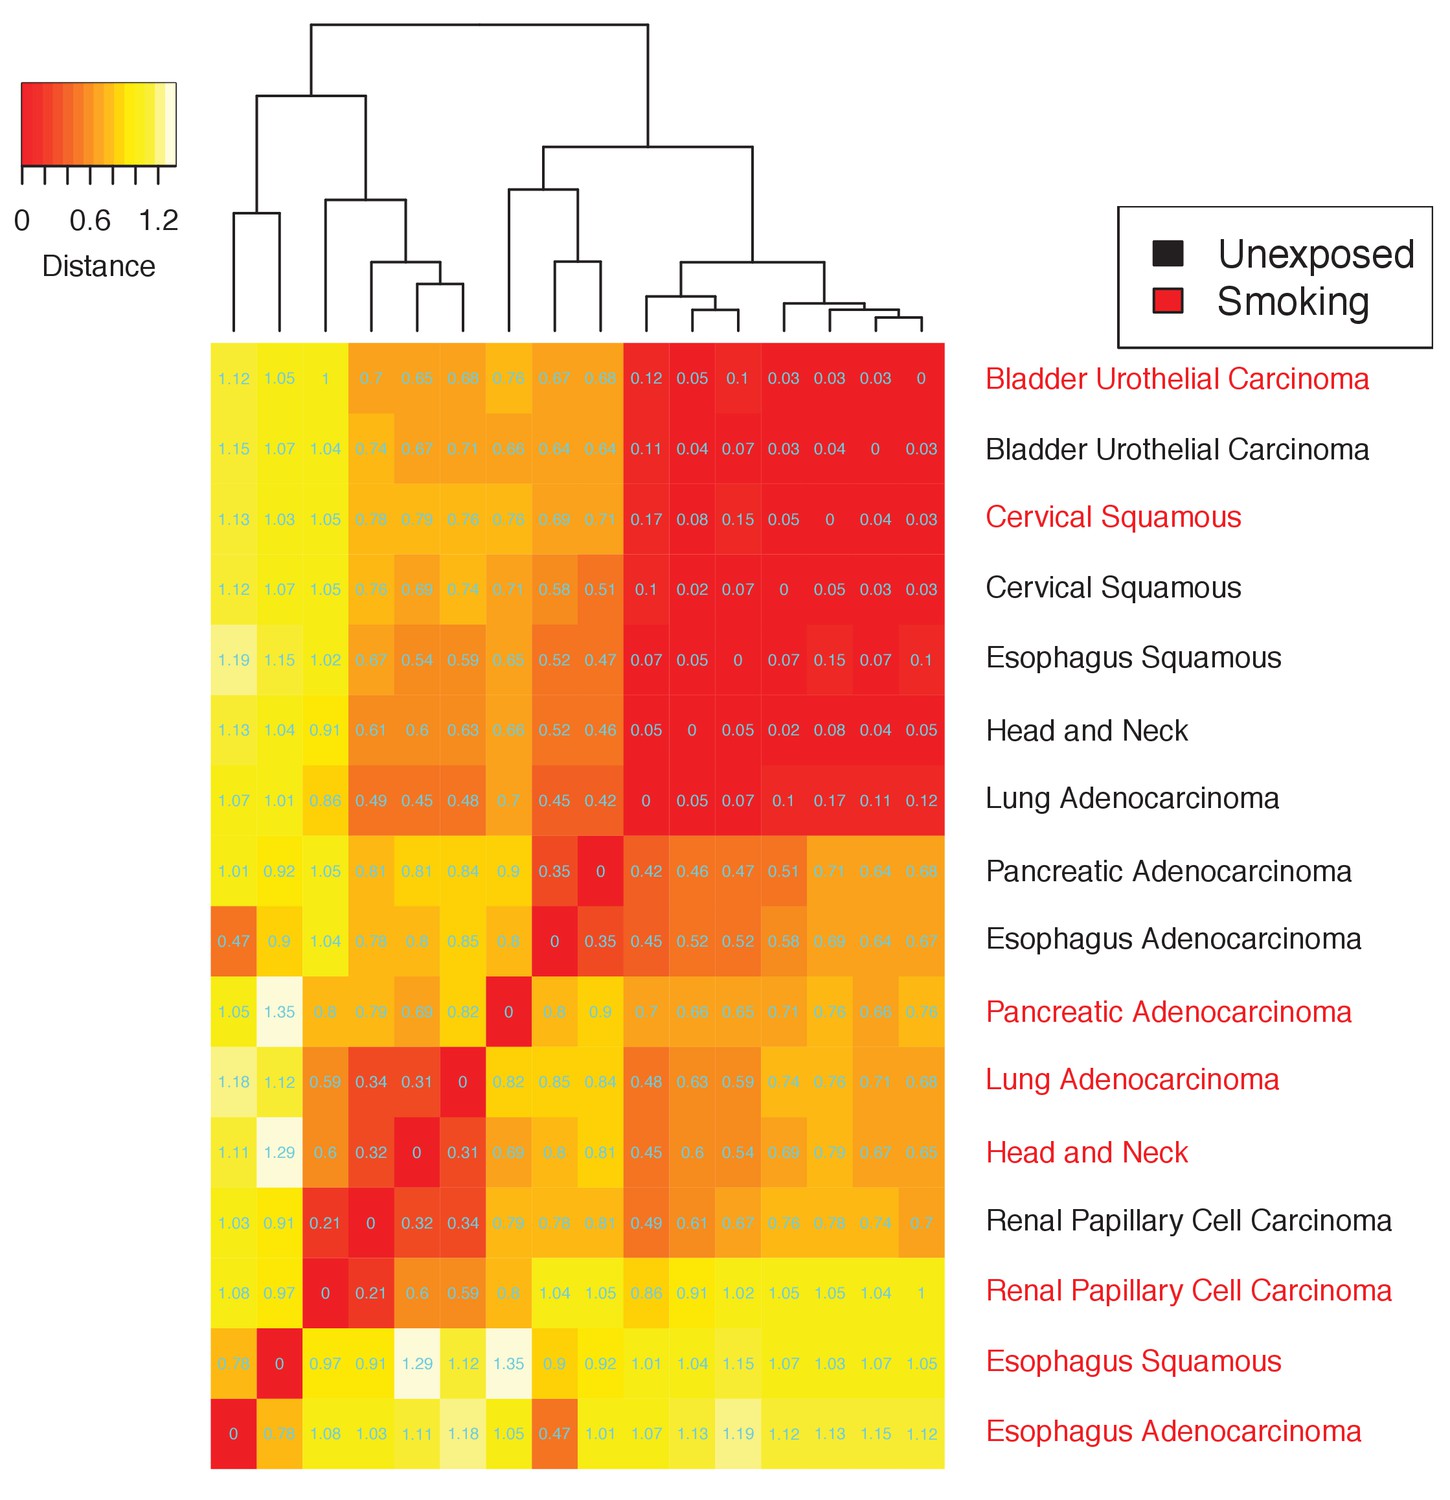
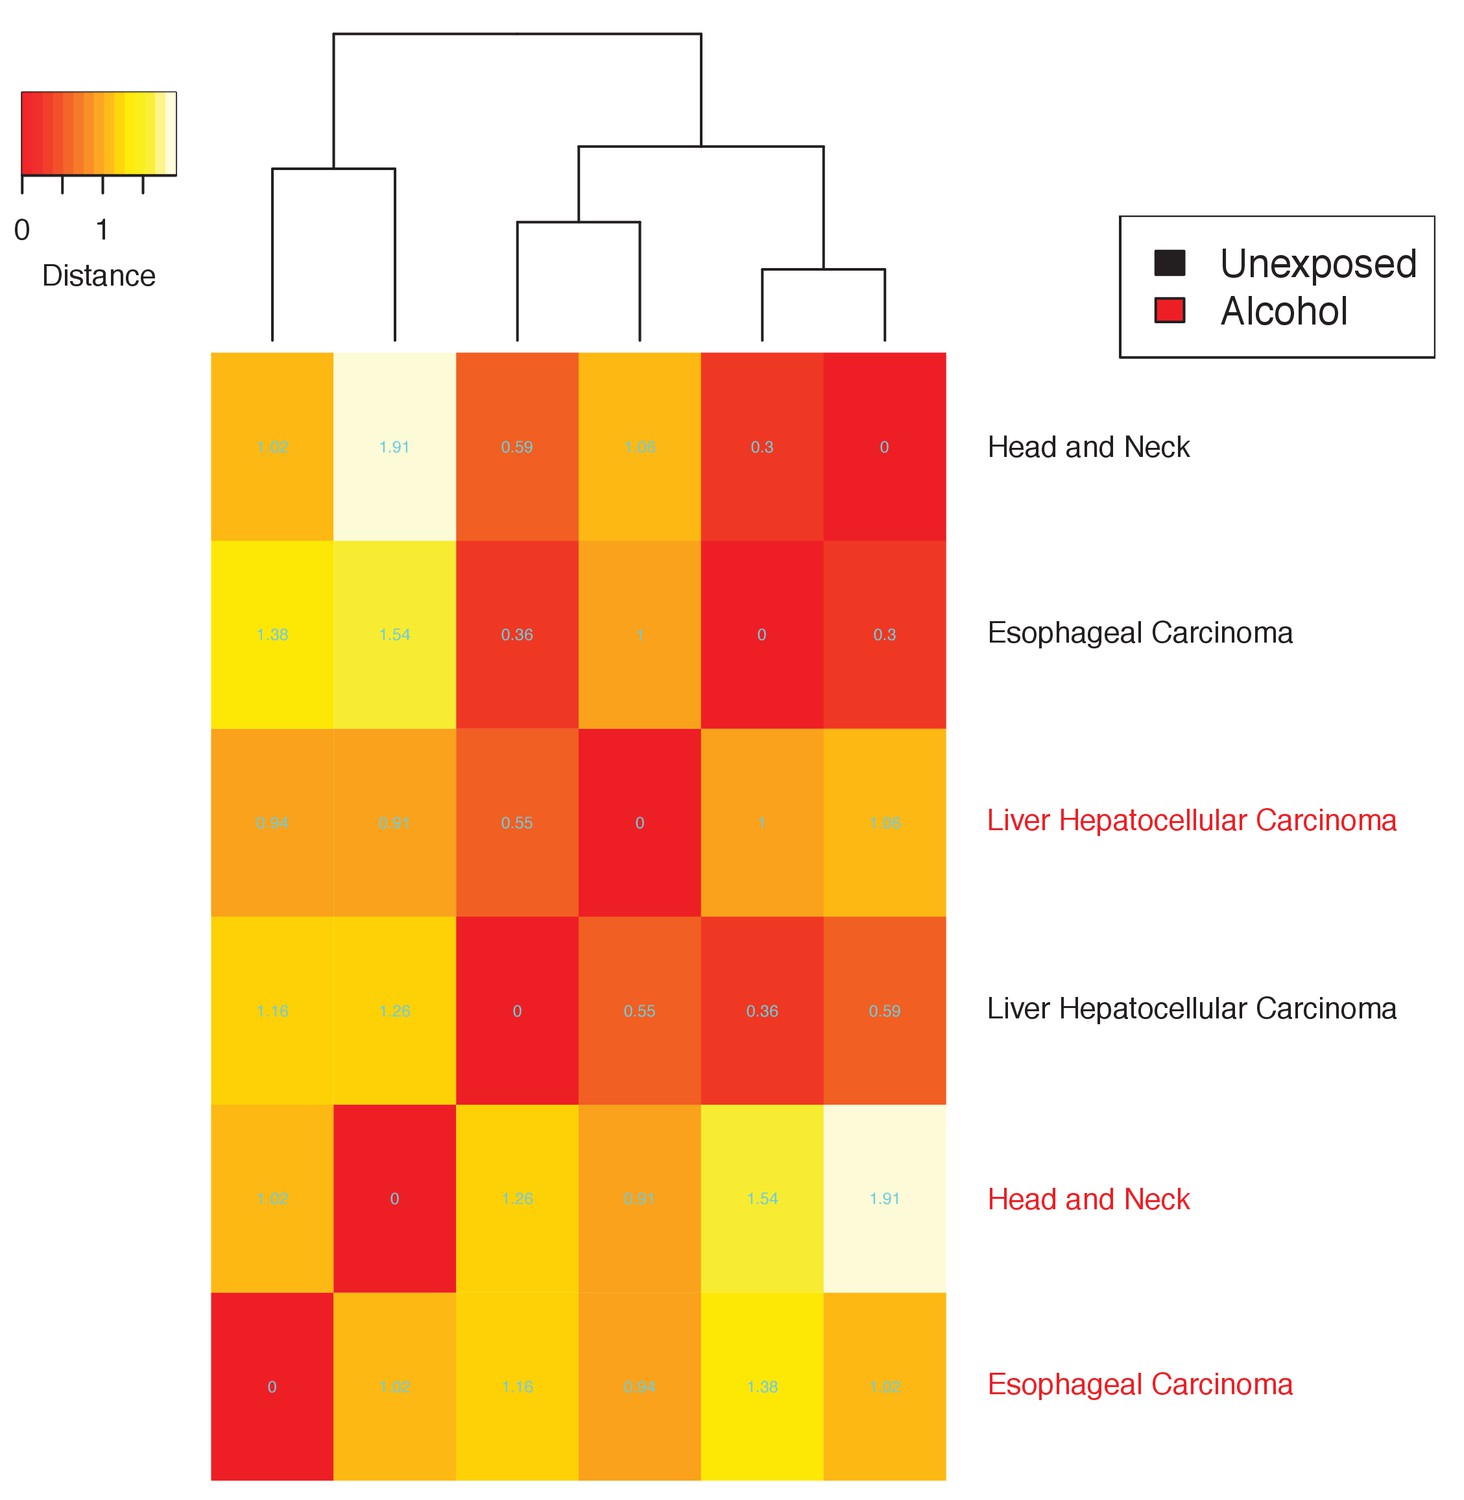
The tissue dependence of the mutational signatures.
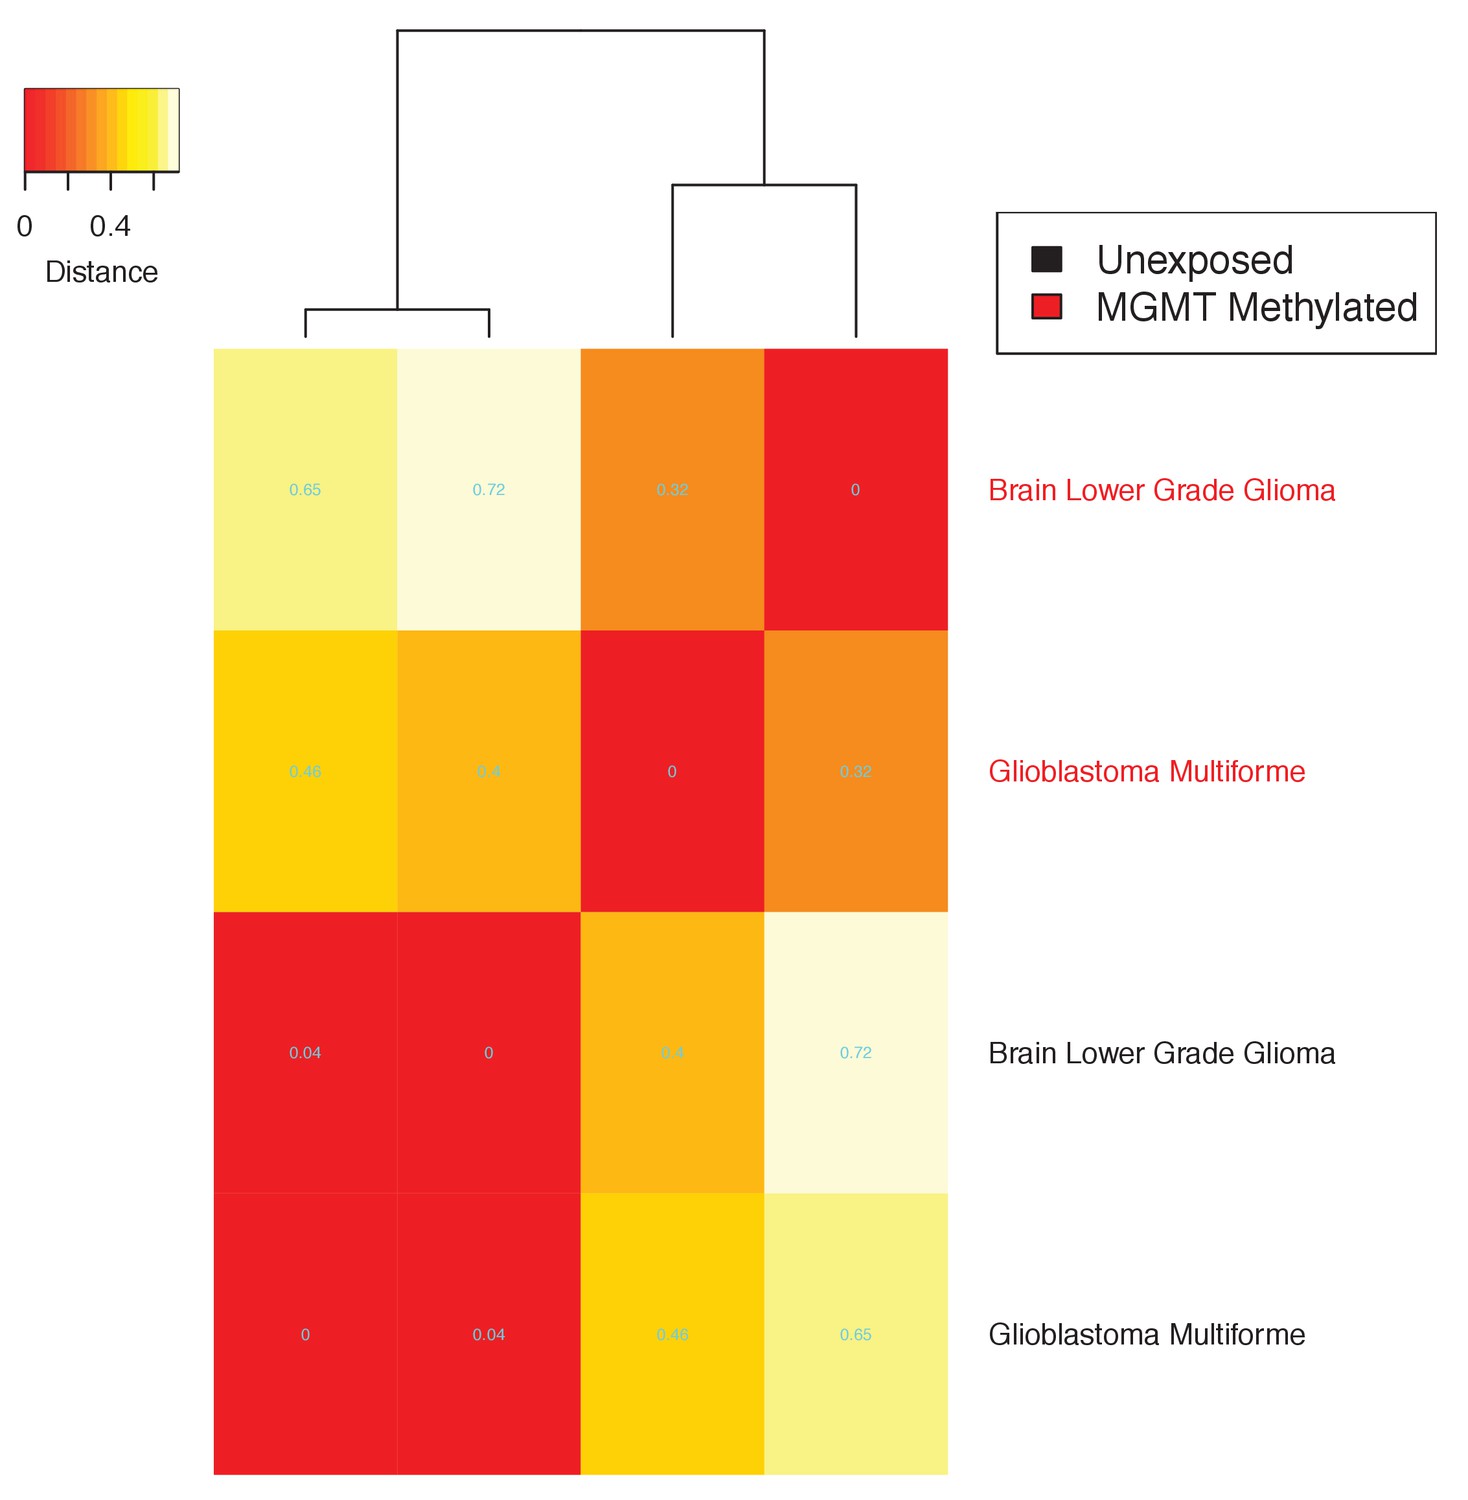
Heatmap of the distance, in terms of correlation, between any two etiological factors’ mutational landscapes in the corresponding tissues. Distance not discounted for age. The distance between any two mutational landscapes is given by 1- the Pearson’s correlation between the two mutational landscapes. See Materials and method section for details.
Figure 3—figure supplement 8
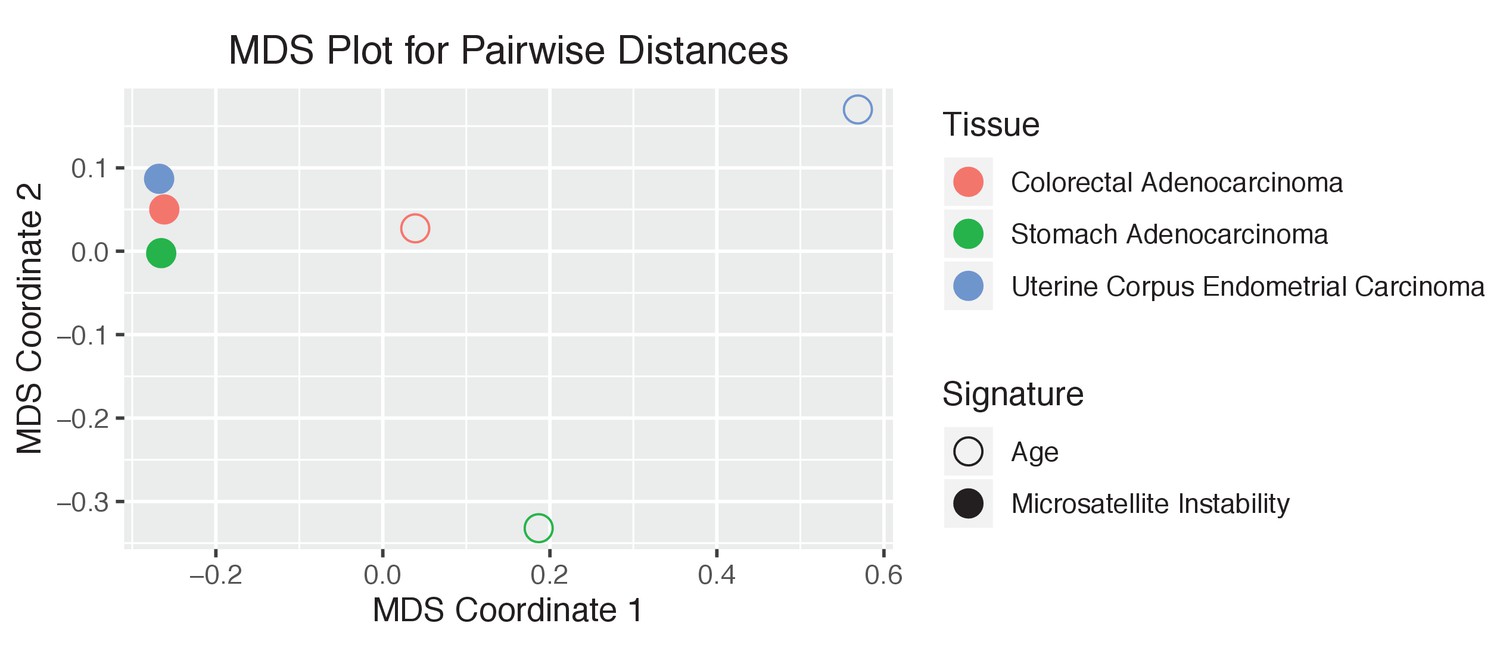
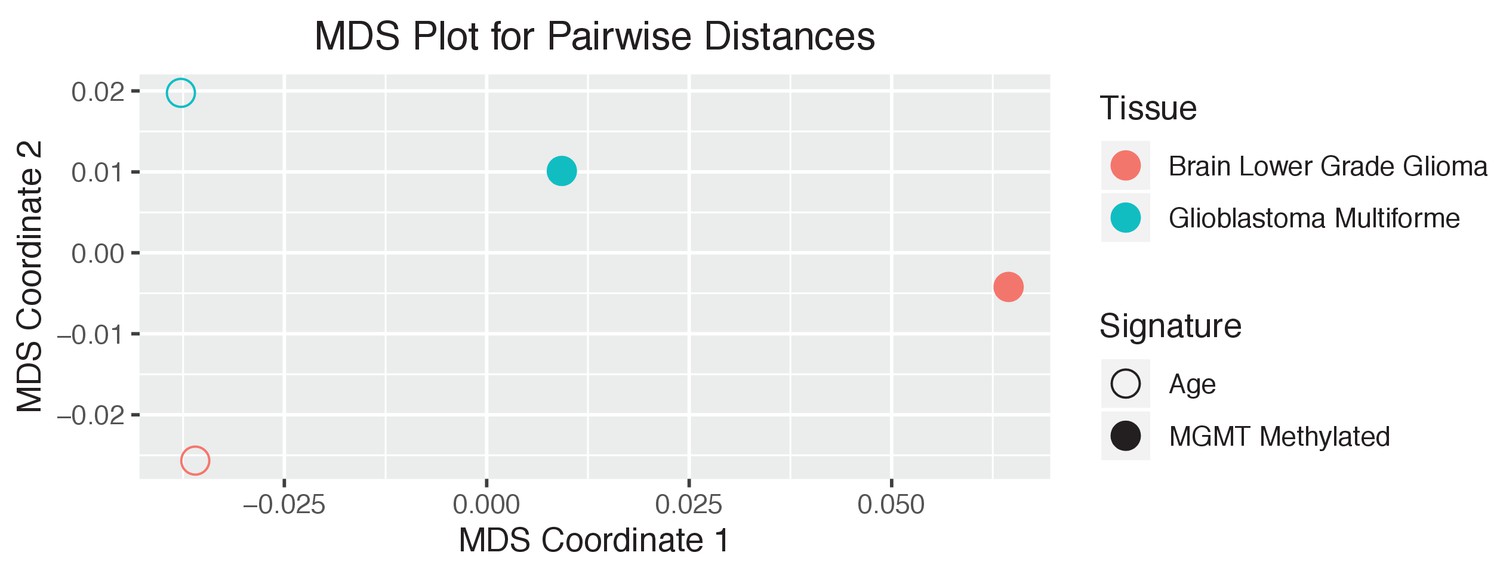
The tissue dependence of the mutational signatures.
Multidimensional Scaling (MDS) plot of indicated etiological factors’ mutational landscapes in the corresponding tissues. Not discounted for age. See Materials and method section for details.
Figure 3—figure supplement 9
The tissue dependence of the mutational signatures.
Heatmap of the distance, in terms of correlation, between any two etiological factors’ mutational landscapes in the corresponding tissues. Distance not discounted for age. The distance between any two mutational landscapes is given by 1- the Pearson’s correlation between the two mutational landscapes. See Materials and method section for details.
Figure 3—figure supplement 10
The tissue dependence of the mutational signatures.
Multidimensional Scaling (MDS) plot of indicated etiological factors’ mutational landscapes in the corresponding tissues. Not discounted for age. See Materials and method section for details.
Figure 3—figure supplement 11
The tissue dependence of the mutational signatures.
Heatmap of the distance, in terms of correlation, between any two etiological factors’ mutational landscapes in the corresponding tissues. Distance not discounted for age. The distance between any two mutational landscapes is given by 1- the Pearson’s correlation between the two mutational landscapes. See Materials and method section for details.
Figure 3—figure supplement 12
The tissue dependence of the mutational signatures.
Multidimensional Scaling (MDS) plot of indicated etiological factors’ mutational landscapes in the corresponding tissues. Not discounted for age. See Materials and method section for details.
Figure 3—figure supplement 13
The tissue dependence of the mutational signatures.
Heatmap of the distance, in terms of correlation, between any two etiological factors’ mutational landscapes in the corresponding tissues. Distance not discounted for age. The distance between any two mutational landscapes is given by 1- the Pearson’s correlation between the two mutational landscapes. See Materials and method section for details.
Figure 3—figure supplement 14
The tissue dependence of the mutational signatures.
Multidimensional Scaling (MDS) plot of indicated etiological factors’ mutational landscapes in the corresponding tissues. Not discounted for age. See Materials and method section for details.
Figure 3—figure supplement 15
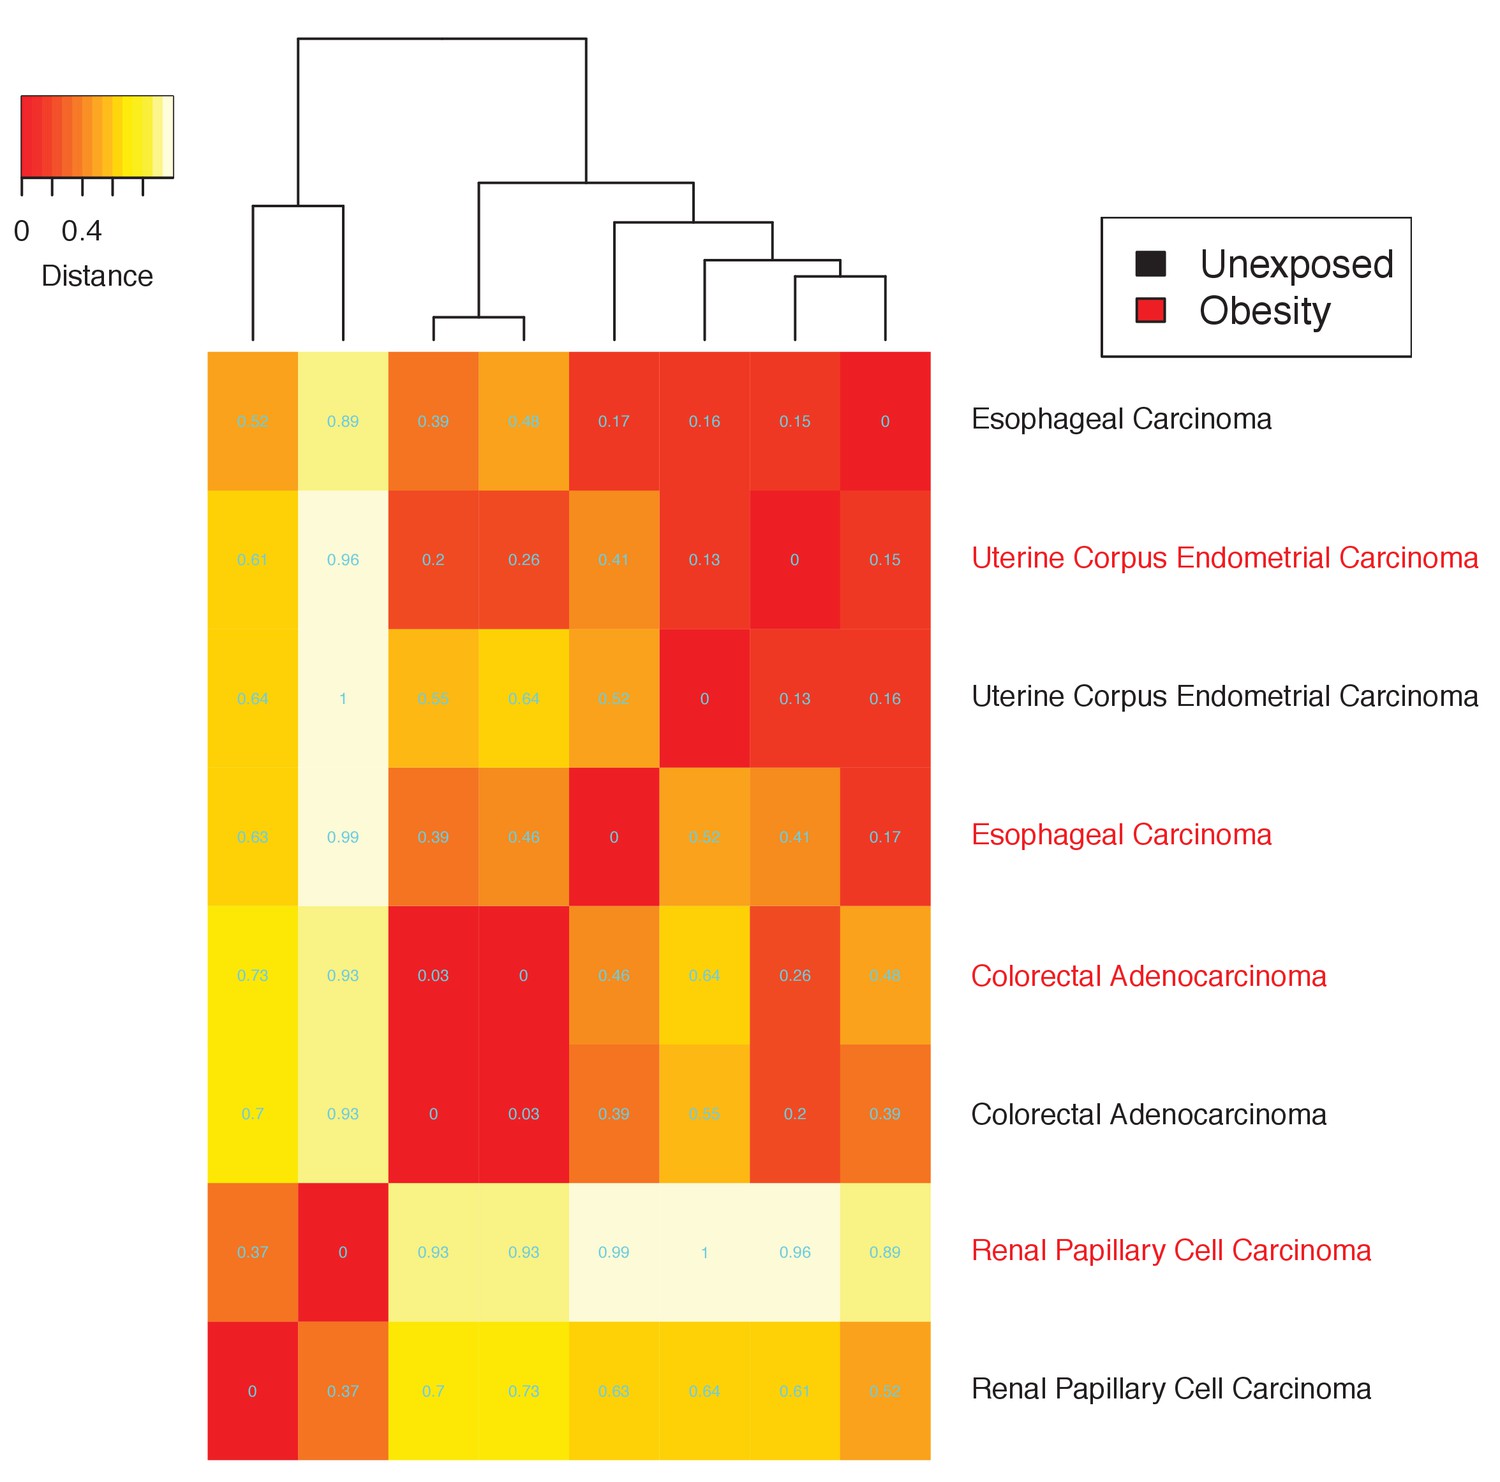
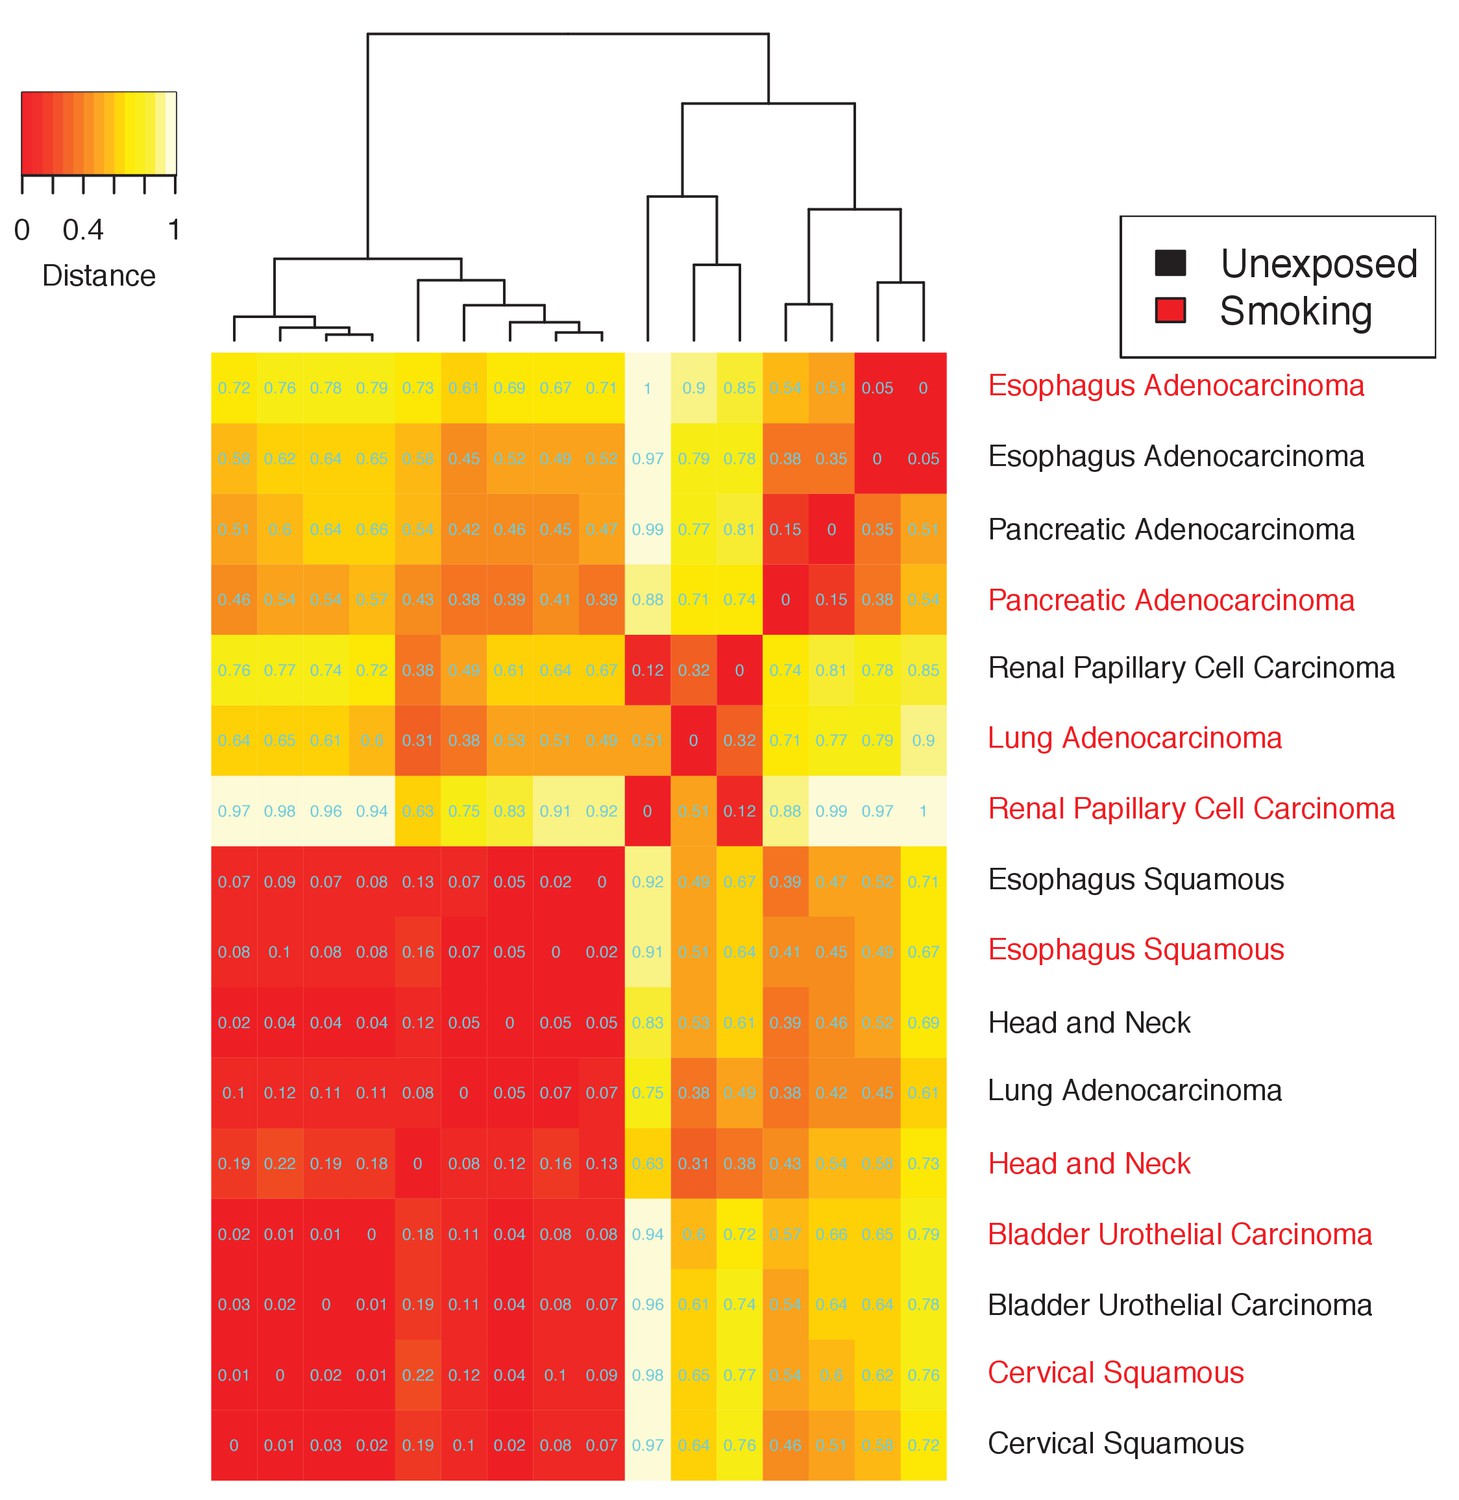
The tissue dependence of the mutational signatures.
Heatmap of the distance, in terms of correlation, between any two etiological factors’ mutational landscapes in the corresponding tissues. Distance not discounted for age. The distance between any two mutational landscapes is given by 1- the Pearson’s correlation between the two mutational landscapes. See Materials and method section for details.
Figure 3—figure supplement 16
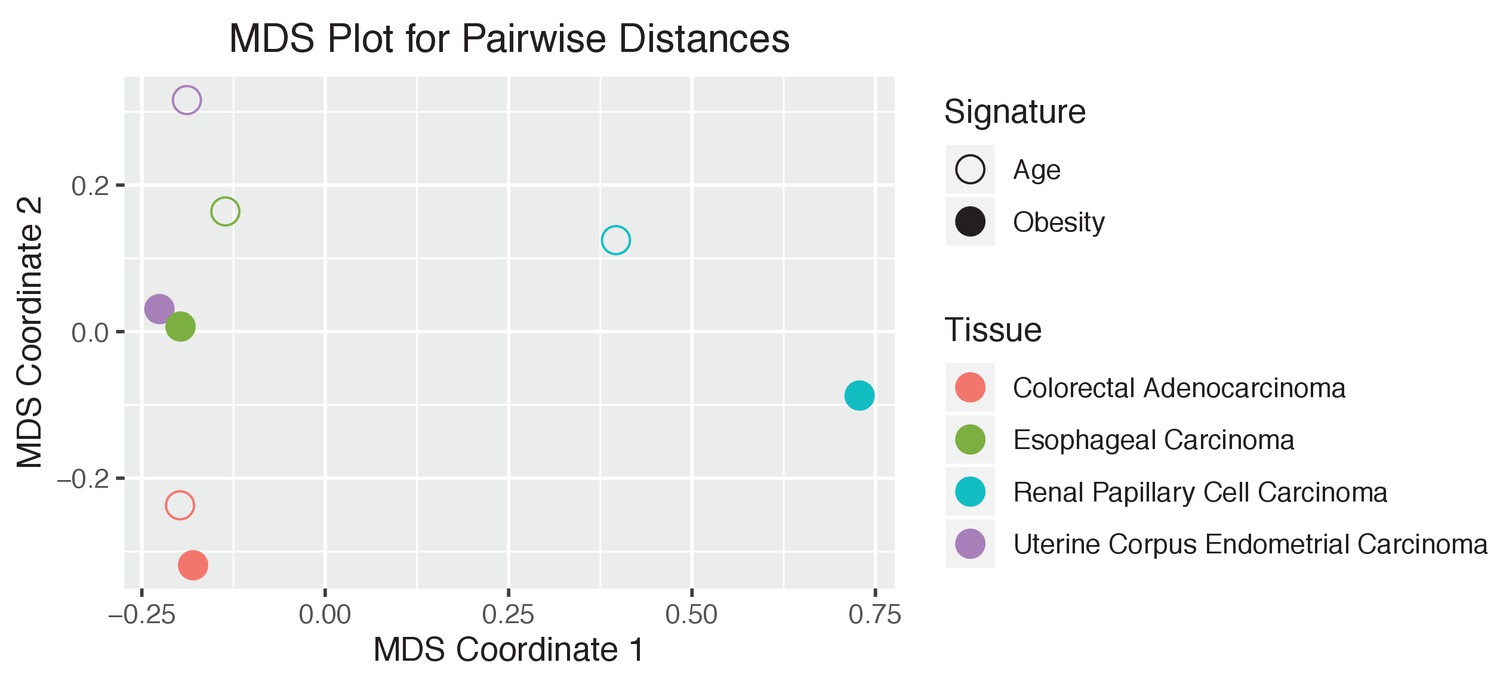
The tissue dependence of the mutational signatures.
Multidimensional Scaling (MDS) plot of indicated etiological factors’ mutational landscapes in the corresponding tissues. Not discounted for age. See Materials and method section for details.
Figure 3—figure supplement 17
The tissue dependence of the mutational signatures.
Heatmap of the distance, in terms of correlation, between any two etiological factors’ mutational landscapes in the corresponding tissues. Distance not discounted for age. The distance between any two mutational landscapes is given by 1- the Pearson’s correlation between the two mutational landscapes. See Materials and method section for details.
Figure 3—figure supplement 18
The tissue dependence of the mutational signatures.
Multidimensional Scaling (MDS) plot of indicated etiological factors’ mutational landscapes in the corresponding tissues. Not discounted for age. See Materials and method section for details.
Figure 3—figure supplement 19
The tissue dependence of the mutational signatures.
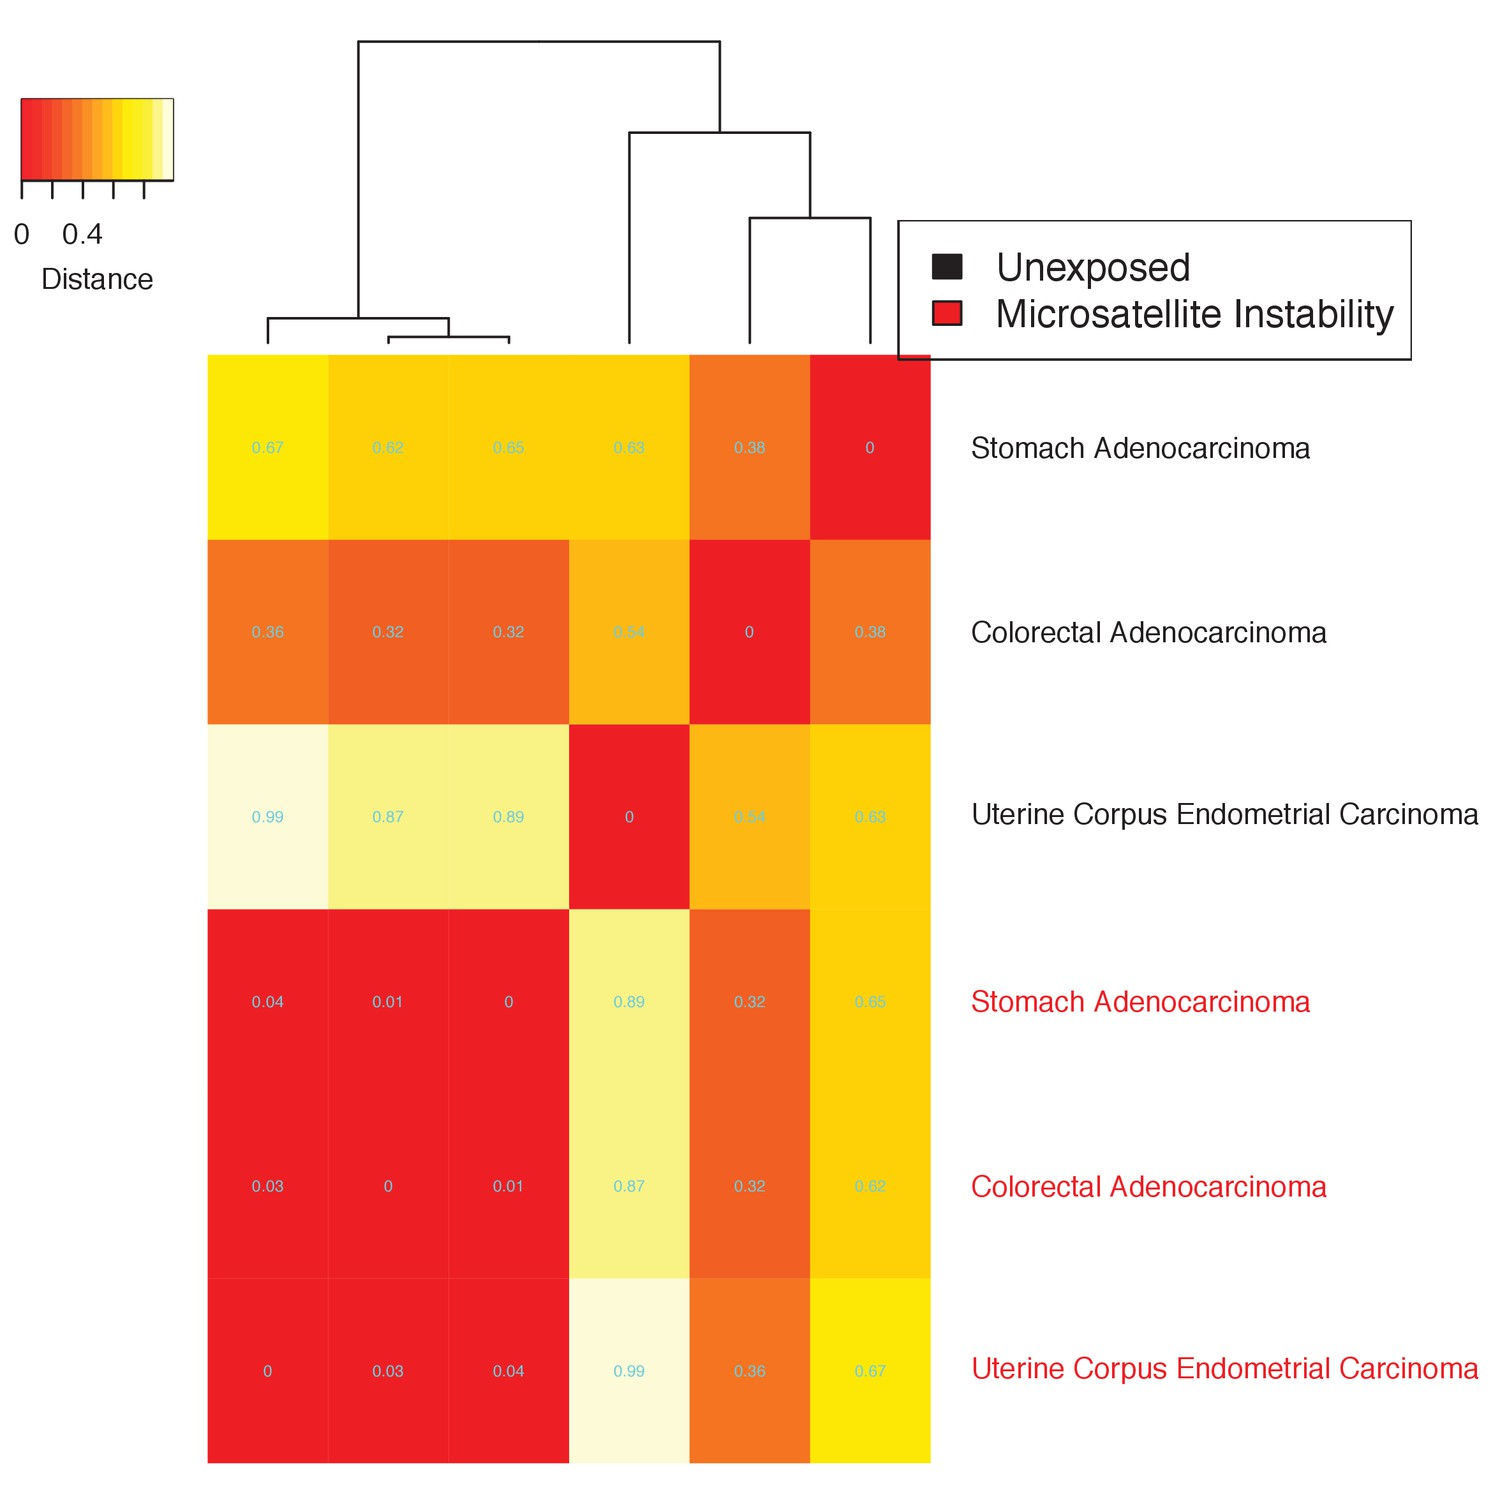
Heatmap of the distance, in terms of correlation, between any two etiological factors’ mutational landscapes in the corresponding tissues. Distance discounted for age. The distance between any two mutational landscapes is given by 1- the Pearson’s correlation between the two mutational landscapes. See Materials and method section for details.
Figure 3—figure supplement 20
The tissue dependence of the mutational signatures.
Heatmap of the distance, in terms of correlation, between any two etiological factors’ mutational landscapes in the corresponding tissues. Distance discounted for age. The distance between any two mutational landscapes is given by 1- the Pearson’s correlation between the two mutational landscapes. See Materials and method section for details.
Figure 3—figure supplement 21
The tissue dependence of the mutational signatures.
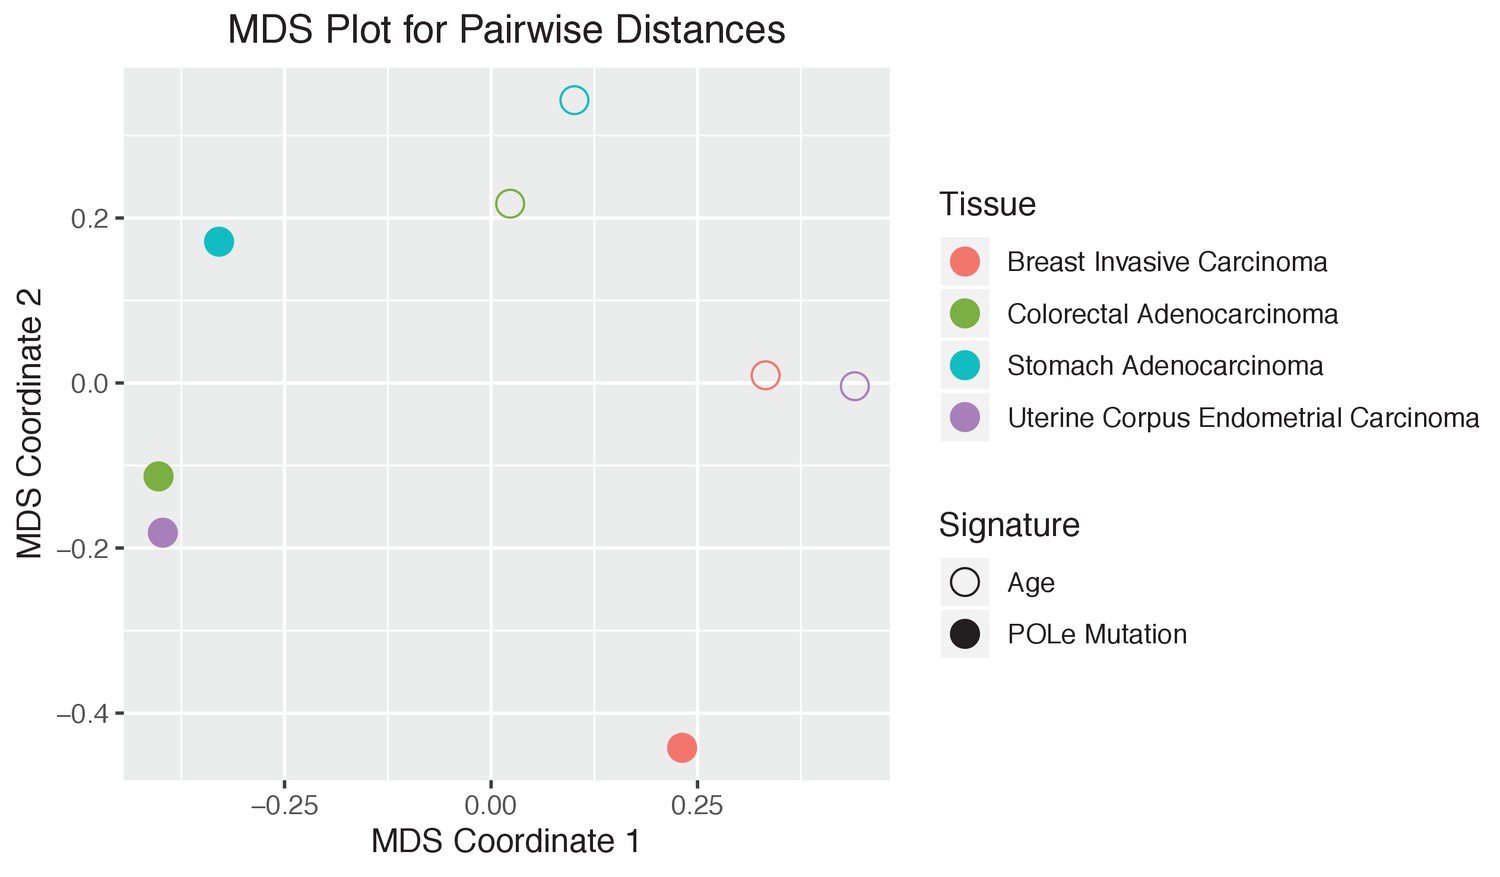
Multidimensional Scaling (MDS) plot of indicated etiological factors’ mutational landscapes in the corresponding tissues. Discounted for age. See Materials and method section for details.
Figure 3—figure supplement 22
The tissue dependence of the mutational signatures.
Heatmap of the distance, in terms of correlation, between any two etiological factors’ mutational landscapes in the corresponding tissues. Distance discounted for age. The distance between any two mutational landscapes is given by 1- the Pearson’s correlation between the two mutational landscapes. See Materials and method section for details.
Figure 3—figure supplement 23
The tissue dependence of the mutational signatures.
Multidimensional Scaling (MDS) plot of indicated etiological factors’ mutational landscapes in the corresponding tissues. Discounted for age. See Materials and method section for details.
Figure 3—figure supplement 24
The tissue dependence of the mutational signatures.
Heatmap of the distance, in terms of correlation, between any two etiological factors’ mutational landscapes in the corresponding tissues. Distance discounted for age. The distance between any two mutational landscapes is given by 1- the Pearson’s correlation between the two mutational landscapes. See Materials and method section for details.
Figure 3—figure supplement 25
The tissue dependence of the mutational signatures.
Multidimensional Scaling (MDS) plot of indicated etiological factors’ mutational landscapes in the corresponding tissues. Discounted for age. See Materials and method section for details.
Figure 3—figure supplement 26
The tissue dependence of the mutational signatures.
Heatmap of the distance, in terms of correlation, between any two etiological factors’ mutational landscapes in the corresponding tissues. Distance discounted for age. The distance between any two mutational landscapes is given by 1- the Pearson’s correlation between the two mutational landscapes. See Materials and method section for details.
Figure 3—figure supplement 27
The tissue dependence of the mutational signatures.
Multidimensional Scaling (MDS) plot of indicated etiological factors’ mutational landscapes in the corresponding tissues. Discounted for age. See Materials and method section for details.
Figure 3—figure supplement 28
The tissue dependence of the mutational signatures.
Heatmap of the distance, in terms of correlation, between any two etiological factors’ mutational landscapes in the corresponding tissues. Distance discounted for age. The distance between any two mutational landscapes is given by 1- the Pearson’s correlation between the two mutational landscapes. See Materials and method section for details.
Figure 3—figure supplement 29
The tissue dependence of the mutational signatures.
Multidimensional Scaling (MDS) plot of indicated etiological factors’ mutational landscapes in the corresponding tissues. Discounted for age. See Materials and method section for details.
Figure 3—figure supplement 30
The tissue dependence of the mutational signatures.
Heatmap of the distance, in terms of correlation, between any two etiological factors’ mutational landscapes in the corresponding tissues. Distance discounted for age. The distance between any two mutational landscapes is given by 1- the Pearson’s correlation between the two mutational landscapes. See Materials and method section for details.
Figure 3—figure supplement 31
The tissue dependence of the mutational signatures.
Multidimensional Scaling (MDS) plot of indicated etiological factors’ mutational landscapes in the corresponding tissues. Discounted for age. See Materials and method section for details.
Figure 3—figure supplement 32
The tissue dependence of the mutational signatures.
Heatmap of the distance, in terms of correlation, between any two etiological factors’ mutational landscapes in the corresponding tissues. Distance discounted for age. The distance between any two mutational landscapes is given by 1- the Pearson’s correlation between the two mutational landscapes. See Materials and method section for details.
Figure 3—figure supplement 33
The tissue dependence of the mutational signatures.
Multidimensional Scaling (MDS) plot of indicated etiological factors’ mutational landscapes in the corresponding tissues. Discounted for age. See Materials and method section for details.
Figure 3—figure supplement 34
The tissue dependence of the mutational signatures.
Heatmap of the distance, in terms of correlation, between any two etiological factors’ mutational landscapes in the corresponding tissues. Distance discounted for age. The distance between any two mutational landscapes is given by 1- the Pearson’s correlation between the two mutational landscapes. See Materials and method section for details.
Figure 3—figure supplement 35
The tissue dependence of the mutational signatures.
Multidimensional Scaling (MDS) plot of indicated etiological factors’ mutational landscapes in the corresponding tissues. Discounted for age. See Materials and method section for details.
Figure 3—figure supplement 36
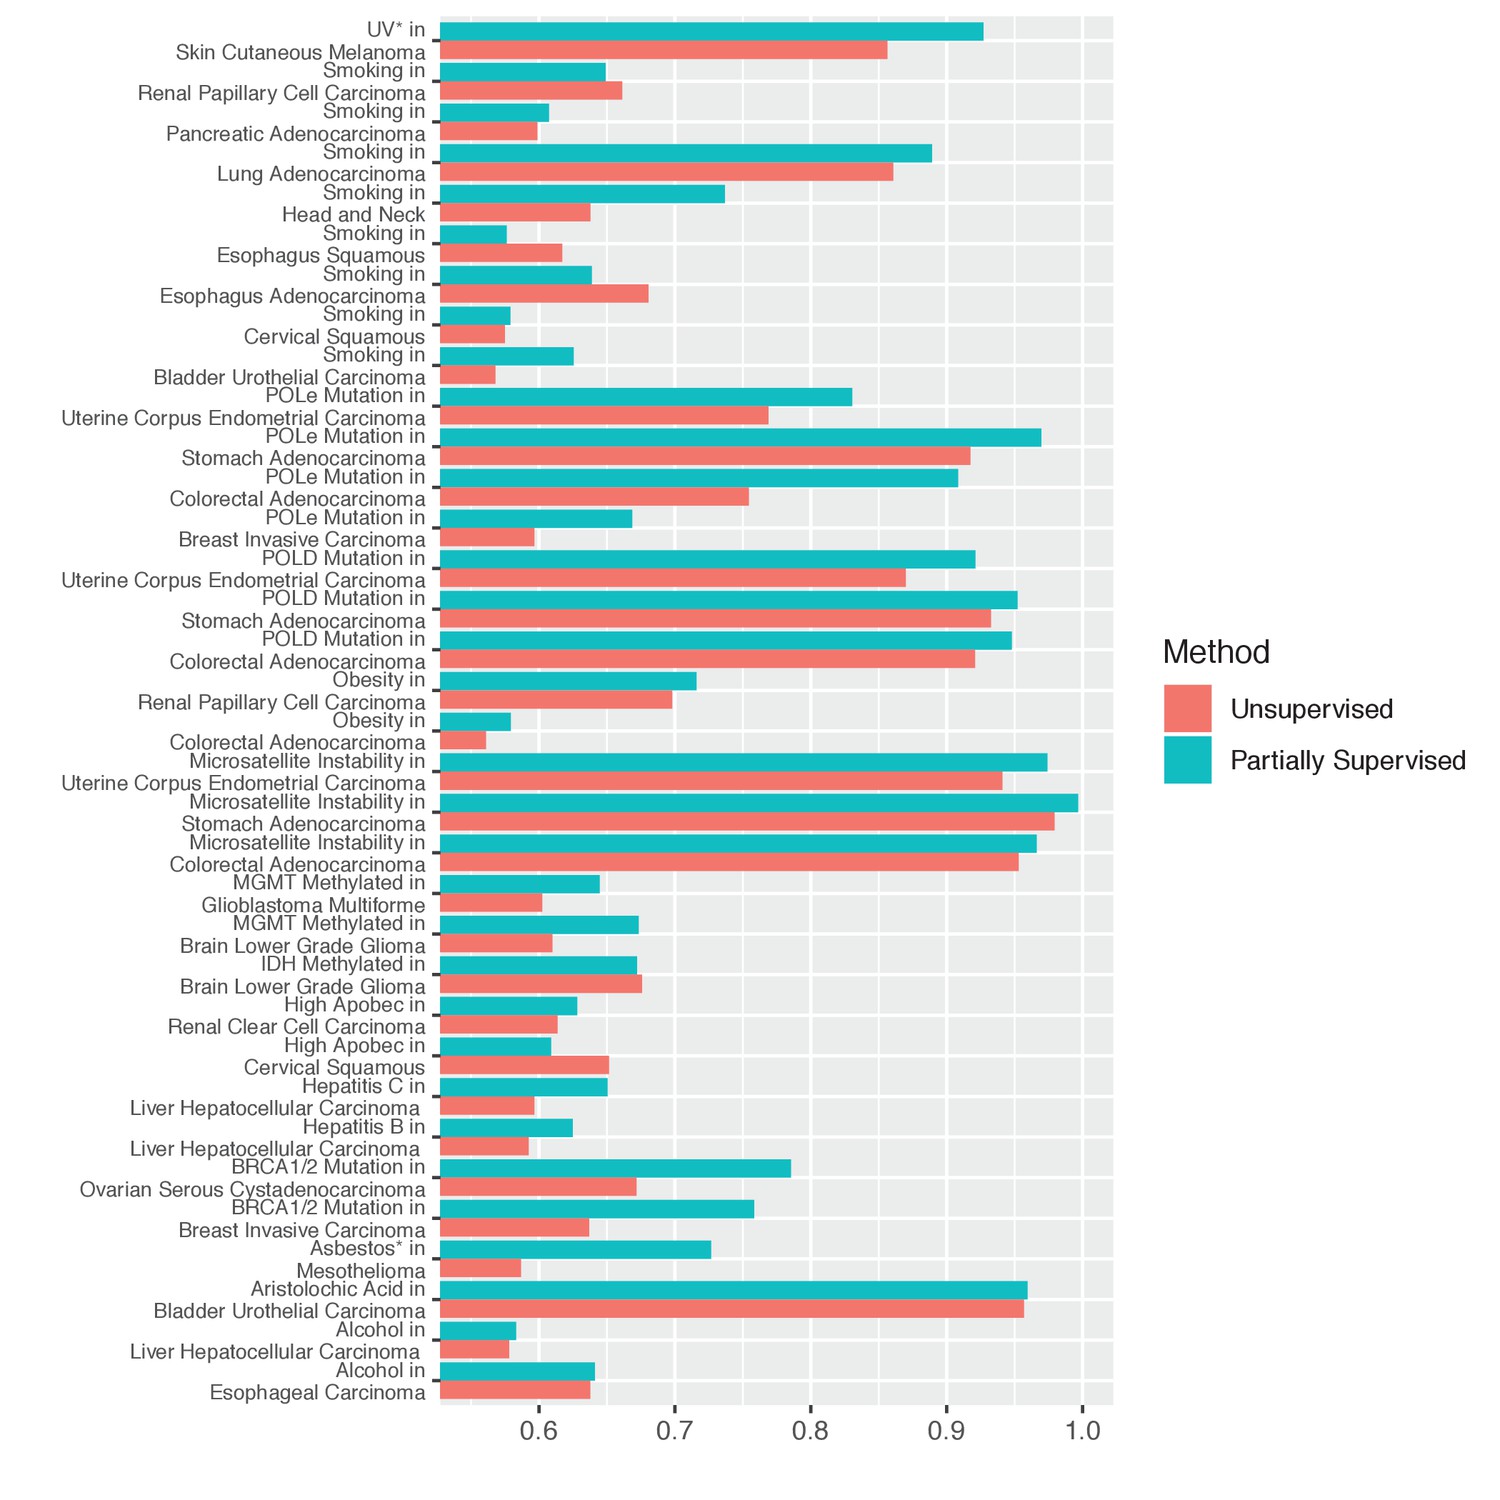
Partially supervised versus unsupervised methods.
Performance comparison in terms of AUC for the partially supervised method and the unsupervised one.
Figure 3—figure supplement 37
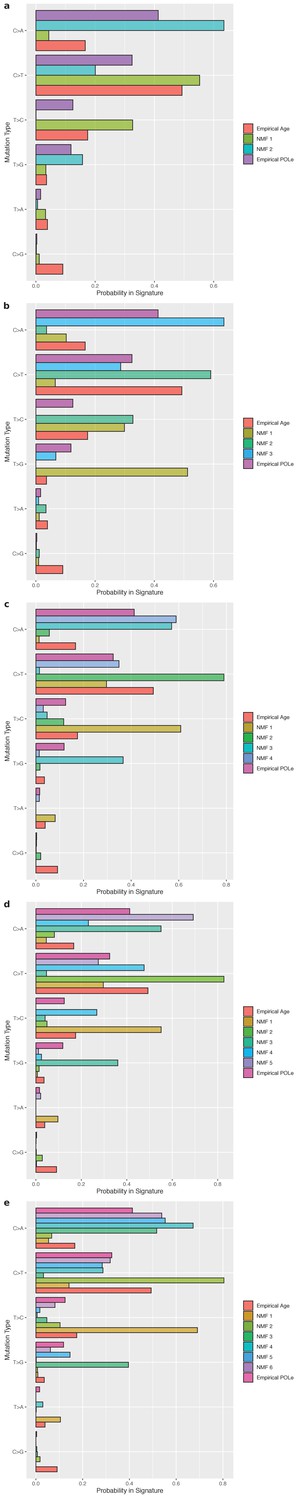
Model misspecification and the dimensionality issue with the unsupervised method.
All selected features of the supervised and unsupervised POL-ε signatures in UCEC-TCGA are listed and their frequencies compared (IUPAC notations: B=not A, D = not C, H = not G, V = not T, W = A or T, S = C or G, M = A or C, K = G or T, R = A or G, Y = C or T). Different plots are provided according to the different numbers of patterns (i.e. rank) unsupervised NMF was required to find: (a – e) correspond to rank = 2, 3, 4, 5, and 6, respectively. The larger the rank the greater the difference of the unsupervised signature from the correct supervised one. See Materials and method section for details.
Figure 3—figure supplement 38
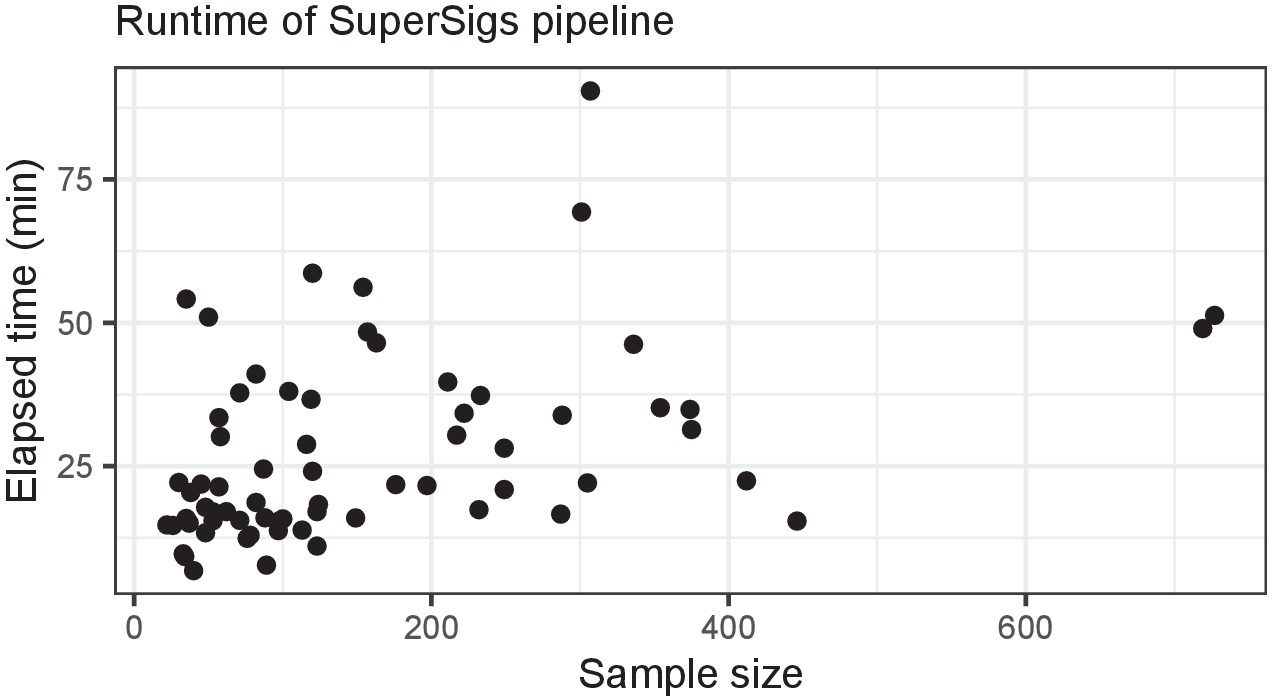
Speed benchmark.
Runtimes of the full SuperSigs methodology for all TCGA datasets analyzed (each point is one whole exome or whole genome dataset).
Figure 3—figure supplement 39
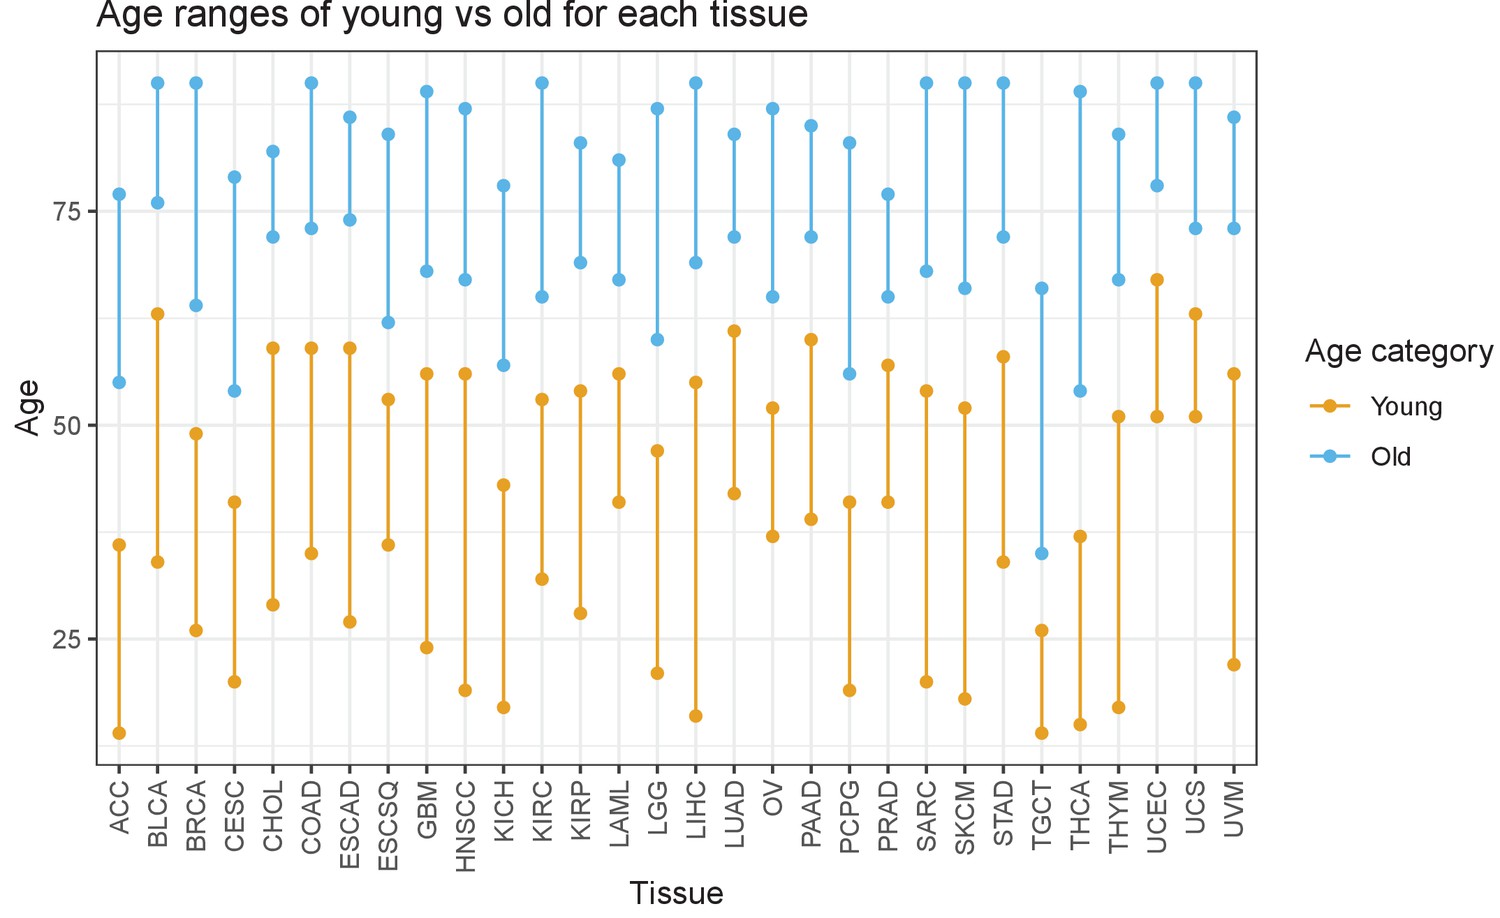
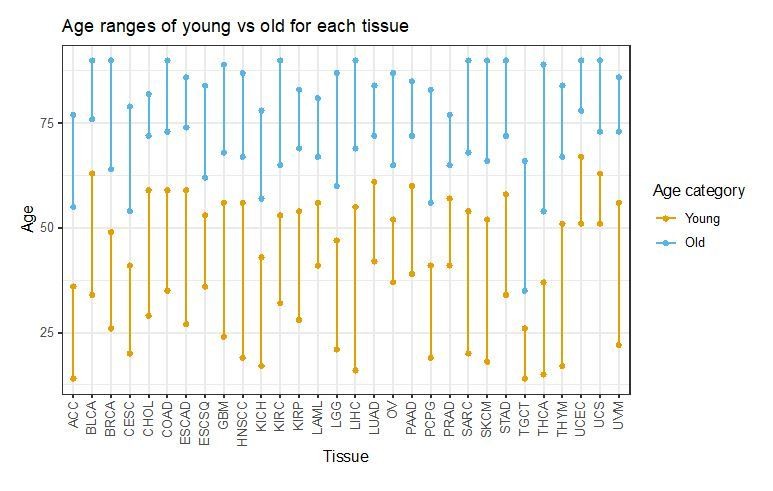
Age tertiles.
Age ranges of the two groups considered in each TCGA datasets analyzed for an age signature: young (lowest tertile) and old (highest tertile).
Figure 4 with 67 supplements
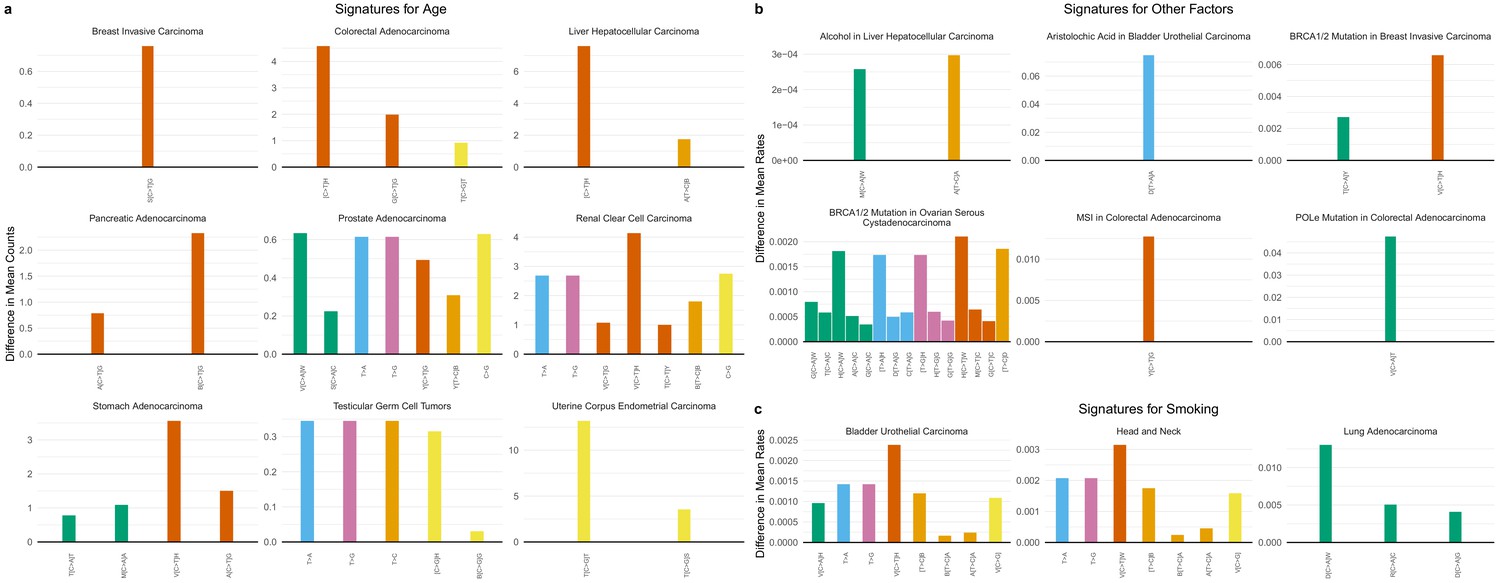
SuperSigs in various tissue types.
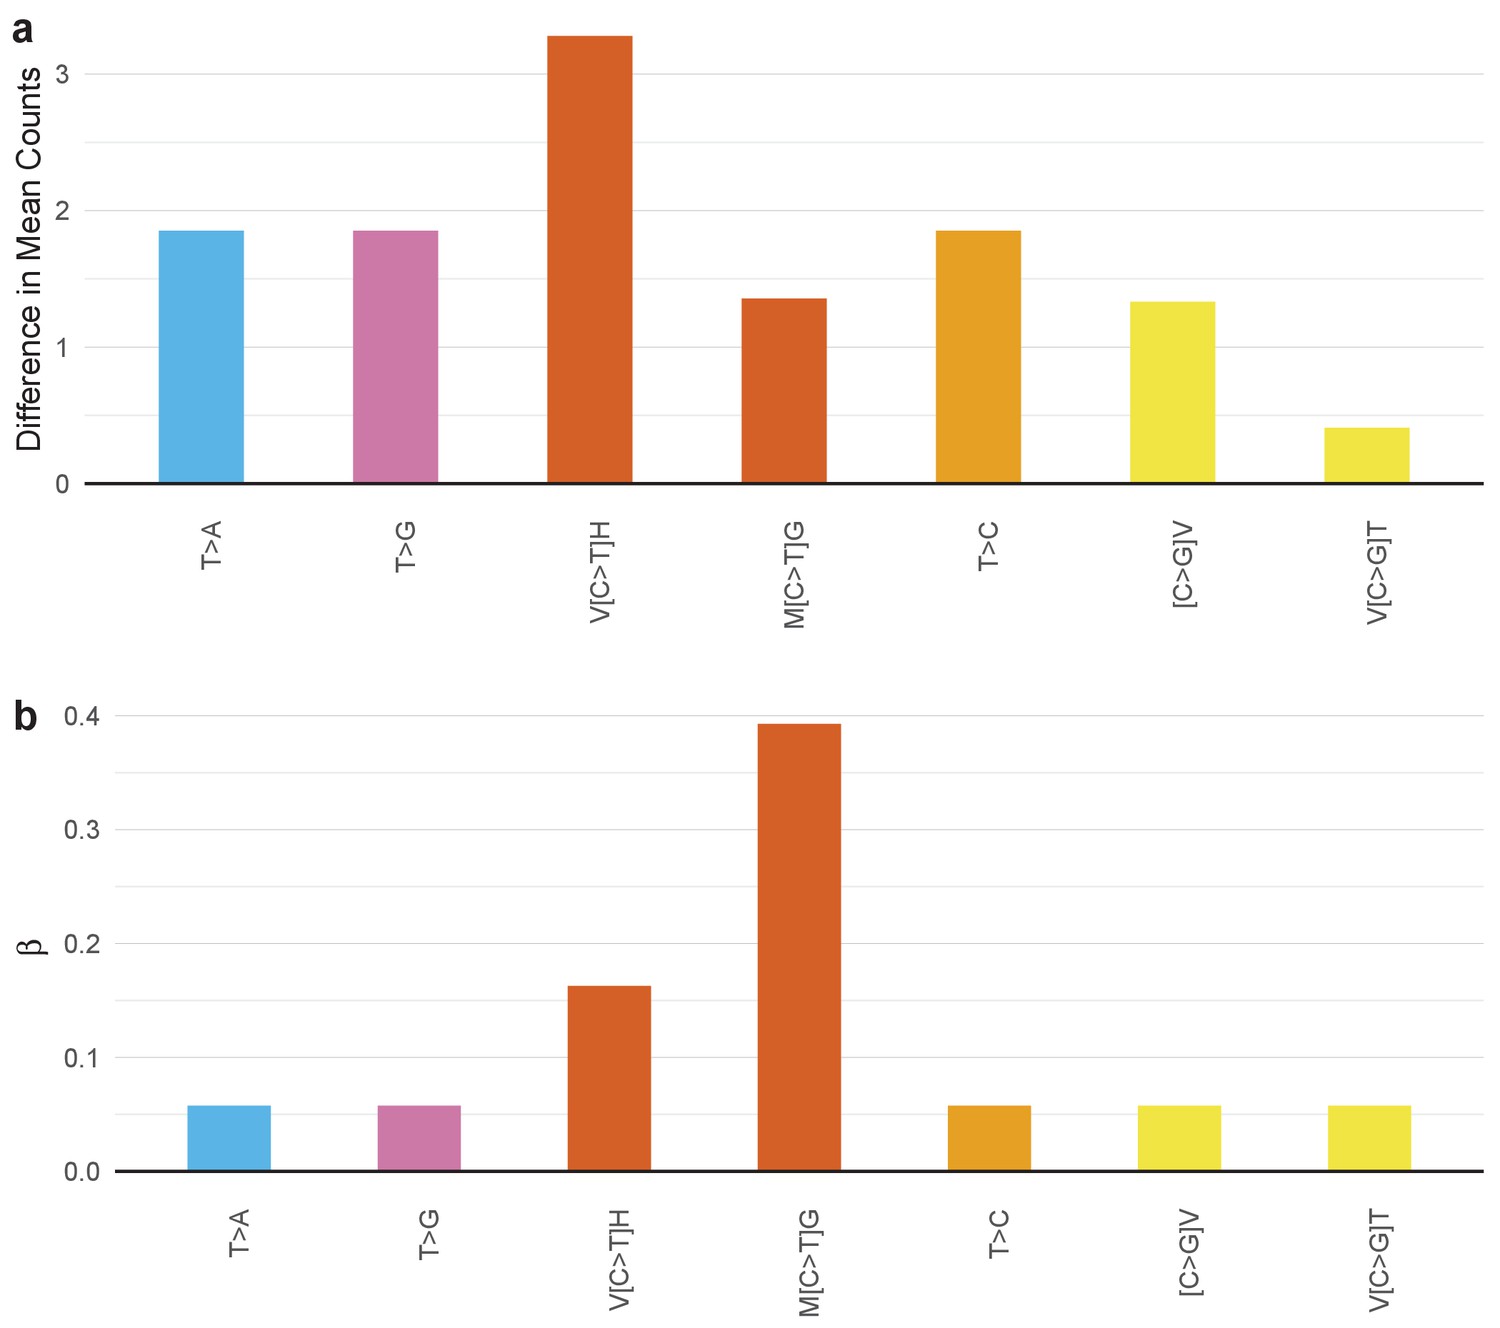
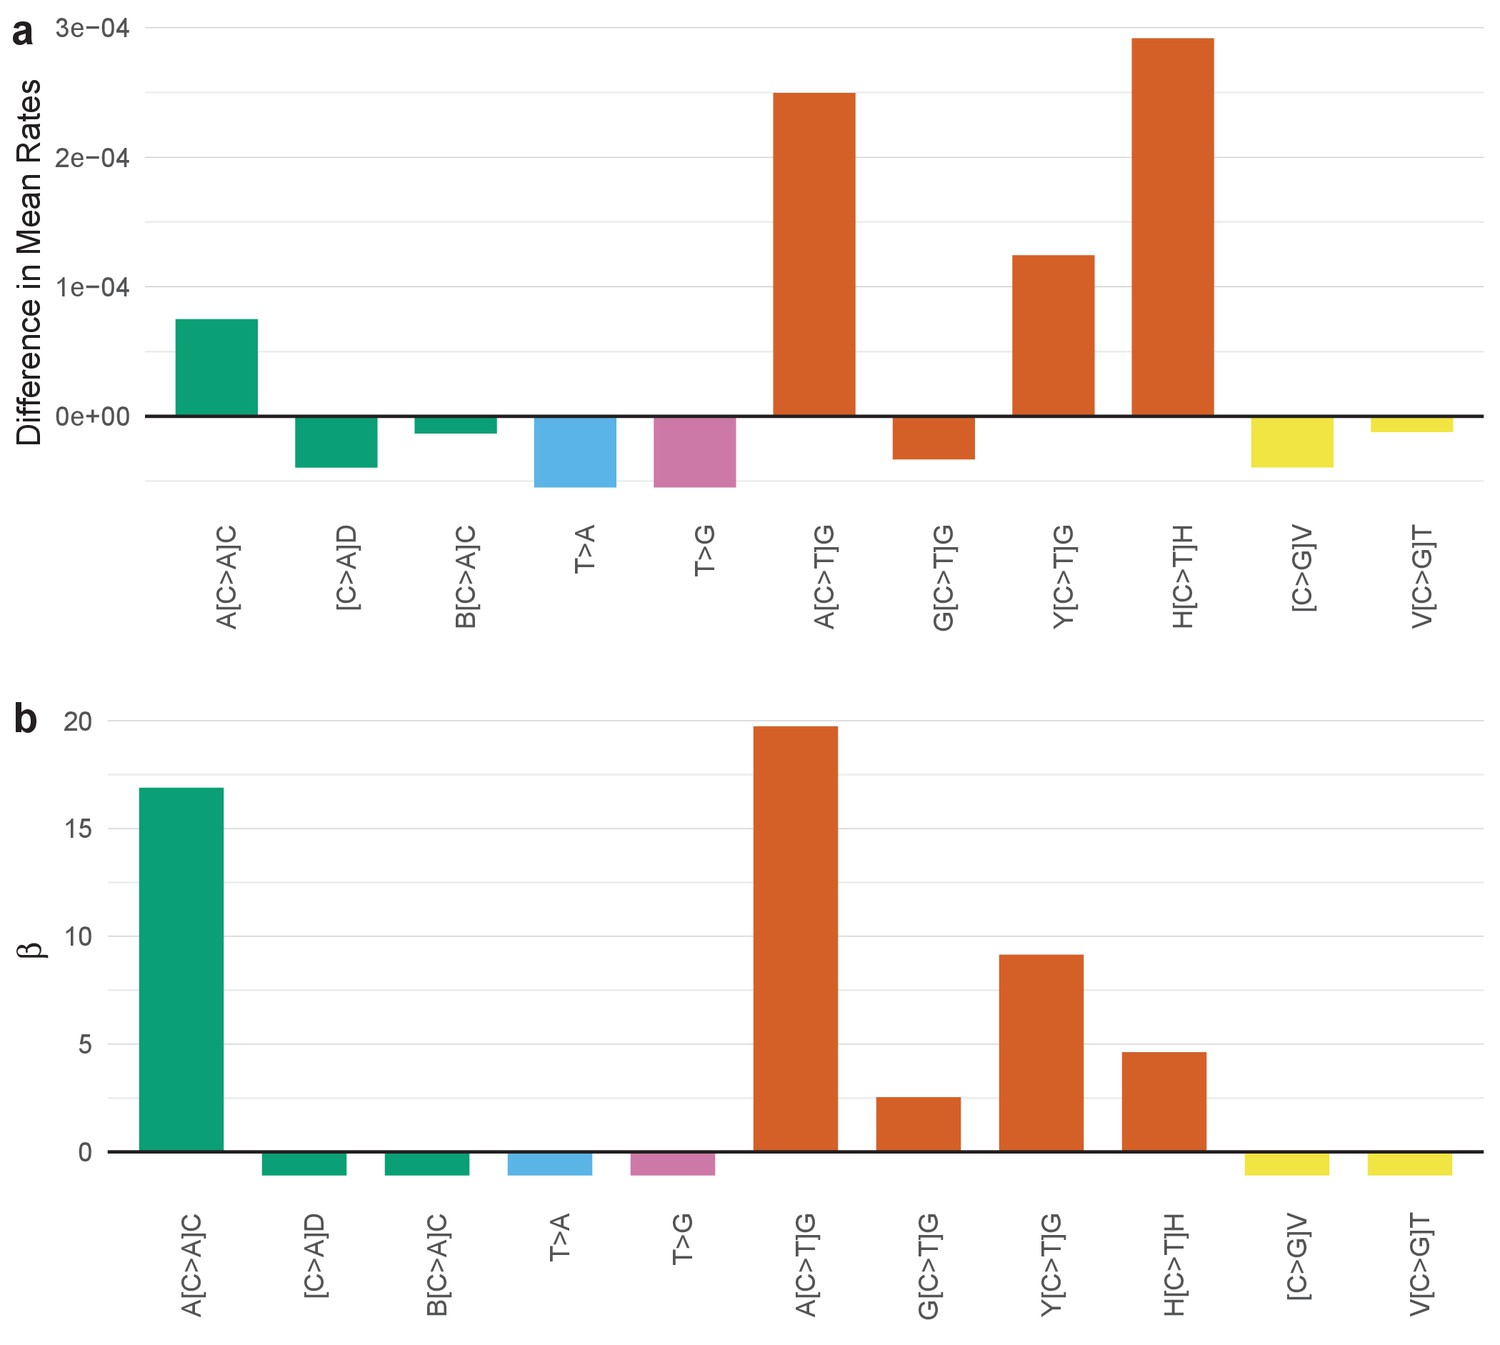
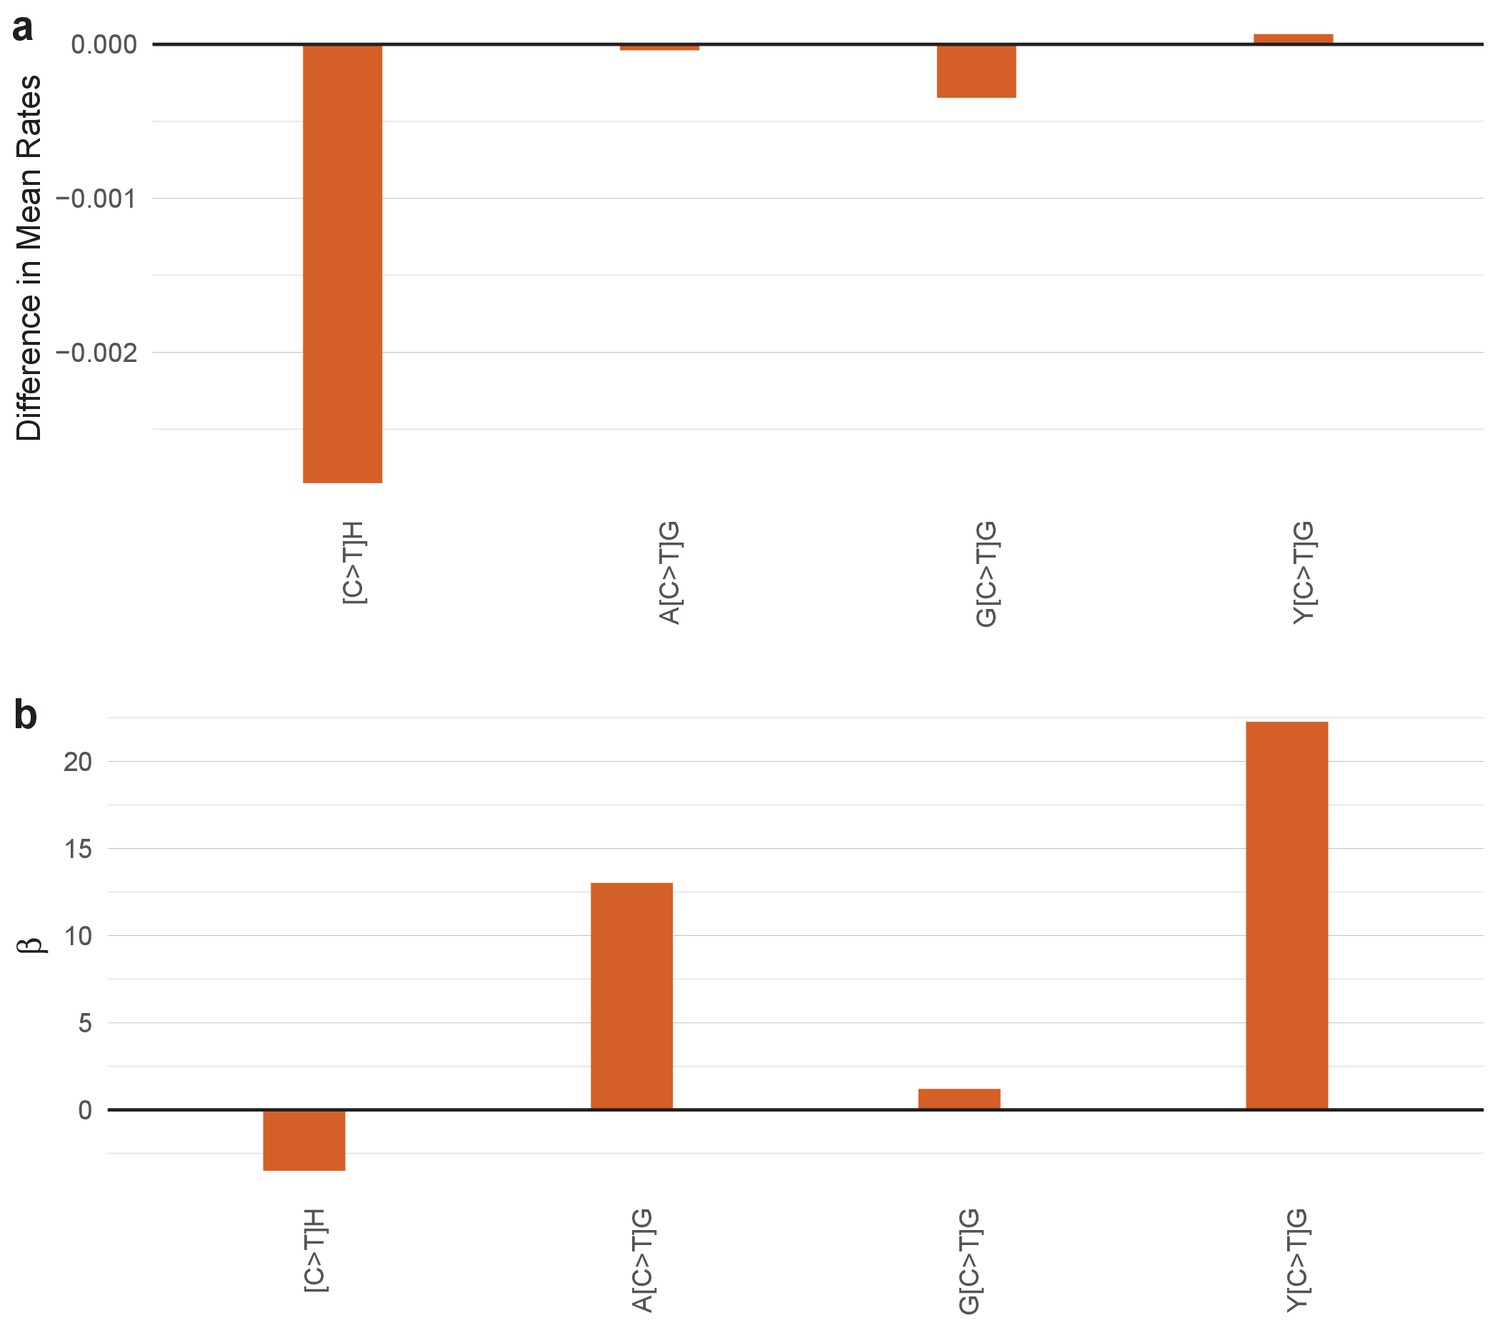
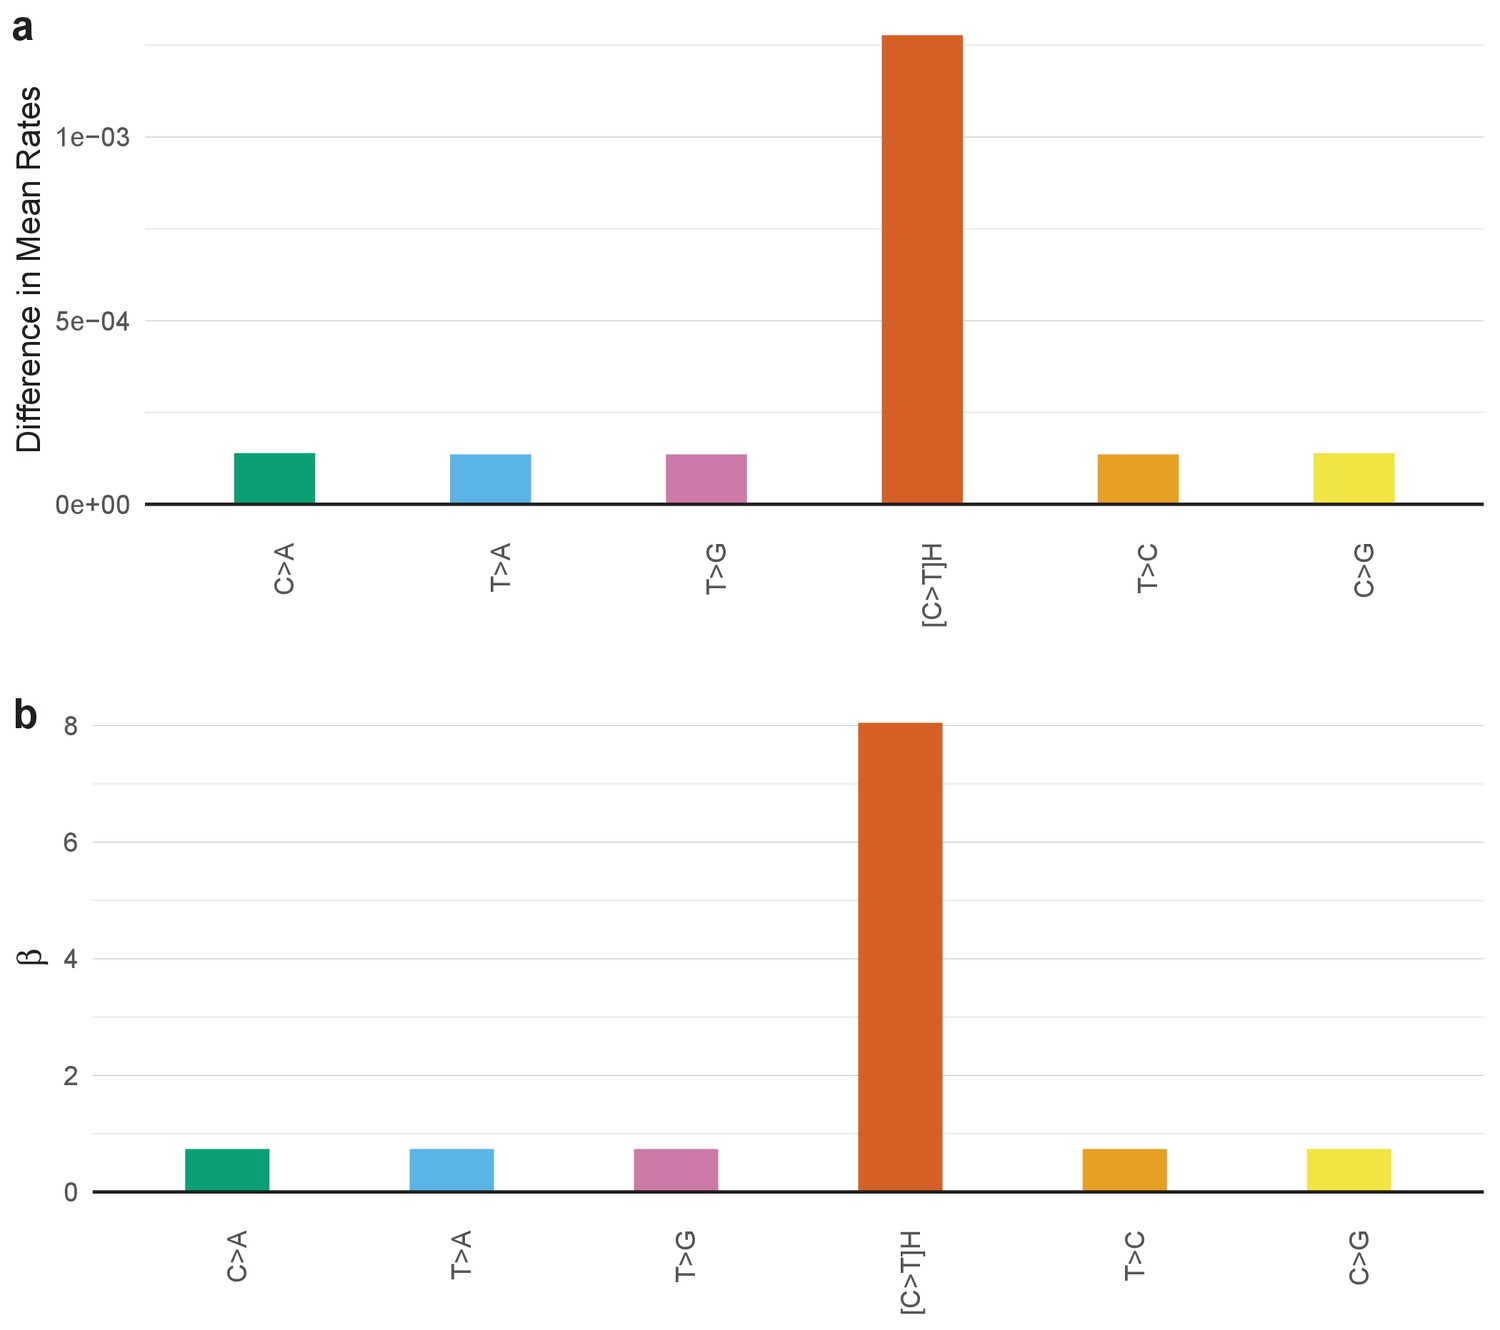
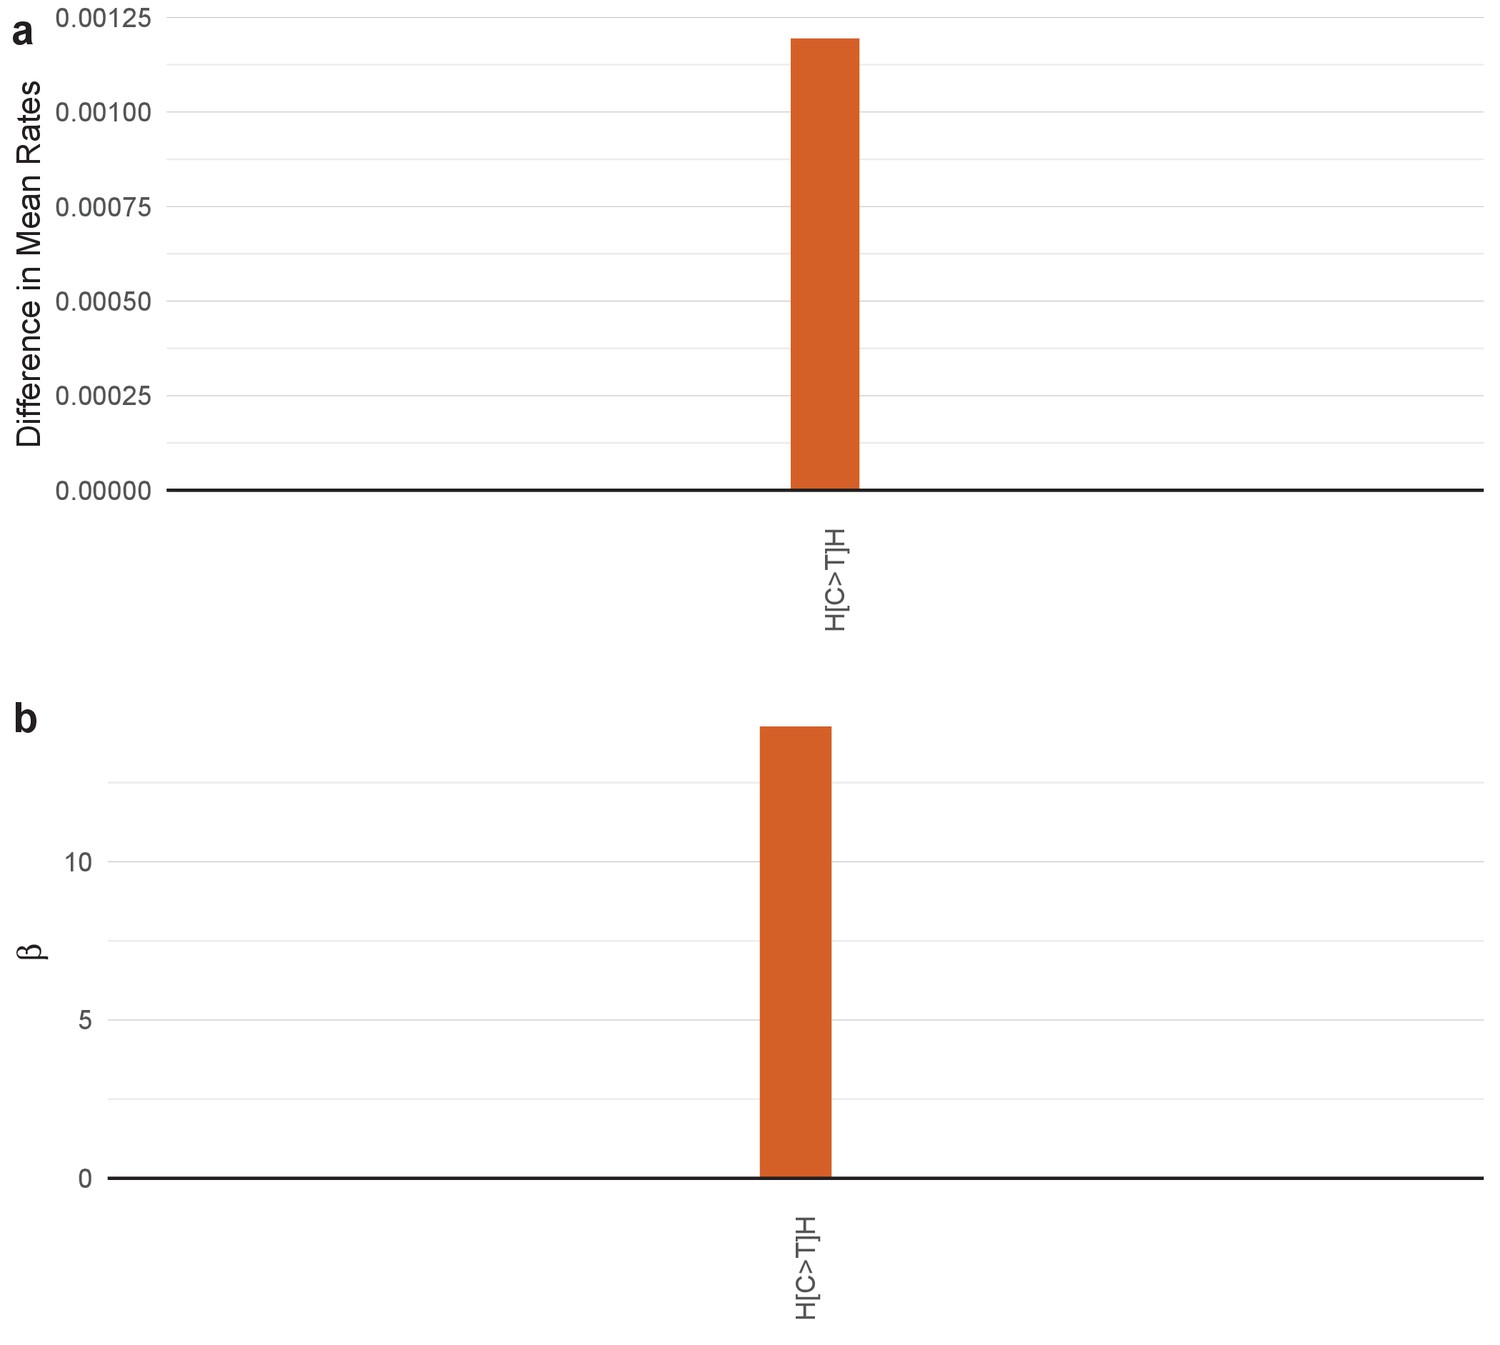
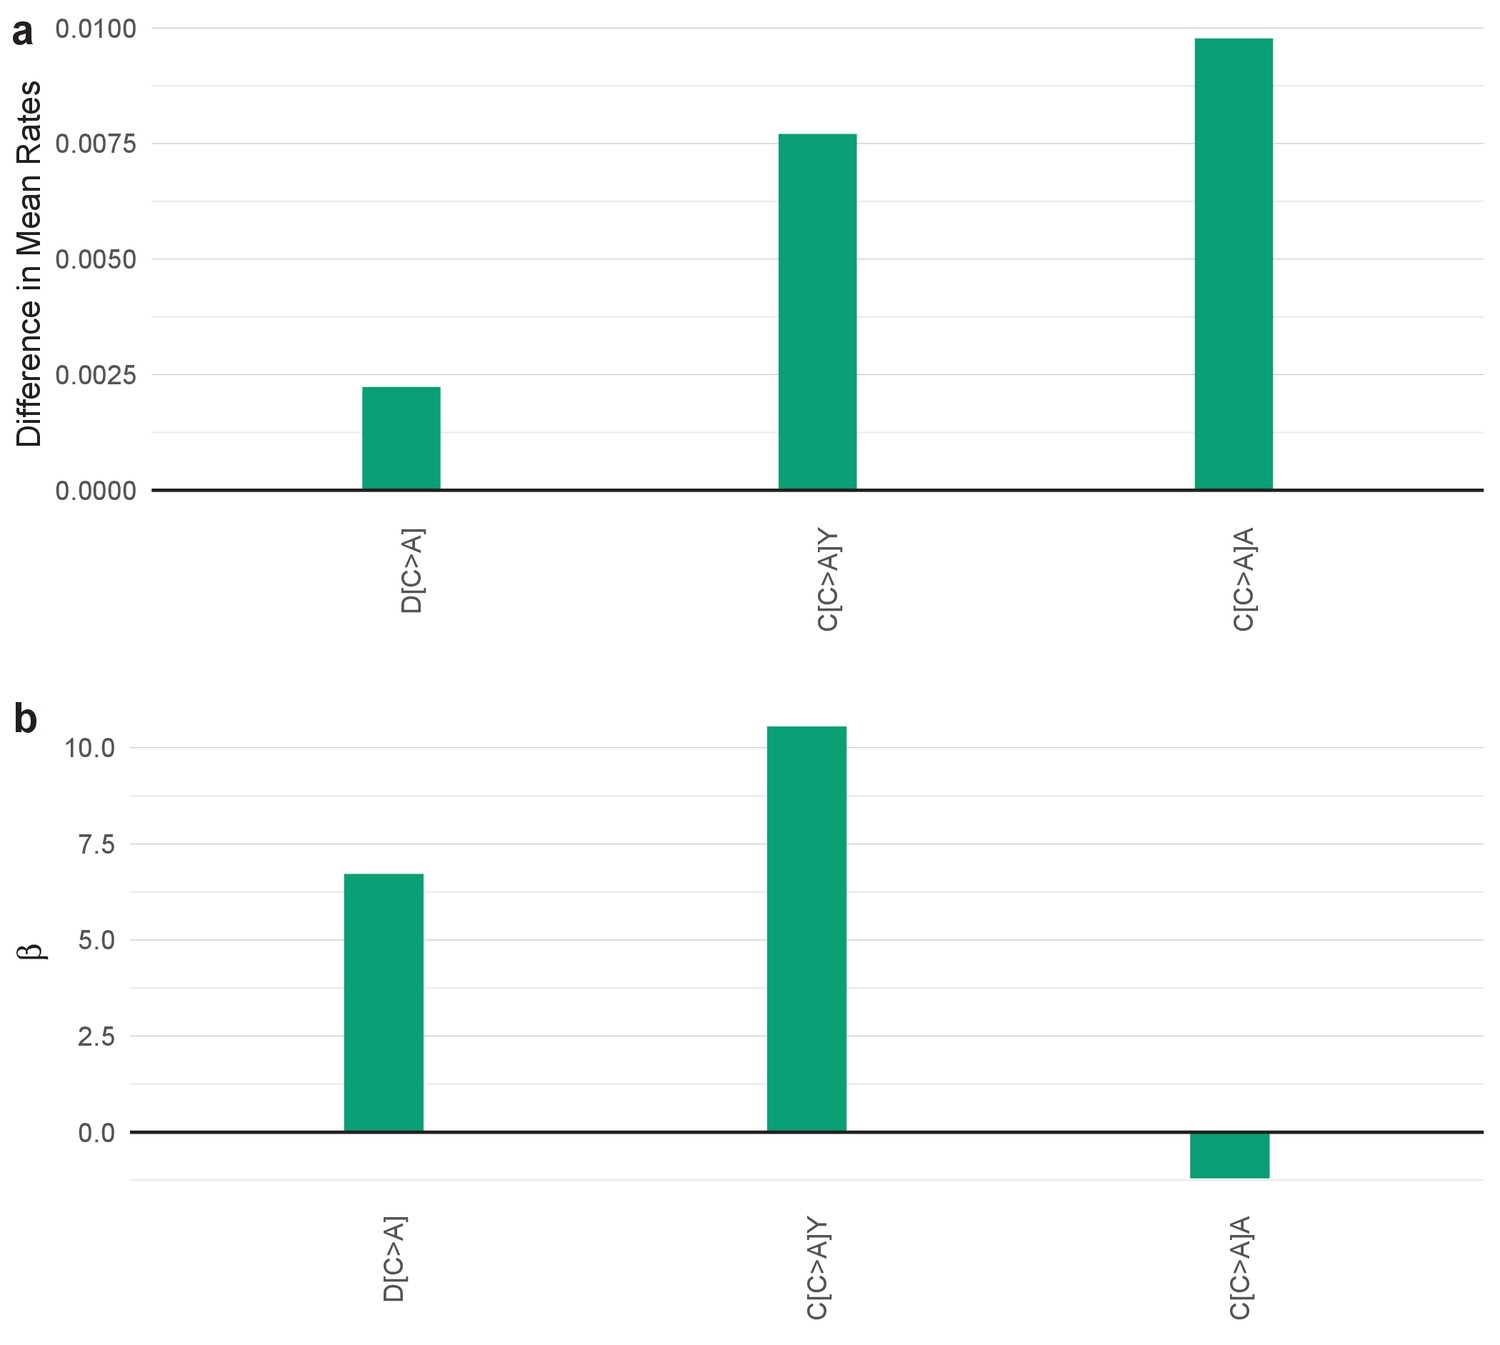
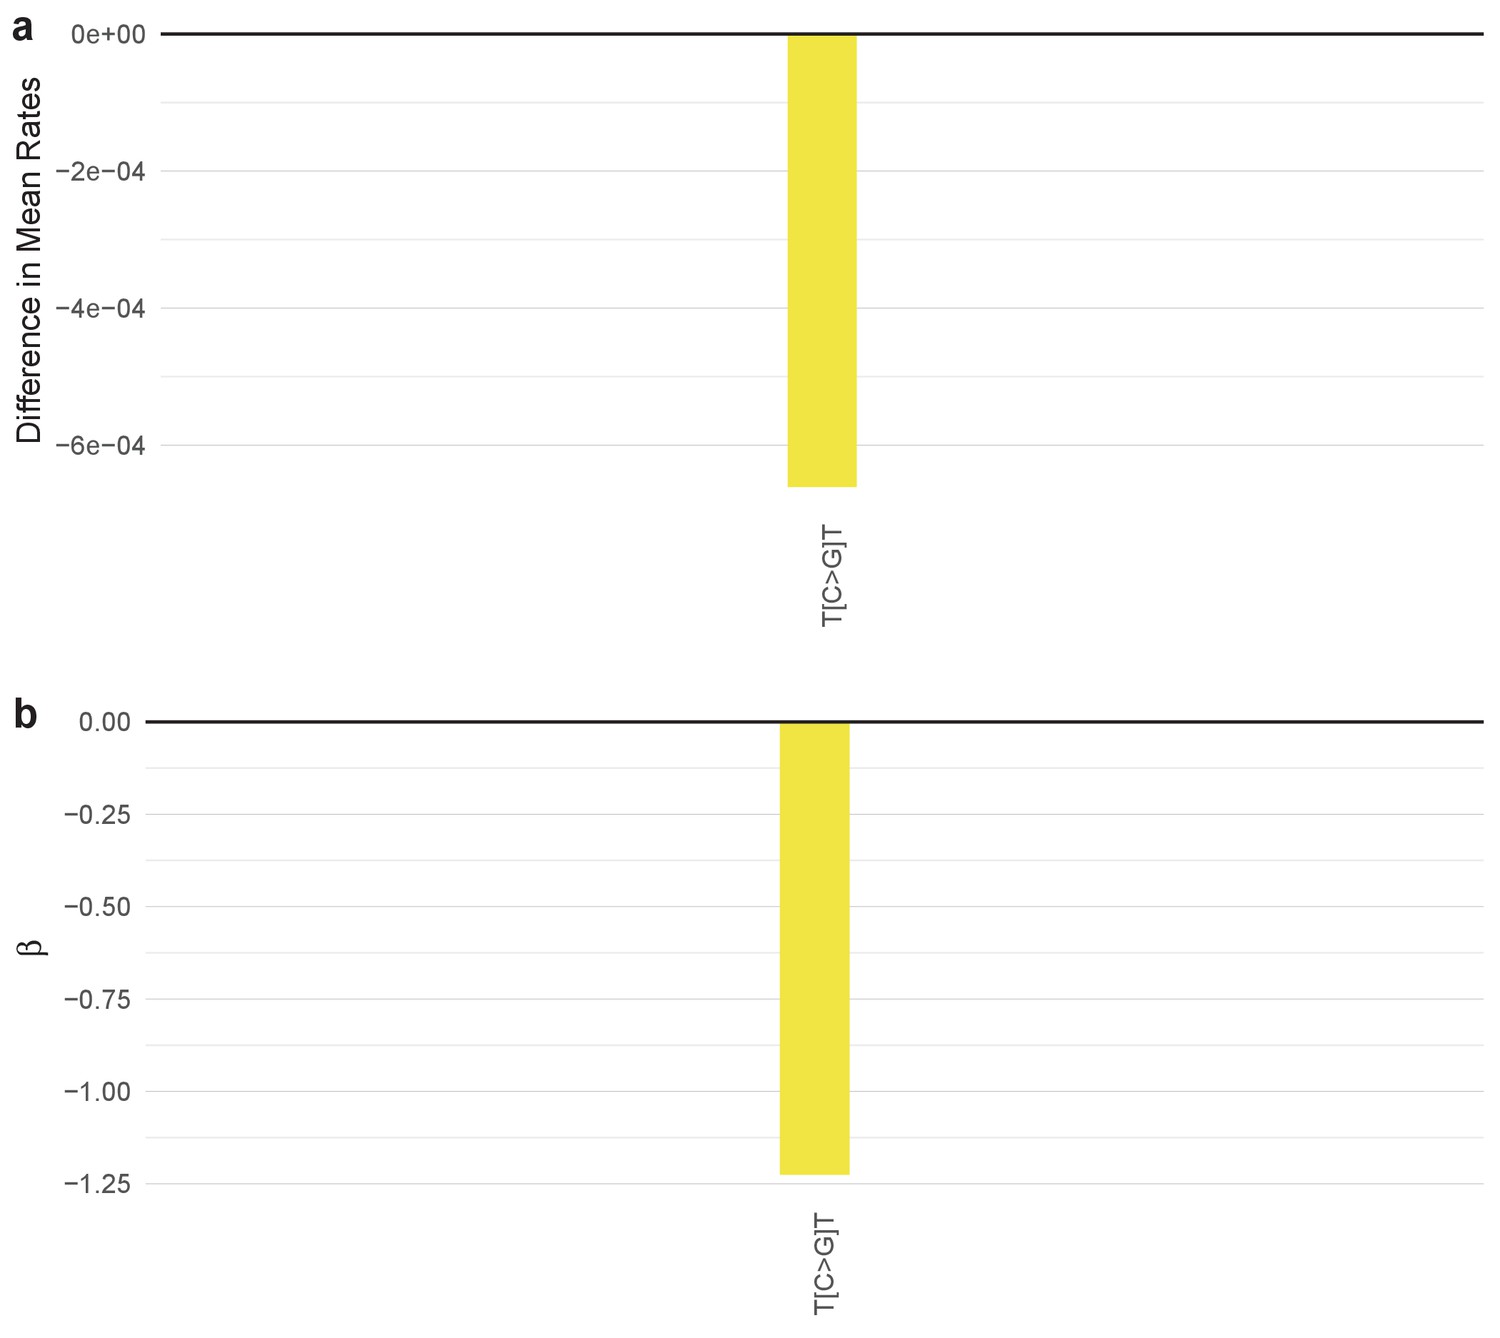
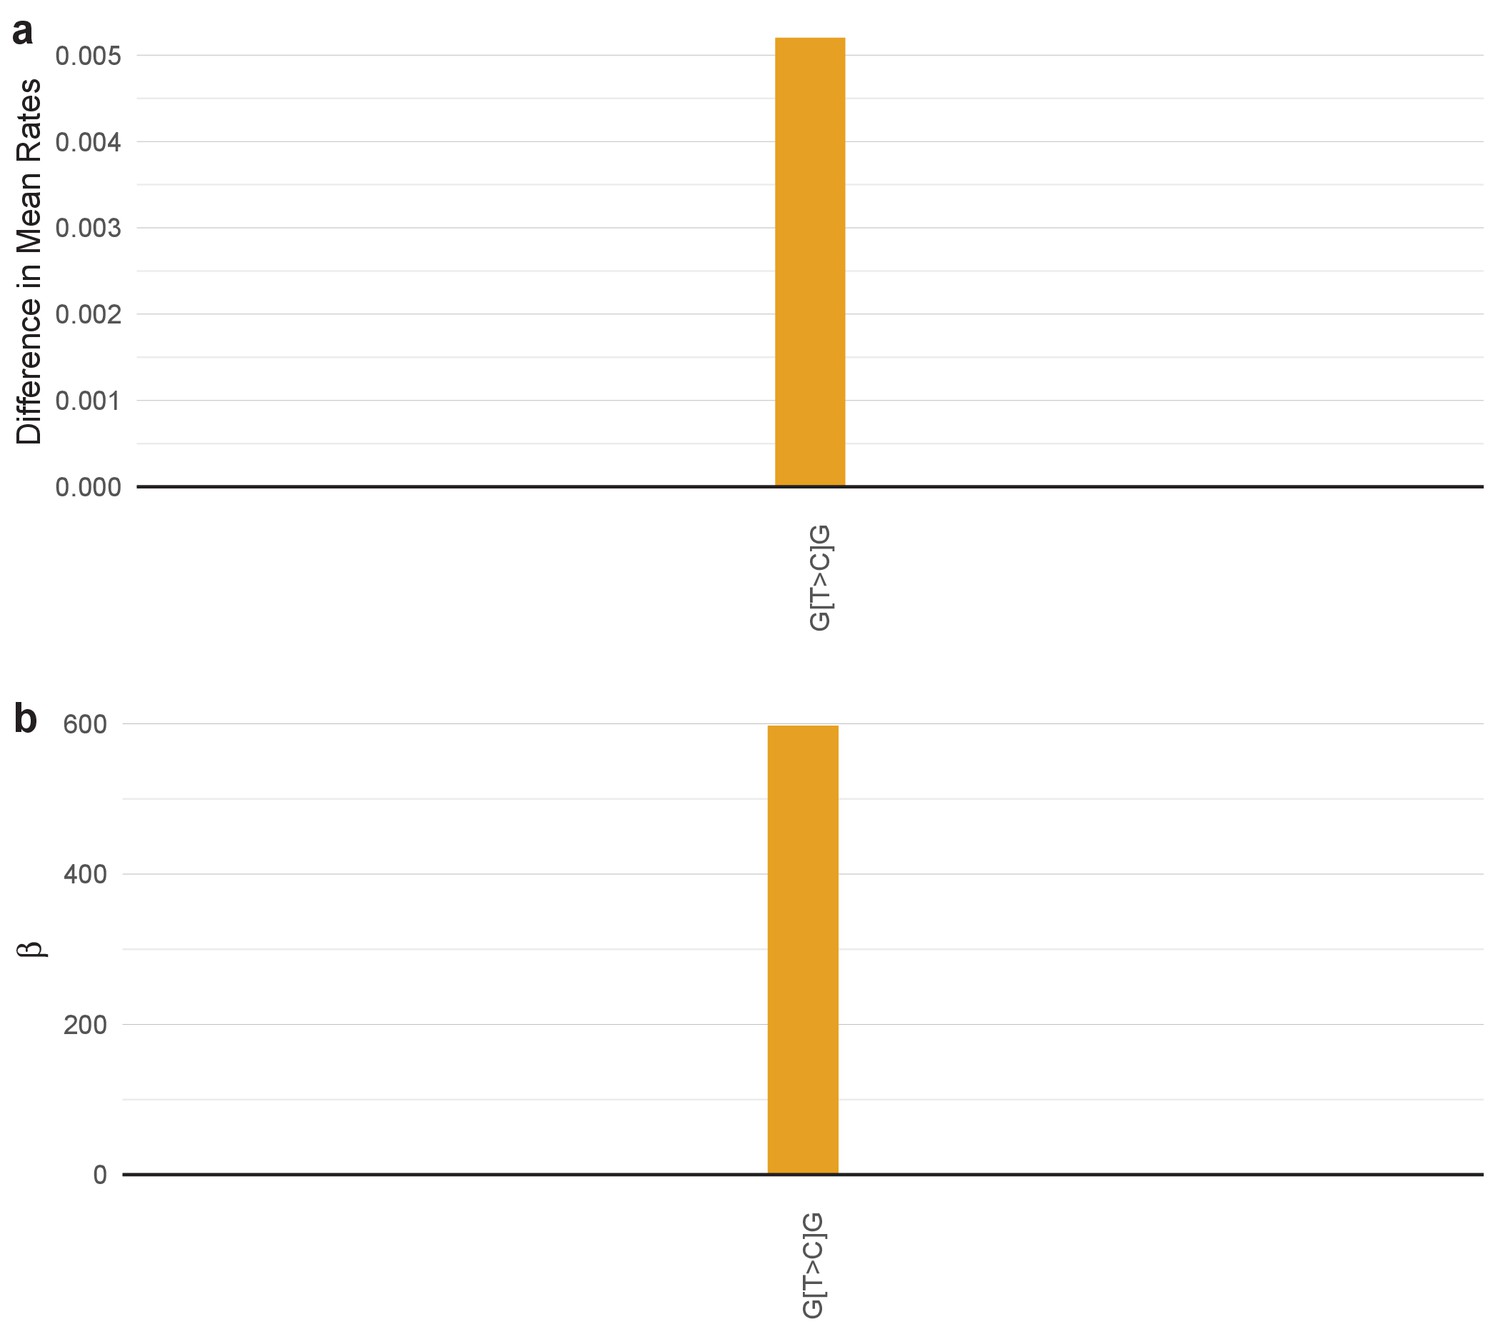
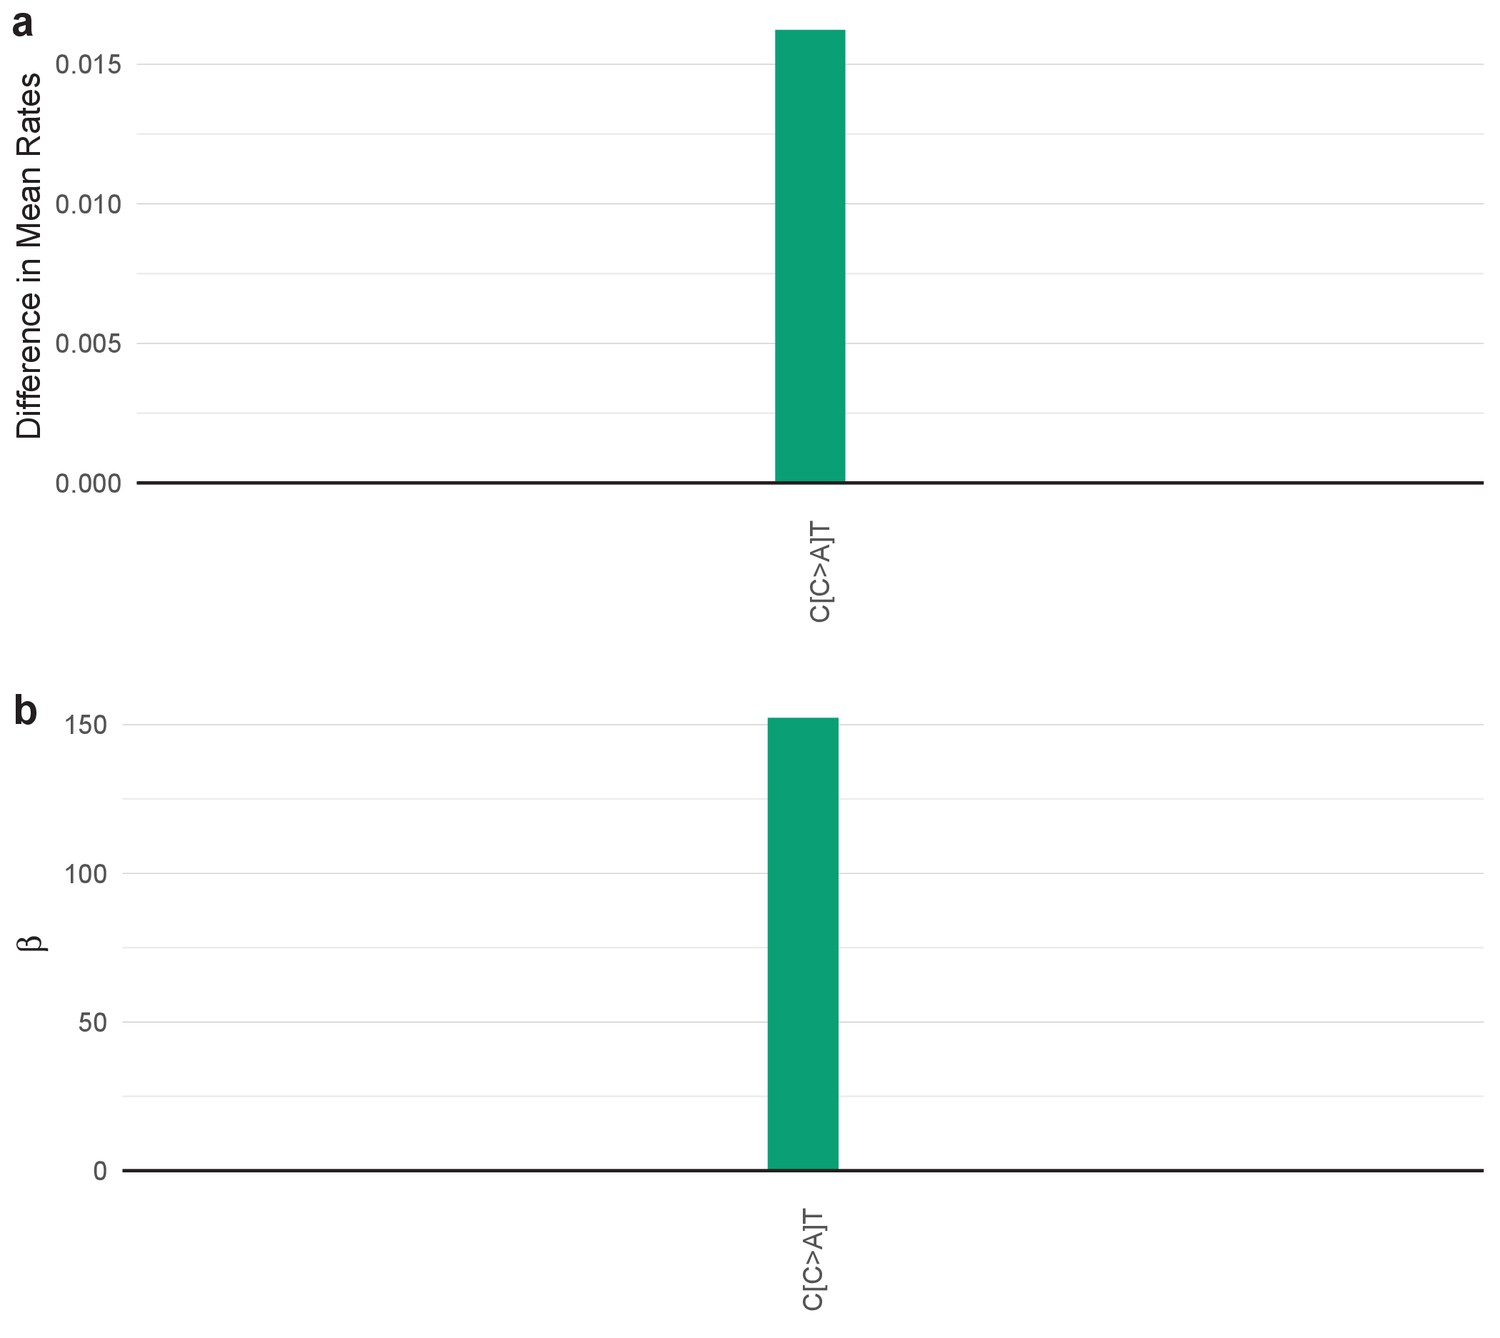
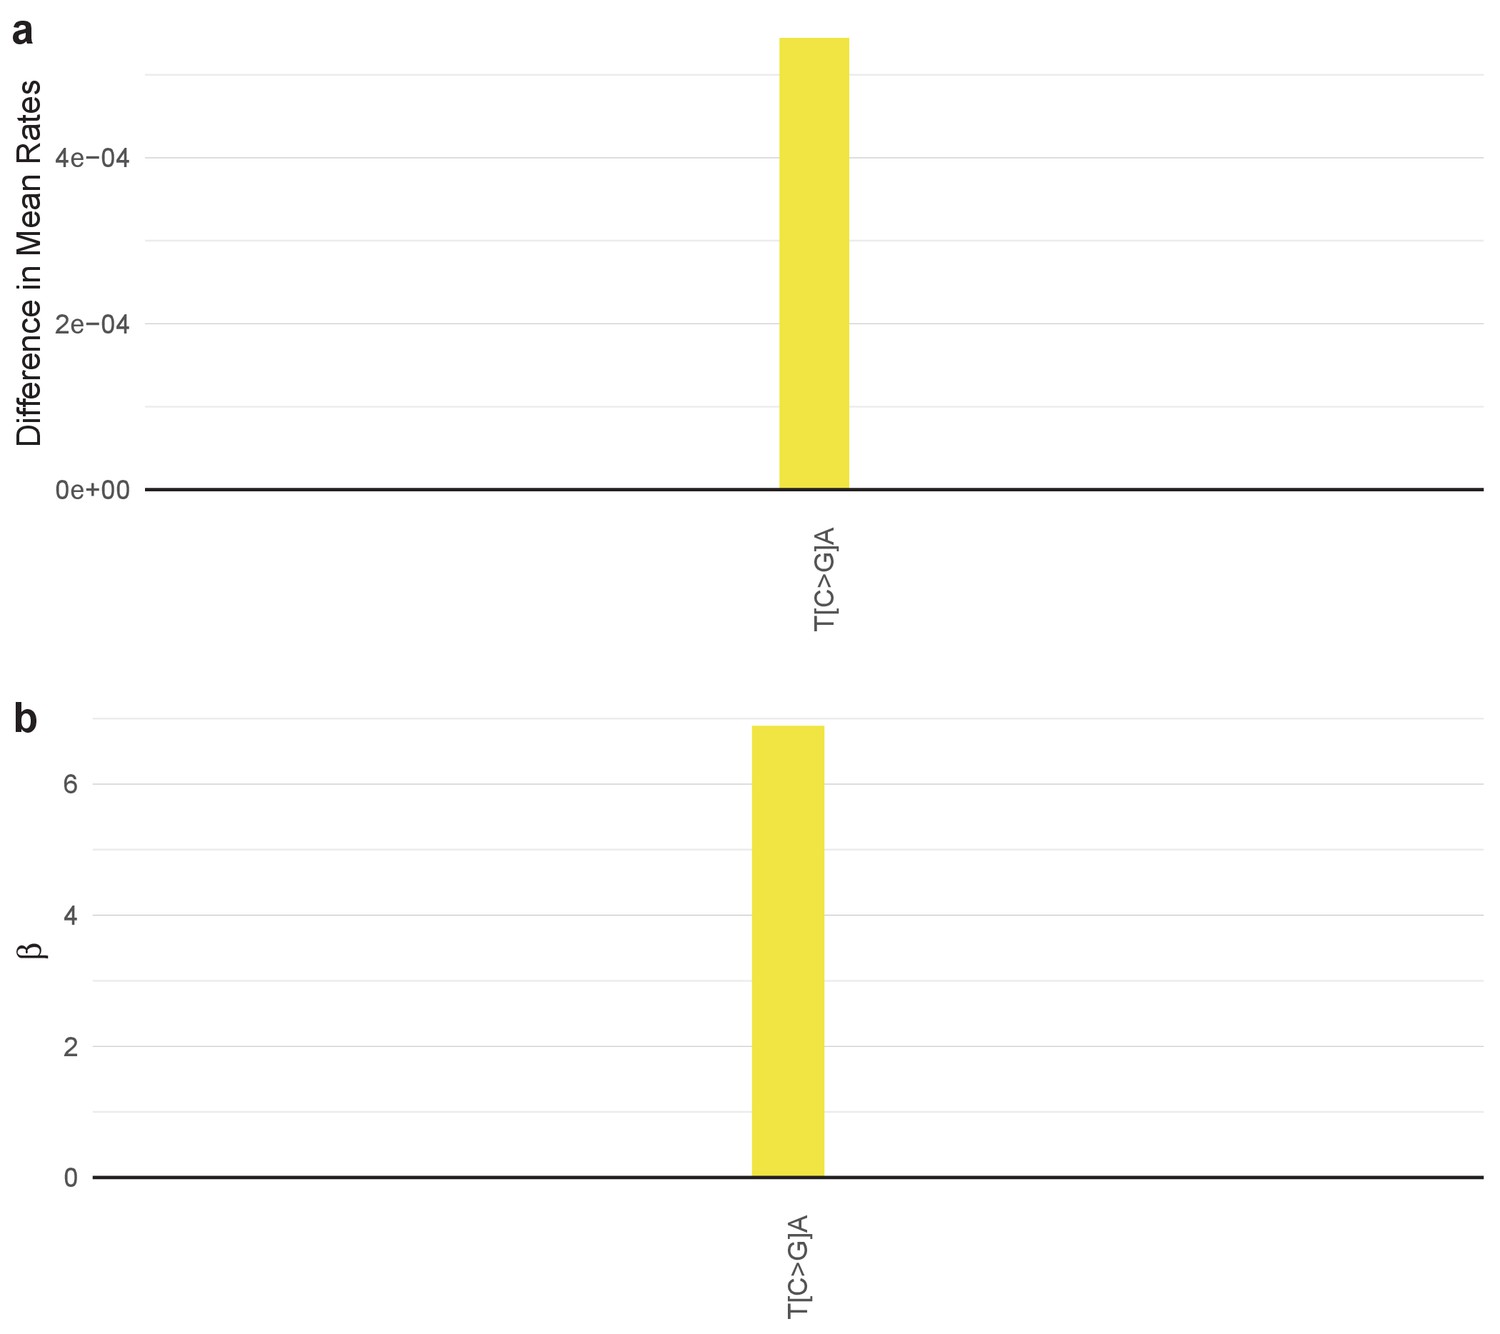
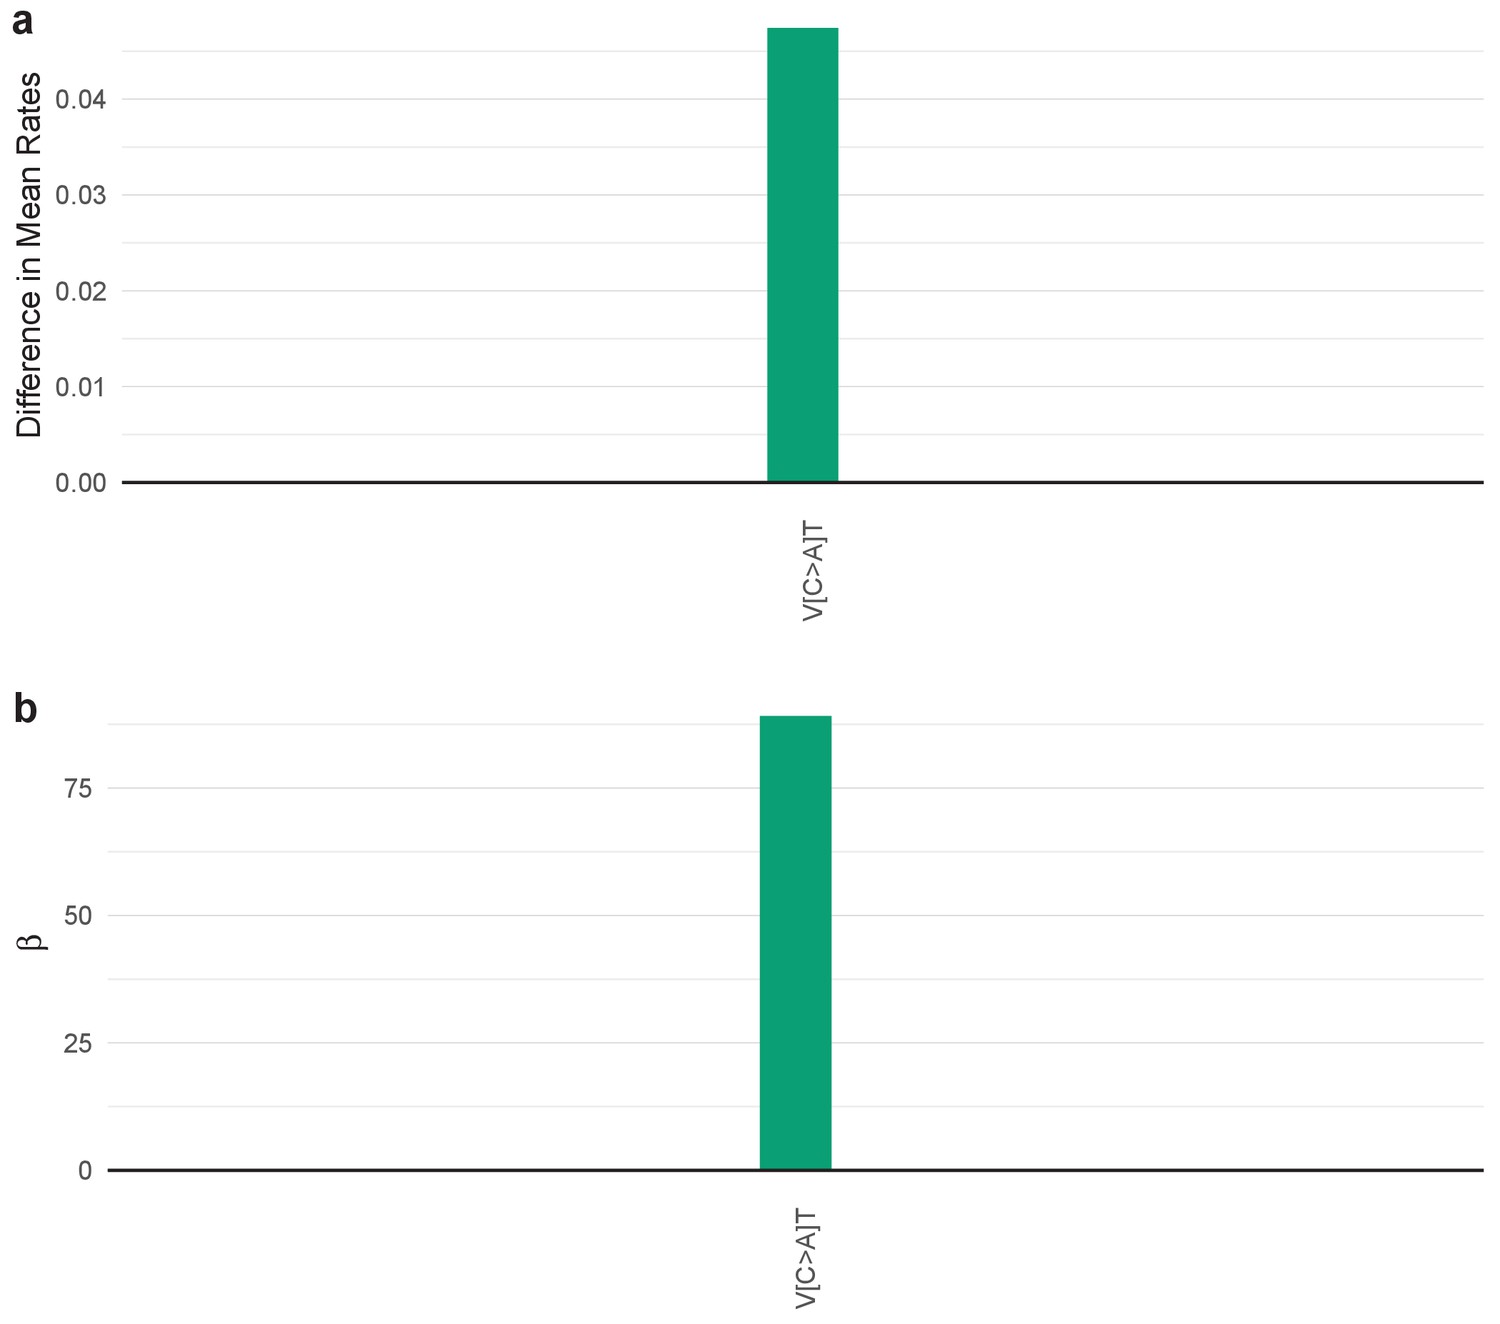
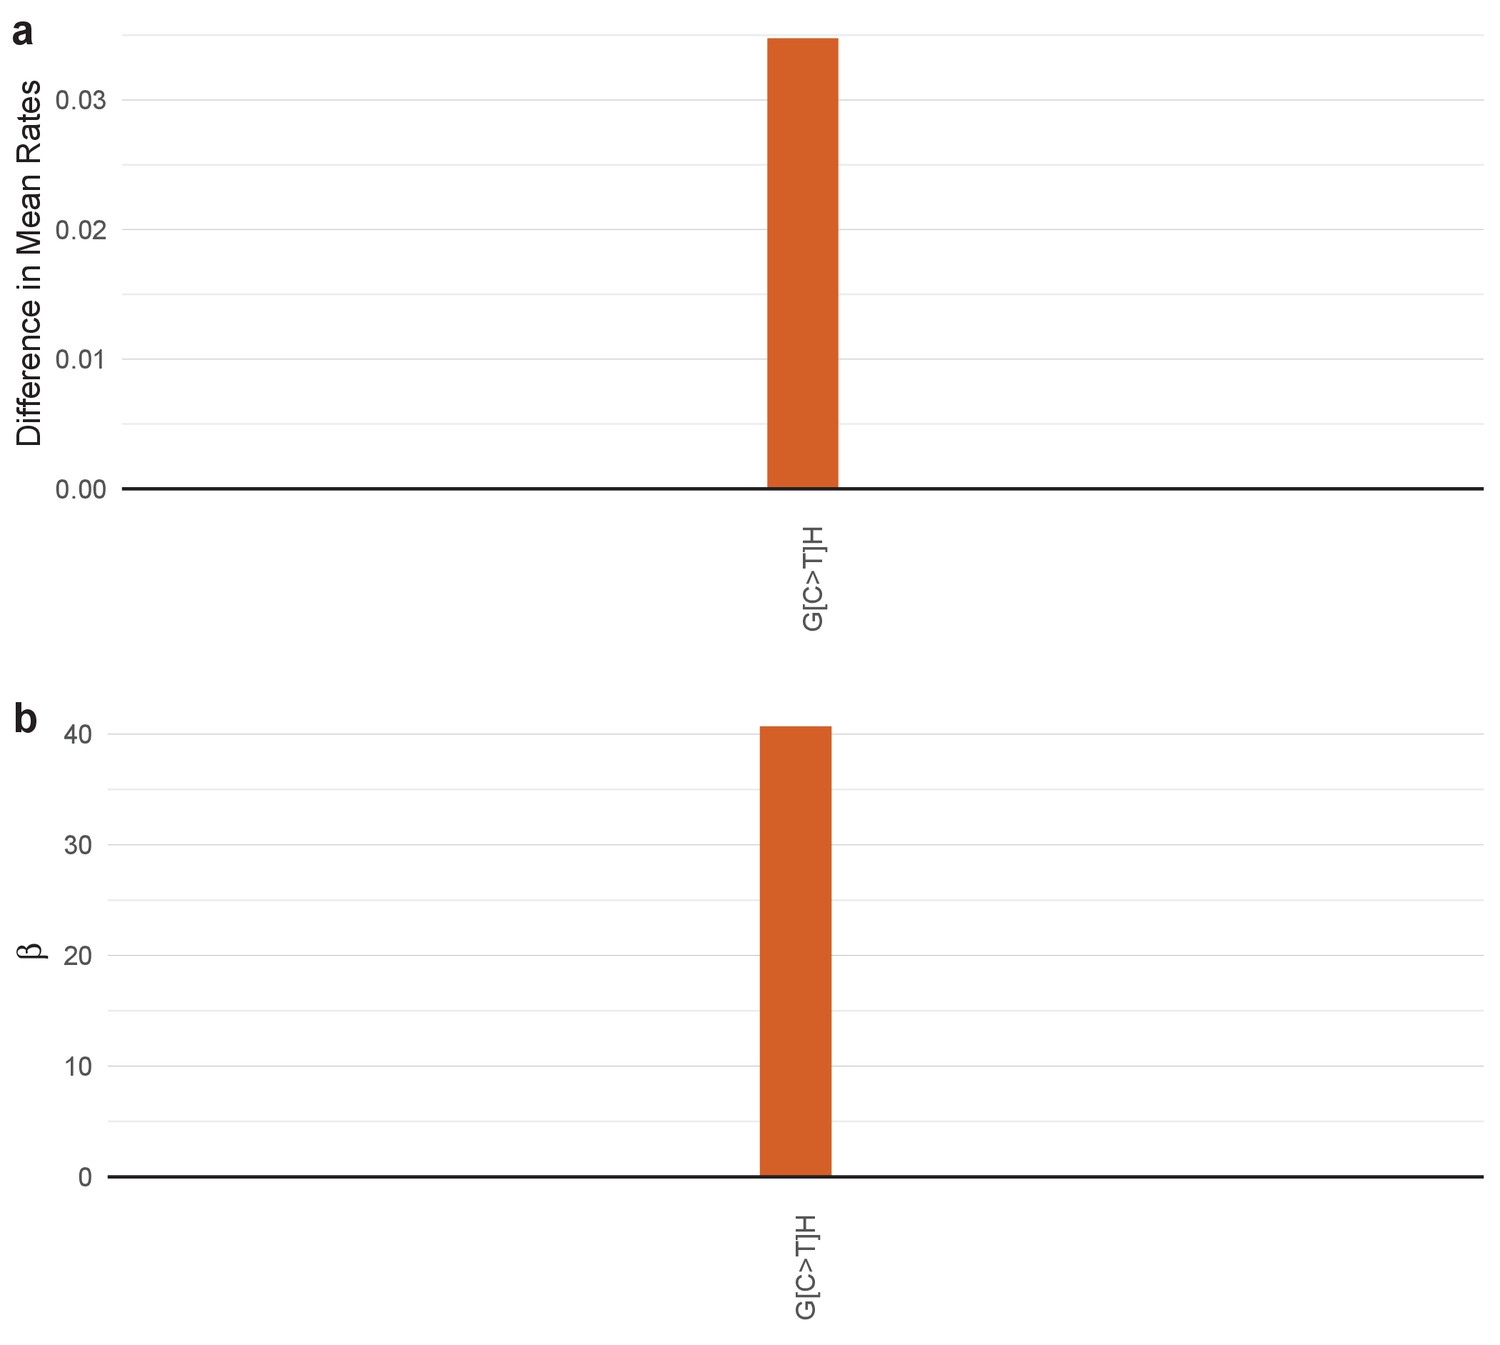
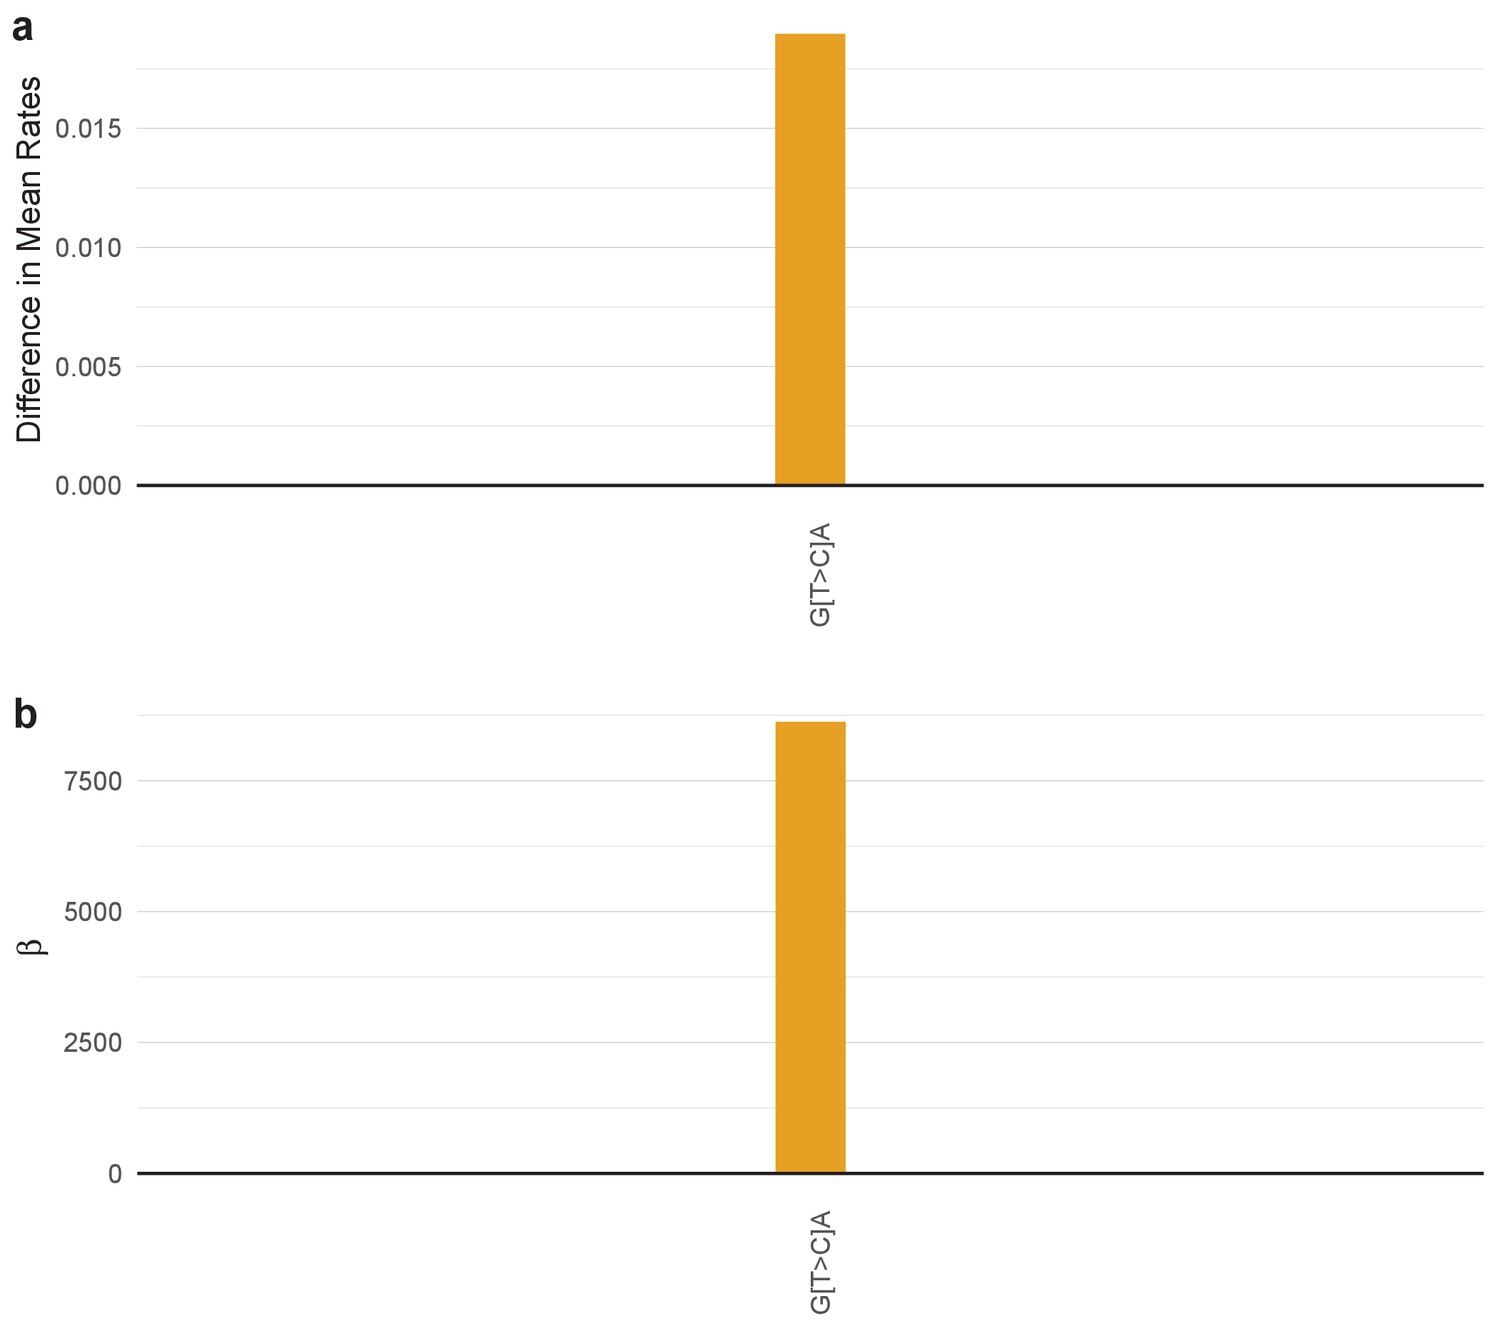
All predictive features of a signature are depicted (IUPAC notations: B=not A, D = not C, H = not G, V = not T, W = A or T, S = C or G, M = A or C, K = G or T, R = A or G, Y = C or T). The color of each bar is representing the point mutation type as follows: C to T mutations = red, C to A = green, C to G = yellow, T to C = orange, T to G = purple, T to A = blue. The difference in the mean mutation count (for age) or in the mean rate (=mutation count/age, for all other exposures) between exposed and unexposed (old versus young for the age signature) is reported for each predictive feature. (a) Examples of age signatures. Figure 4—figure supplements 1–30 and Supplementary file 2 for the full list. (b) Examples of environmental, DNA polymerization or repair, and other factors’ signatures. Figure 4—figure supplements 31–67 and Supplementary file 2 for the full list. (c) Examples of smoking signatures in different tissues. The three smoking SuperSigs presented here are the ones that achieved an AUC > 0.60 in cross-validation. See Figure 4—figure supplements 59–66 and Supplementary file 2 for the full list.
Figure 4—figure supplement 1
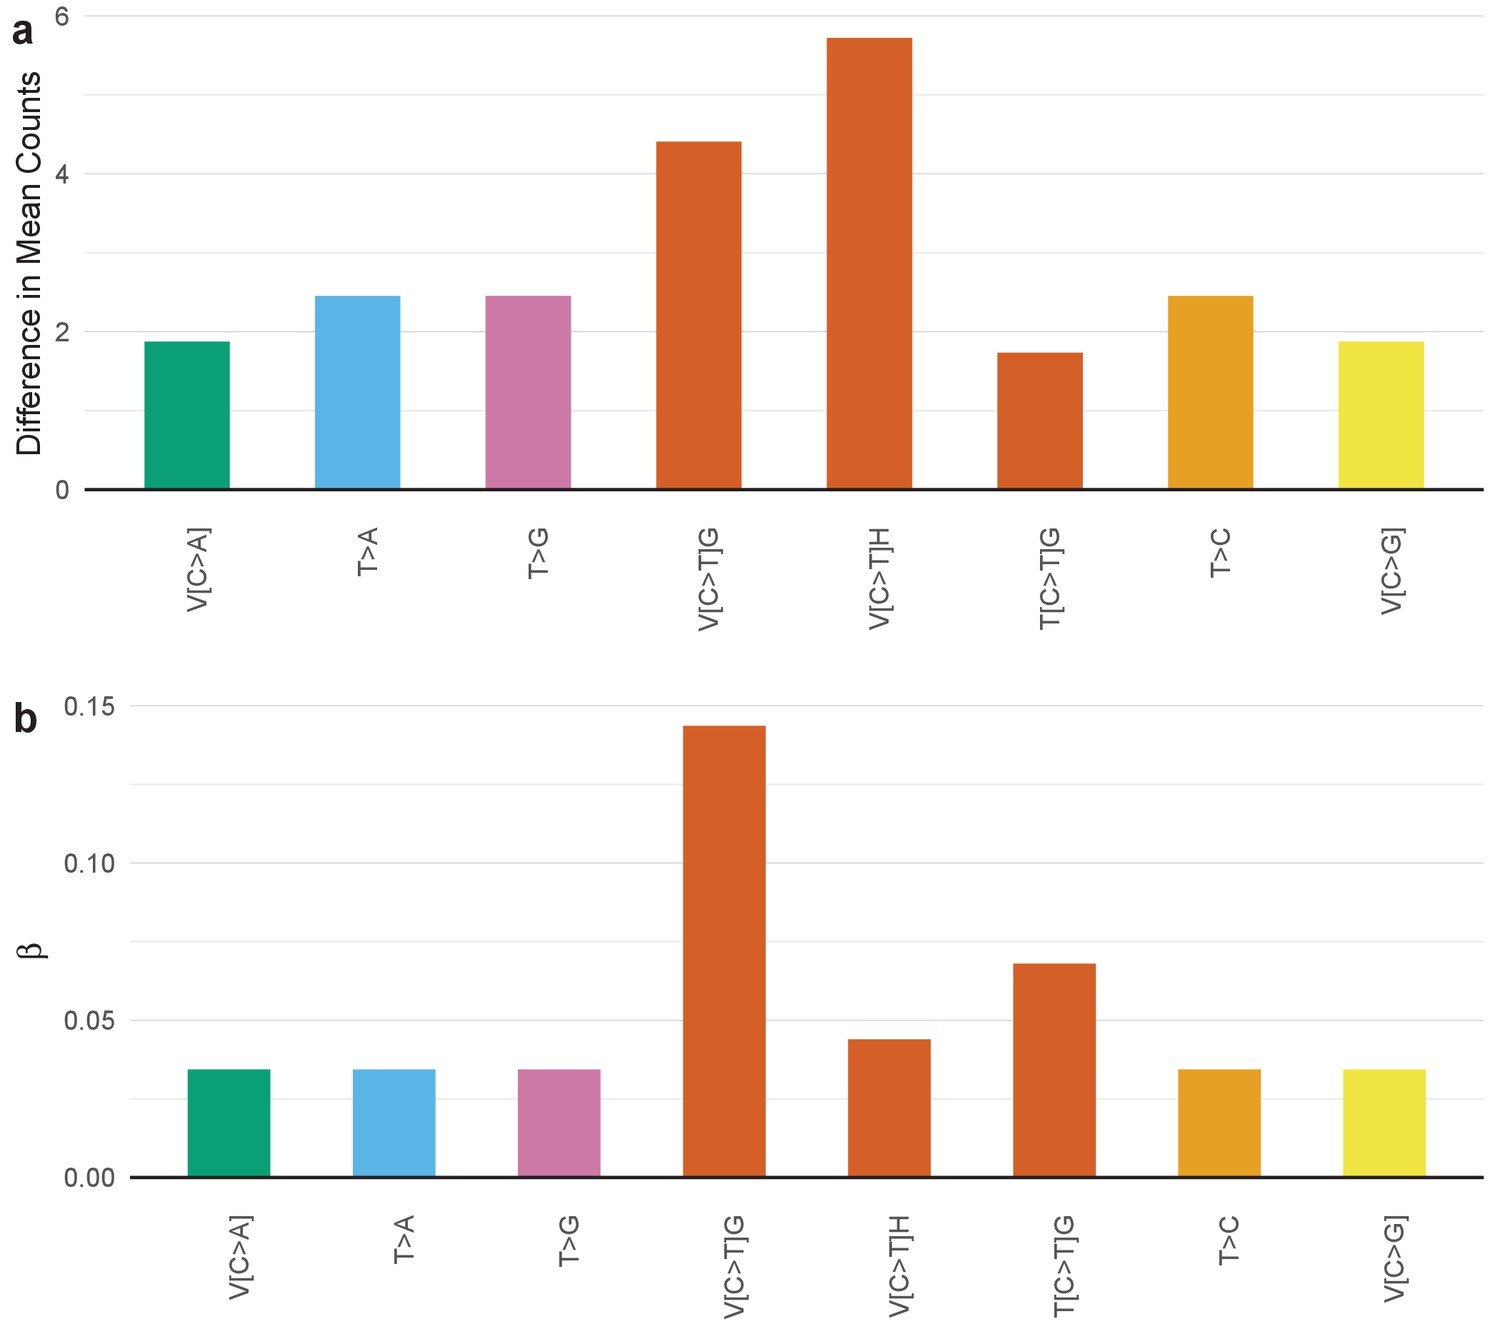
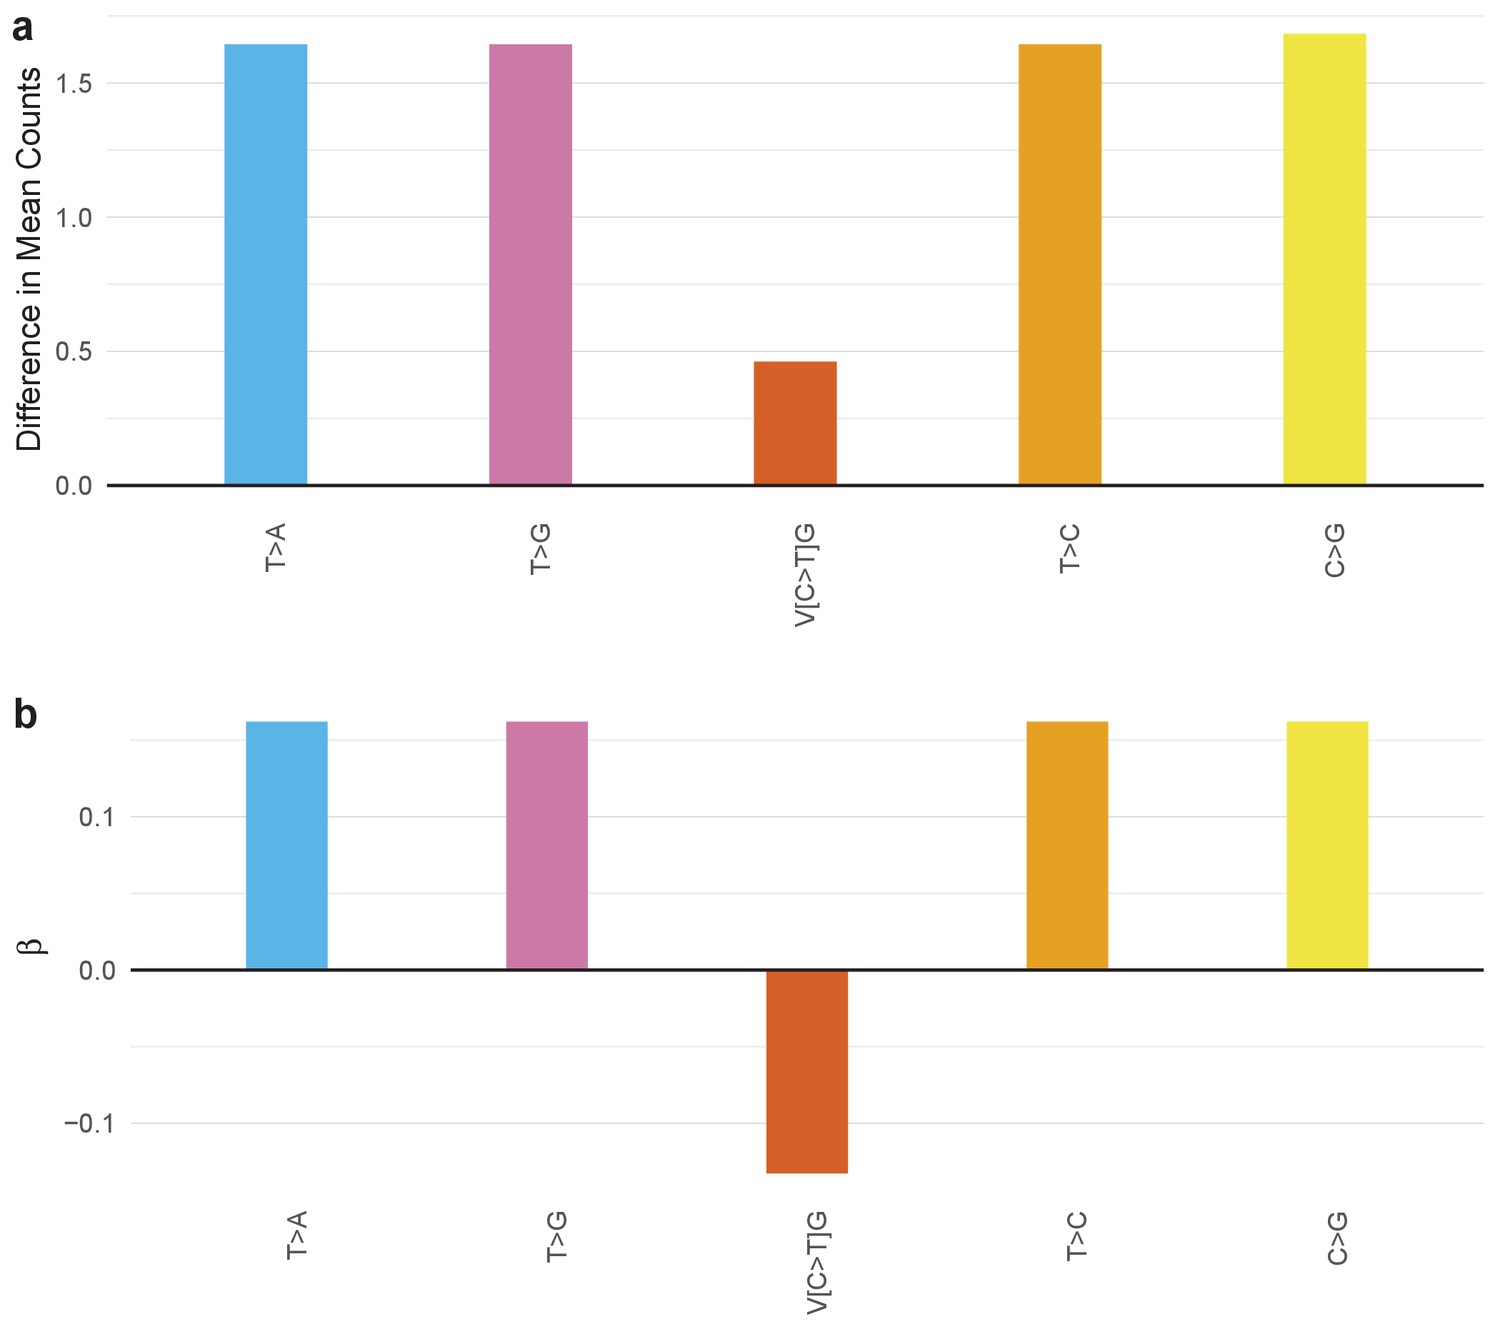
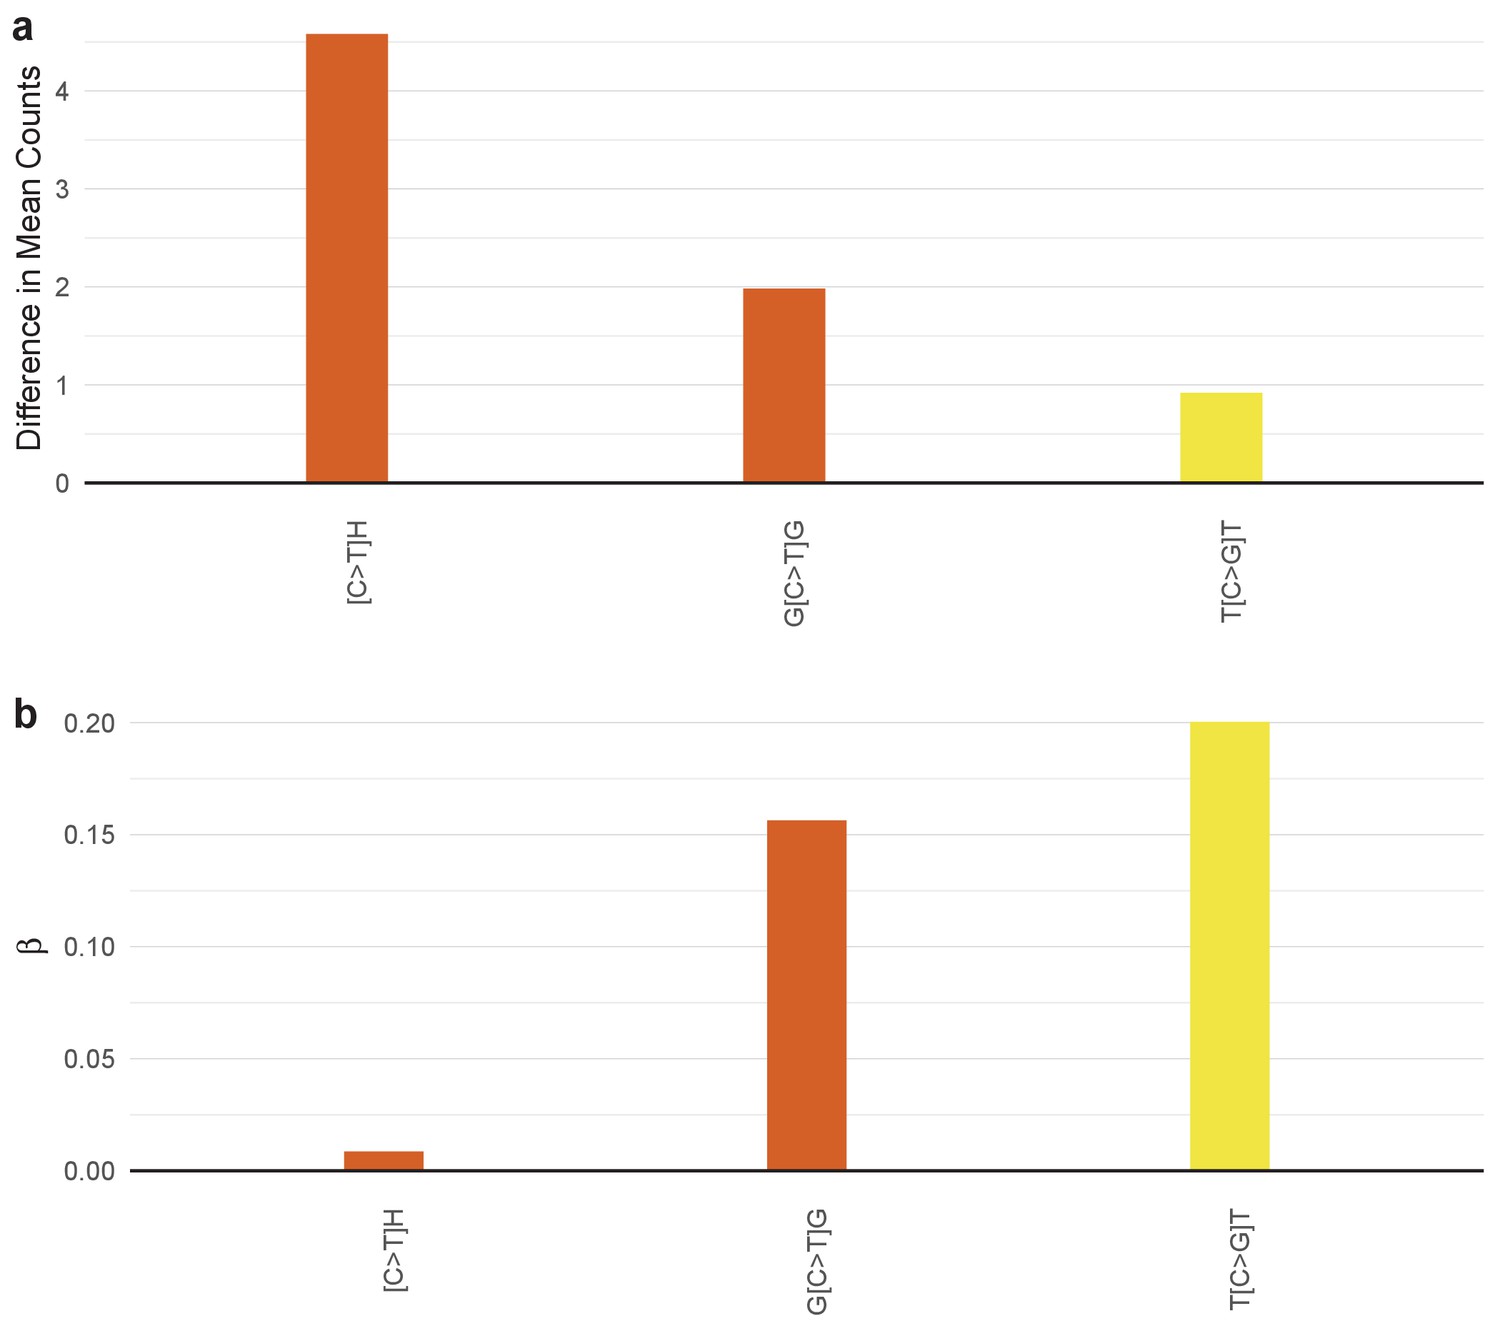
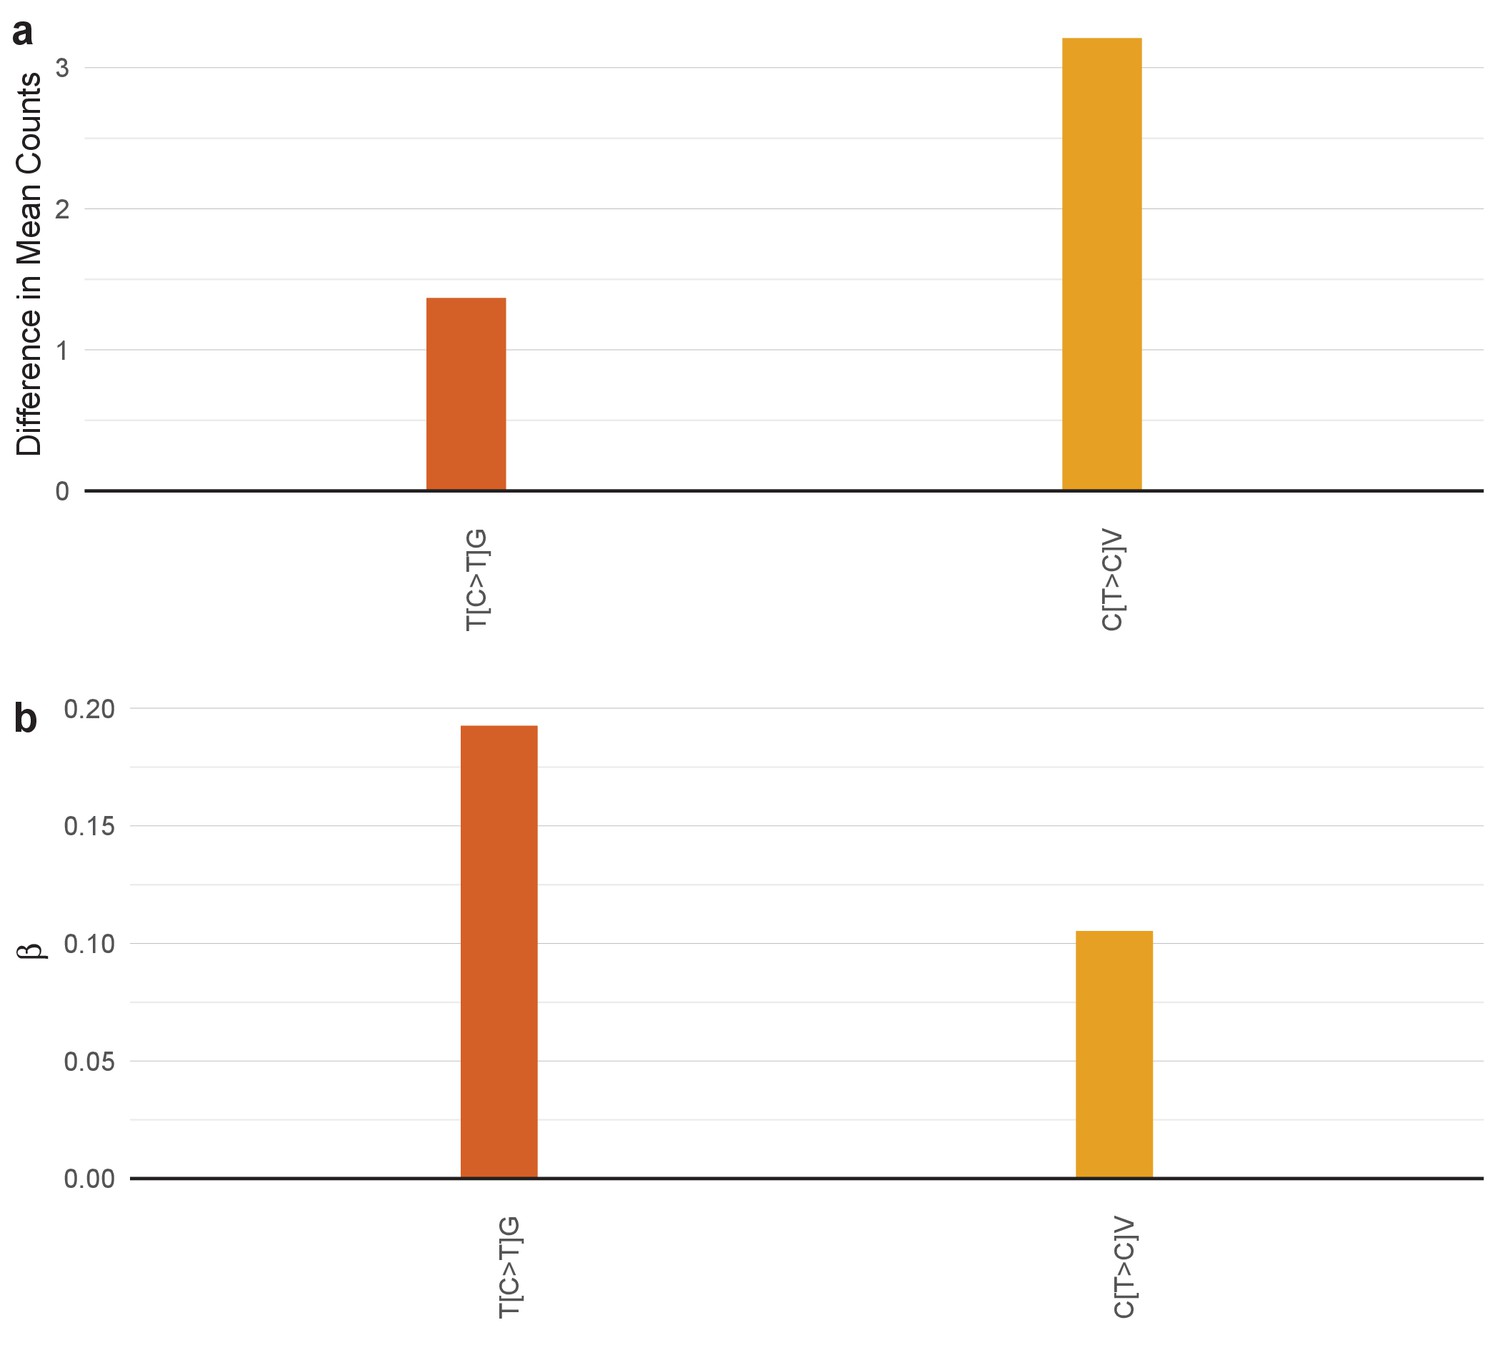
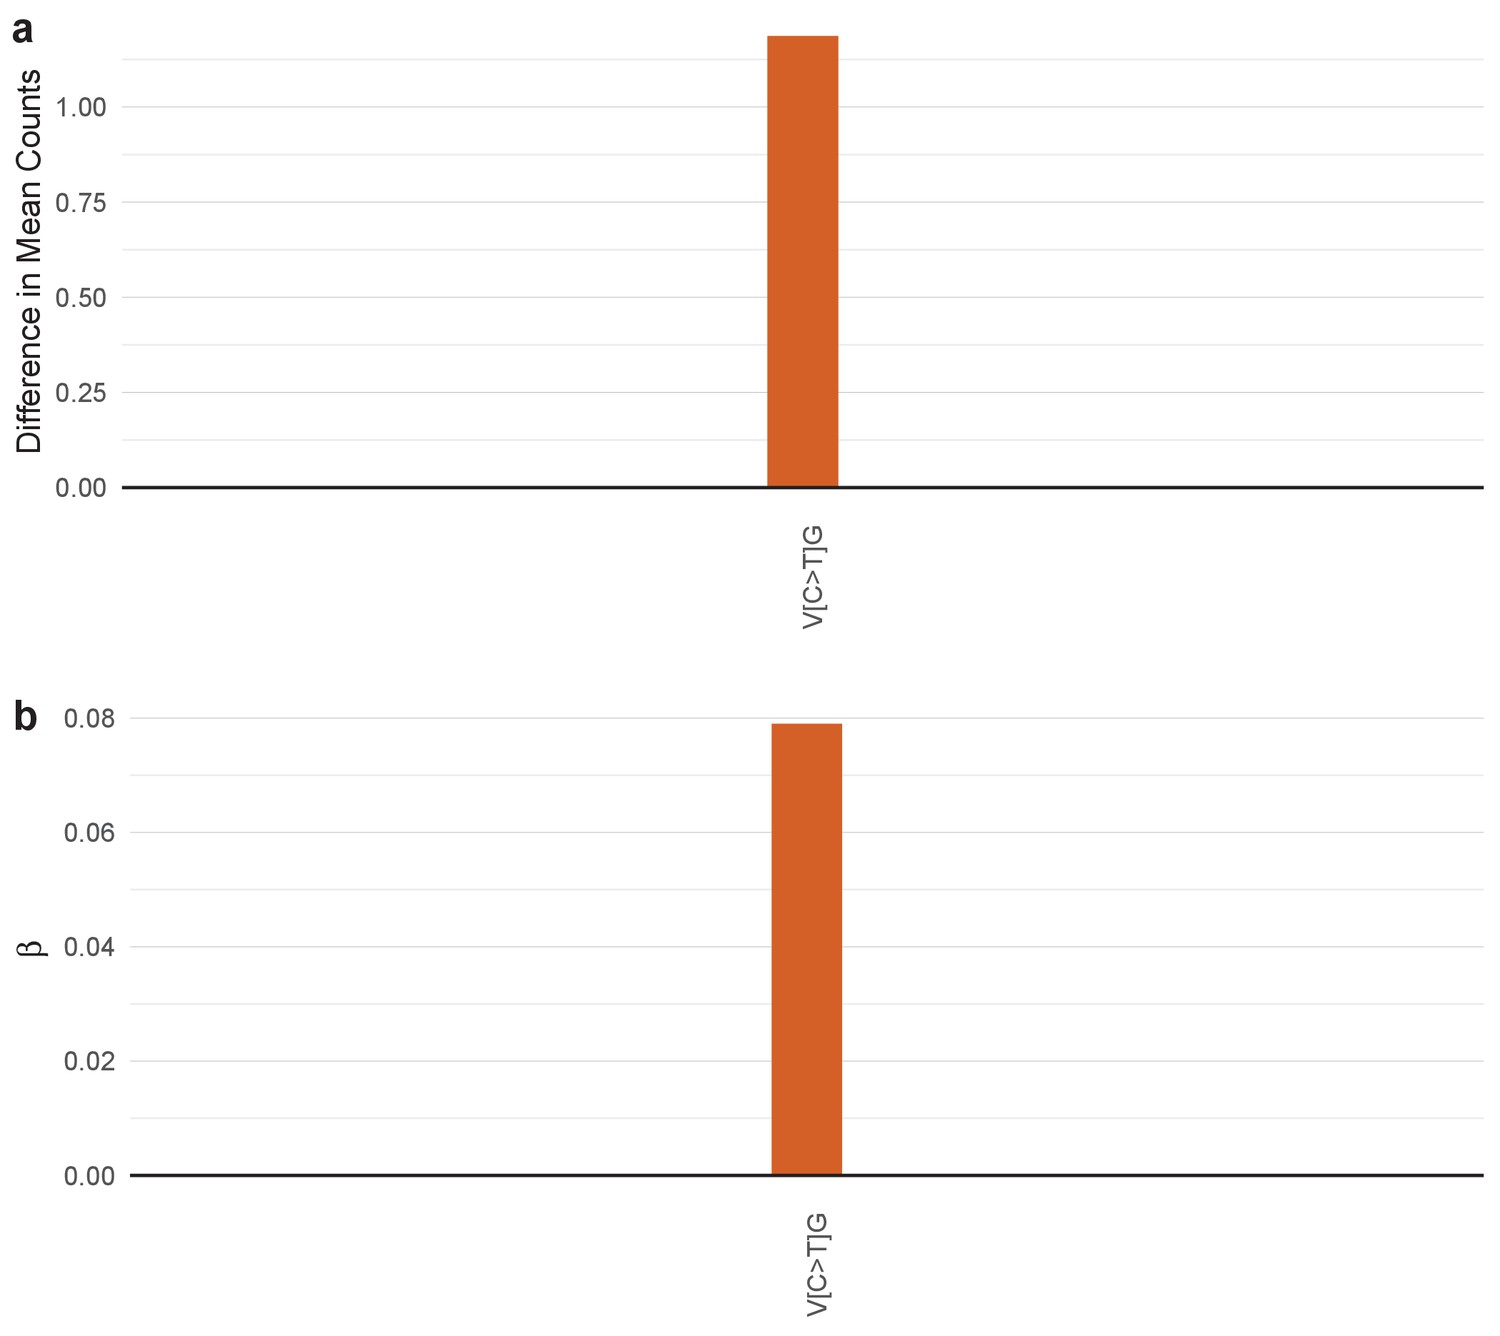
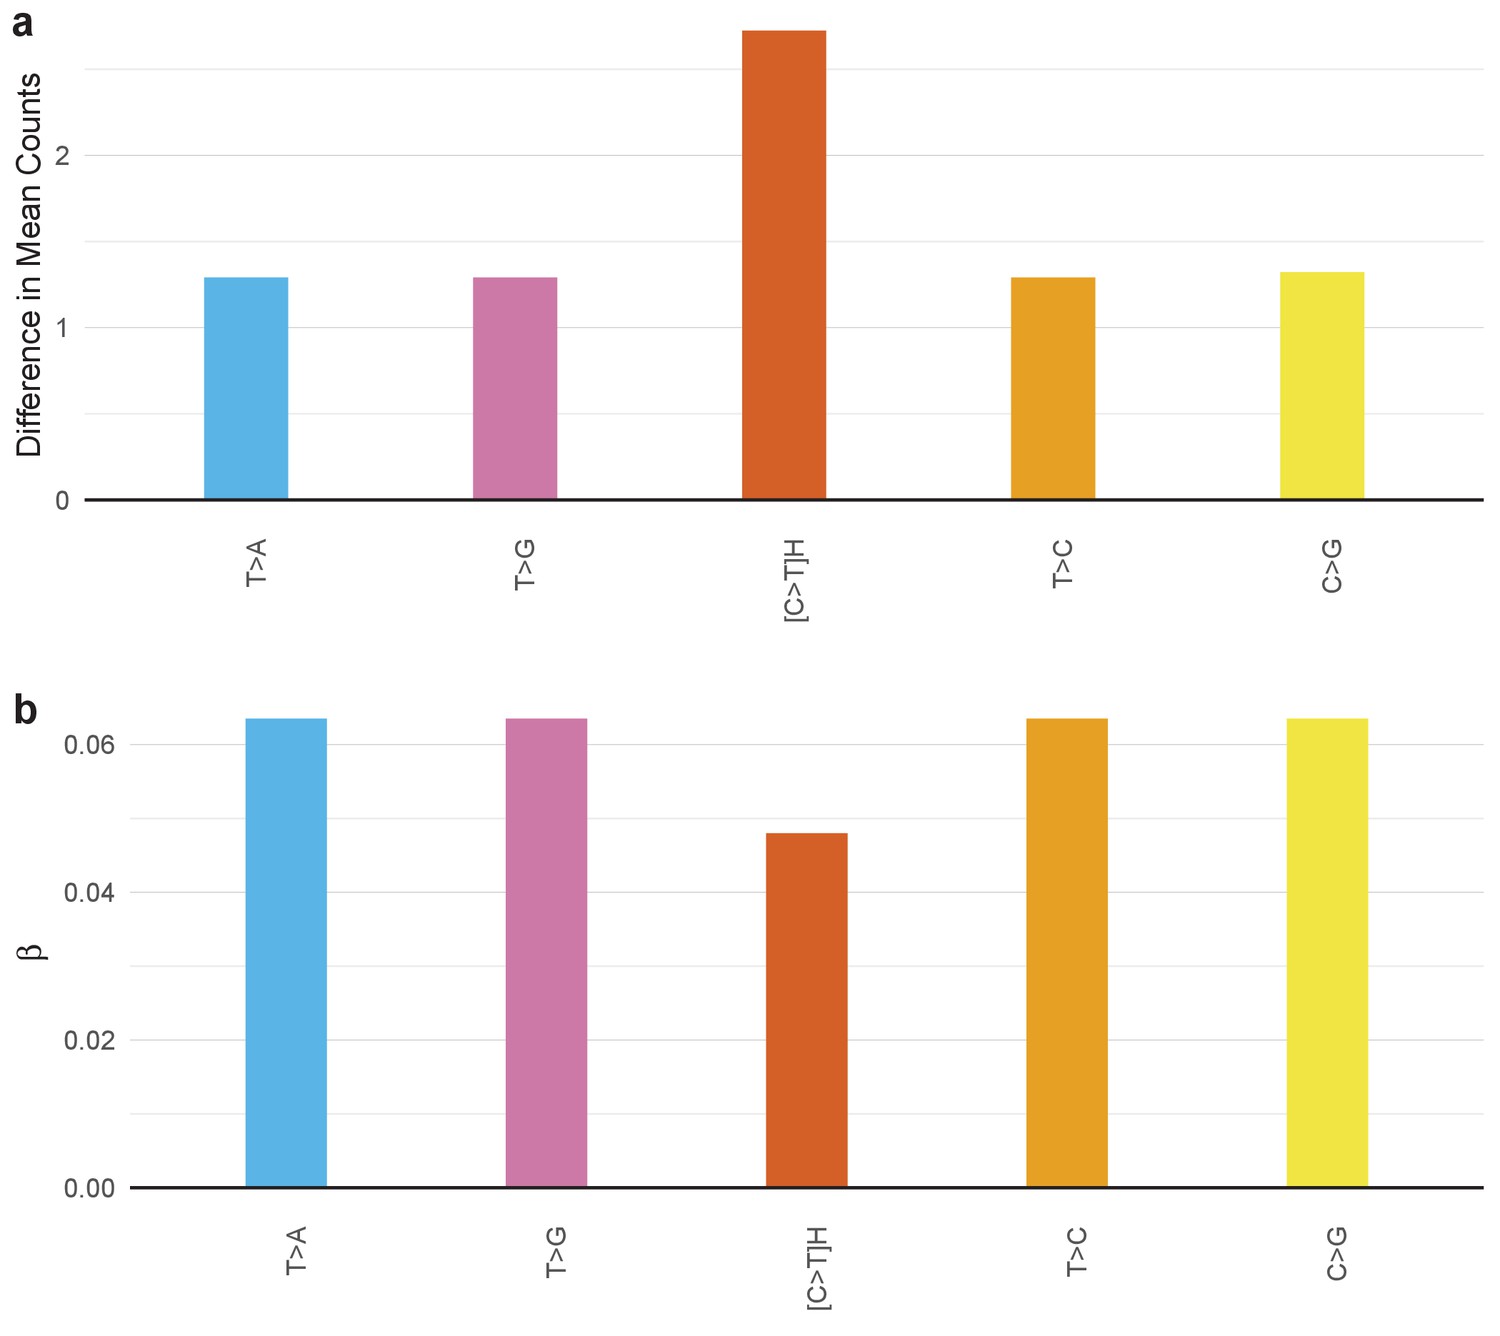
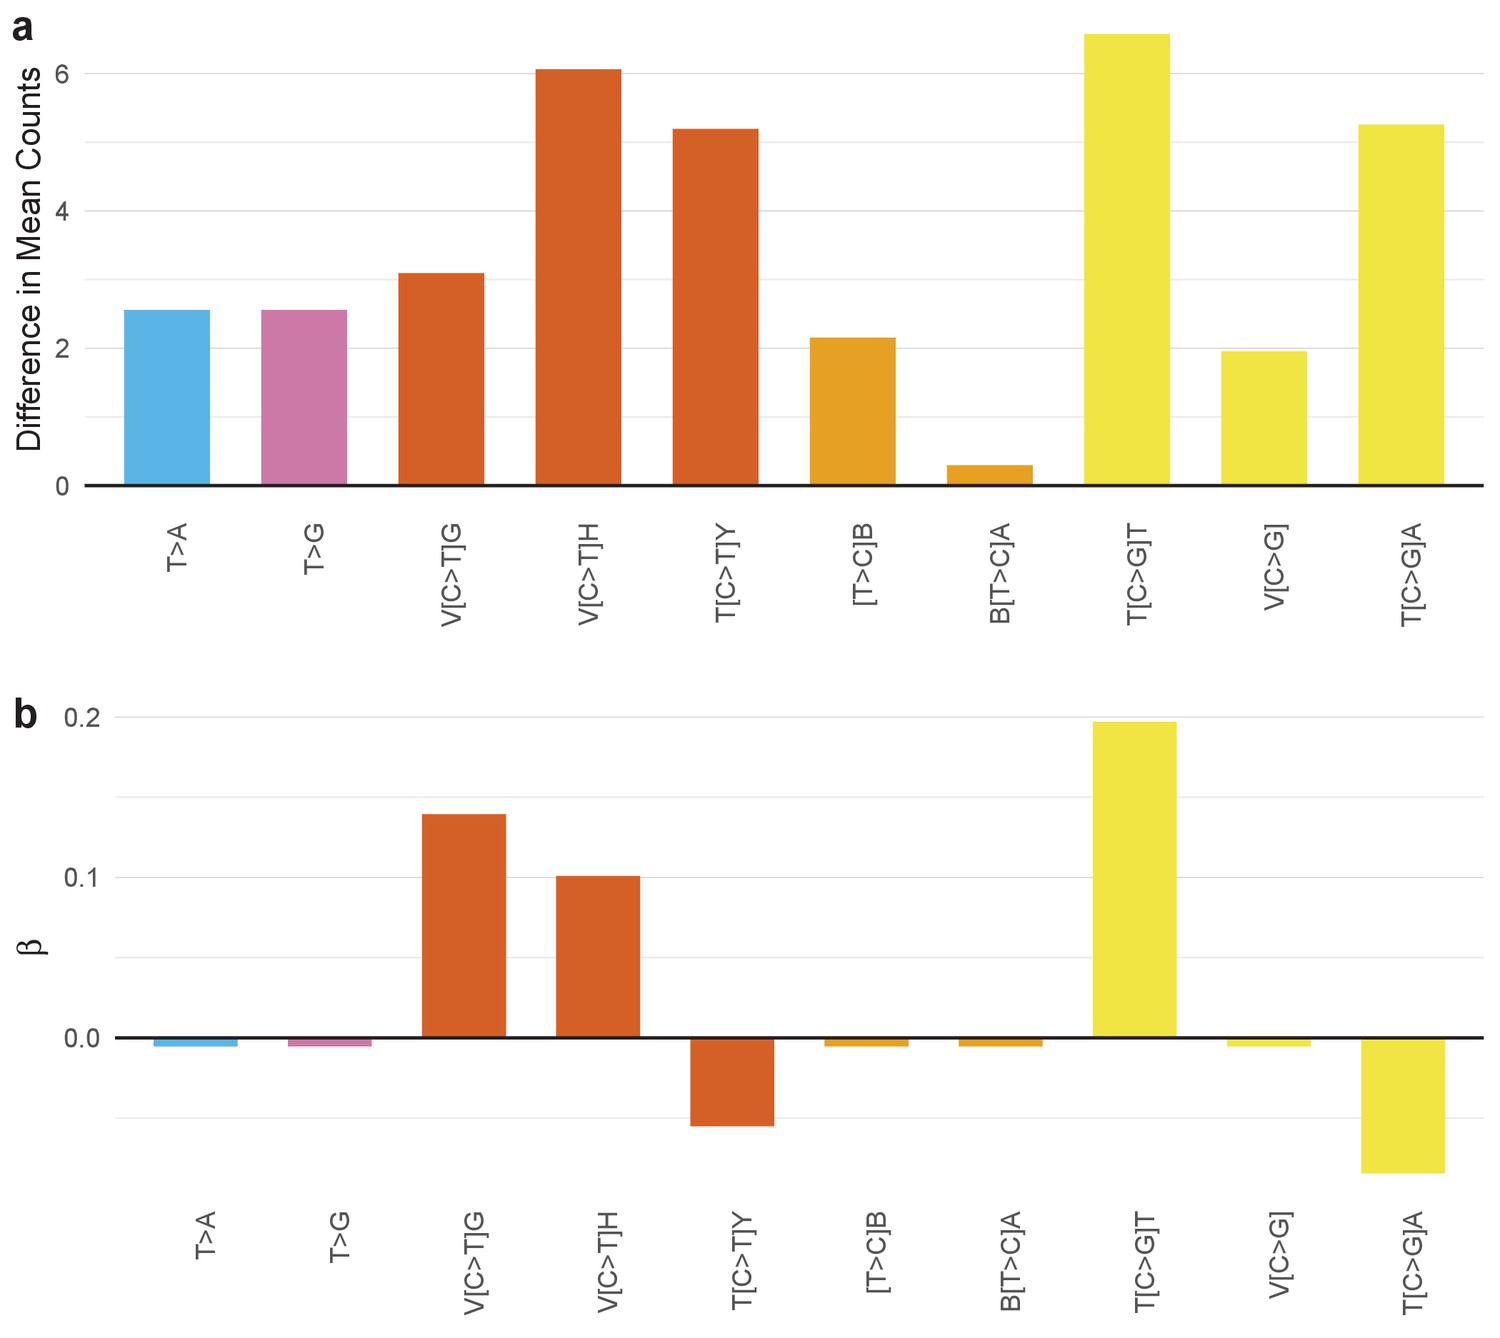
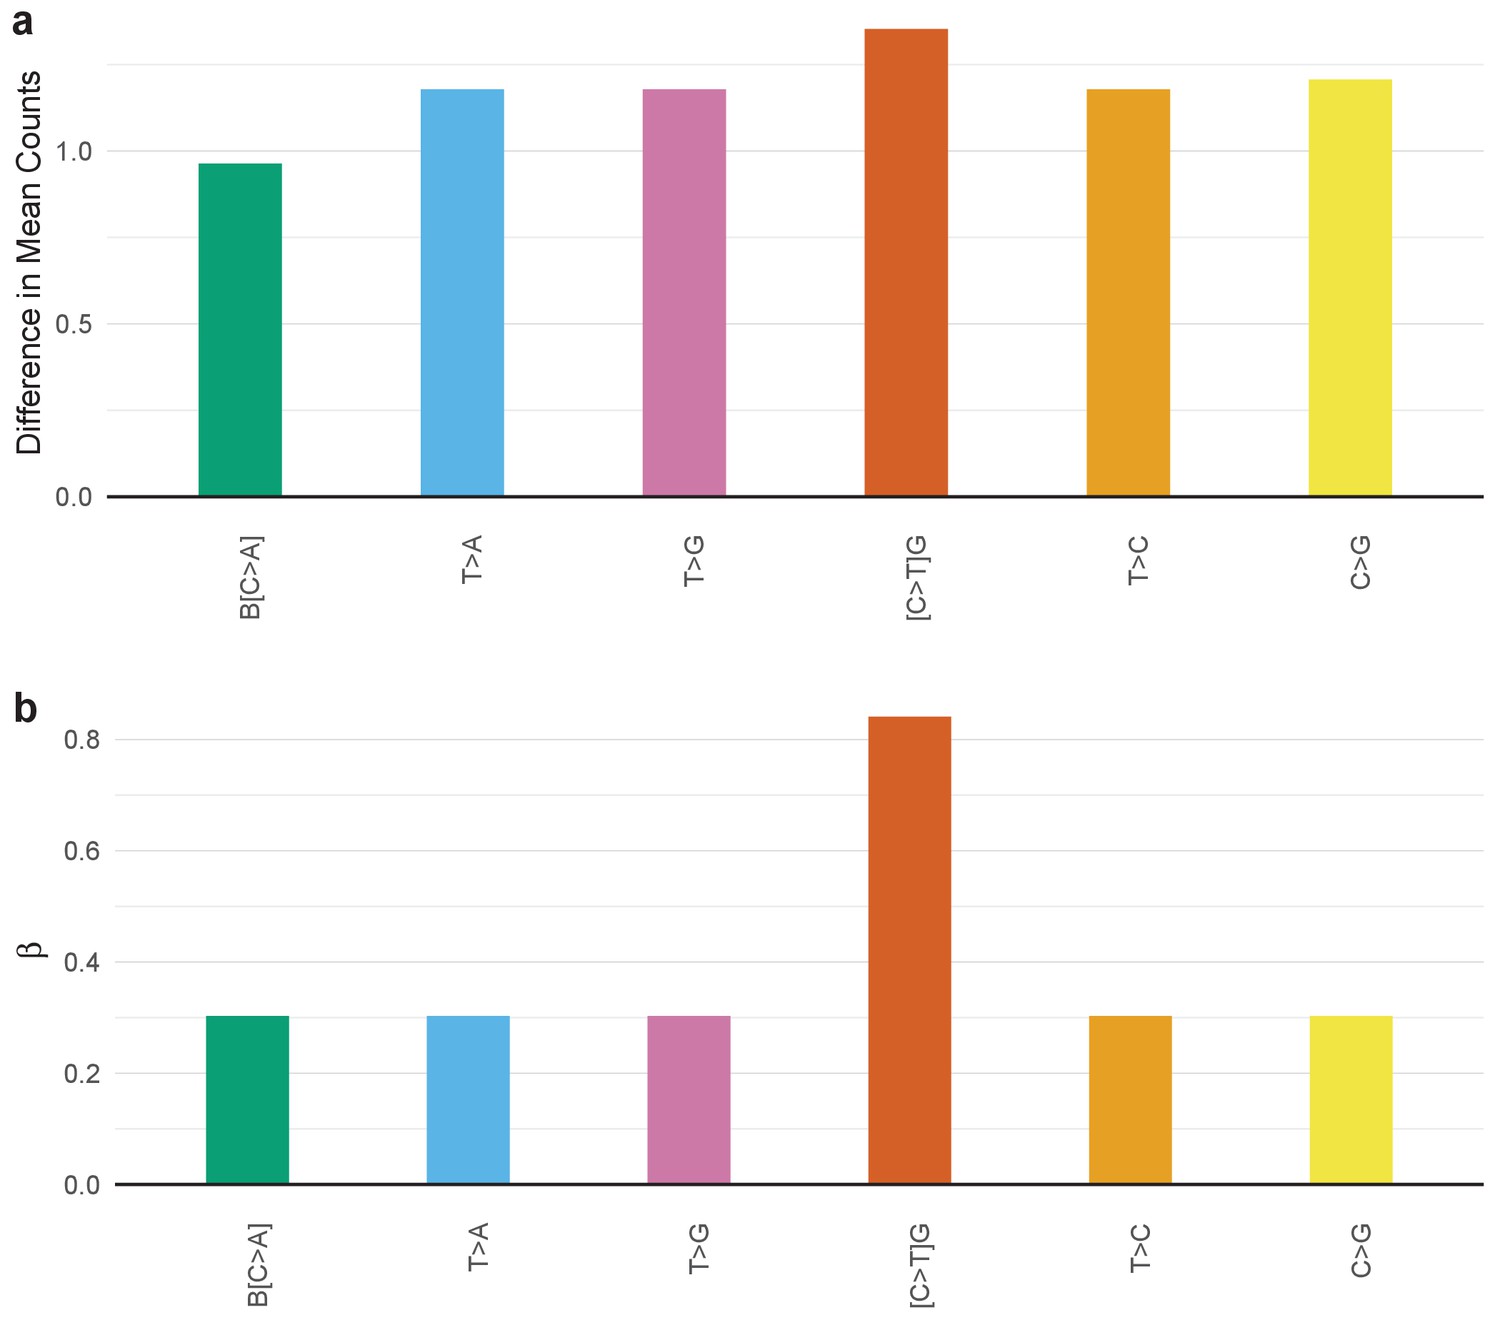
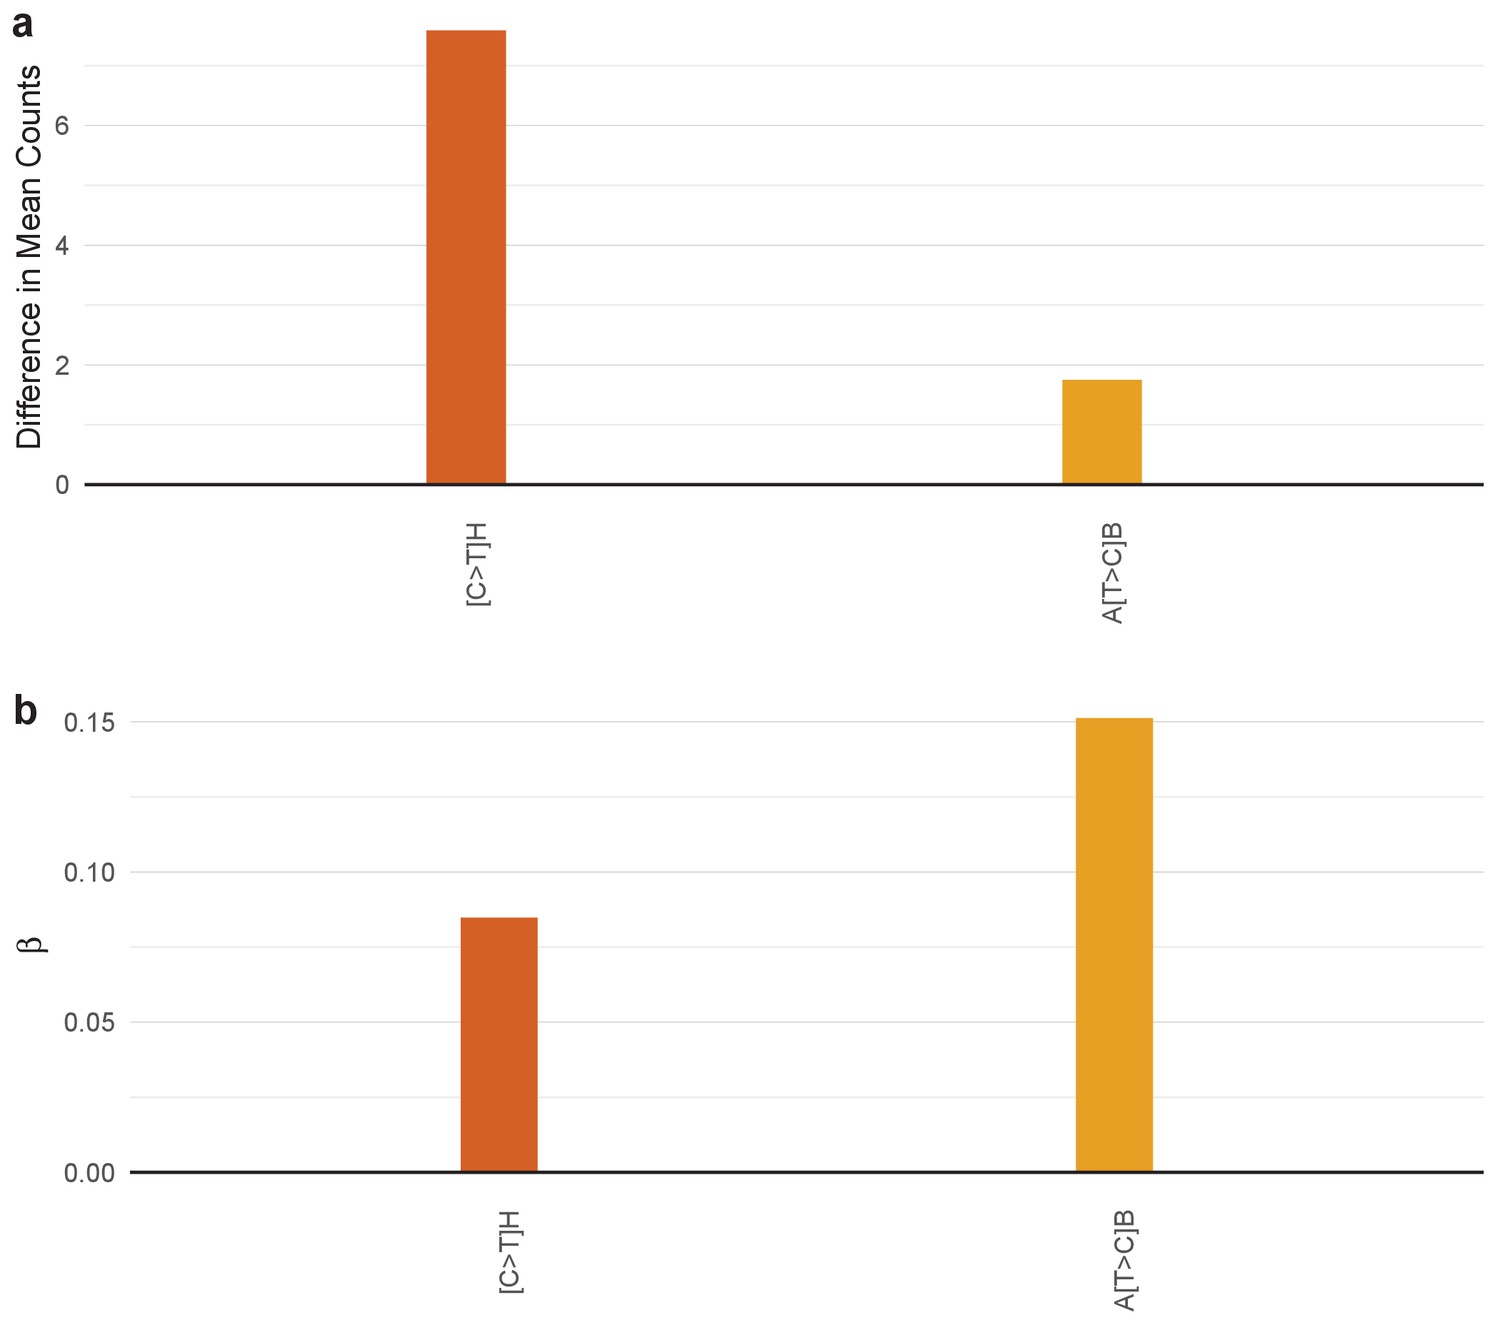
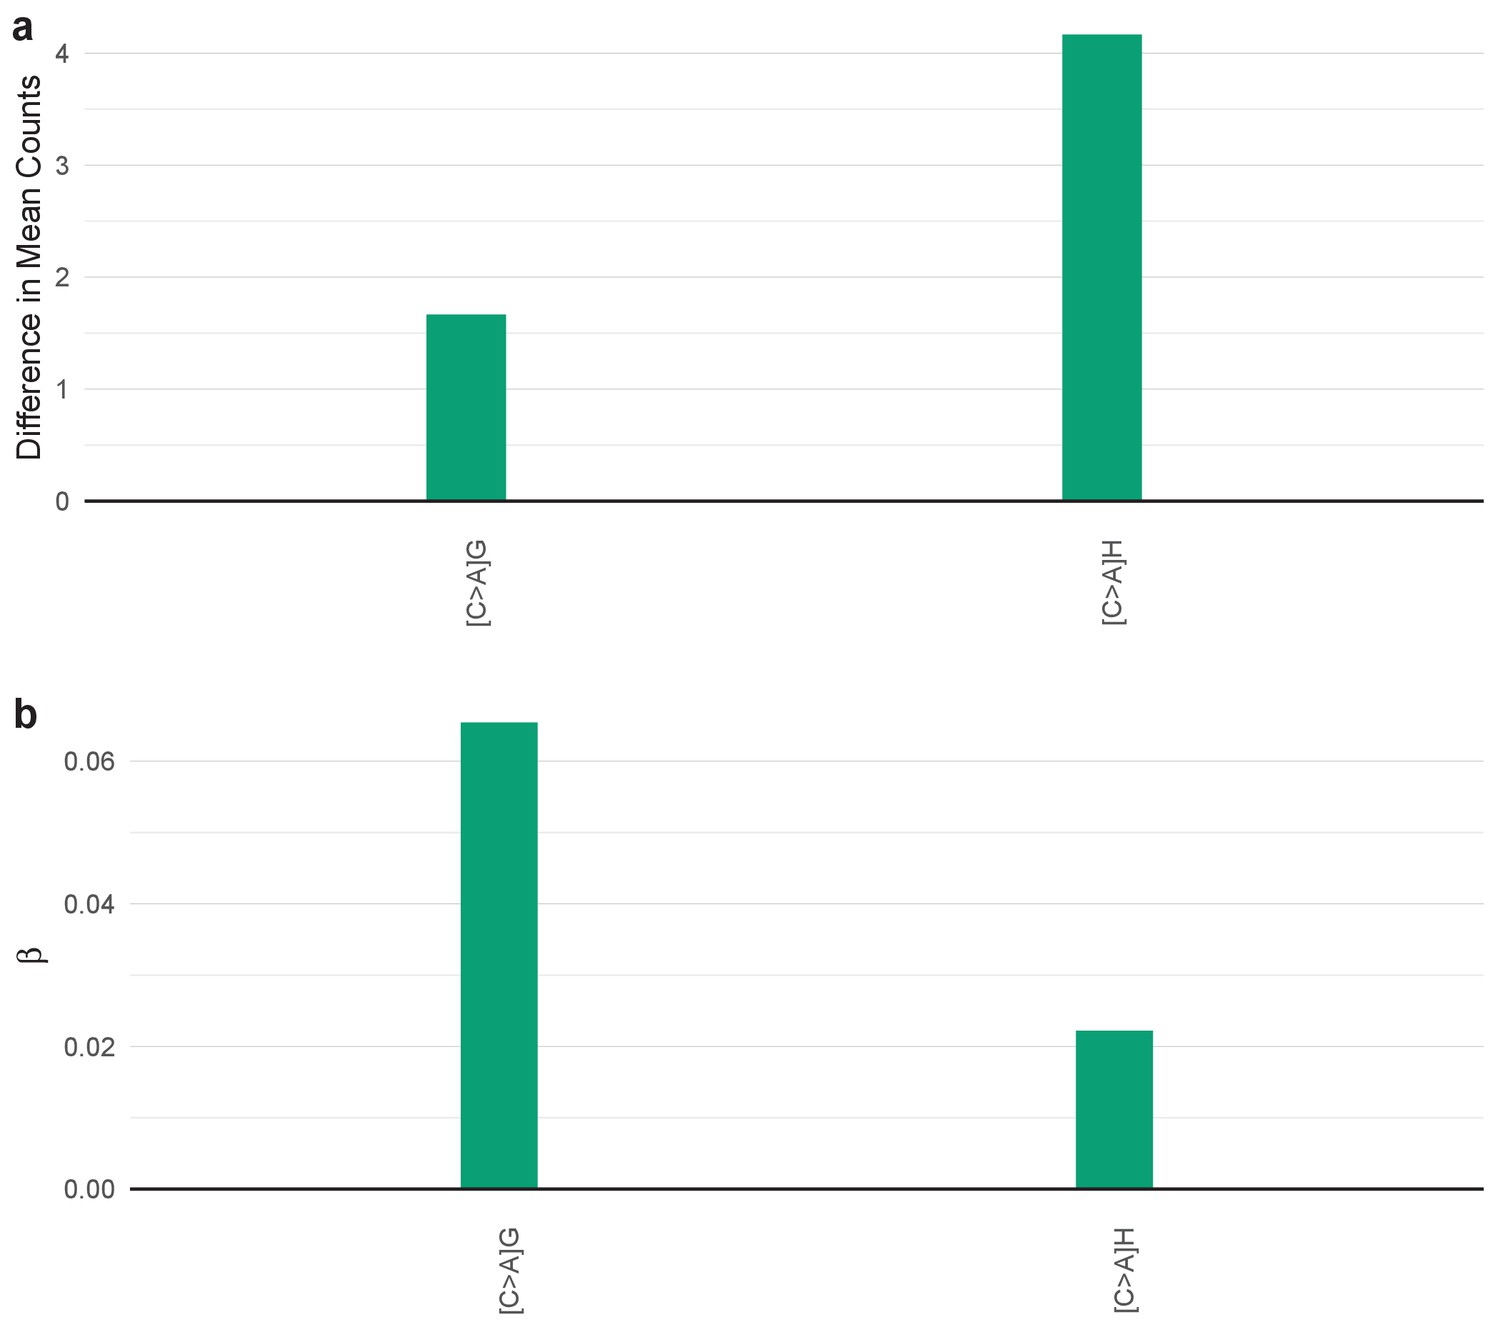
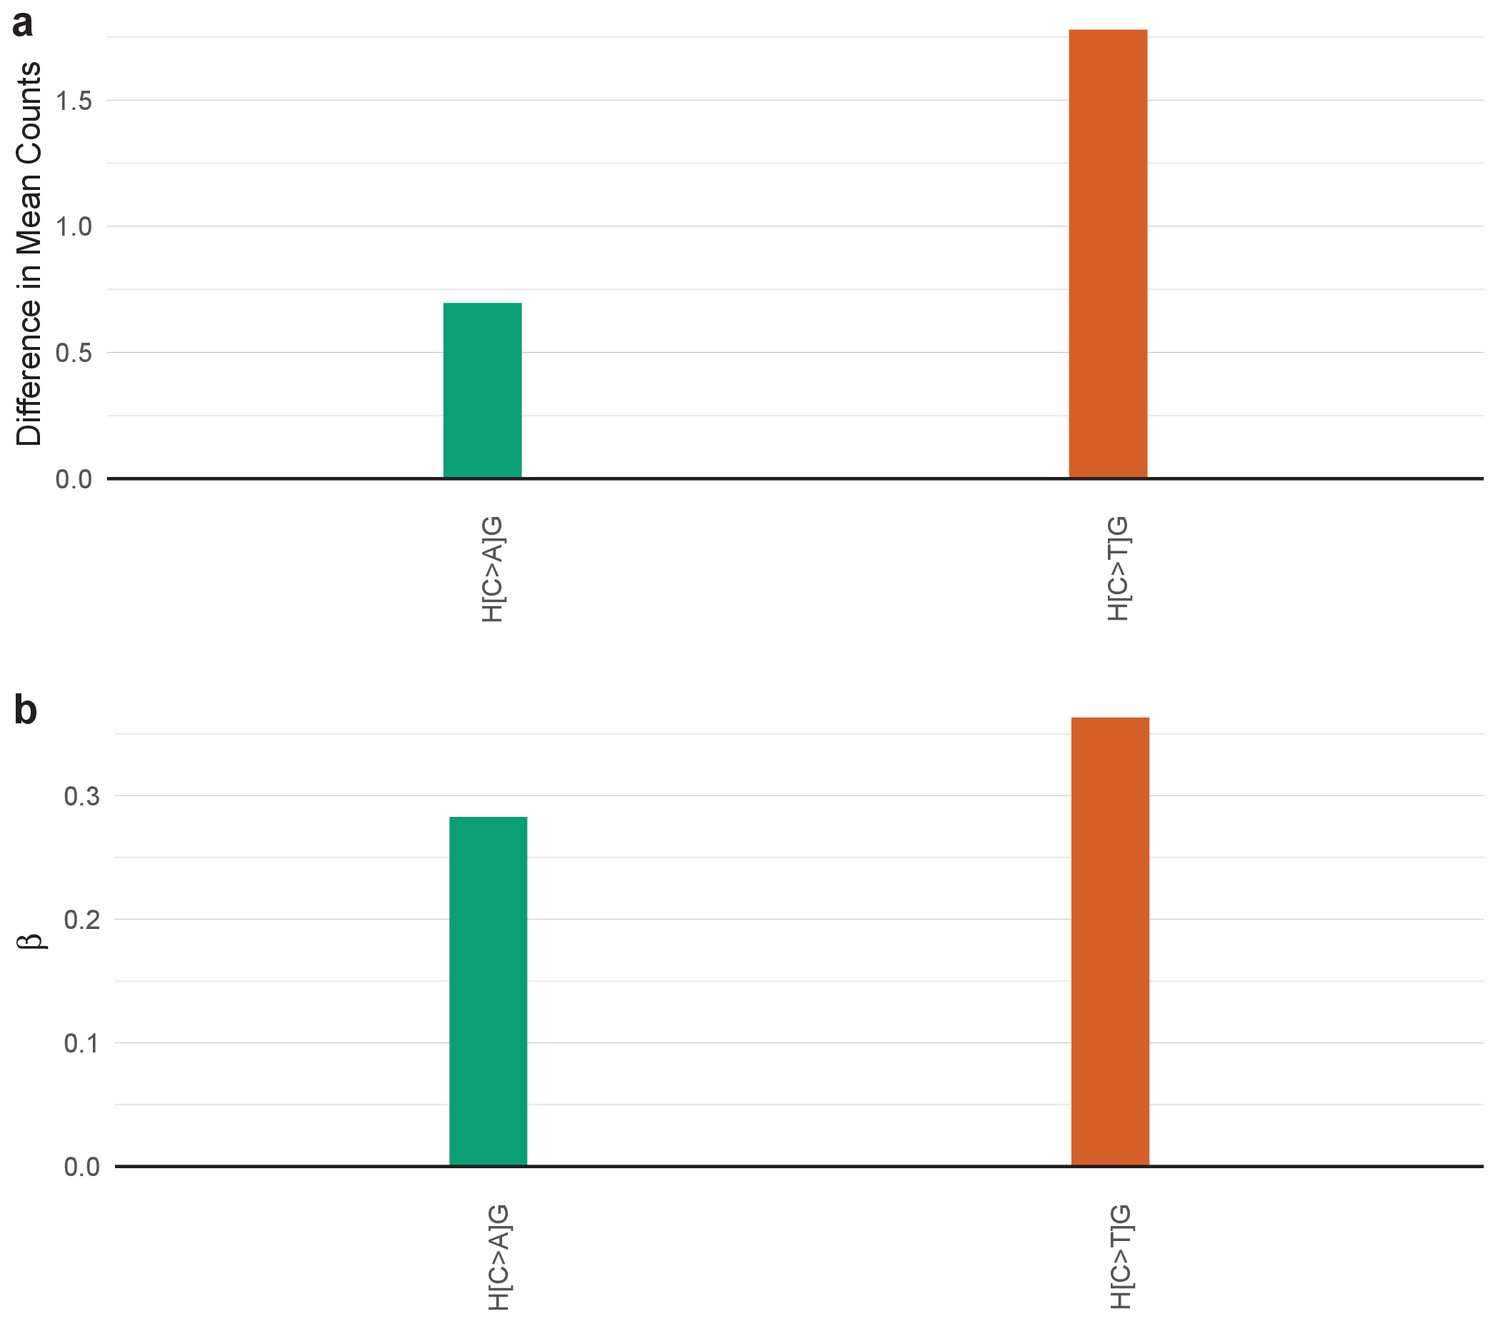
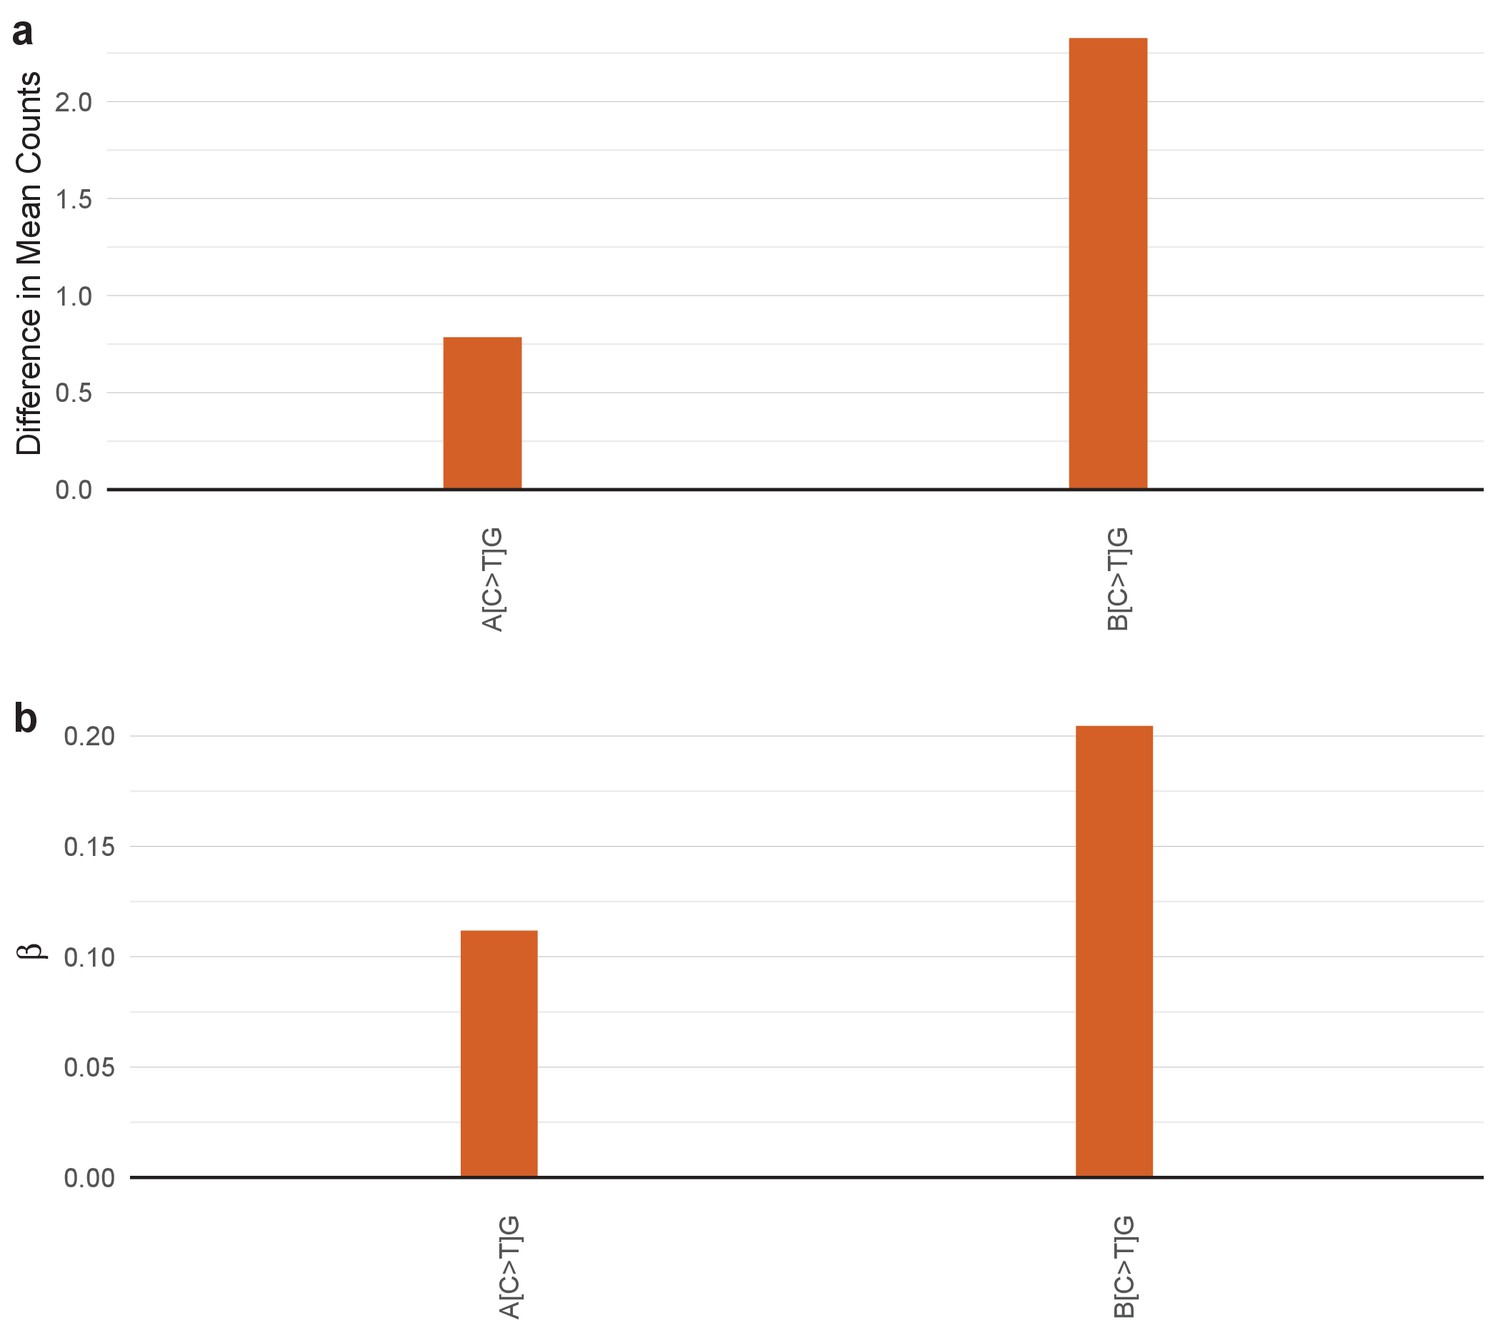
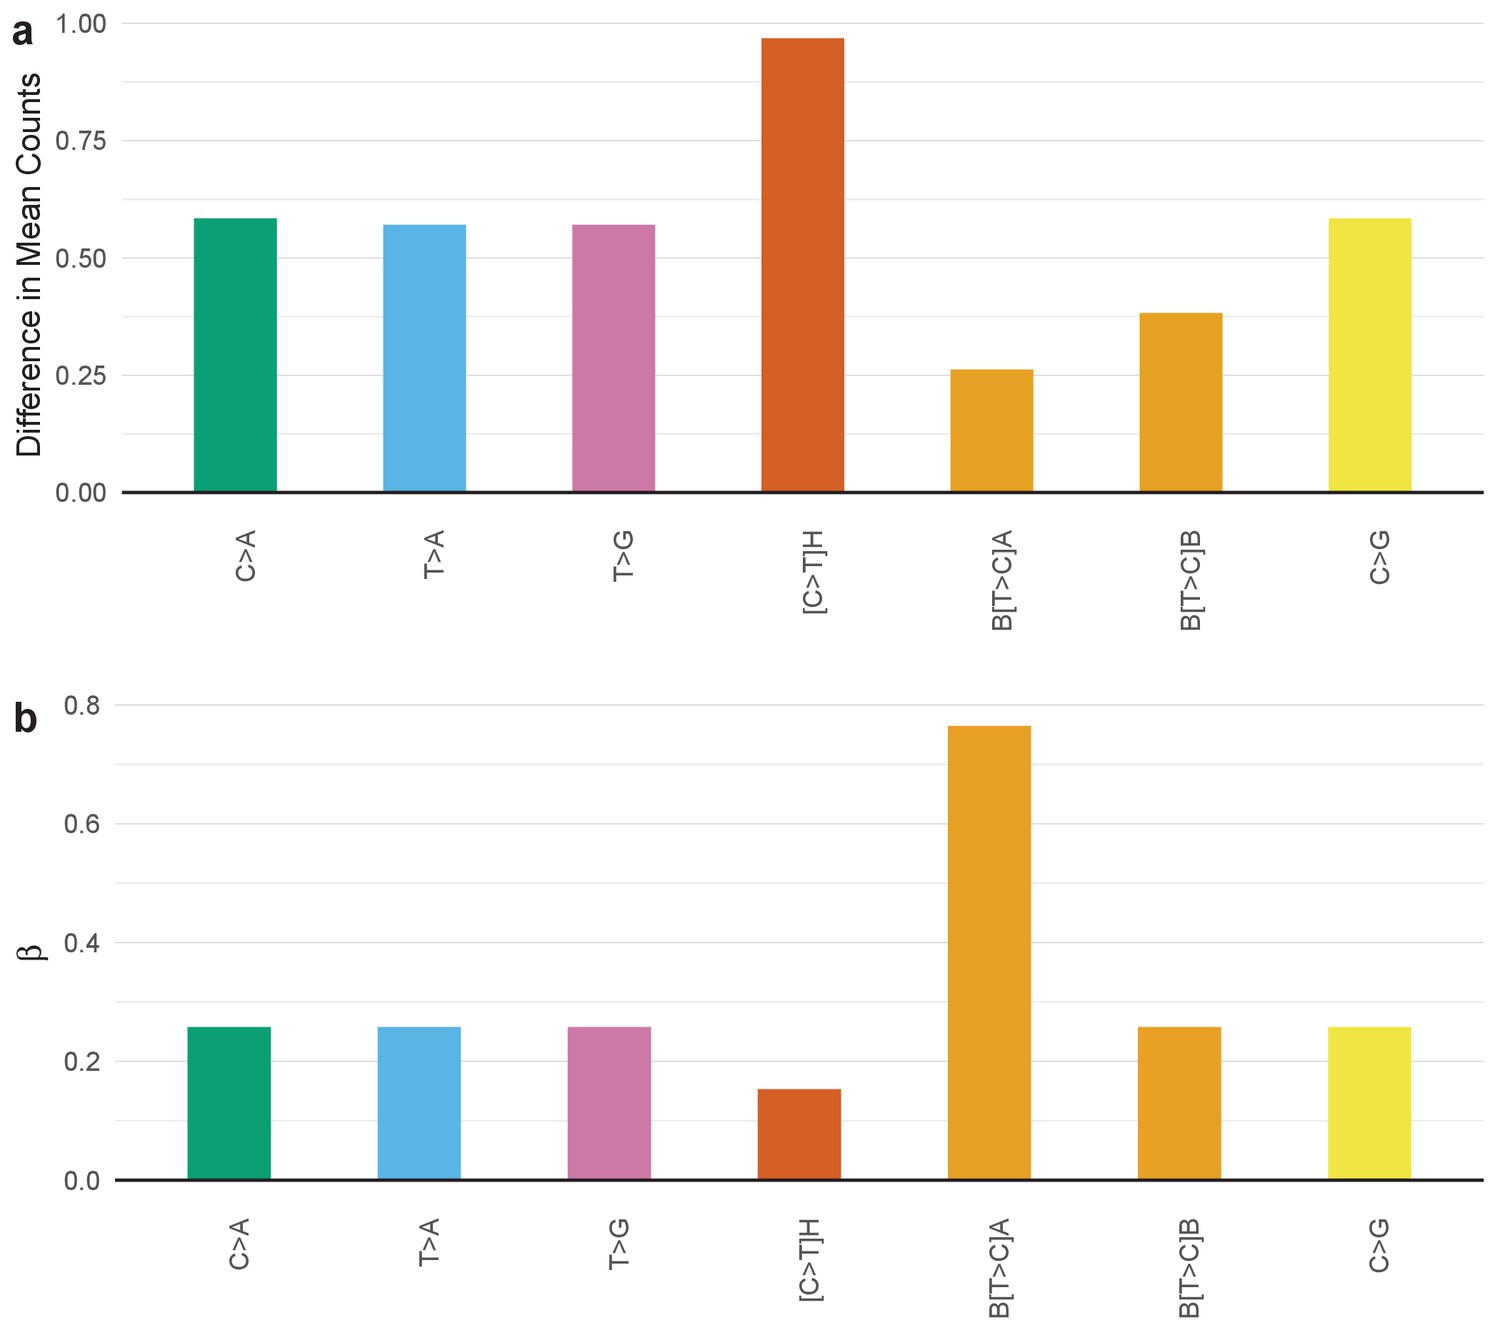
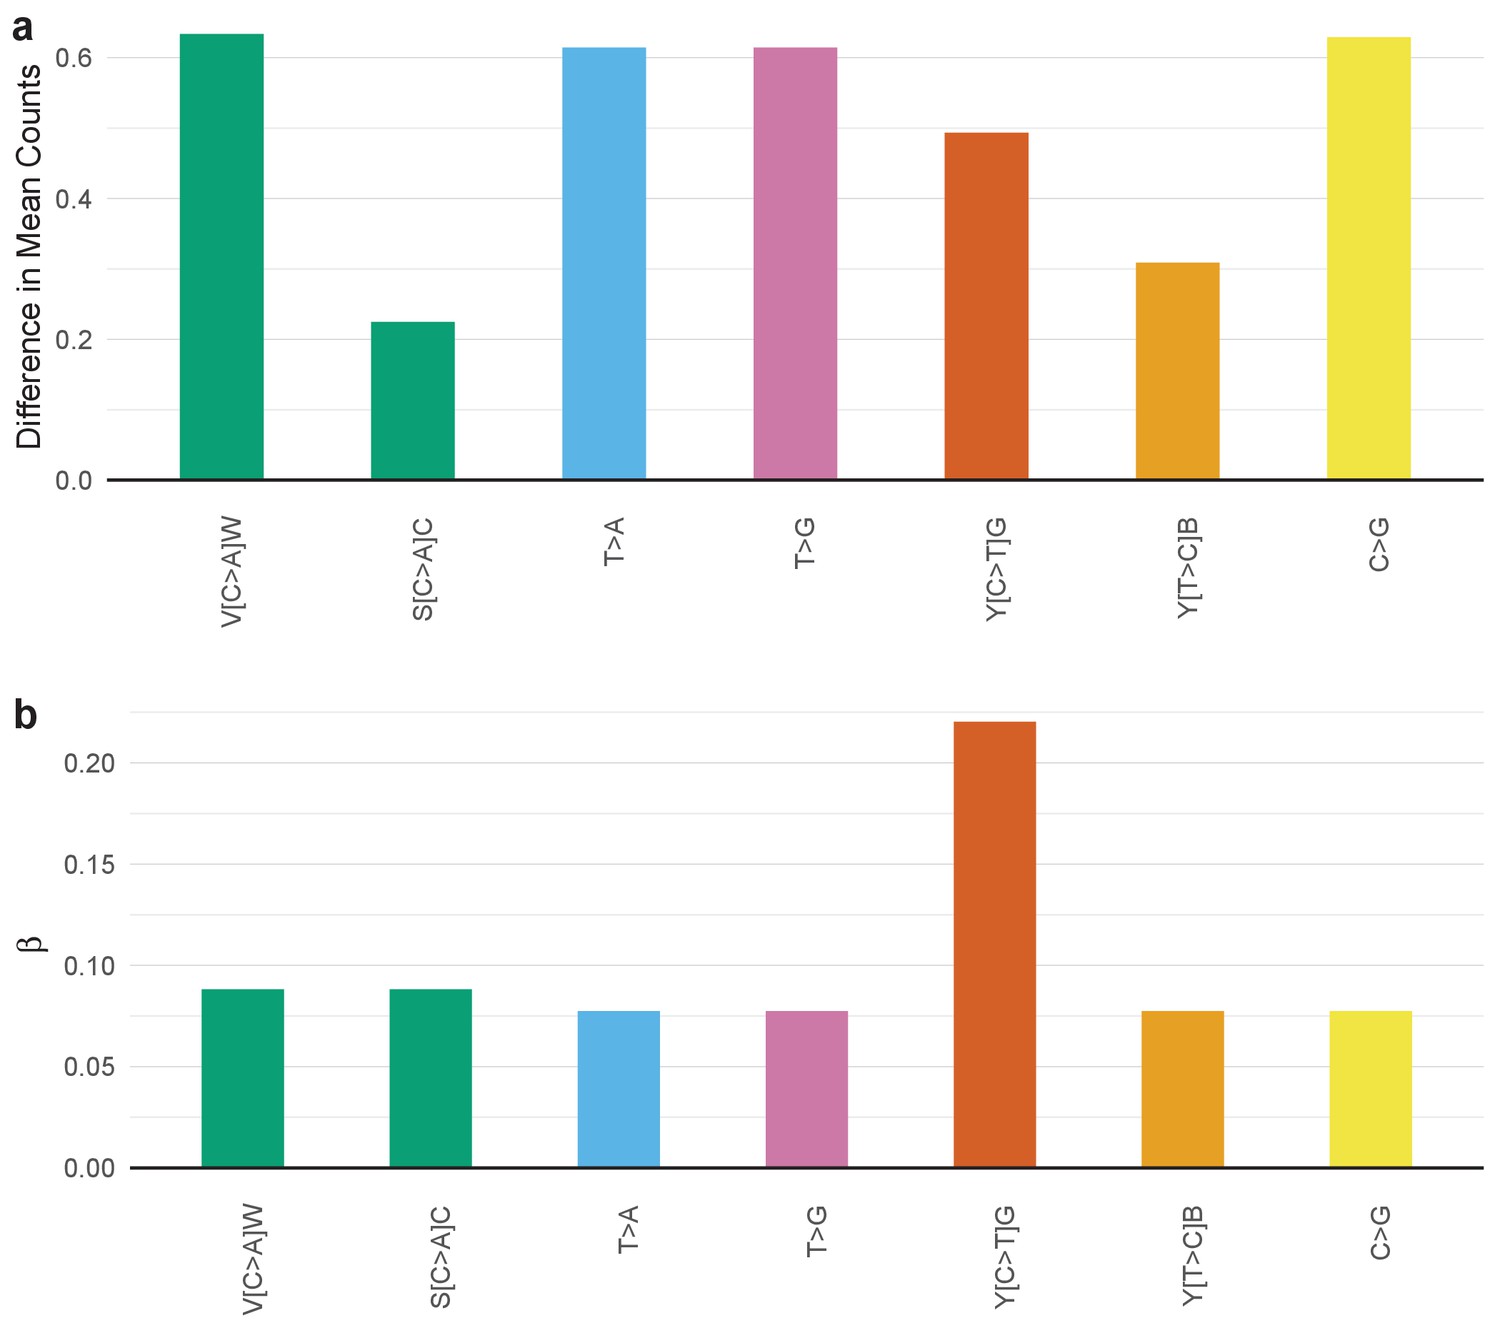
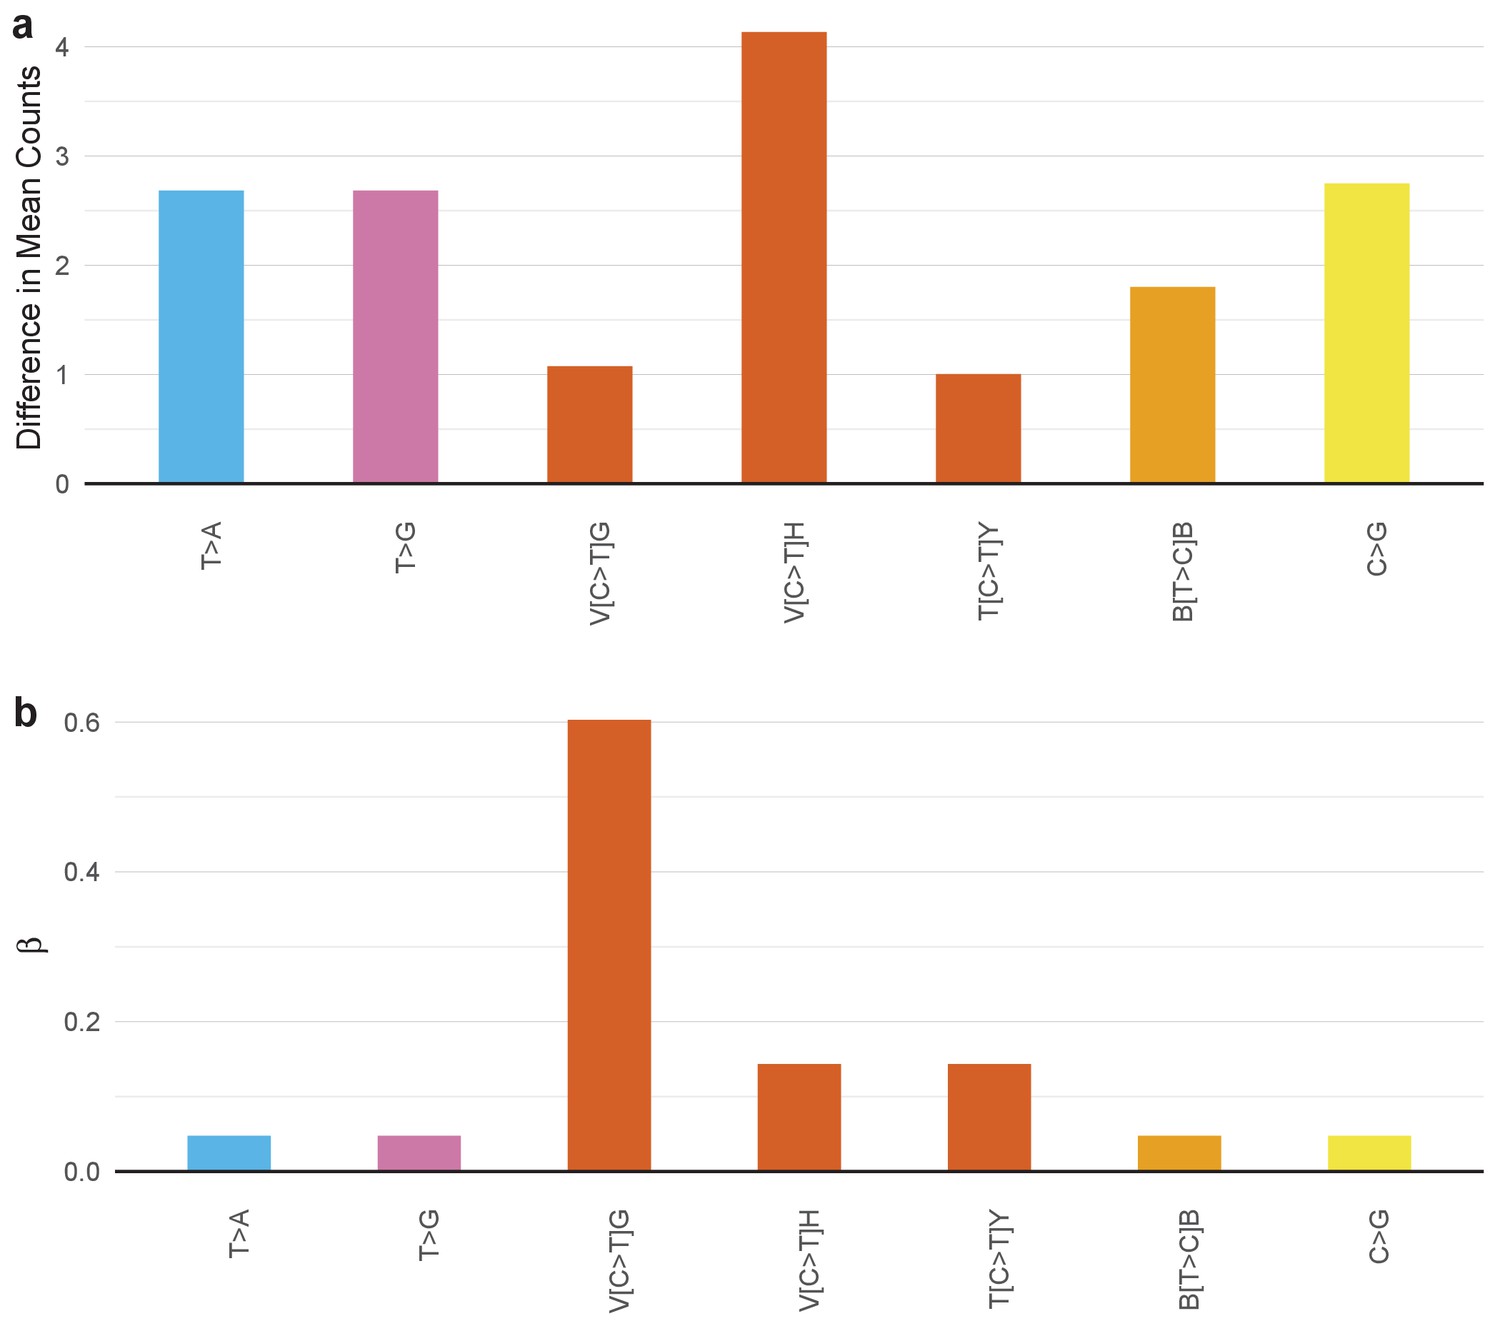
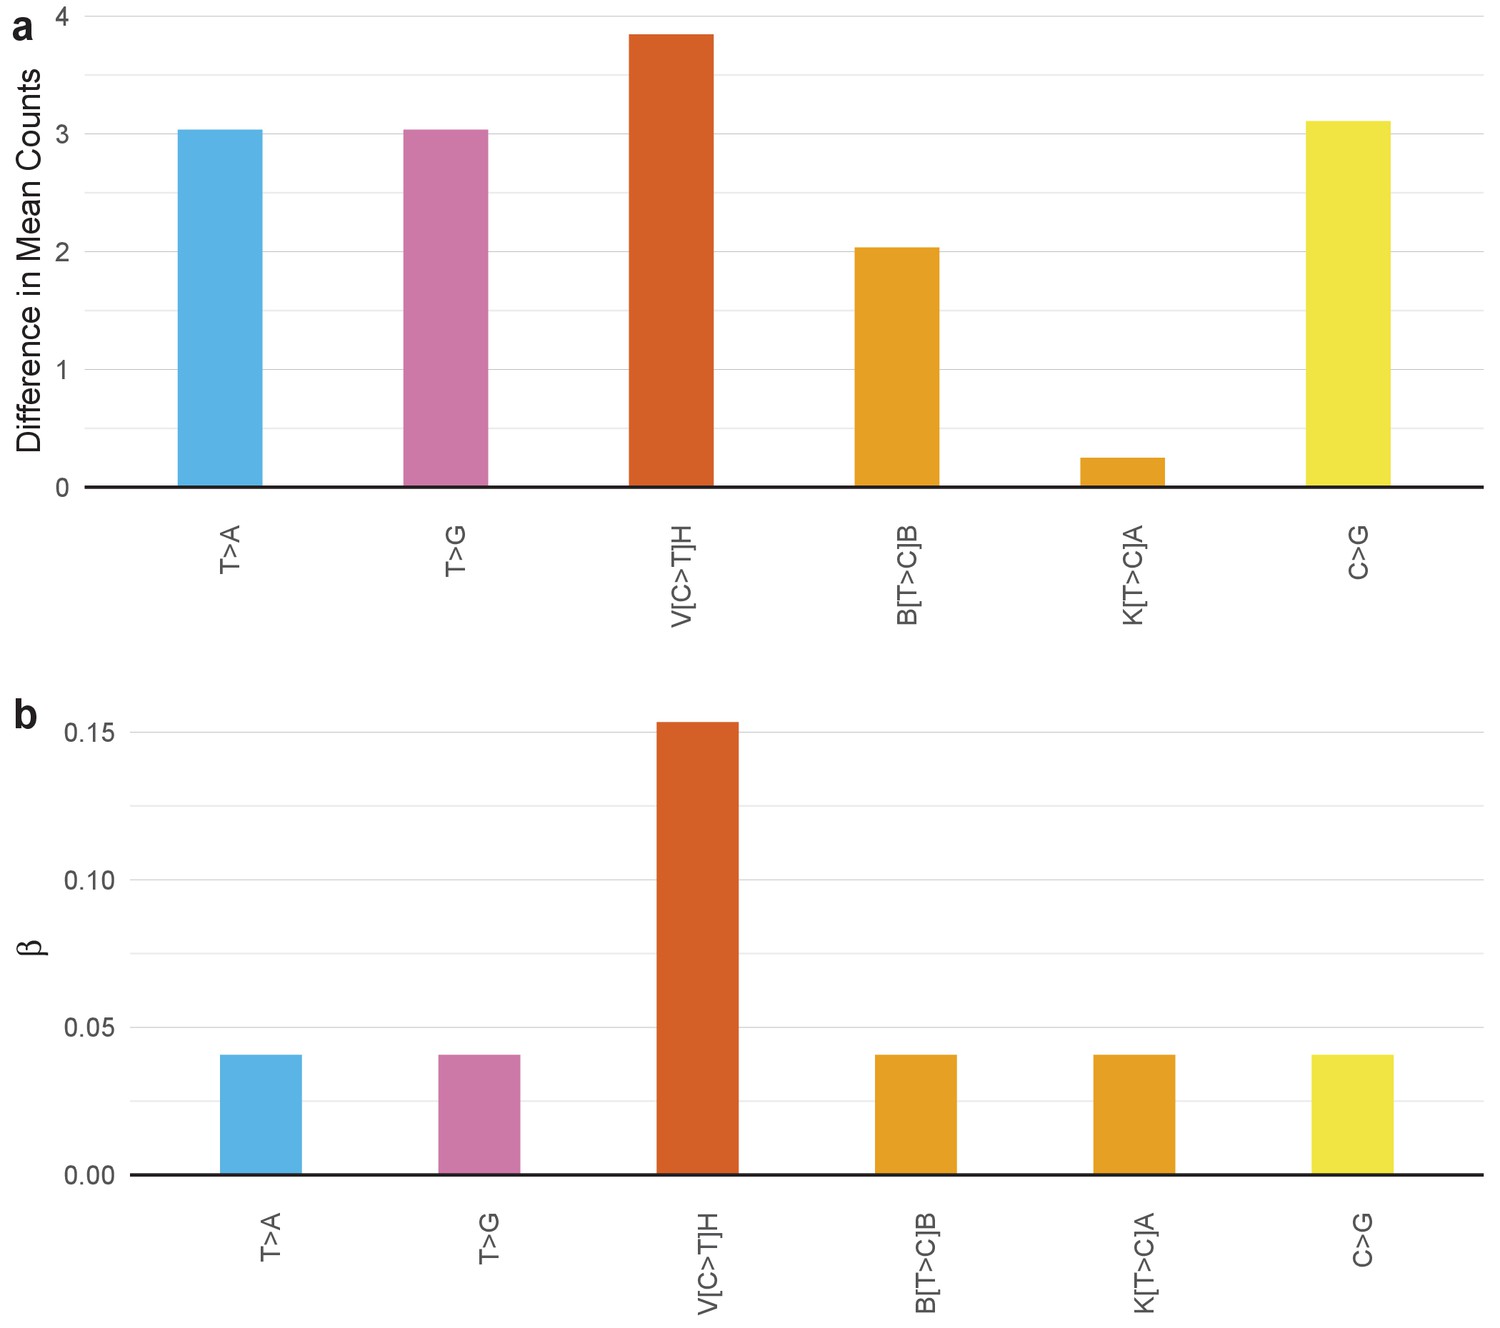
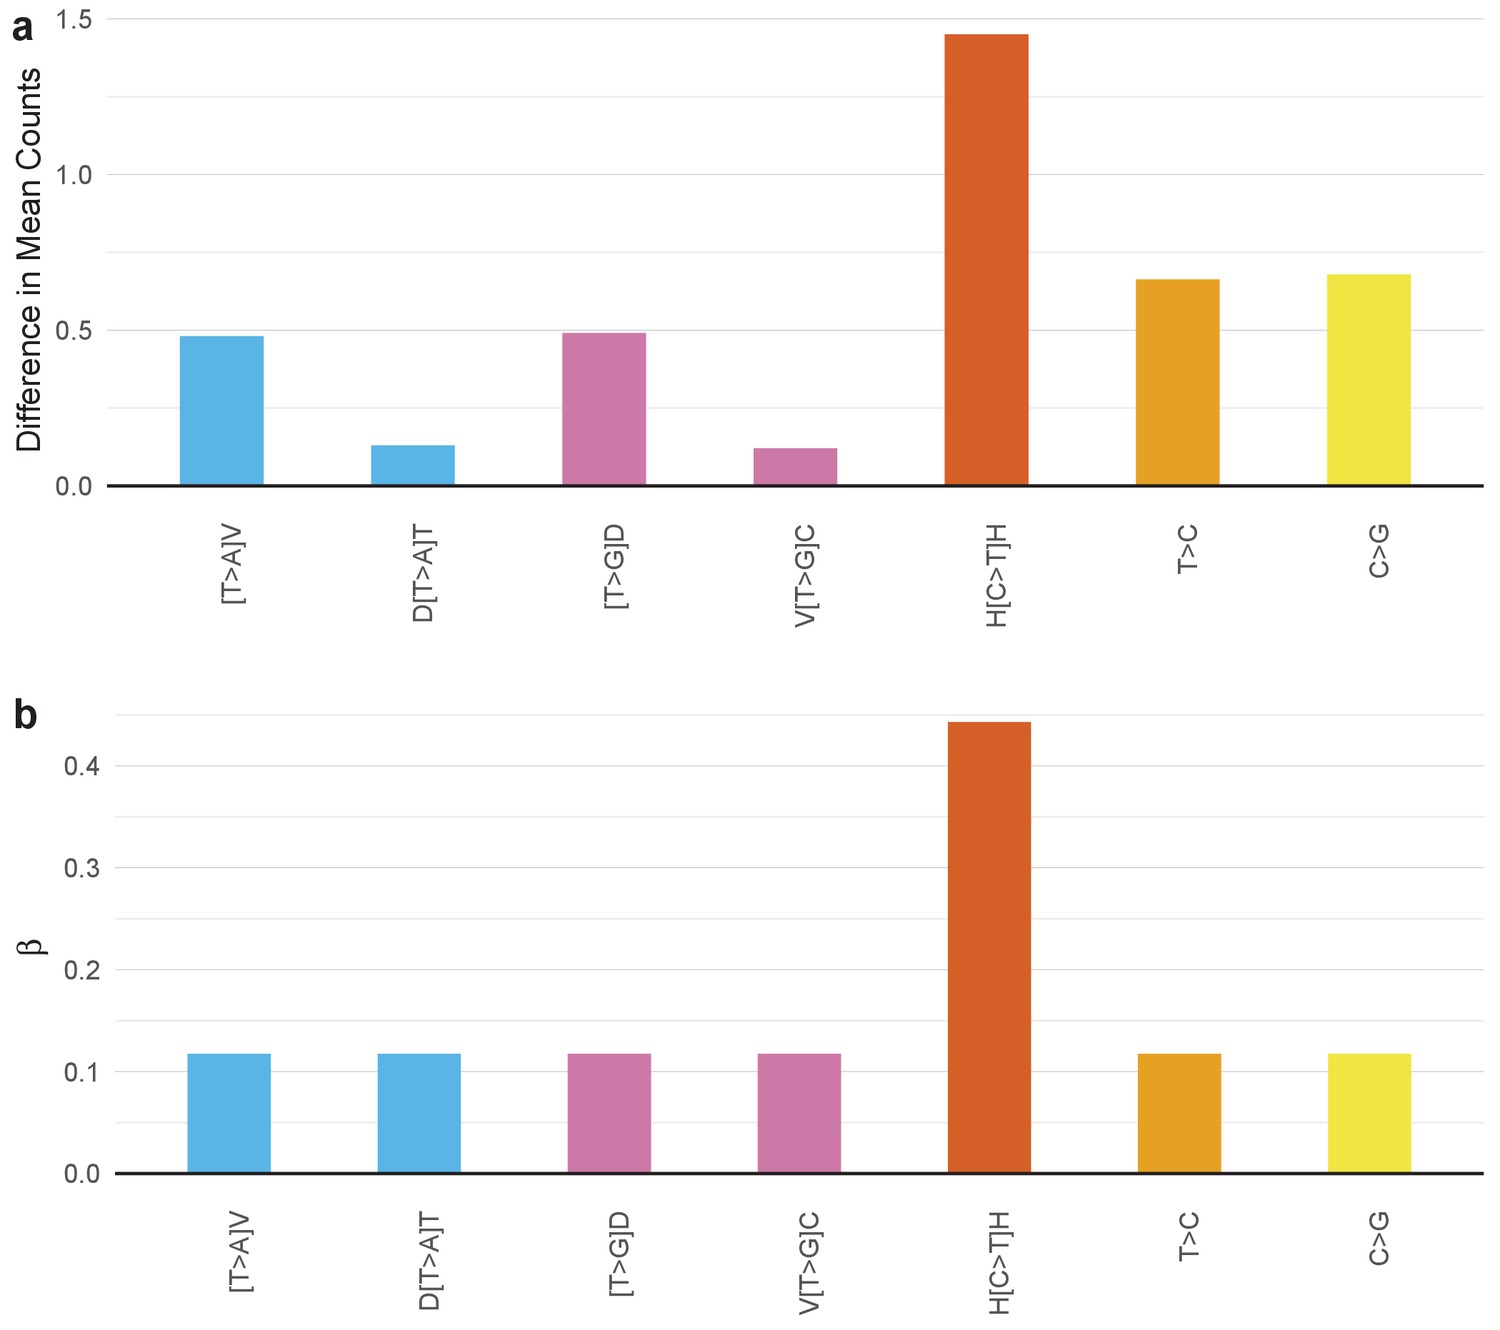
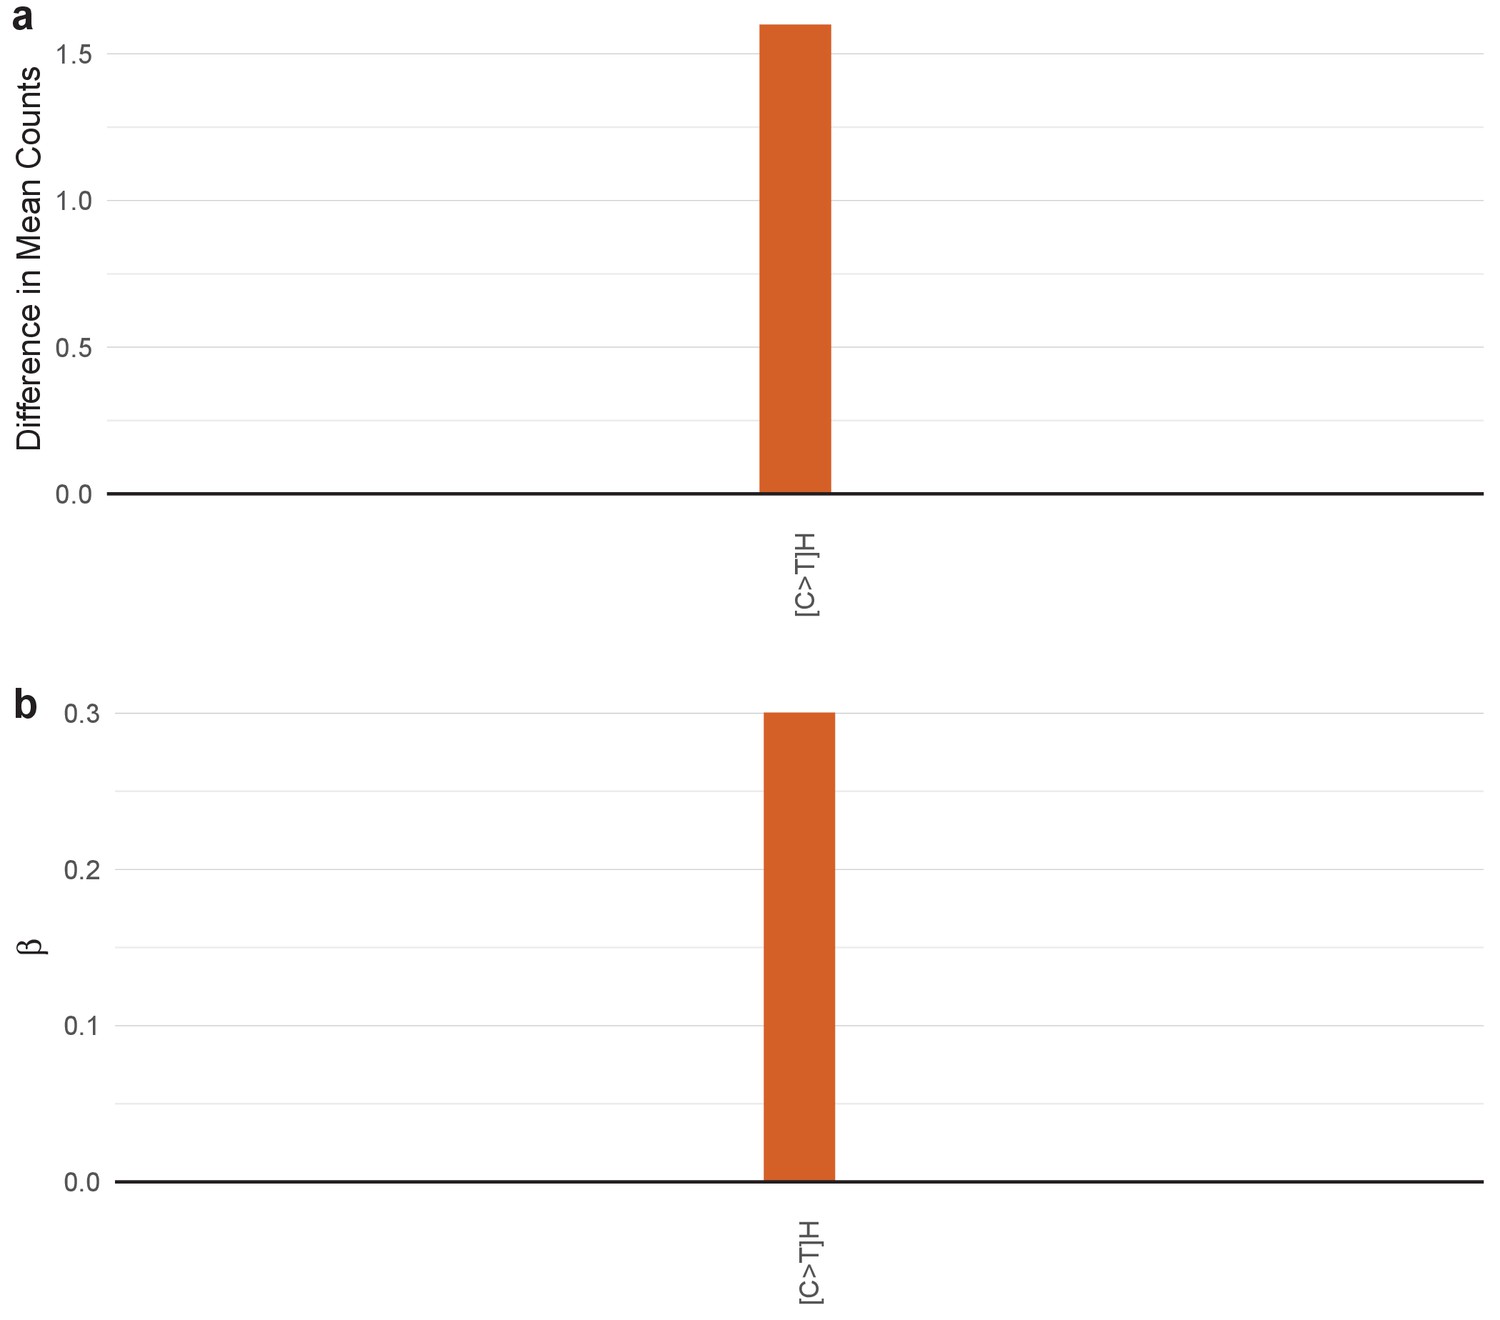
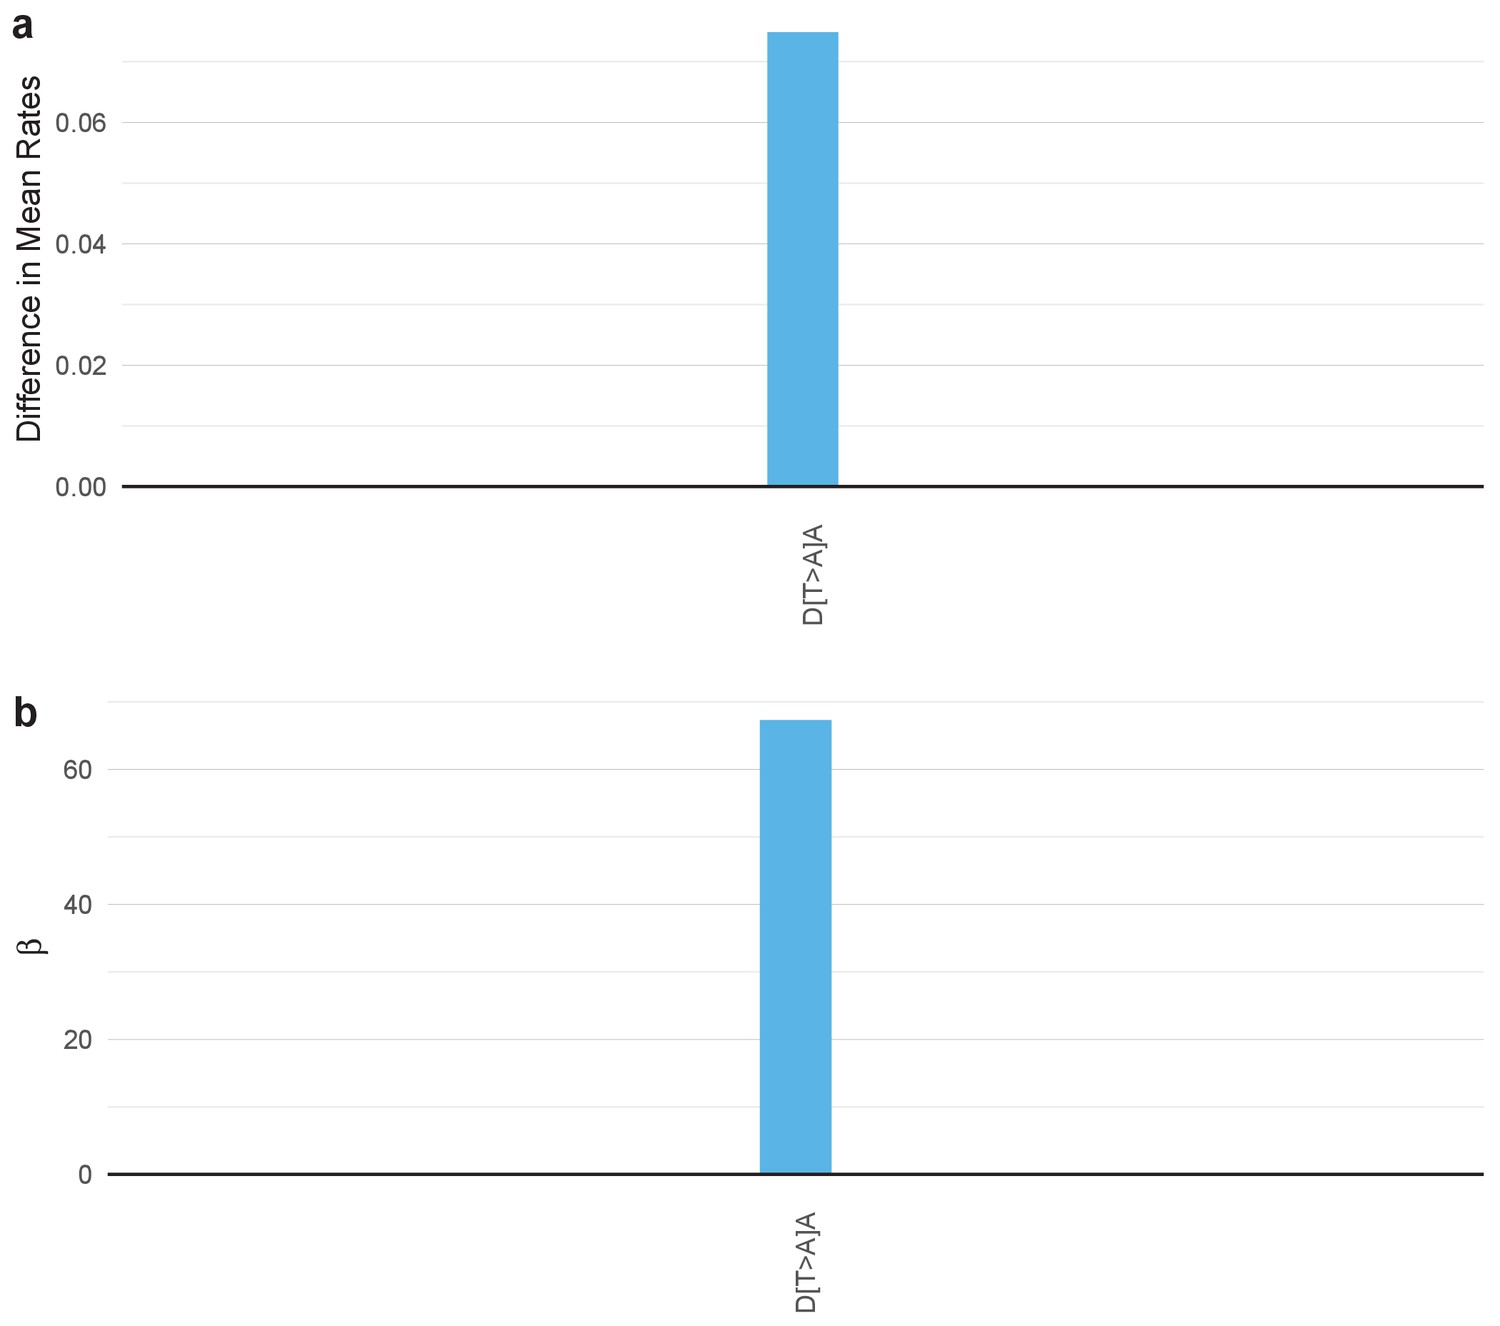
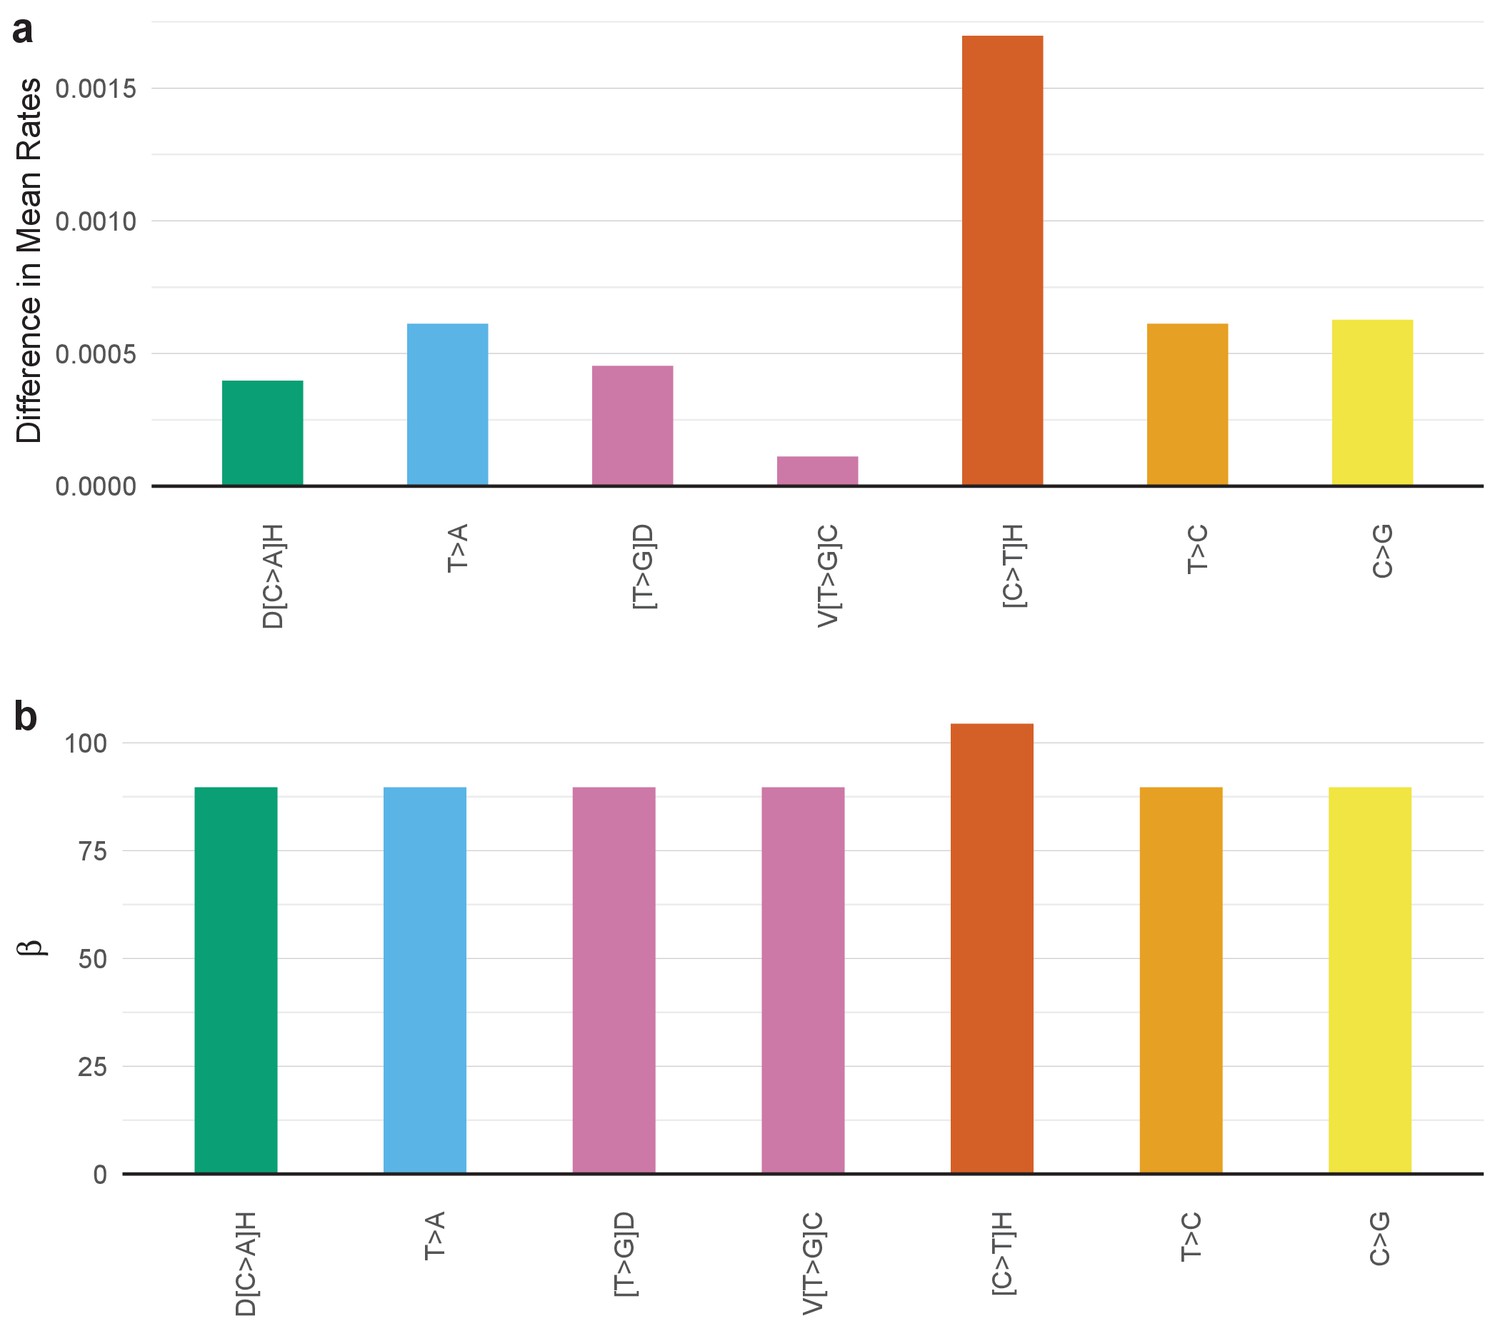
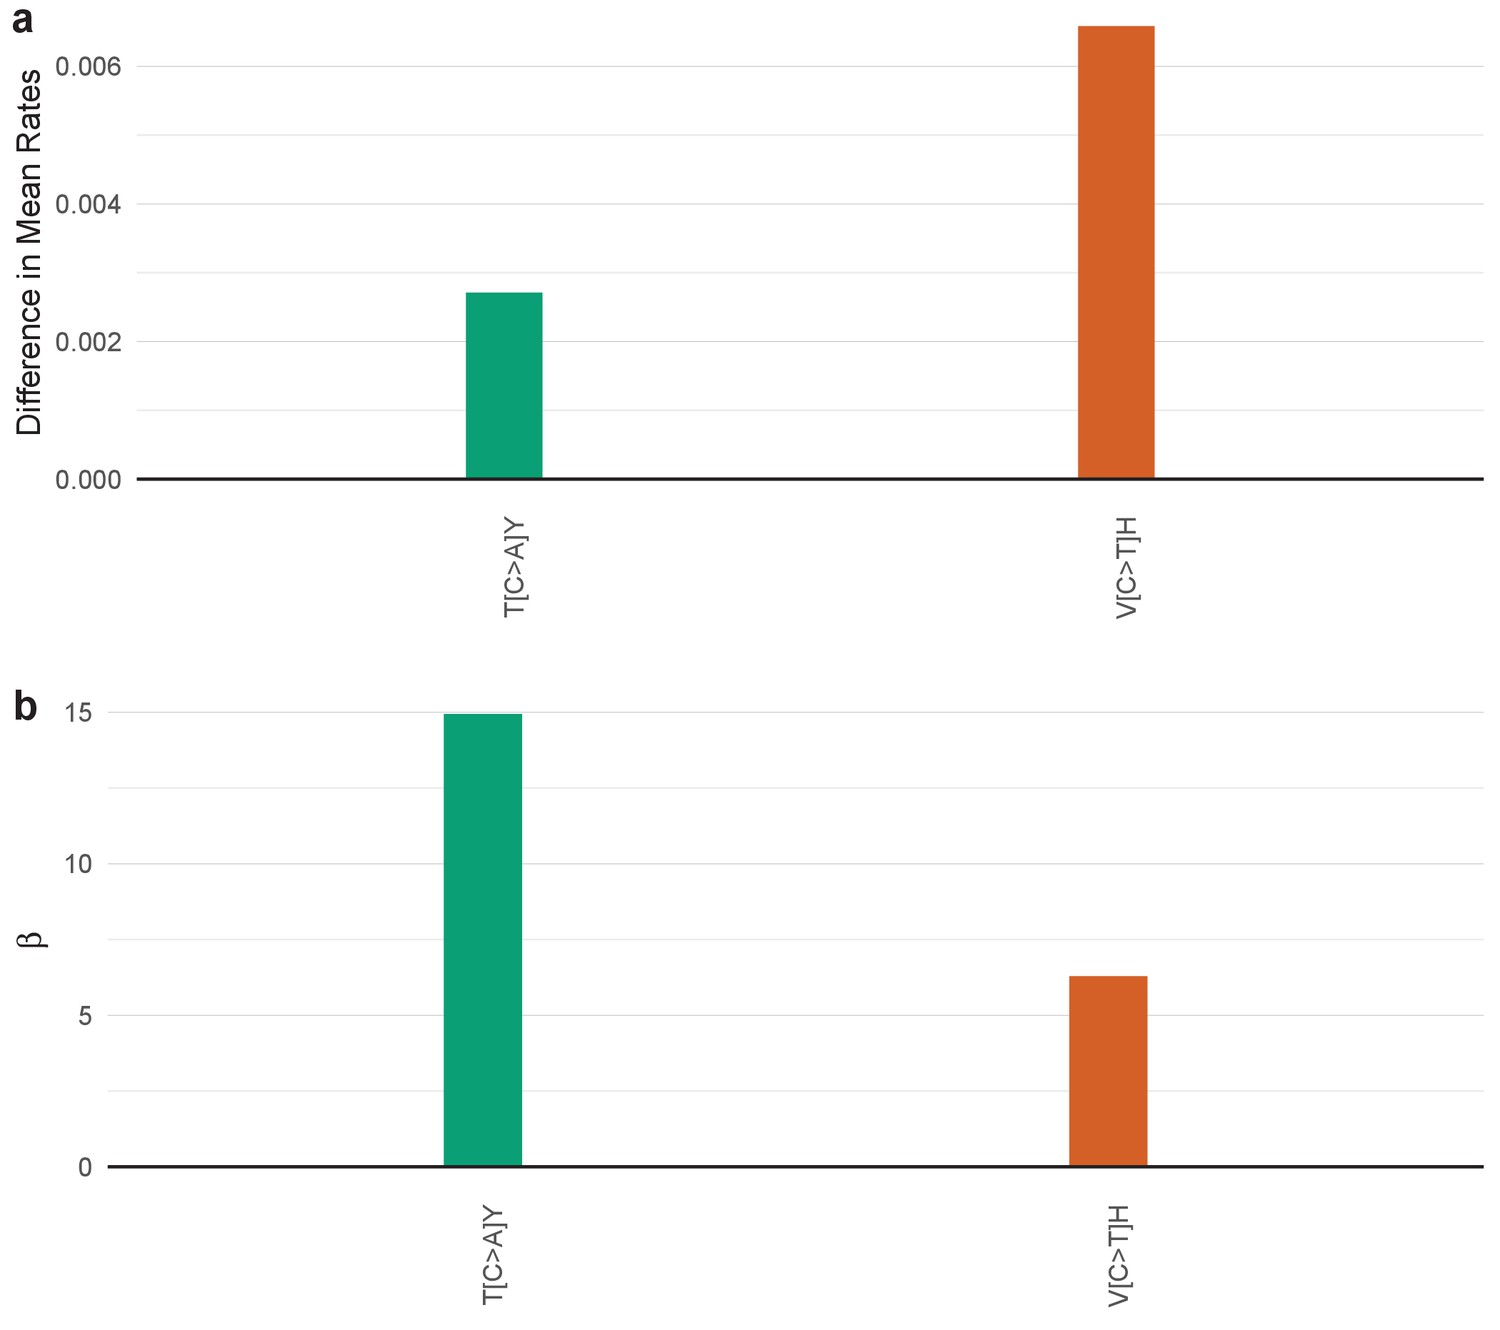
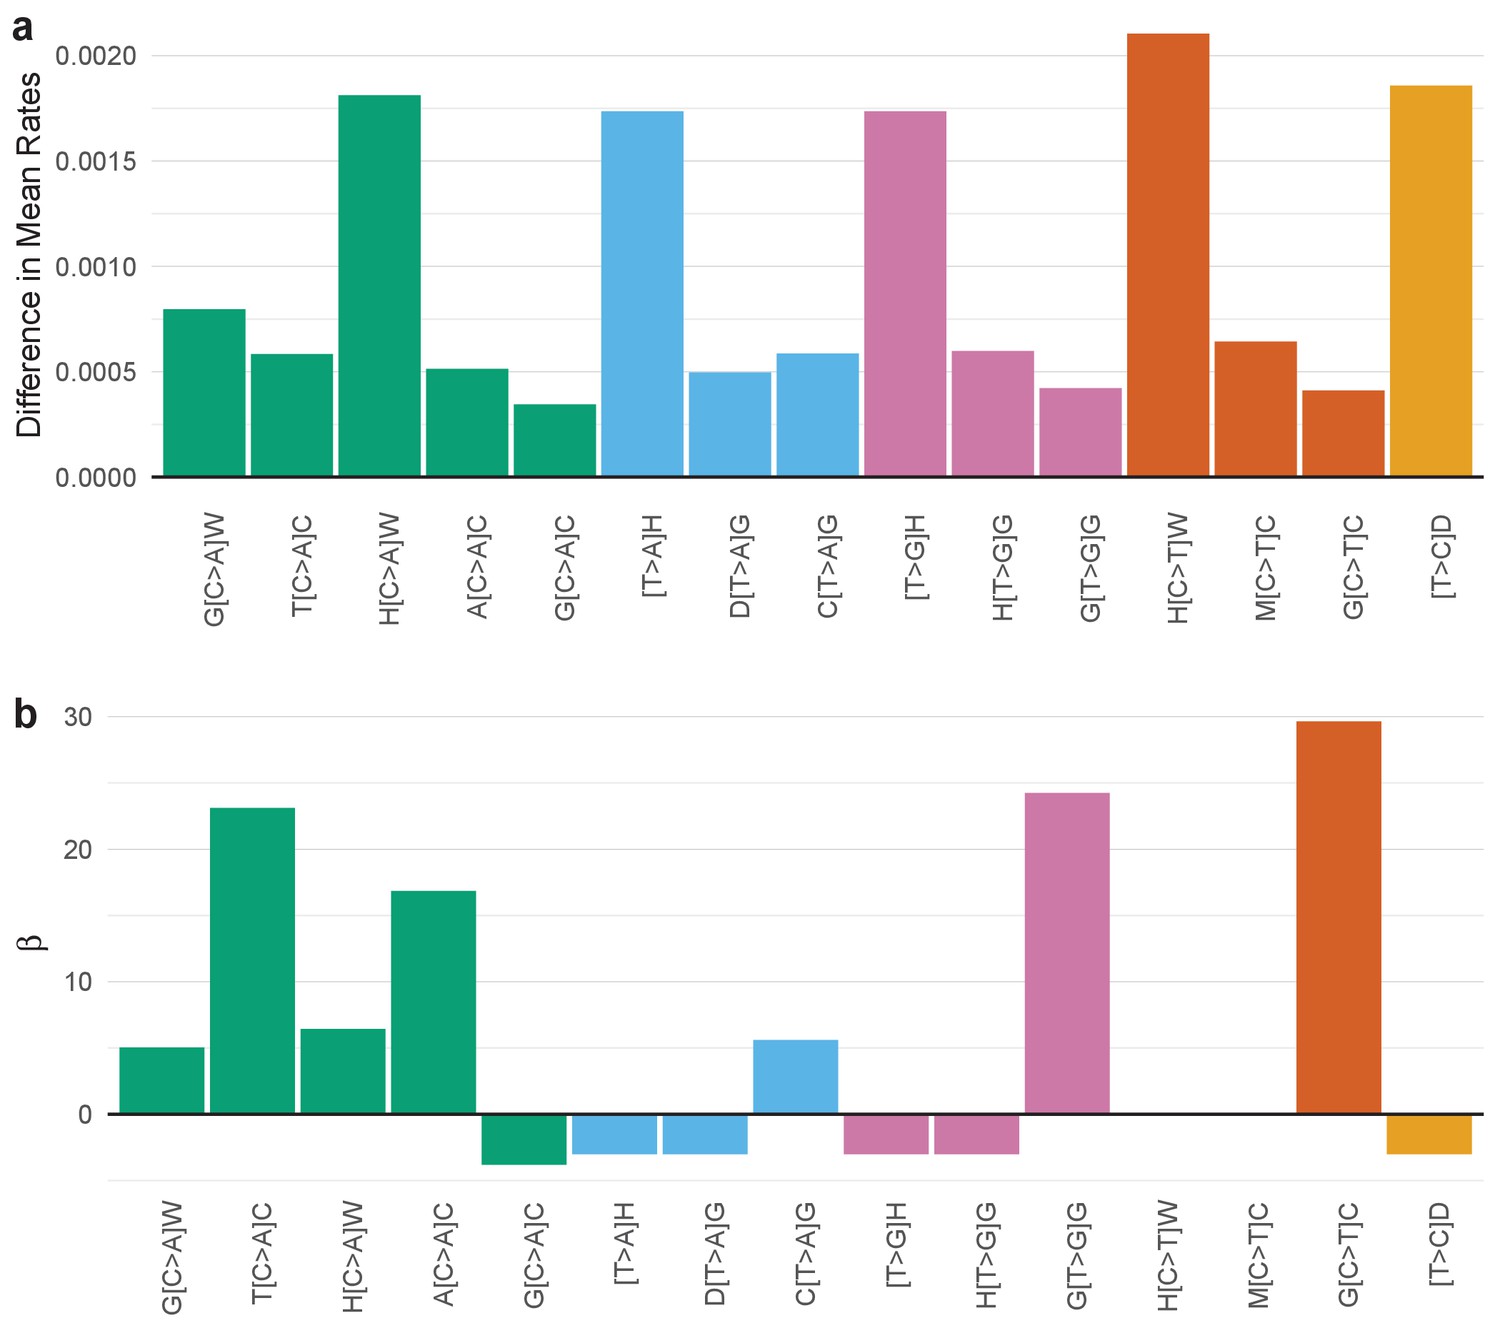
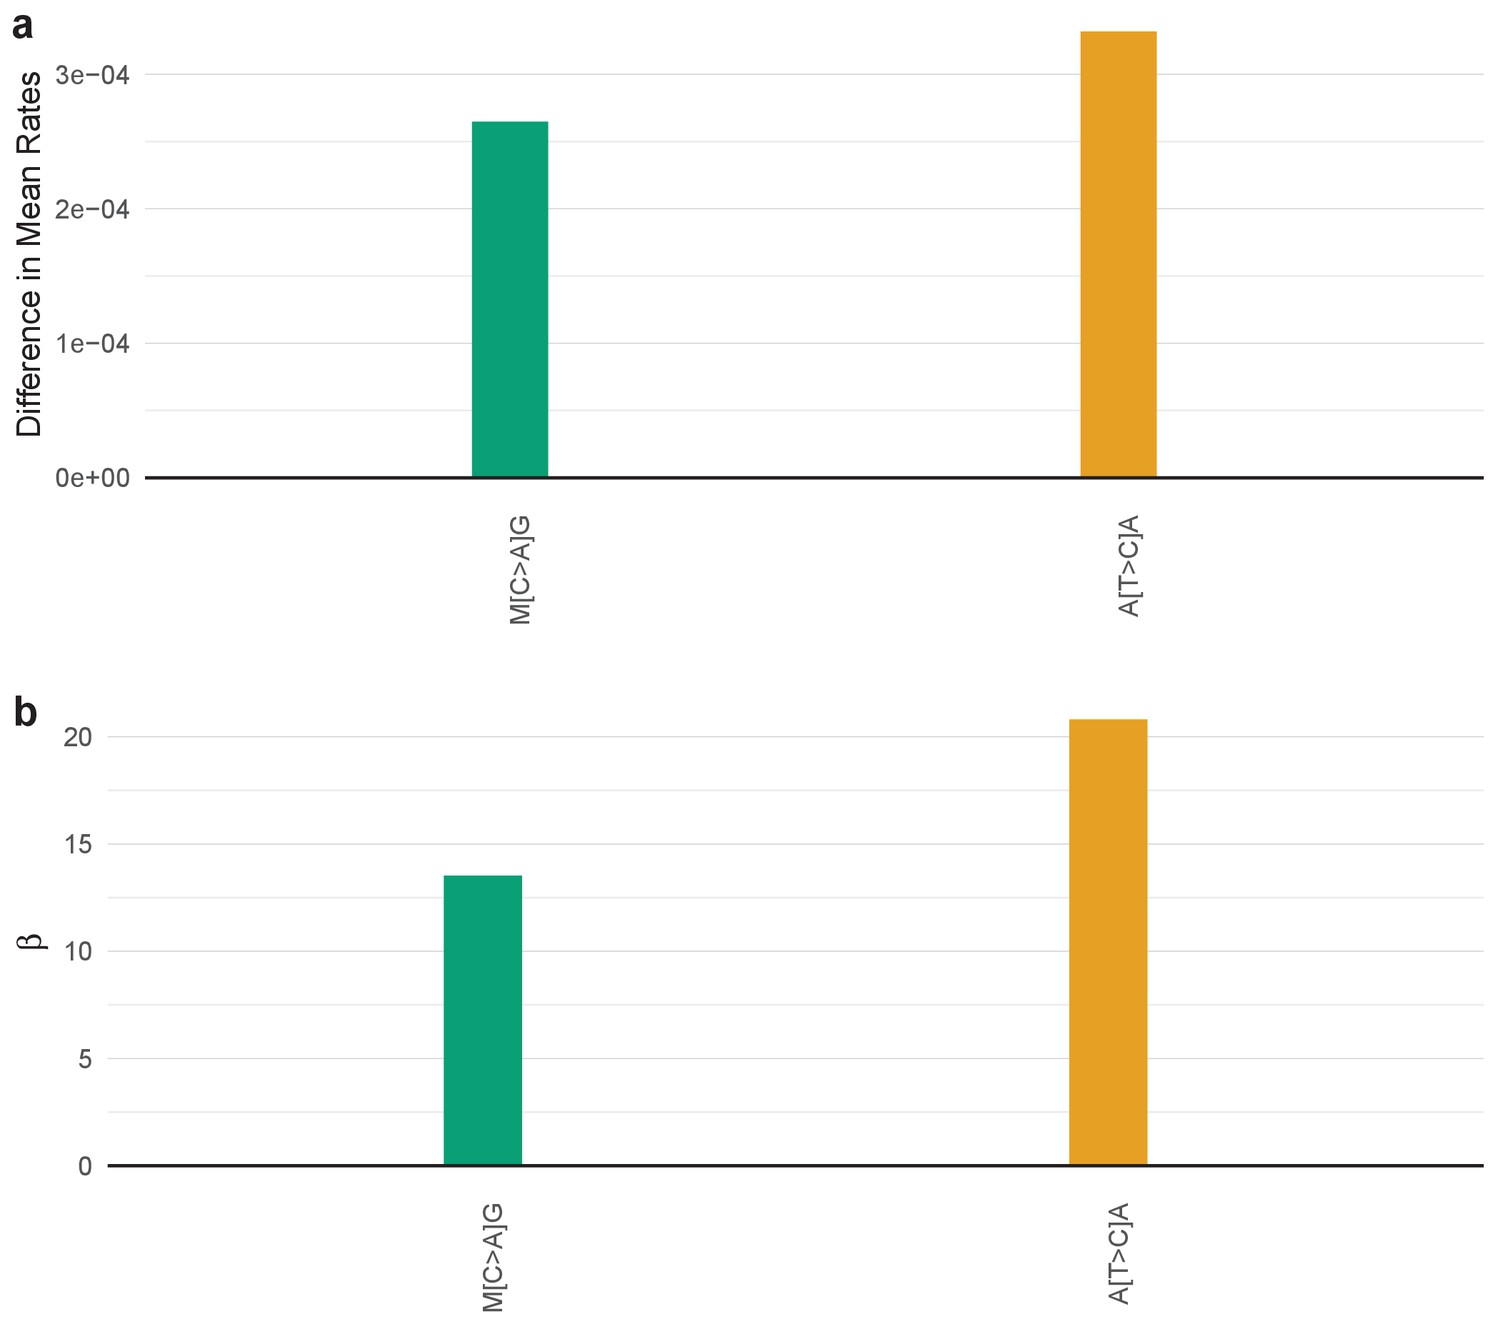
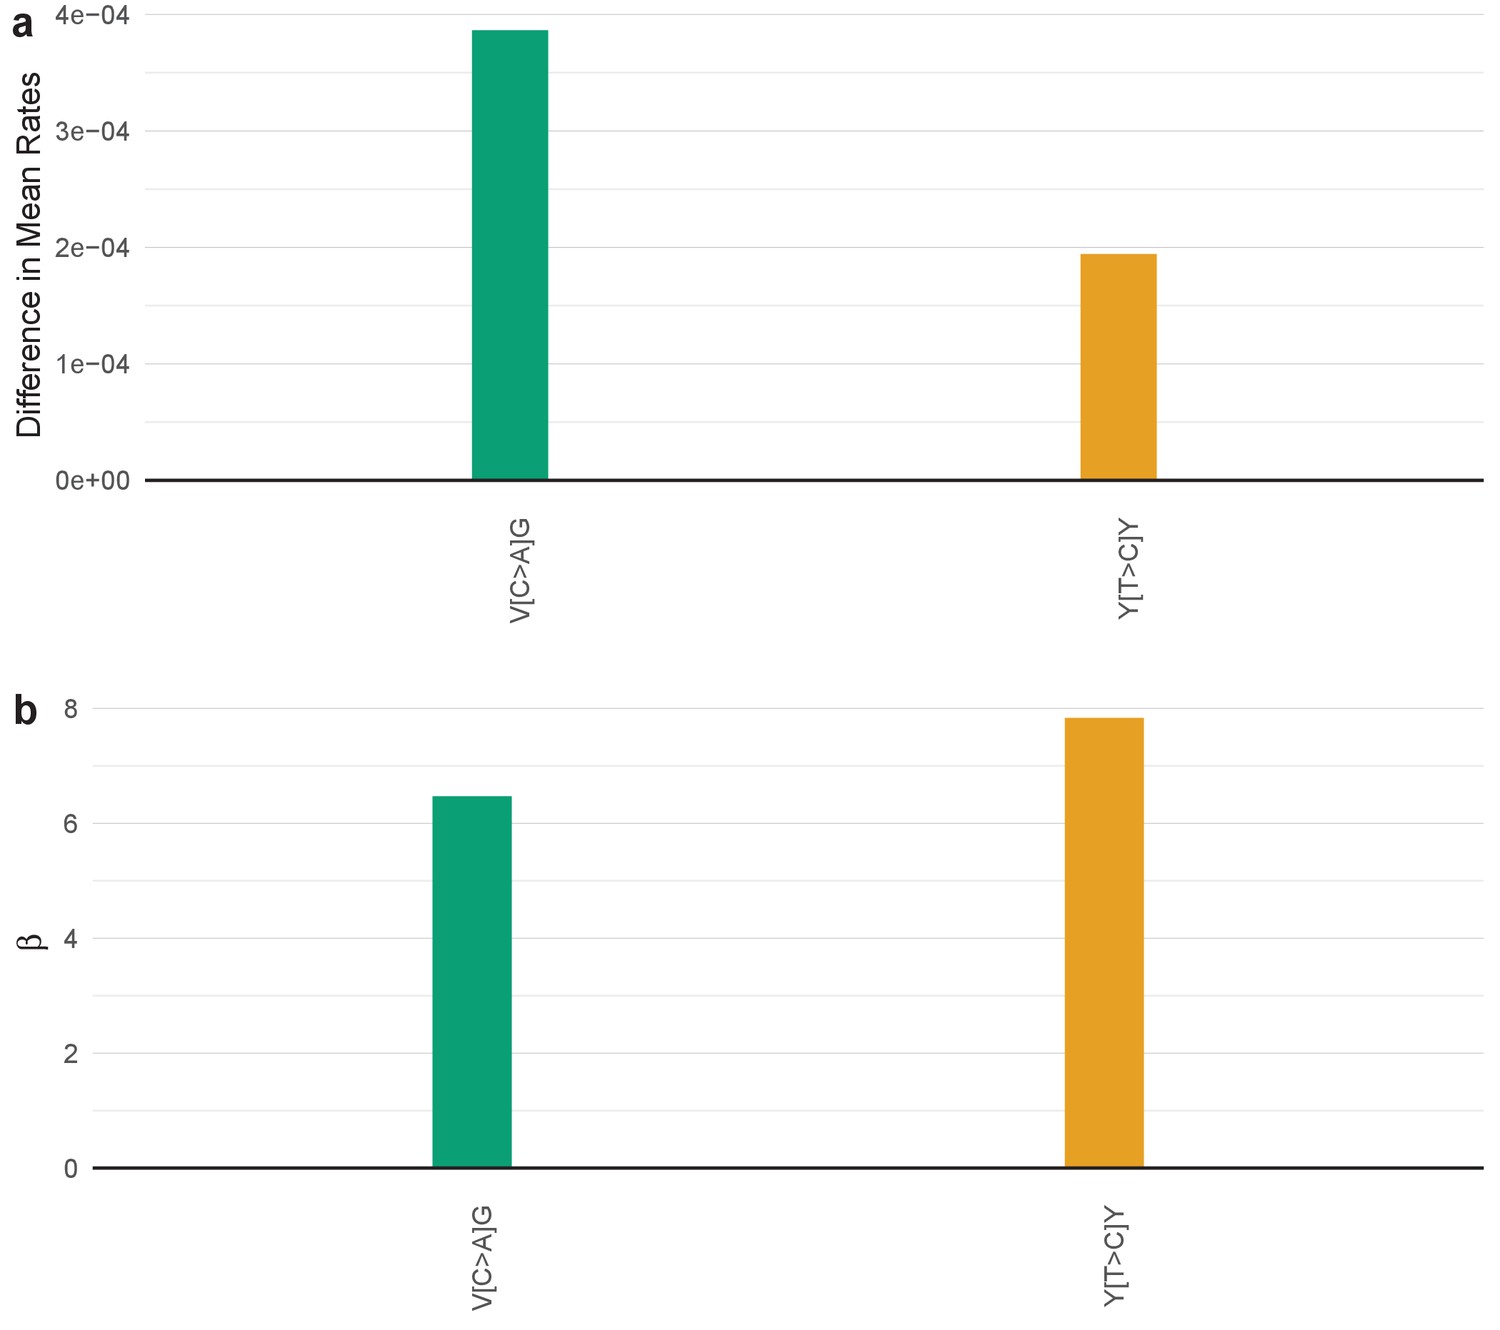
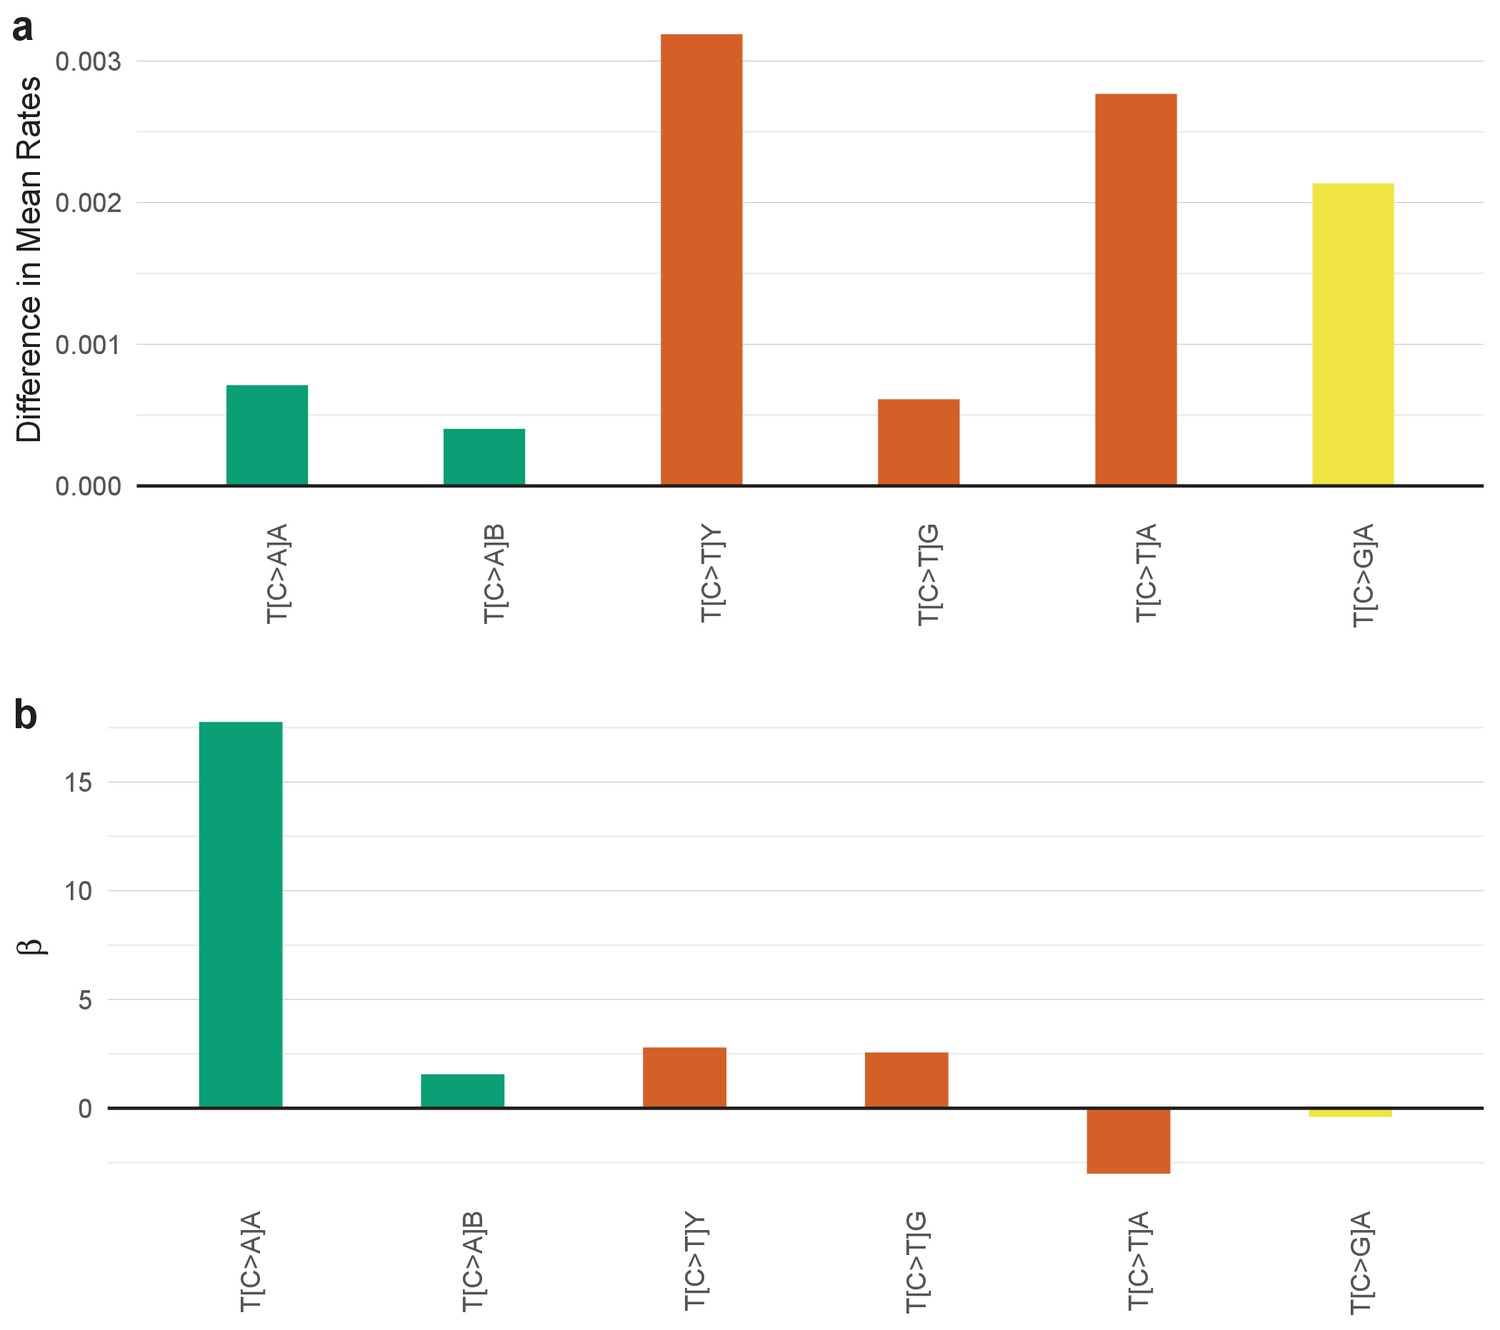
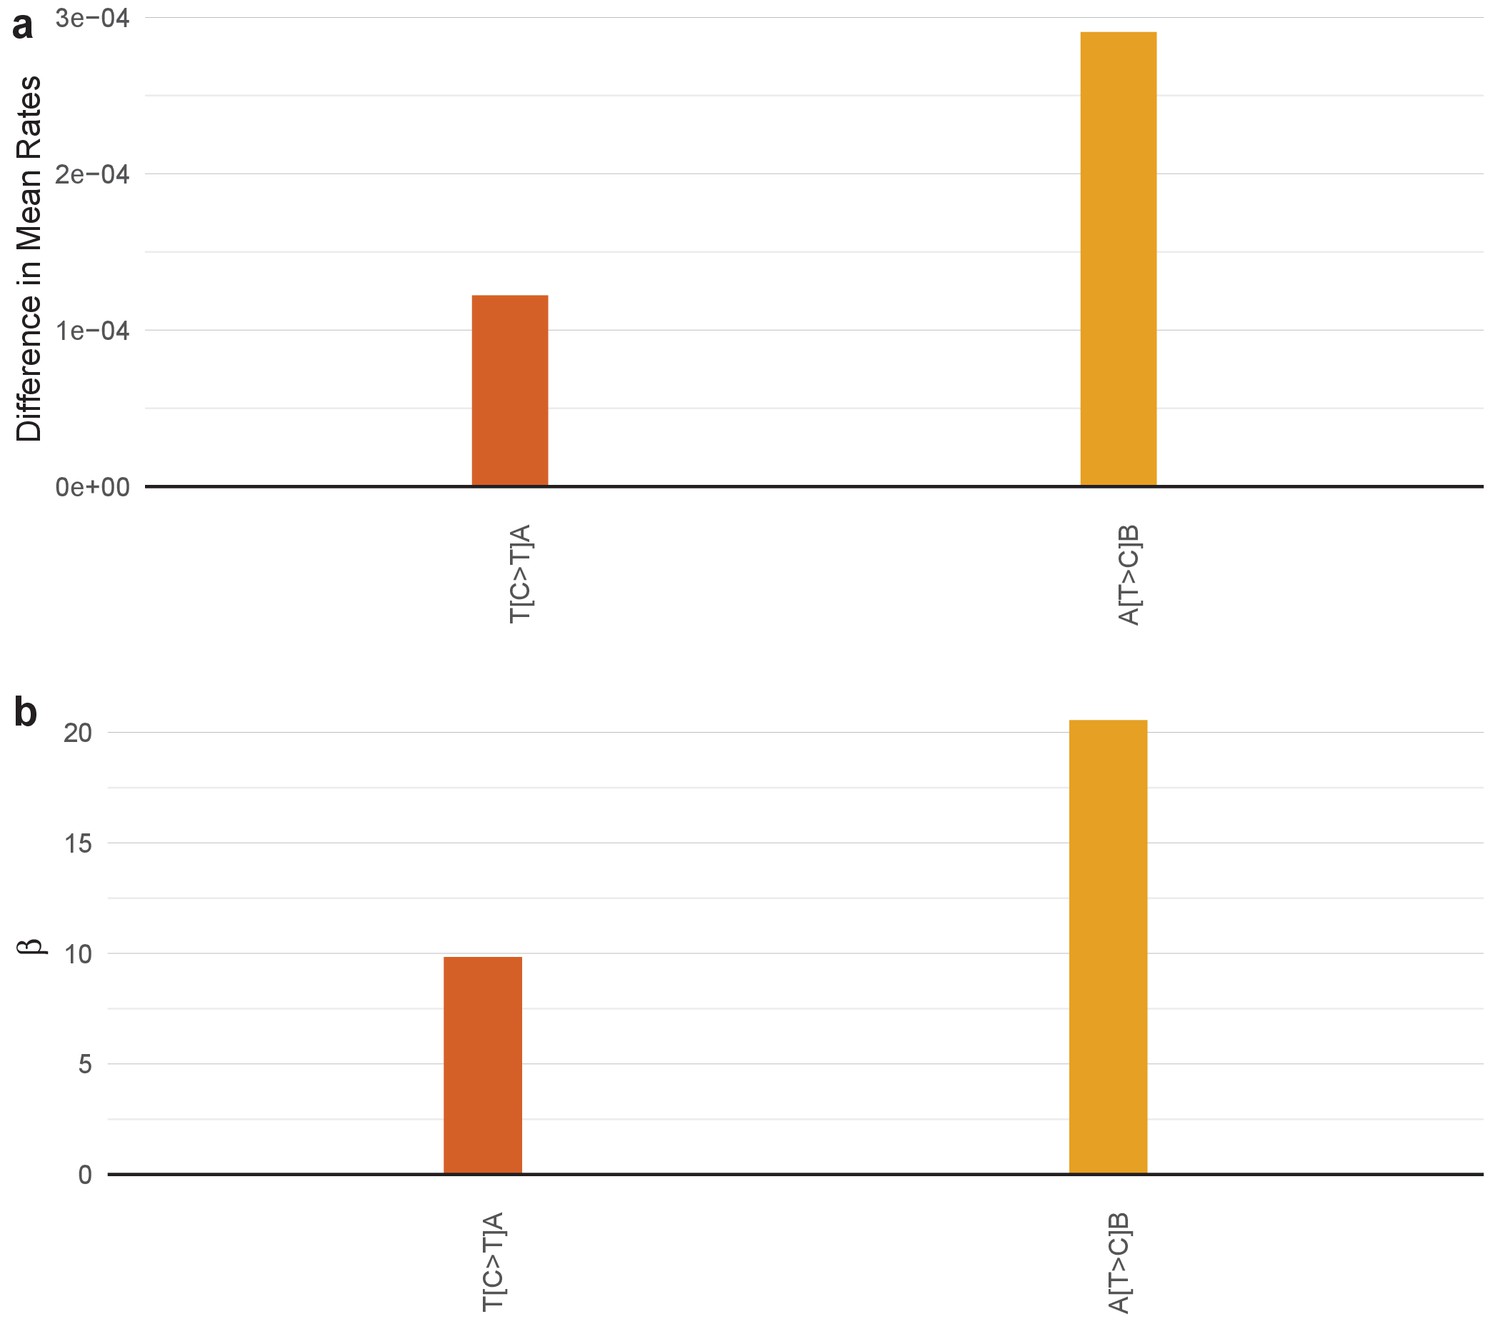
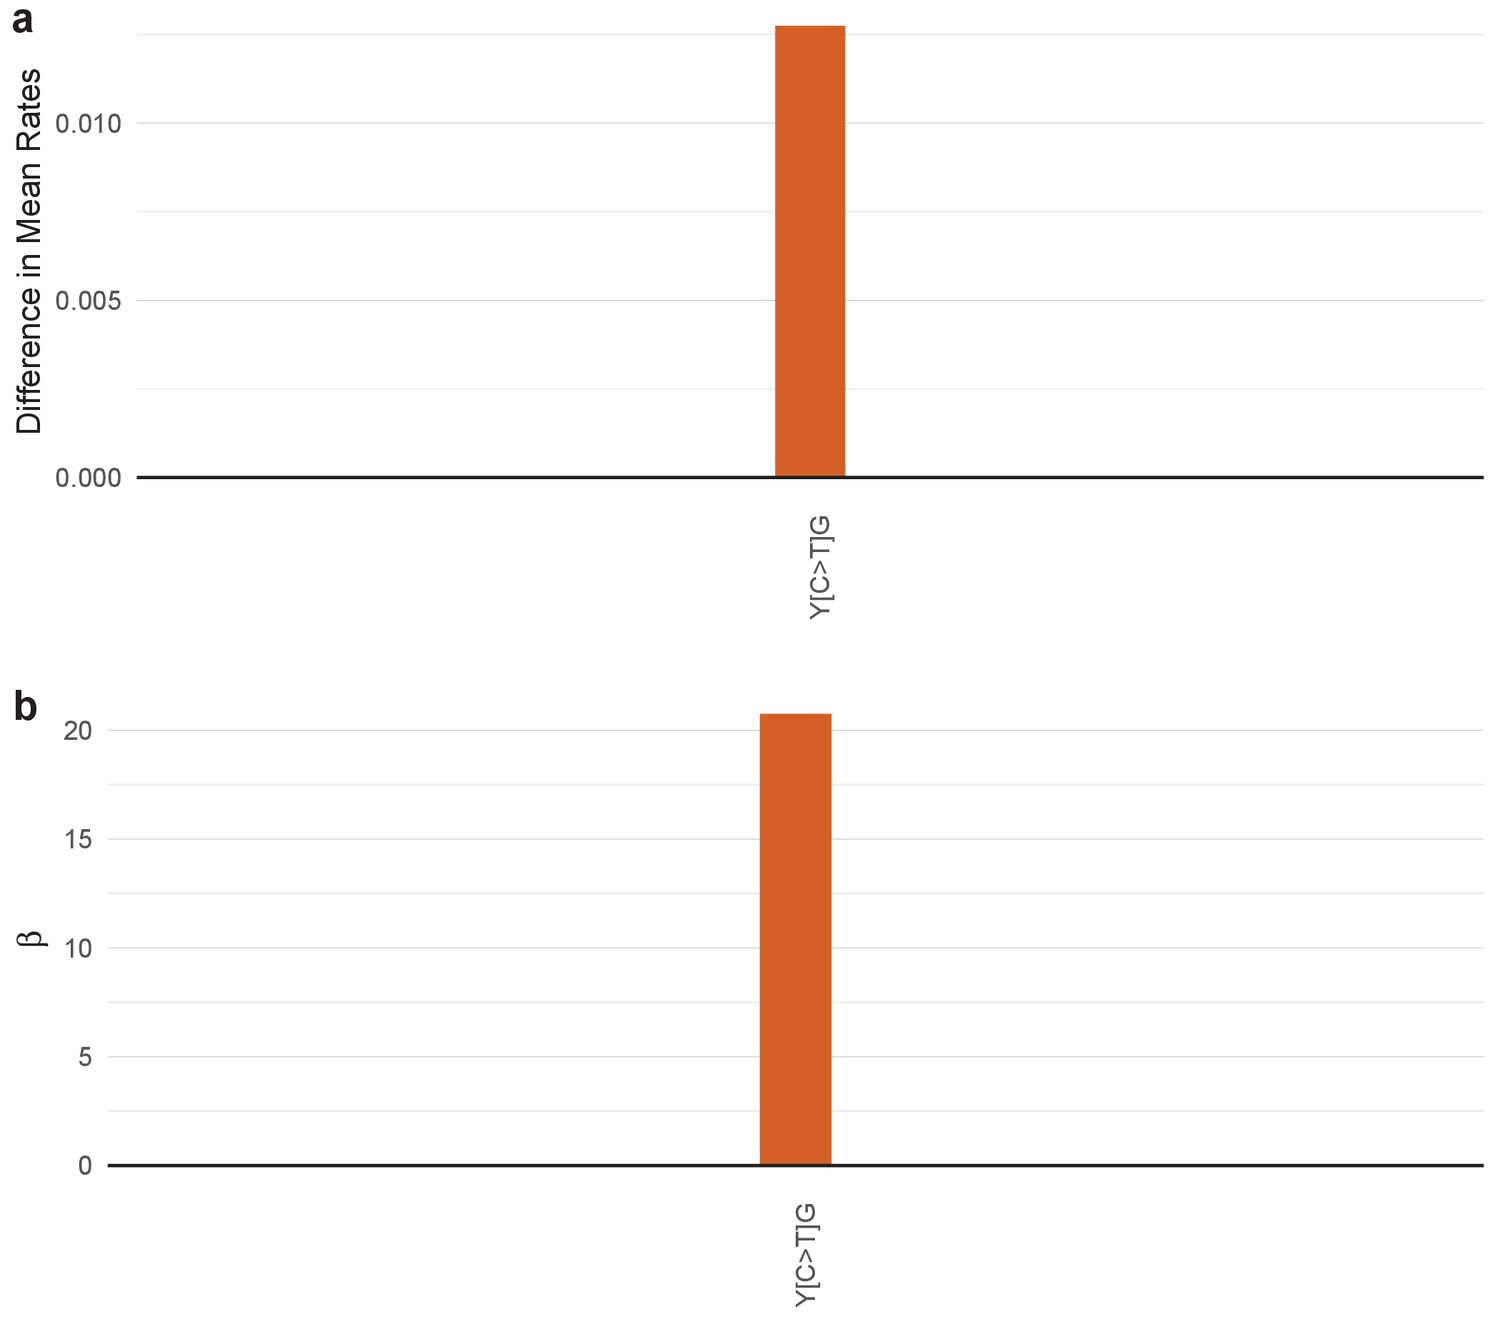
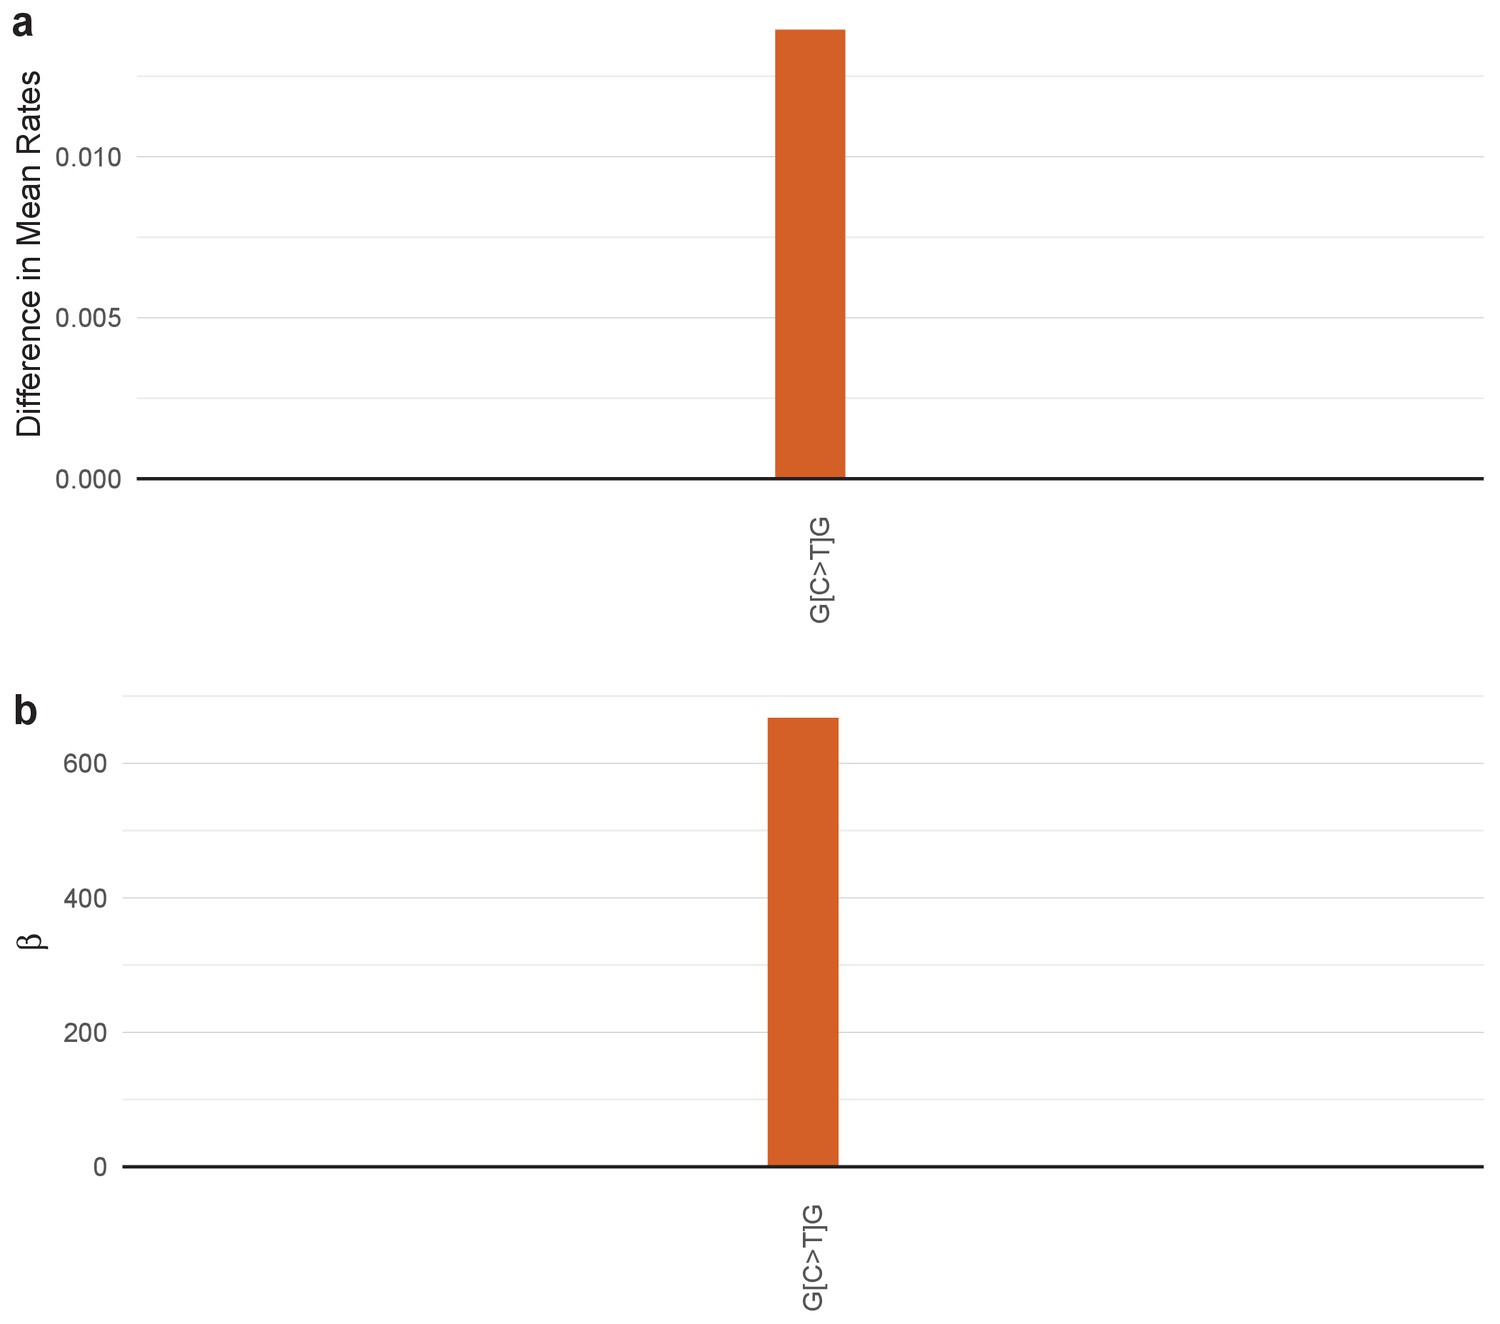
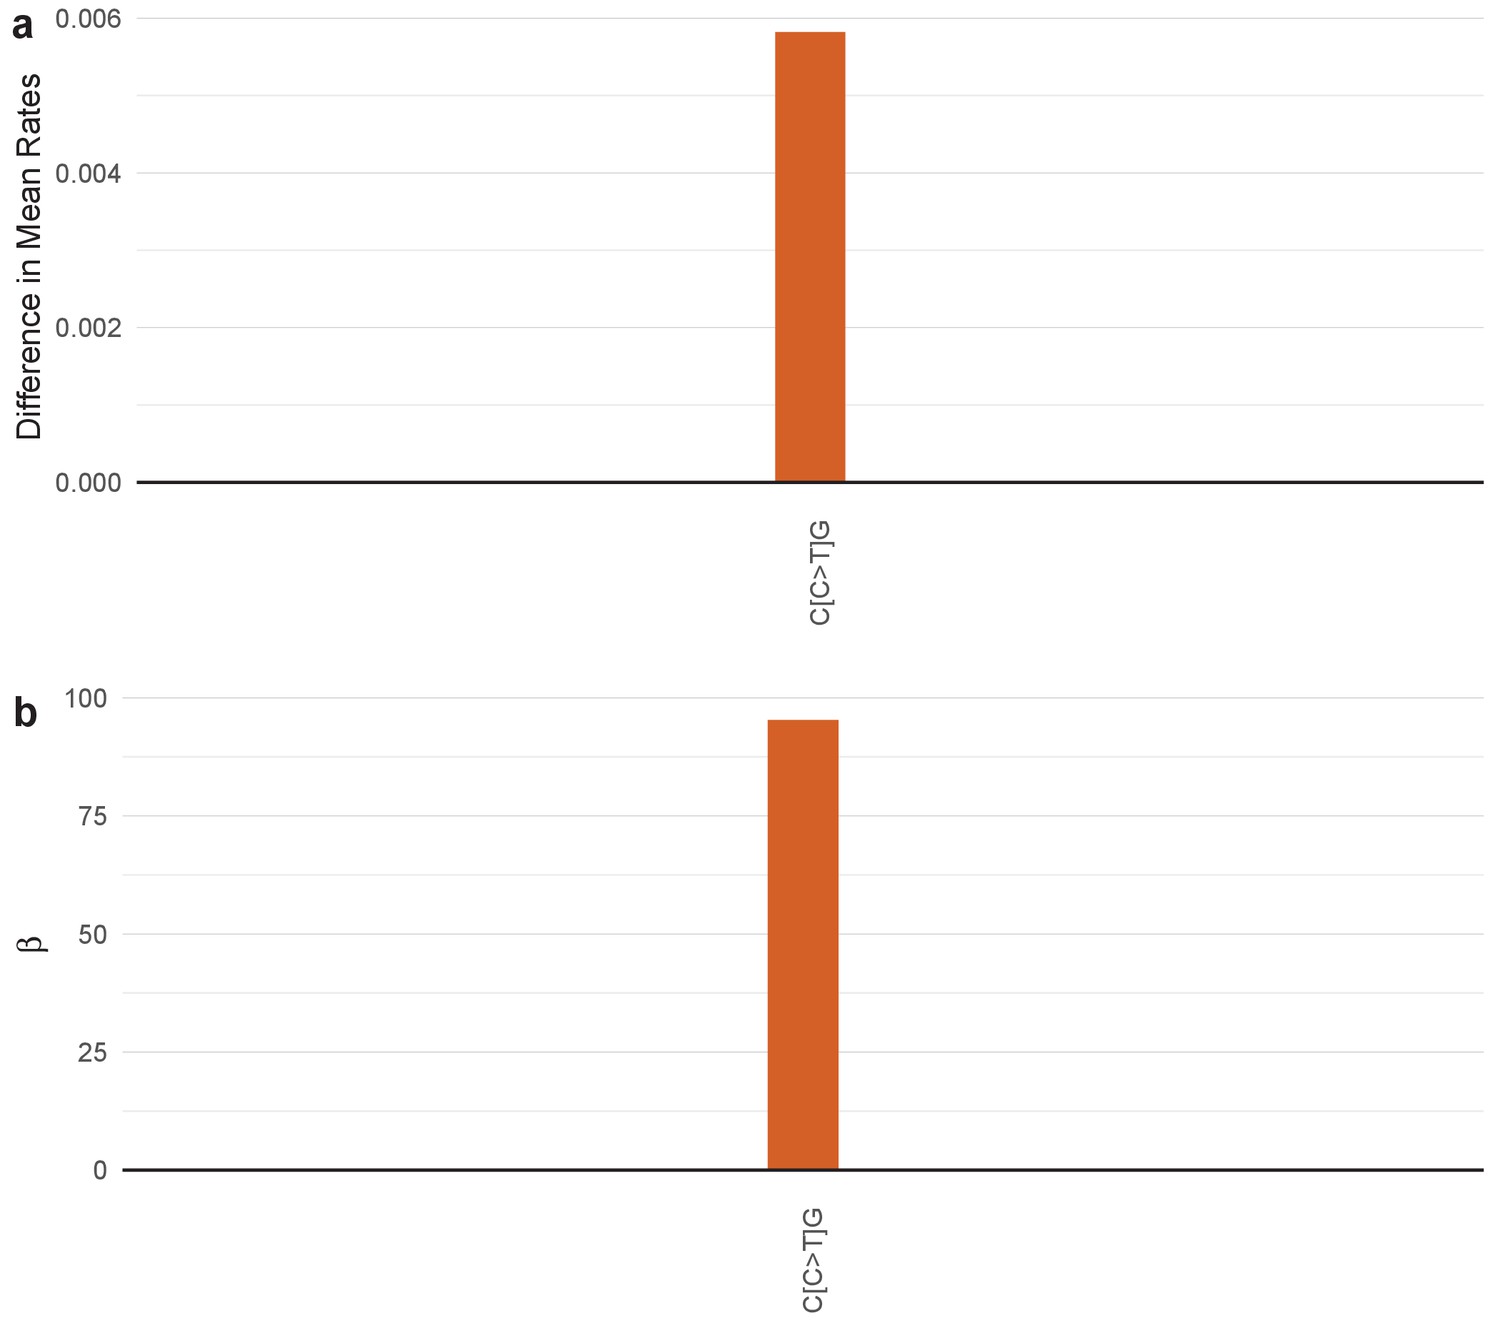
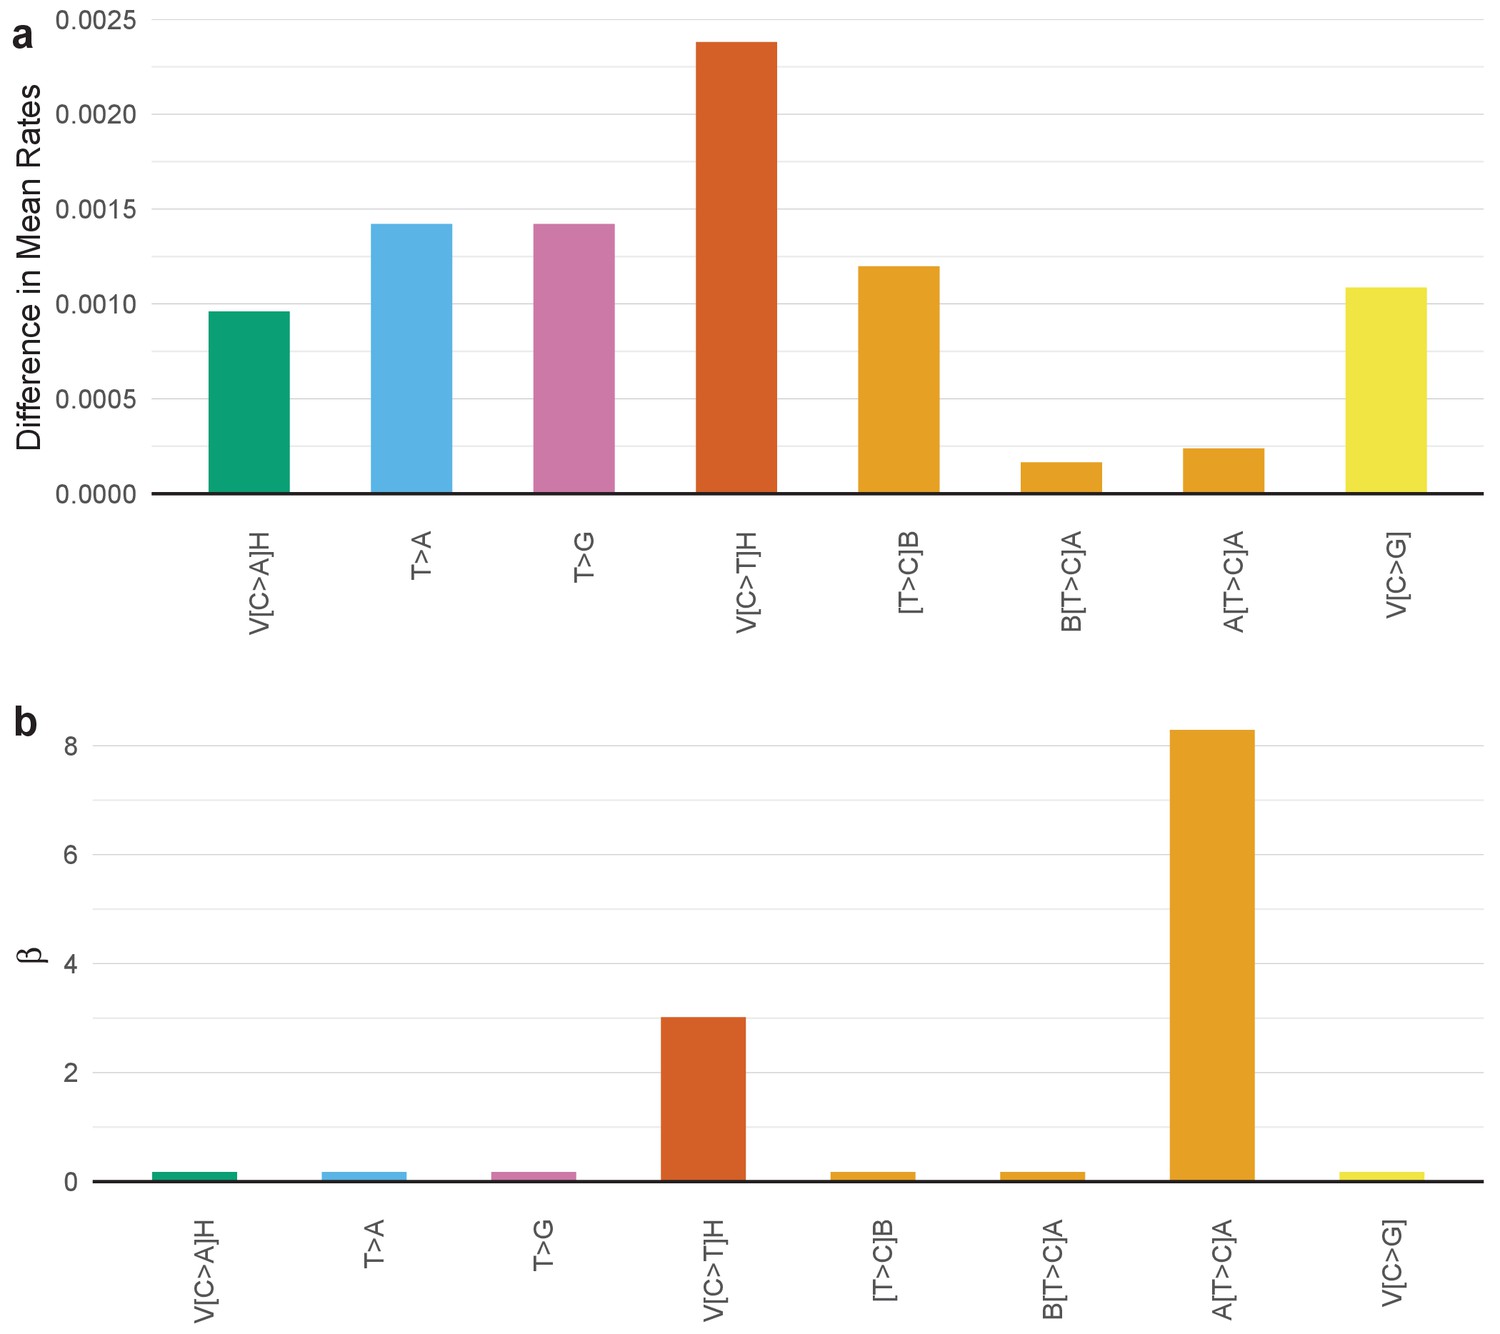
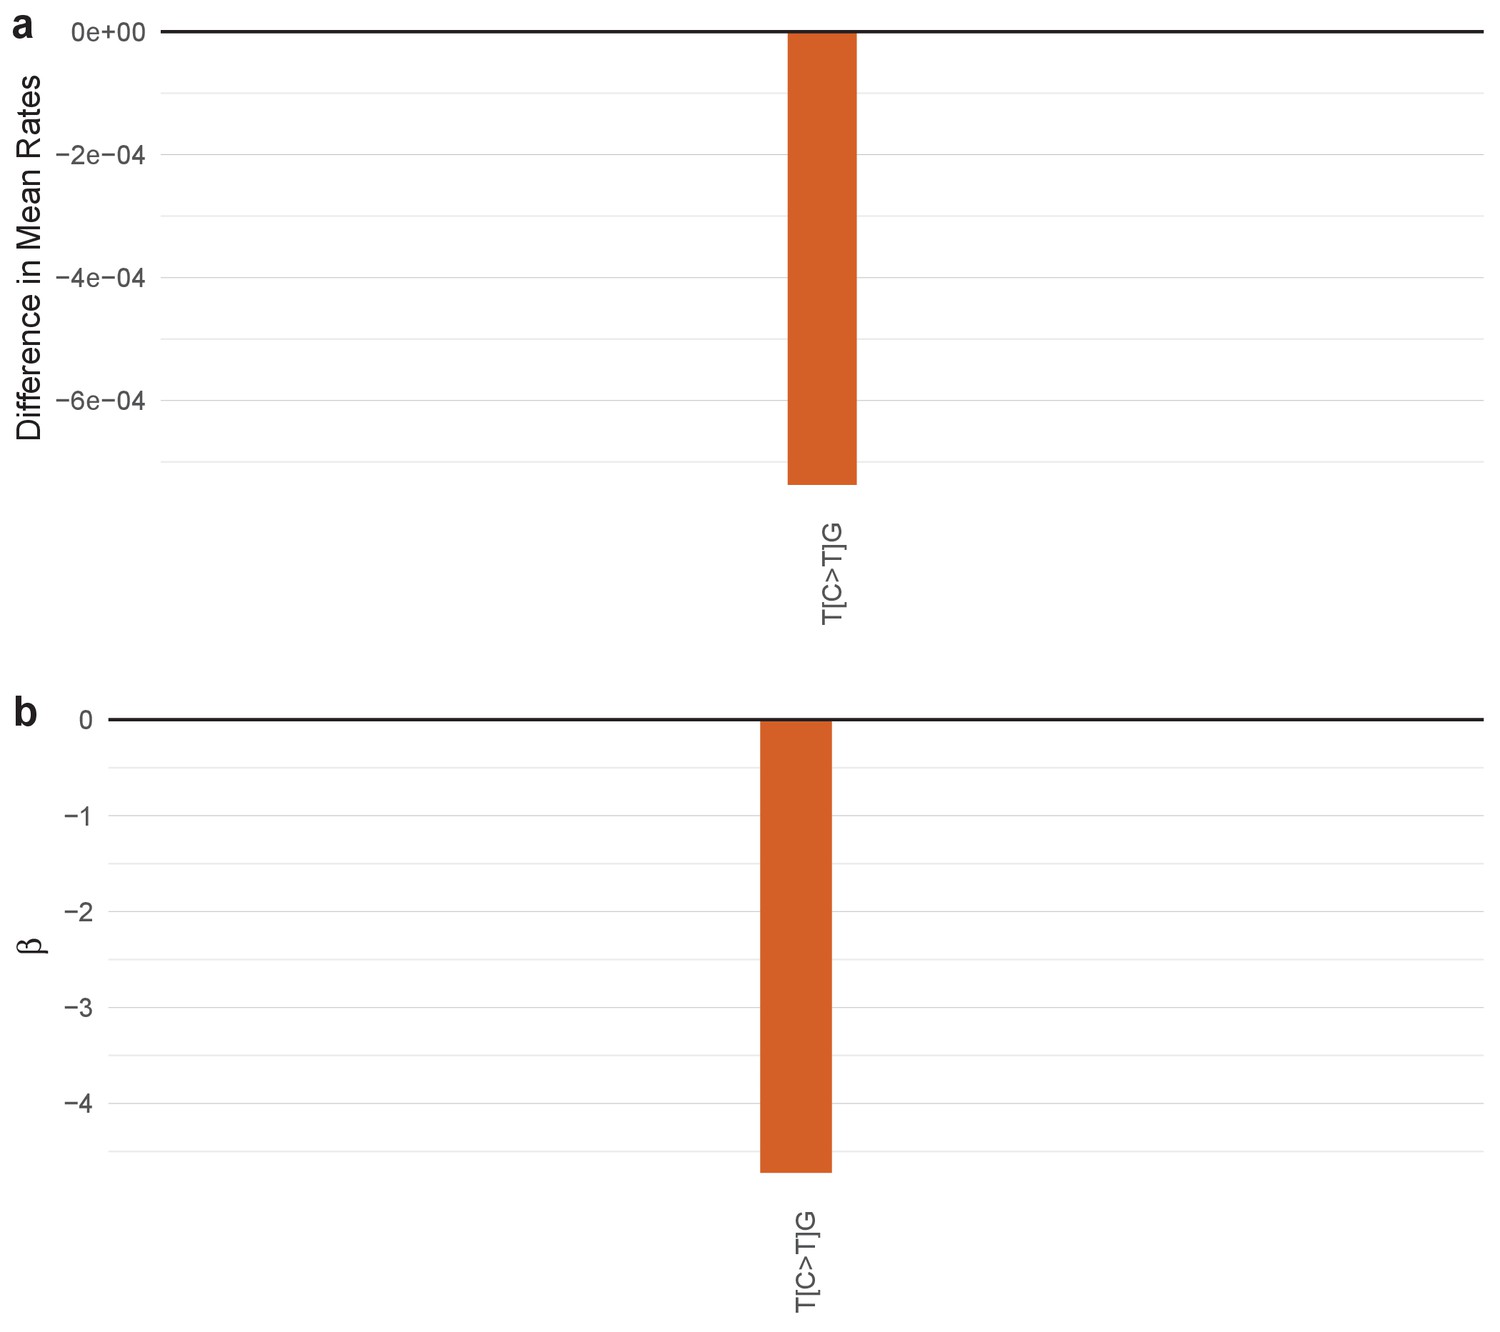
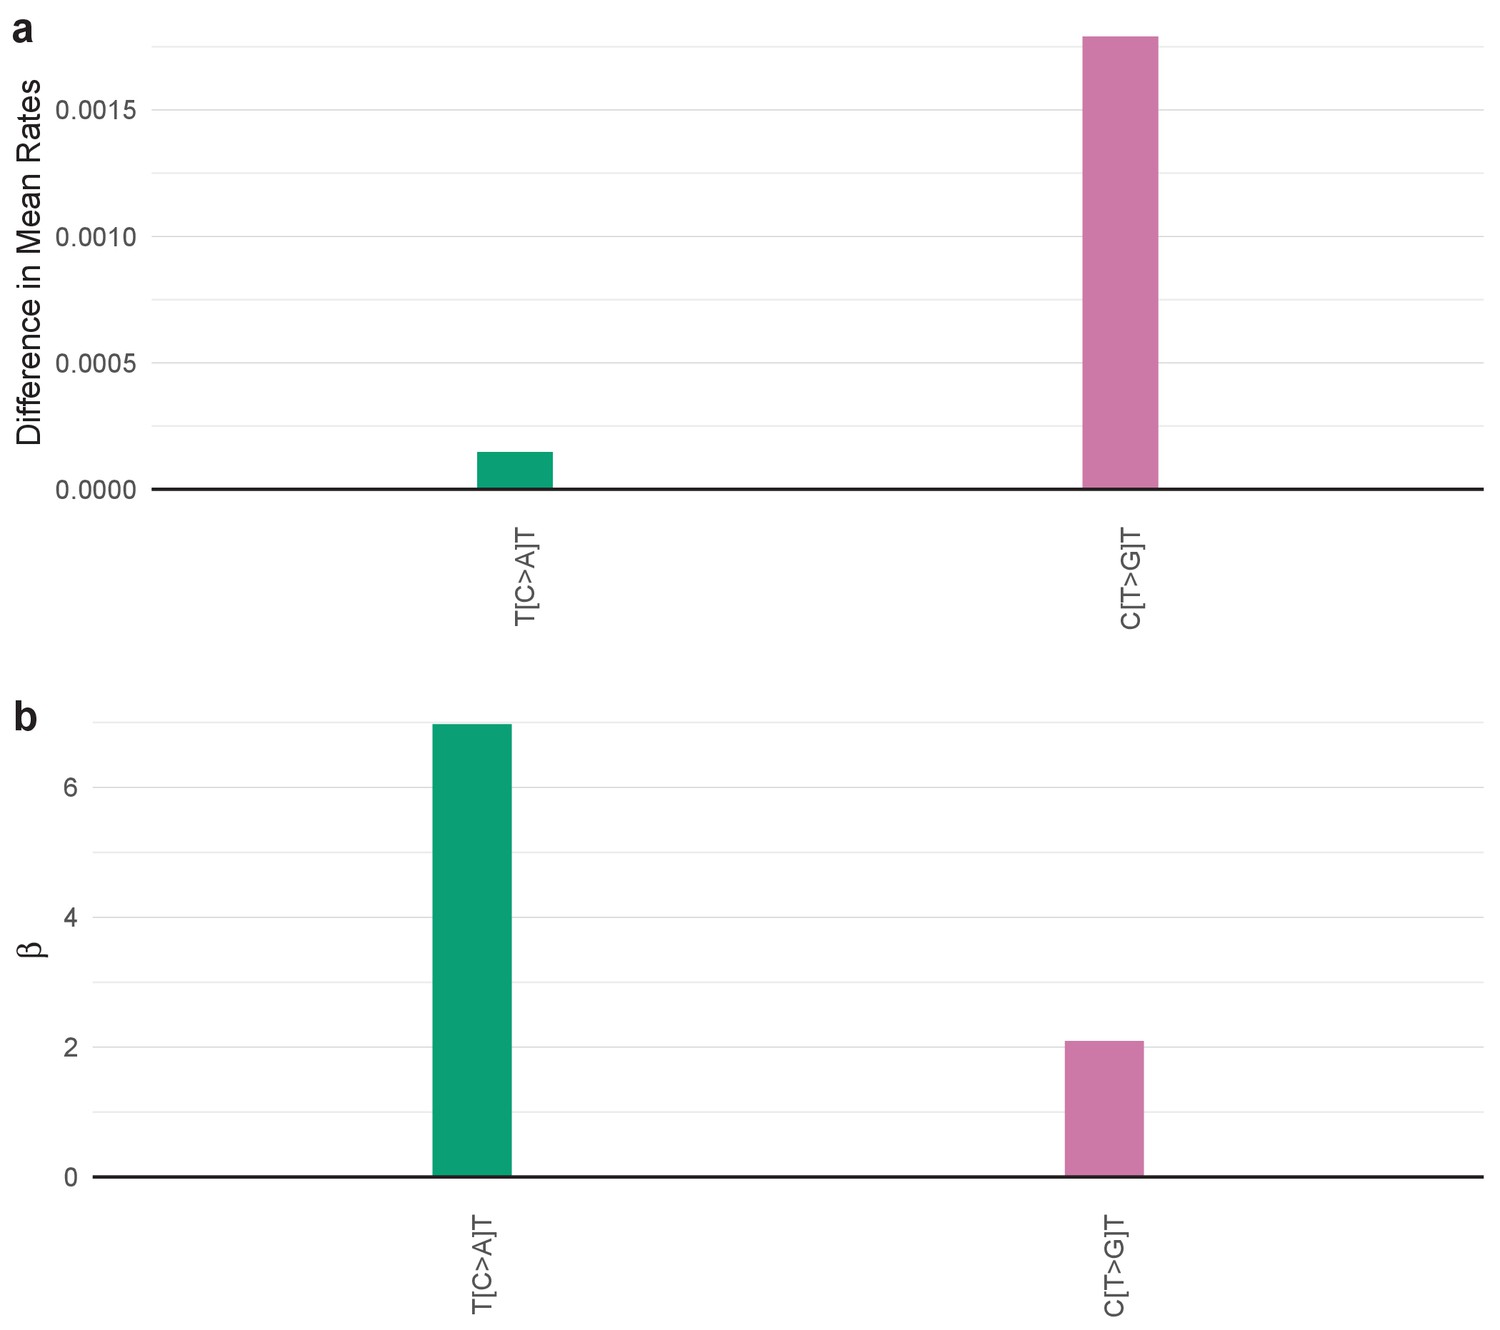
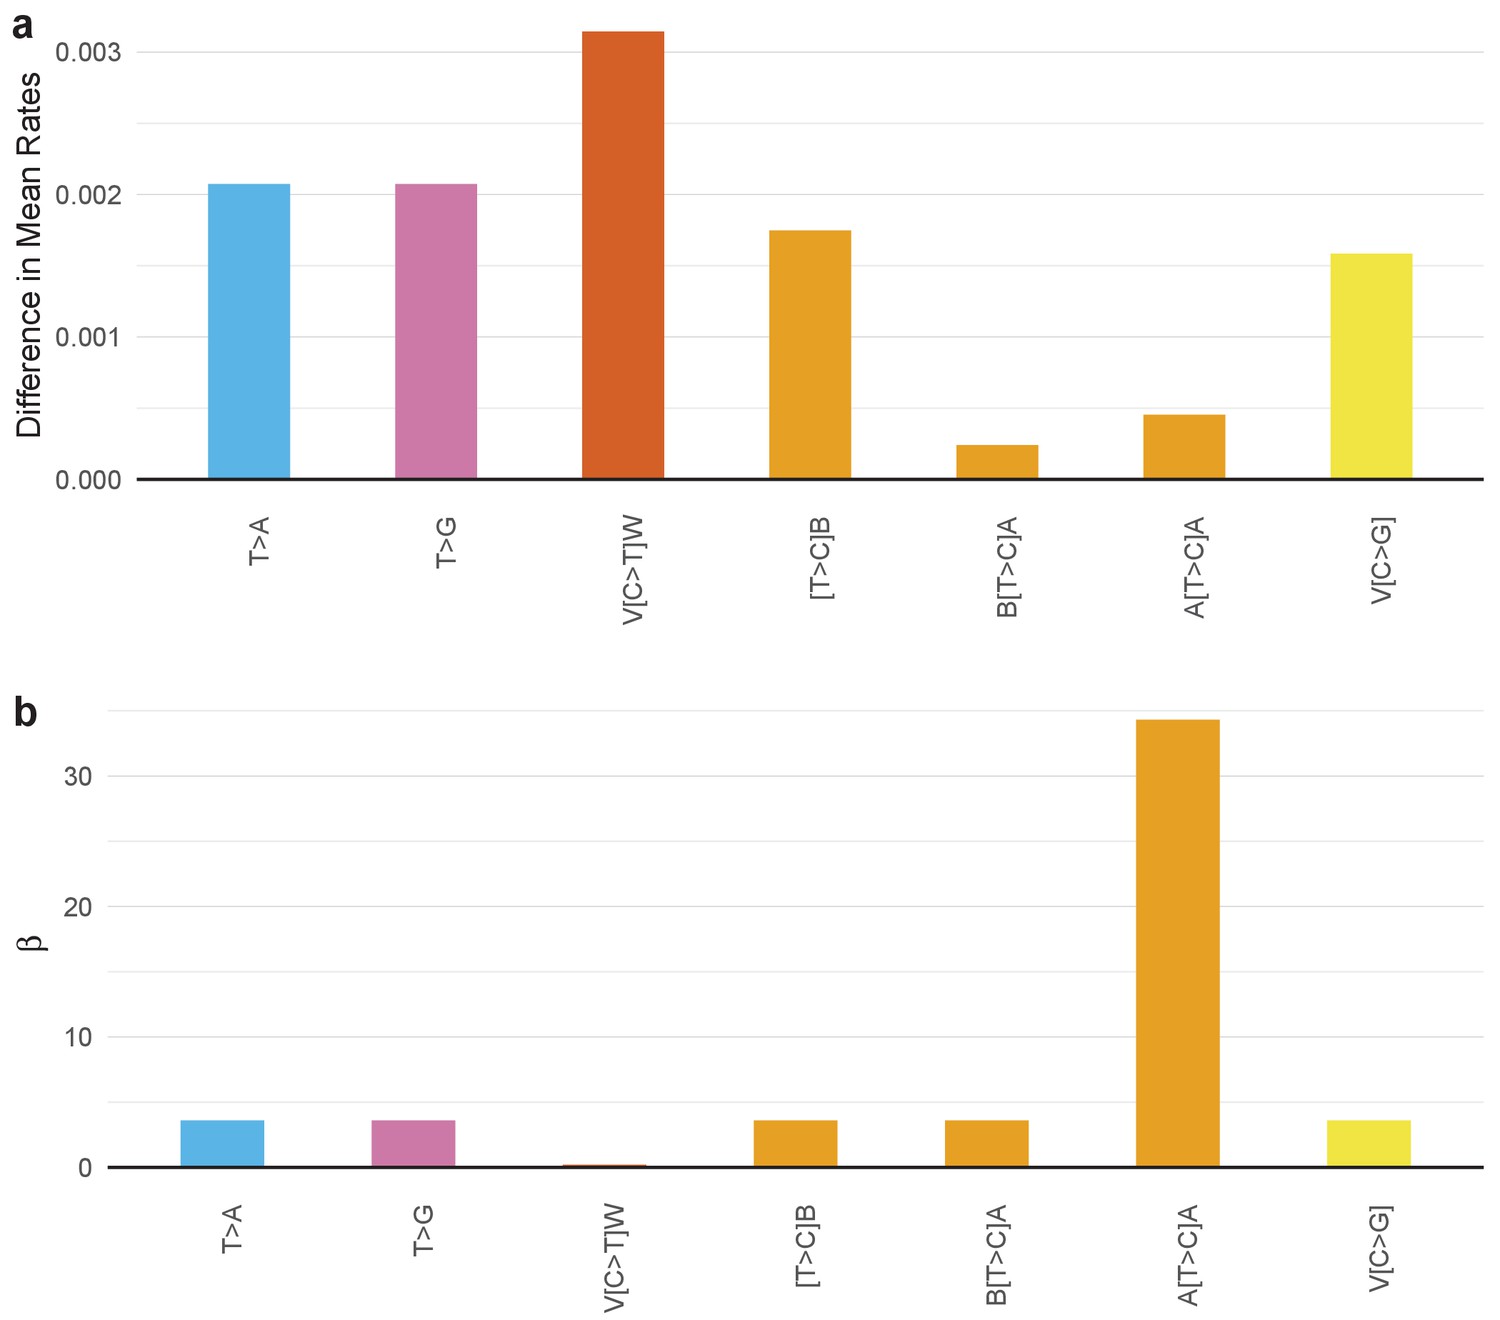
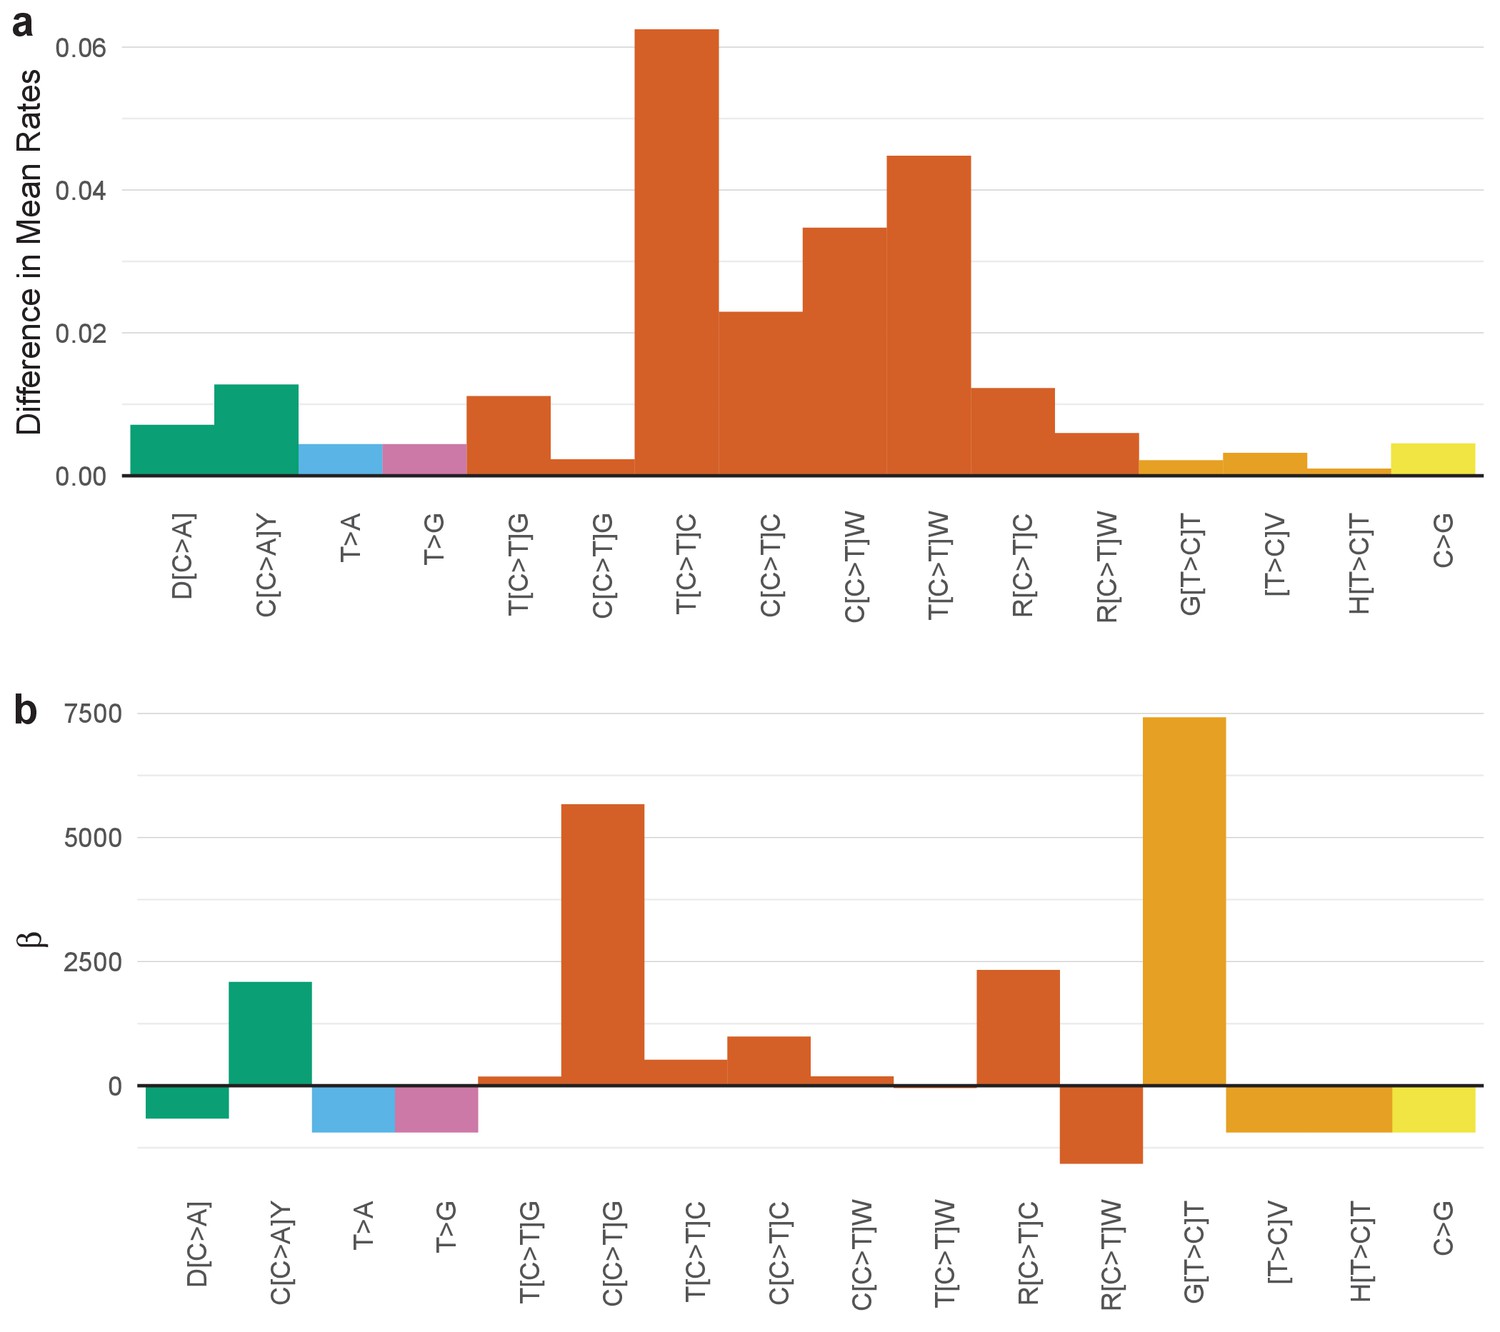
SuperSigs for age.
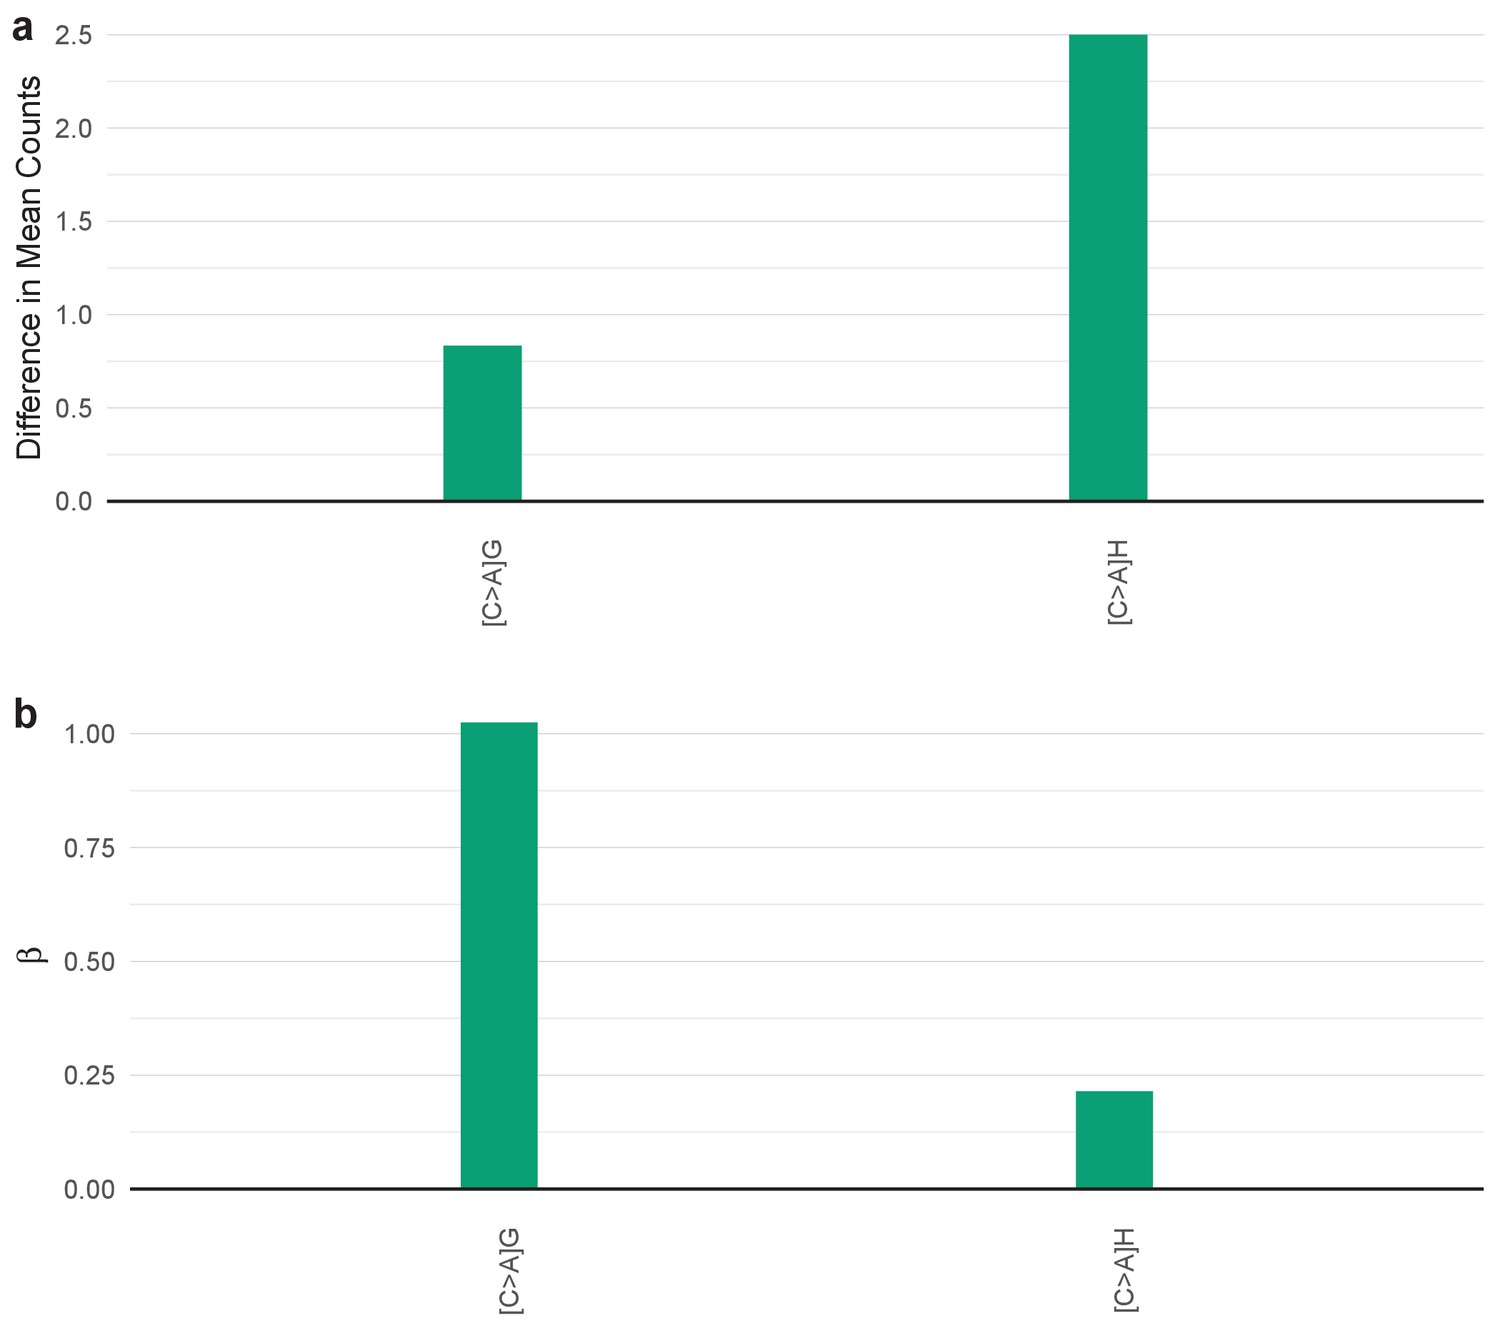
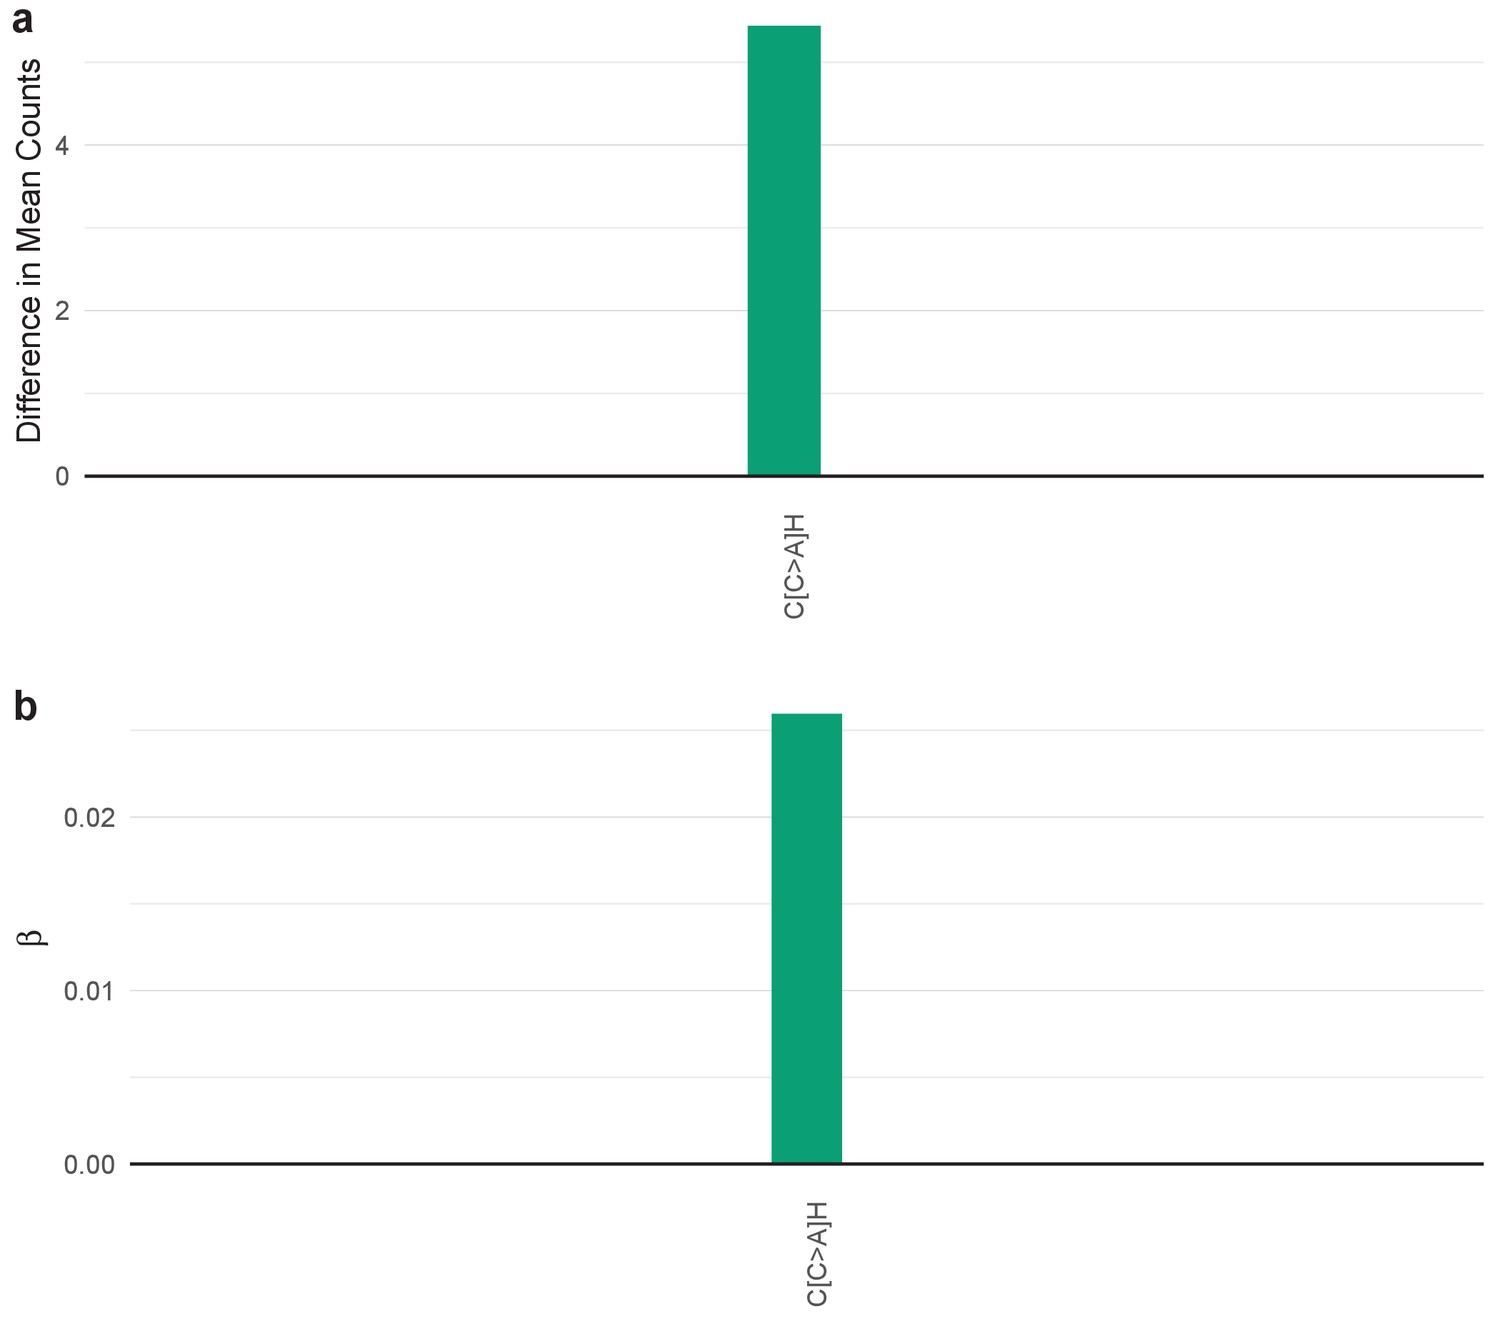
For the indicated cancer type all selected features of its age signature are listed (IUPAC notations: B=not A, D = not C, H = not G, V = not T, W = A or T, S = C or G, M = A or C, K = G or T, R = A or G, Y = C or T). The color of each bar is representing the point mutation type as follows: C to T mutations = red, C to A = green, C to G = yellow, T to C = orange, T to G = purple, T to A = blue. (a) The difference in the mean mutation count between old and young is reported for each predictive feature; (b) The beta of each predictive feature in the logistic regression is reported. Bars falling below zero represent mutation types which are underrepresented at older (when compared to younger) ages.
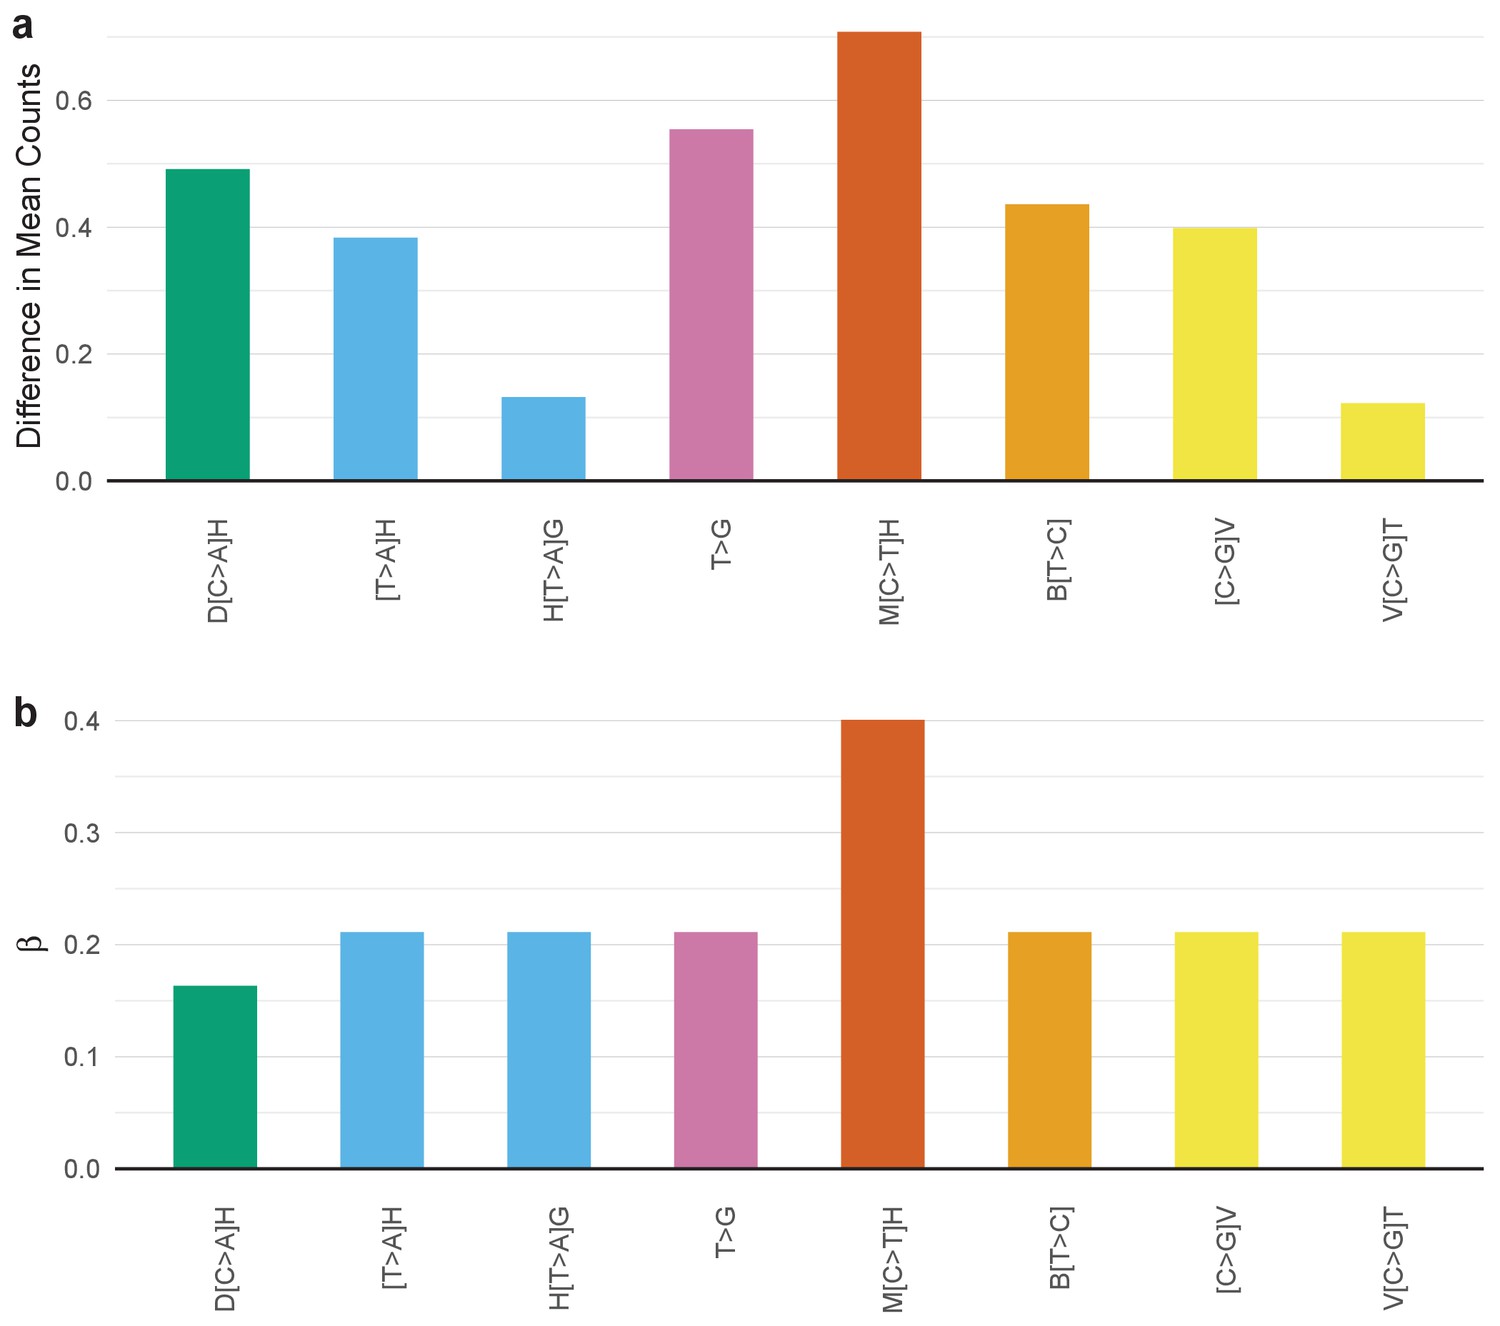
Figure 4—figure supplement 2
SuperSigs for age.
For the indicated cancer type all selected features of its age signature are listed (IUPAC notations: B=not A, D = not C, H = not G, V = not T, W = A or T, S = C or G, M = A or C, K = G or T, R = A or G, Y = C or T). The color of each bar is representing the point mutation type as follows: C to T mutations = red, C to A = green, C to G = yellow, T to C = orange, T to G = purple, T to A = blue. (a) The difference in the mean mutation count between old and young is reported for each predictive feature; (b) The beta of each predictive feature in the logistic regression is reported. Bars falling below zero represent mutation types which are underrepresented at older (when compared to younger) ages.
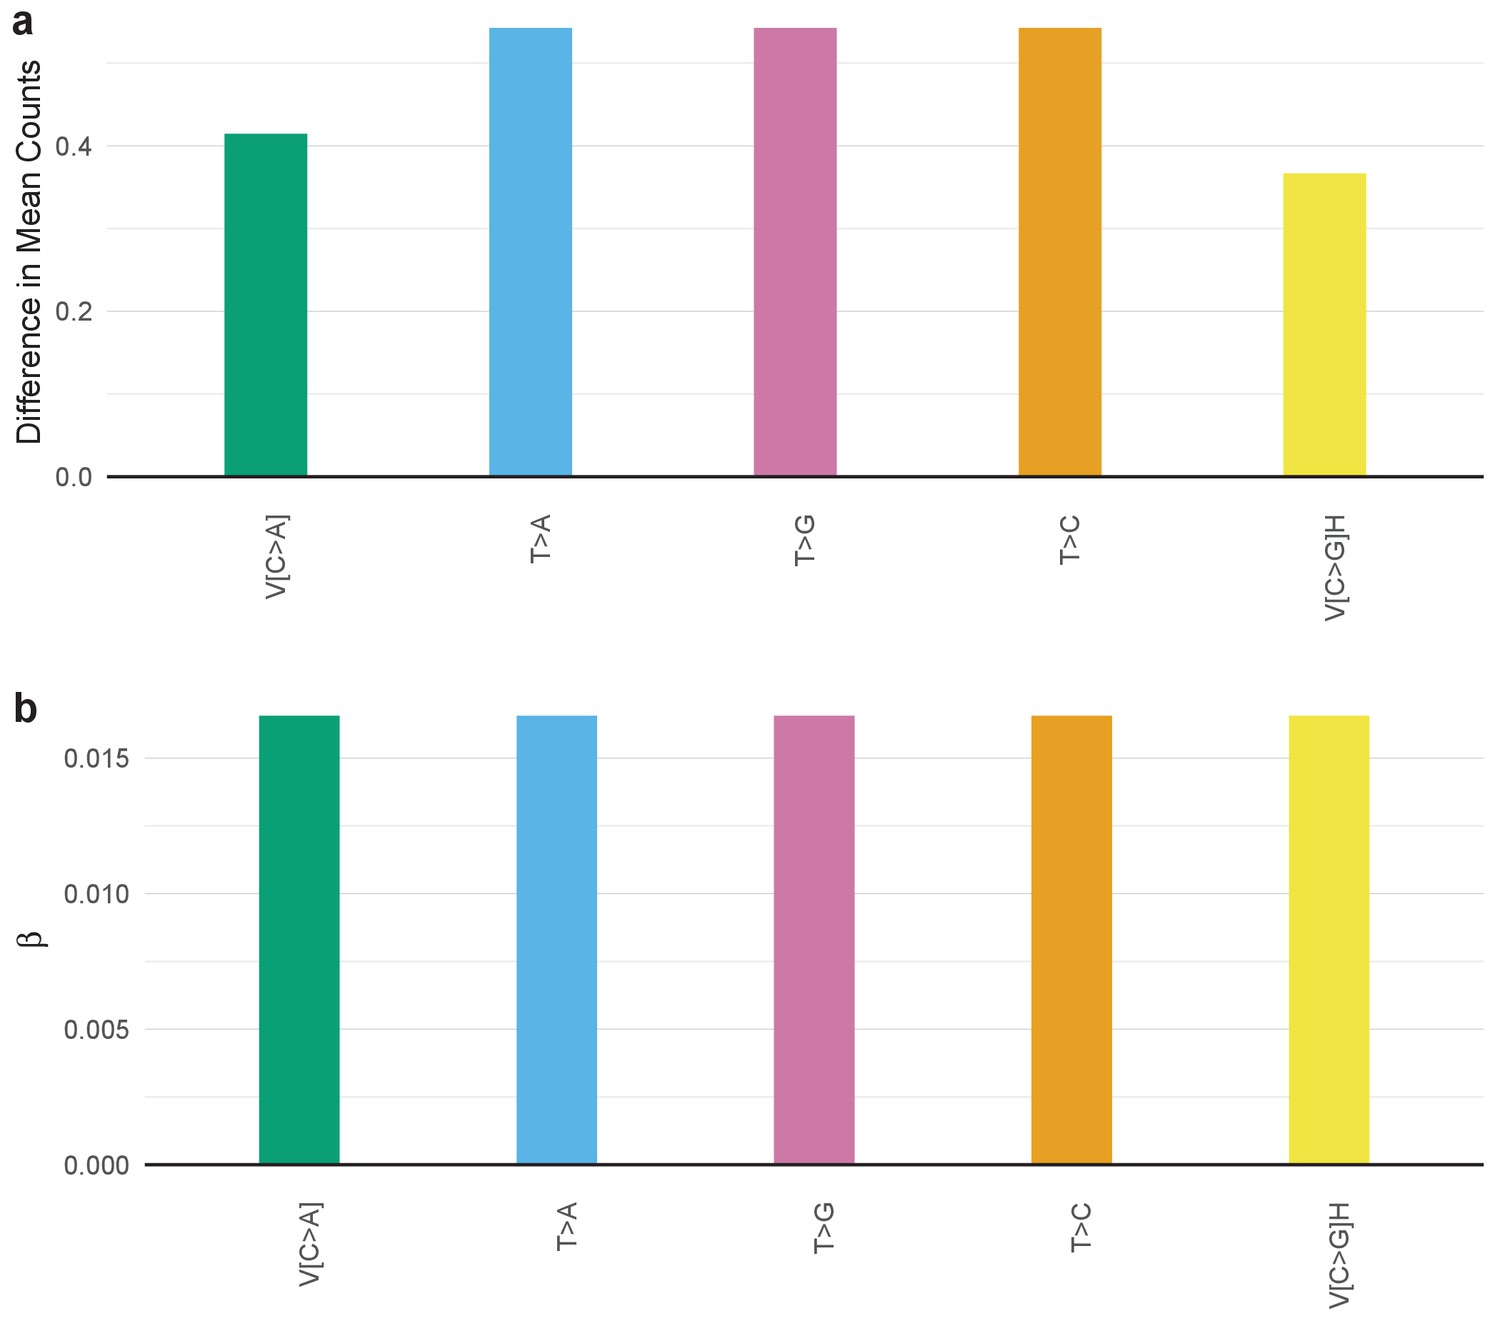
Figure 4—figure supplement 3
SuperSigs for age.
For the indicated cancer type all selected features of its age signature are listed (IUPAC notations: B=not A, D = not C, H = not G, V = not T, W = A or T, S = C or G, M = A or C, K = G or T, R = A or G, Y = C or T). The color of each bar is representing the point mutation type as follows: C to T mutations = red, C to A = green, C to G = yellow, T to C = orange, T to G = purple, T to A = blue. (a) The difference in the mean mutation count between old and young is reported for each predictive feature; (b) The beta of each predictive feature in the logistic regression is reported. Bars falling below zero represent mutation types which are underrepresented at older (when compared to younger) ages.
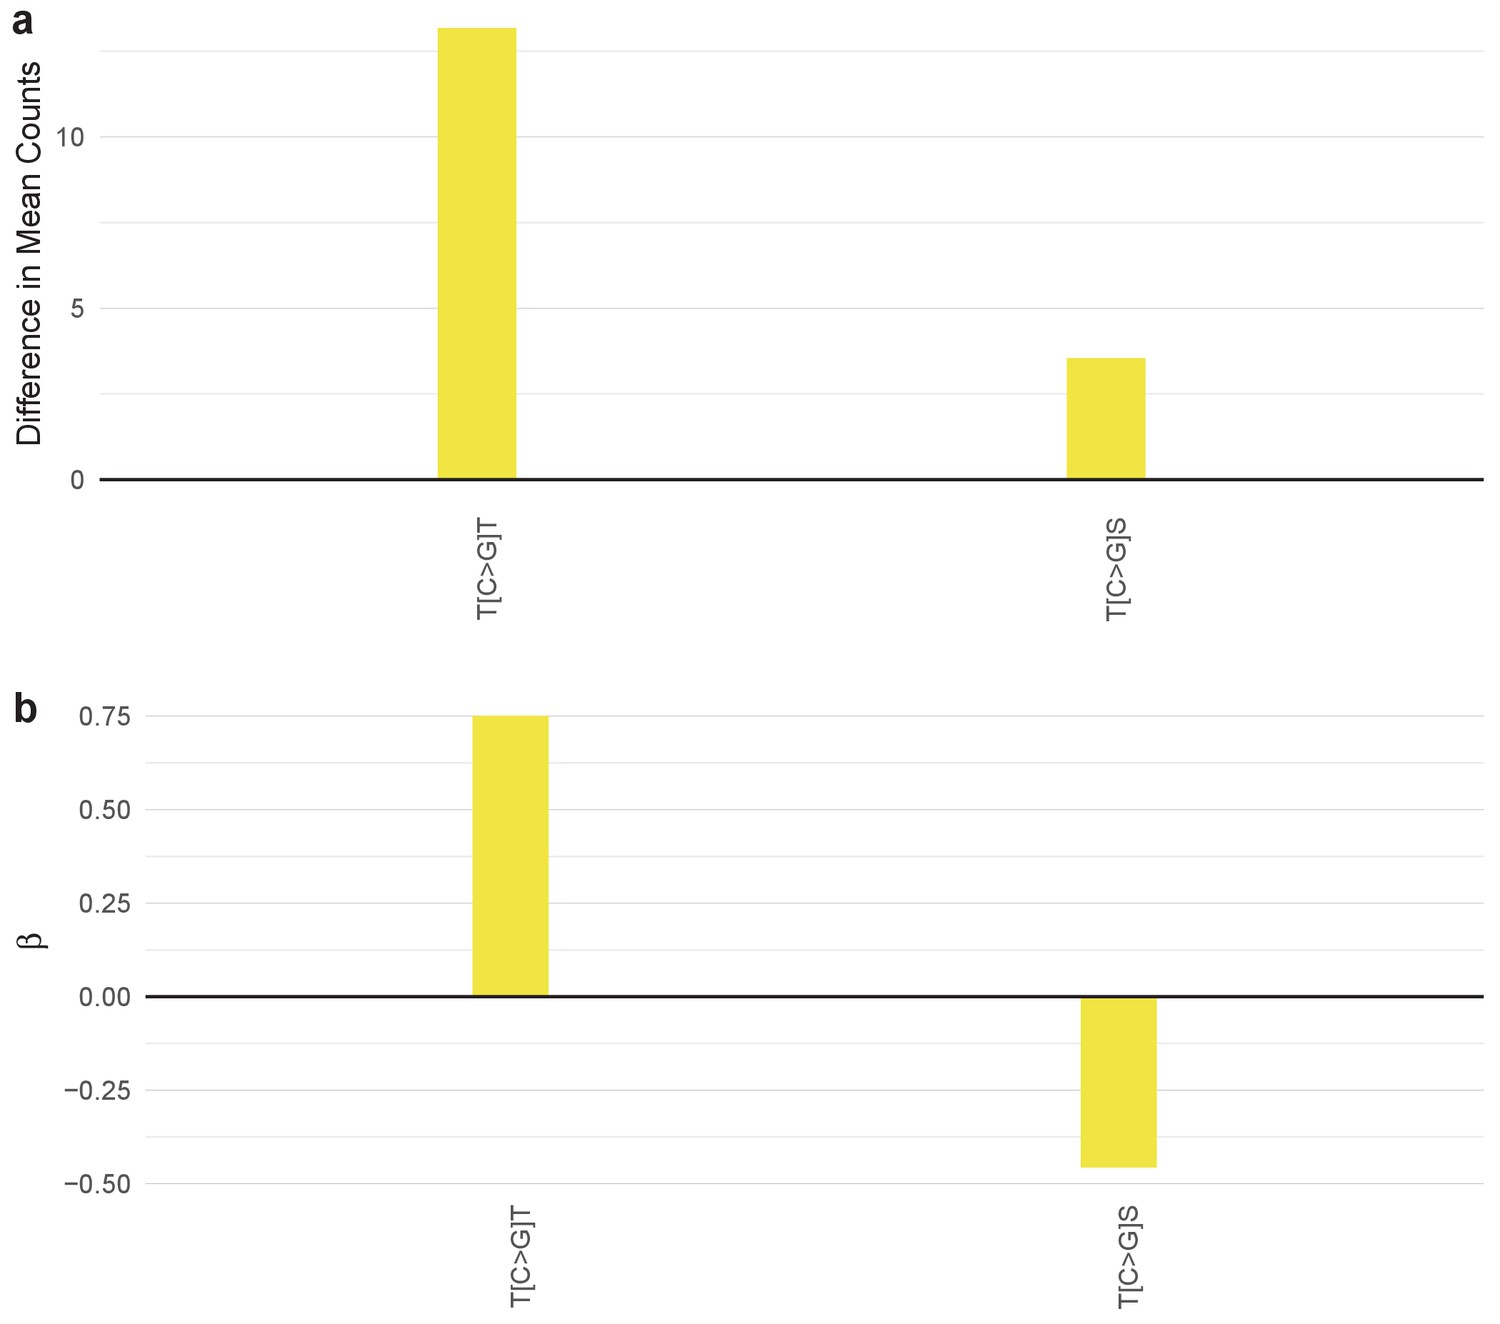
Figure 4—figure supplement 4
SuperSigs for age.
For the indicated cancer type all selected features of its age signature are listed (IUPAC notations: B=not A, D = not C, H = not G, V = not T, W = A or T, S = C or G, M = A or C, K = G or T, R = A or G, Y = C or T). The color of each bar is representing the point mutation type as follows: C to T mutations = red, C to A = green, C to G = yellow, T to C = orange, T to G = purple, T to A = blue. (a) The difference in the mean mutation count between old and young is reported for each predictive feature; (b) The beta of each predictive feature in the logistic regression is reported. Bars falling below zero represent mutation types which are underrepresented at older (when compared to younger) ages.
Figure 4—figure supplement 5

SuperSigs for age.
For the indicated cancer type all selected features of its age signature are listed (IUPAC notations: B=not A, D = not C, H = not G, V = not T, W = A or T, S = C or G, M = A or C, K = G or T, R = A or G, Y = C or T). The color of each bar is representing the point mutation type as follows: C to T mutations = red, C to A = green, C to G = yellow, T to C = orange, T to G = purple, T to A = blue. (a) The difference in the mean mutation count between old and young is reported for each predictive feature; (b) The beta of each predictive feature in the logistic regression is reported. Bars falling below zero represent mutation types which are underrepresented at older (when compared to younger) ages.
Figure 4—figure supplement 6
SuperSigs for age.
For the indicated cancer type all selected features of its age signature are listed (IUPAC notations: B=not A, D = not C, H = not G, V = not T, W = A or T, S = C or G, M = A or C, K = G or T, R = A or G, Y = C or T). The color of each bar is representing the point mutation type as follows: C to T mutations = red, C to A = green, C to G = yellow, T to C = orange, T to G = purple, T to A = blue. (a) The difference in the mean mutation count between old and young is reported for each predictive feature; (b) The beta of each predictive feature in the logistic regression is reported. Bars falling below zero represent mutation types which are underrepresented at older (when compared to younger) ages.
Figure 4—figure supplement 7
SuperSigs for age.
For the indicated cancer type all selected features of its age signature are listed (IUPAC notations: B=not A, D = not C, H = not G, V = not T, W = A or T, S = C or G, M = A or C, K = G or T, R = A or G, Y = C or T). The color of each bar is representing the point mutation type as follows: C to T mutations = red, C to A = green, C to G = yellow, T to C = orange, T to G = purple, T to A = blue. (a) The difference in the mean mutation count between old and young is reported for each predictive feature; (b) The beta of each predictive feature in the logistic regression is reported. Bars falling below zero represent mutation types which are underrepresented at older (when compared to younger) ages.
Figure 4—figure supplement 8
SuperSigs for age.
For the indicated cancer type all selected features of its age signature are listed (IUPAC notations: B=not A, D = not C, H = not G, V = not T, W = A or T, S = C or G, M = A or C, K = G or T, R = A or G, Y = C or T). The color of each bar is representing the point mutation type as follows: C to T mutations = red, C to A = green, C to G = yellow, T to C = orange, T to G = purple, T to A = blue. (a) The difference in the mean mutation count between old and young is reported for each predictive feature; (b) The beta of each predictive feature in the logistic regression is reported. Bars falling below zero represent mutation types which are underrepresented at older (when compared to younger) ages.
Figure 4—figure supplement 9
SuperSigs for age.
For the indicated cancer type all selected features of its age signature are listed (IUPAC notations: B=not A, D = not C, H = not G, V = not T, W = A or T, S = C or G, M = A or C, K = G or T, R = A or G, Y = C or T). The color of each bar is representing the point mutation type as follows: C to T mutations = red, C to A = green, C to G = yellow, T to C = orange, T to G = purple, T to A = blue. (a) The difference in the mean mutation count between old and young is reported for each predictive feature; (b) The beta of each predictive feature in the logistic regression is reported. Bars falling below zero represent mutation types which are underrepresented at older (when compared to younger) ages.
Figure 4—figure supplement 10
SuperSigs for age.
For the indicated cancer type all selected features of its age signature are listed (IUPAC notations: B=not A, D = not C, H = not G, V = not T, W = A or T, S = C or G, M = A or C, K = G or T, R = A or G, Y = C or T). The color of each bar is representing the point mutation type as follows: C to T mutations = red, C to A = green, C to G = yellow, T to C = orange, T to G = purple, T to A = blue. (a) The difference in the mean mutation count between old and young is reported for each predictive feature; (b) The beta of each predictive feature in the logistic regression is reported. Bars falling below zero represent mutation types which are underrepresented at older (when compared to younger) ages.
Figure 4—figure supplement 11
SuperSigs for age.
For the indicated cancer type all selected features of its age signature are listed (IUPAC notations: B=not A, D = not C, H = not G, V = not T, W = A or T, S = C or G, M = A or C, K = G or T, R = A or G, Y = C or T). The color of each bar is representing the point mutation type as follows: C to T mutations = red, C to A = green, C to G = yellow, T to C = orange, T to G = purple, T to A = blue. (a) The difference in the mean mutation count between old and young is reported for each predictive feature; (b) The beta of each predictive feature in the logistic regression is reported. Bars falling below zero represent mutation types which are underrepresented at older (when compared to younger) ages.
Figure 4—figure supplement 12
SuperSigs for age.
For the indicated cancer type all selected features of its age signature are listed (IUPAC notations: B=not A, D = not C, H = not G, V = not T, W = A or T, S = C or G, M = A or C, K = G or T, R = A or G, Y = C or T). The color of each bar is representing the point mutation type as follows: C to T mutations = red, C to A = green, C to G = yellow, T to C = orange, T to G = purple, T to A = blue. (a) The difference in the mean mutation count between old and young is reported for each predictive feature; (b) The beta of each predictive feature in the logistic regression is reported. Bars falling below zero represent mutation types which are underrepresented at older (when compared to younger) ages.
Figure 4—figure supplement 13
SuperSigs for age.
For the indicated cancer type all selected features of its age signature are listed (IUPAC notations: B=not A, D = not C, H = not G, V = not T, W = A or T, S = C or G, M = A or C, K = G or T, R = A or G, Y = C or T). The color of each bar is representing the point mutation type as follows: C to T mutations = red, C to A = green, C to G = yellow, T to C = orange, T to G = purple, T to A = blue. (a) The difference in the mean mutation count between old and young is reported for each predictive feature; (b) The beta of each predictive feature in the logistic regression is reported. Bars falling below zero represent mutation types which are underrepresented at older (when compared to younger) ages.
Figure 4—figure supplement 14
SuperSigs for age.
For the indicated cancer type all selected features of its age signature are listed (IUPAC notations: B=not A, D = not C, H = not G, V = not T, W = A or T, S = C or G, M = A or C, K = G or T, R = A or G, Y = C or T). The color of each bar is representing the point mutation type as follows: C to T mutations = red, C to A = green, C to G = yellow, T to C = orange, T to G = purple, T to A = blue. (a) The difference in the mean mutation count between old and young is reported for each predictive feature; (b) The beta of each predictive feature in the logistic regression is reported. Bars falling below zero represent mutation types which are underrepresented at older (when compared to younger) ages.
Figure 4—figure supplement 15
SuperSigs for age.
For the indicated cancer type all selected features of its age signature are listed (IUPAC notations: B=not A, D = not C, H = not G, V = not T, W = A or T, S = C or G, M = A or C, K = G or T, R = A or G, Y = C or T). The color of each bar is representing the point mutation type as follows: C to T mutations = red, C to A = green, C to G = yellow, T to C = orange, T to G = purple, T to A = blue. (a) The difference in the mean mutation count between old and young is reported for each predictive feature; (b) The beta of each predictive feature in the logistic regression is reported. Bars falling below zero represent mutation types which are underrepresented at older (when compared to younger) ages.
Figure 4—figure supplement 16
SuperSigs for age.
For the indicated cancer type all selected features of its age signature are listed (IUPAC notations: B=not A, D = not C, H = not G, V = not T, W = A or T, S = C or G, M = A or C, K = G or T, R = A or G, Y = C or T). The color of each bar is representing the point mutation type as follows: C to T mutations = red, C to A = green, C to G = yellow, T to C = orange, T to G = purple, T to A = blue. (a) The difference in the mean mutation count between old and young is reported for each predictive feature; (b) The beta of each predictive feature in the logistic regression is reported. Bars falling below zero represent mutation types which are underrepresented at older (when compared to younger) ages.
Figure 4—figure supplement 17
SuperSigs for age.
For the indicated cancer type all selected features of its age signature are listed (IUPAC notations: B=not A, D = not C, H = not G, V = not T, W = A or T, S = C or G, M = A or C, K = G or T, R = A or G, Y = C or T). The color of each bar is representing the point mutation type as follows: C to T mutations = red, C to A = green, C to G = yellow, T to C = orange, T to G = purple, T to A = blue. (a) The difference in the mean mutation count between old and young is reported for each predictive feature; (b) The beta of each predictive feature in the logistic regression is reported. Bars falling below zero represent mutation types which are underrepresented at older (when compared to younger) ages.
Figure 4—figure supplement 18
SuperSigs for age.
For the indicated cancer type all selected features of its age signature are listed (IUPAC notations: B=not A, D = not C, H = not G, V = not T, W = A or T, S = C or G, M = A or C, K = G or T, R = A or G, Y = C or T). The color of each bar is representing the point mutation type as follows: C to T mutations = red, C to A = green, C to G = yellow, T to C = orange, T to G = purple, T to A = blue. (a) The difference in the mean mutation count between old and young is reported for each predictive feature; (b) The beta of each predictive feature in the logistic regression is reported. Bars falling below zero represent mutation types which are underrepresented at older (when compared to younger) ages.
Figure 4—figure supplement 19
SuperSigs for age.
For the indicated cancer type all selected features of its age signature are listed (IUPAC notations: B=not A, D = not C, H = not G, V = not T, W = A or T, S = C or G, M = A or C, K = G or T, R = A or G, Y = C or T). The color of each bar is representing the point mutation type as follows: C to T mutations = red, C to A = green, C to G = yellow, T to C = orange, T to G = purple, T to A = blue. (a) The difference in the mean mutation count between old and young is reported for each predictive feature; (b) The beta of each predictive feature in the logistic regression is reported. Bars falling below zero represent mutation types which are underrepresented at older (when compared to younger) ages.
Figure 4—figure supplement 20
SuperSigs for age.
For the indicated cancer type all selected features of its age signature are listed (IUPAC notations: B=not A, D = not C, H = not G, V = not T, W = A or T, S = C or G, M = A or C, K = G or T, R = A or G, Y = C or T). The color of each bar is representing the point mutation type as follows: C to T mutations = red, C to A = green, C to G = yellow, T to C = orange, T to G = purple, T to A = blue. (a) The difference in the mean mutation count between old and young is reported for each predictive feature; (b) The beta of each predictive feature in the logistic regression is reported. Bars falling below zero represent mutation types which are underrepresented at older (when compared to younger) ages.
Figure 4—figure supplement 21
SuperSigs for age.
For the indicated cancer type all selected features of its age signature are listed (IUPAC notations: B=not A, D = not C, H = not G, V = not T, W = A or T, S = C or G, M = A or C, K = G or T, R = A or G, Y = C or T). The color of each bar is representing the point mutation type as follows: C to T mutations = red, C to A = green, C to G = yellow, T to C = orange, T to G = purple, T to A = blue. (a) The difference in the mean mutation count between old and young is reported for each predictive feature; (b) The beta of each predictive feature in the logistic regression is reported. Bars falling below zero represent mutation types which are underrepresented at older (when compared to younger) ages.
Figure 4—figure supplement 22
SuperSigs for age.
For the indicated cancer type all selected features of its age signature are listed (IUPAC notations: B=not A, D = not C, H = not G, V = not T, W = A or T, S = C or G, M = A or C, K = G or T, R = A or G, Y = C or T). The color of each bar is representing the point mutation type as follows: C to T mutations = red, C to A = green, C to G = yellow, T to C = orange, T to G = purple, T to A = blue. (a) The difference in the mean mutation count between old and young is reported for each predictive feature; (b) The beta of each predictive feature in the logistic regression is reported. Bars falling below zero represent mutation types which are underrepresented at older (when compared to younger) ages.
Figure 4—figure supplement 23
SuperSigs for age.
For the indicated cancer type all selected features of its age signature are listed (IUPAC notations: B=not A, D = not C, H = not G, V = not T, W = A or T, S = C or G, M = A or C, K = G or T, R = A or G, Y = C or T). The color of each bar is representing the point mutation type as follows: C to T mutations = red, C to A = green, C to G = yellow, T to C = orange, T to G = purple, T to A = blue. (a) The difference in the mean mutation count between old and young is reported for each predictive feature; (b) The beta of each predictive feature in the logistic regression is reported. Bars falling below zero represent mutation types which are underrepresented at older (when compared to younger) ages.
Figure 4—figure supplement 24
SuperSigs for age.
For the indicated cancer type all selected features of its age signature are listed (IUPAC notations: B=not A, D = not C, H = not G, V = not T, W = A or T, S = C or G, M = A or C, K = G or T, R = A or G, Y = C or T). The color of each bar is representing the point mutation type as follows: C to T mutations = red, C to A = green, C to G = yellow, T to C = orange, T to G = purple, T to A = blue. (a) The difference in the mean mutation count between old and young is reported for each predictive feature; (b) The beta of each predictive feature in the logistic regression is reported. Bars falling below zero represent mutation types which are underrepresented at older (when compared to younger) ages.
Figure 4—figure supplement 25
SuperSigs for age.
For the indicated cancer type all selected features of its age signature are listed (IUPAC notations: B=not A, D = not C, H = not G, V = not T, W = A or T, S = C or G, M = A or C, K = G or T, R = A or G, Y = C or T). The color of each bar is representing the point mutation type as follows: C to T mutations = red, C to A = green, C to G = yellow, T to C = orange, T to G = purple, T to A = blue. (a) The difference in the mean mutation count between old and young is reported for each predictive feature; (b) The beta of each predictive feature in the logistic regression is reported. Bars falling below zero represent mutation types which are underrepresented at older (when compared to younger) ages.
Figure 4—figure supplement 26
SuperSigs for age.
For the indicated cancer type all selected features of its age signature are listed (IUPAC notations: B=not A, D = not C, H = not G, V = not T, W = A or T, S = C or G, M = A or C, K = G or T, R = A or G, Y = C or T). The color of each bar is representing the point mutation type as follows: C to T mutations = red, C to A = green, C to G = yellow, T to C = orange, T to G = purple, T to A = blue. (a) The difference in the mean mutation count between old and young is reported for each predictive feature; (b) The beta of each predictive feature in the logistic regression is reported. Bars falling below zero represent mutation types which are underrepresented at older (when compared to younger) ages.
Figure 4—figure supplement 27
SuperSigs for age.
For the indicated cancer type all selected features of its age signature are listed (IUPAC notations: B=not A, D = not C, H = not G, V = not T, W = A or T, S = C or G, M = A or C, K = G or T, R = A or G, Y = C or T). The color of each bar is representing the point mutation type as follows: C to T mutations = red, C to A = green, C to G = yellow, T to C = orange, T to G = purple, T to A = blue. (a) The difference in the mean mutation count between old and young is reported for each predictive feature; (b) The beta of each predictive feature in the logistic regression is reported. Bars falling below zero represent mutation types which are underrepresented at older (when compared to younger) ages.
Figure 4—figure supplement 28
SuperSigs for age.
For the indicated cancer type all selected features of its age signature are listed (IUPAC notations: B=not A, D = not C, H = not G, V = not T, W = A or T, S = C or G, M = A or C, K = G or T, R = A or G, Y = C or T). The color of each bar is representing the point mutation type as follows: C to T mutations = red, C to A = green, C to G = yellow, T to C = orange, T to G = purple, T to A = blue. (a) The difference in the mean mutation count between old and young is reported for each predictive feature; (b) The beta of each predictive feature in the logistic regression is reported. Bars falling below zero represent mutation types which are underrepresented at older (when compared to younger) ages.
Figure 4—figure supplement 29
SuperSigs for age.
For the indicated cancer type all selected features of its age signature are listed (IUPAC notations: B=not A, D = not C, H = not G, V = not T, W = A or T, S = C or G, M = A or C, K = G or T, R = A or G, Y = C or T). The color of each bar is representing the point mutation type as follows: C to T mutations = red, C to A = green, C to G = yellow, T to C = orange, T to G = purple, T to A = blue. (a) The difference in the mean mutation count between old and young is reported for each predictive feature; (b) The beta of each predictive feature in the logistic regression is reported. Bars falling below zero represent mutation types which are underrepresented at older (when compared to younger) ages.
Figure 4—figure supplement 30
SuperSigs for age.
For the indicated cancer type all selected features of its age signature are listed (IUPAC notations: B=not A, D = not C, H = not G, V = not T, W = A or T, S = C or G, M = A or C, K = G or T, R = A or G, Y = C or T). The color of each bar is representing the point mutation type as follows: C to T mutations = red, C to A = green, C to G = yellow, T to C = orange, T to G = purple, T to A = blue. (a) The difference in the mean mutation count between old and young is reported for each predictive feature; (b) The beta of each predictive feature in the logistic regression is reported. Bars falling below zero represent mutation types which are underrepresented at older (when compared to younger) ages.
Figure 4—figure supplement 31
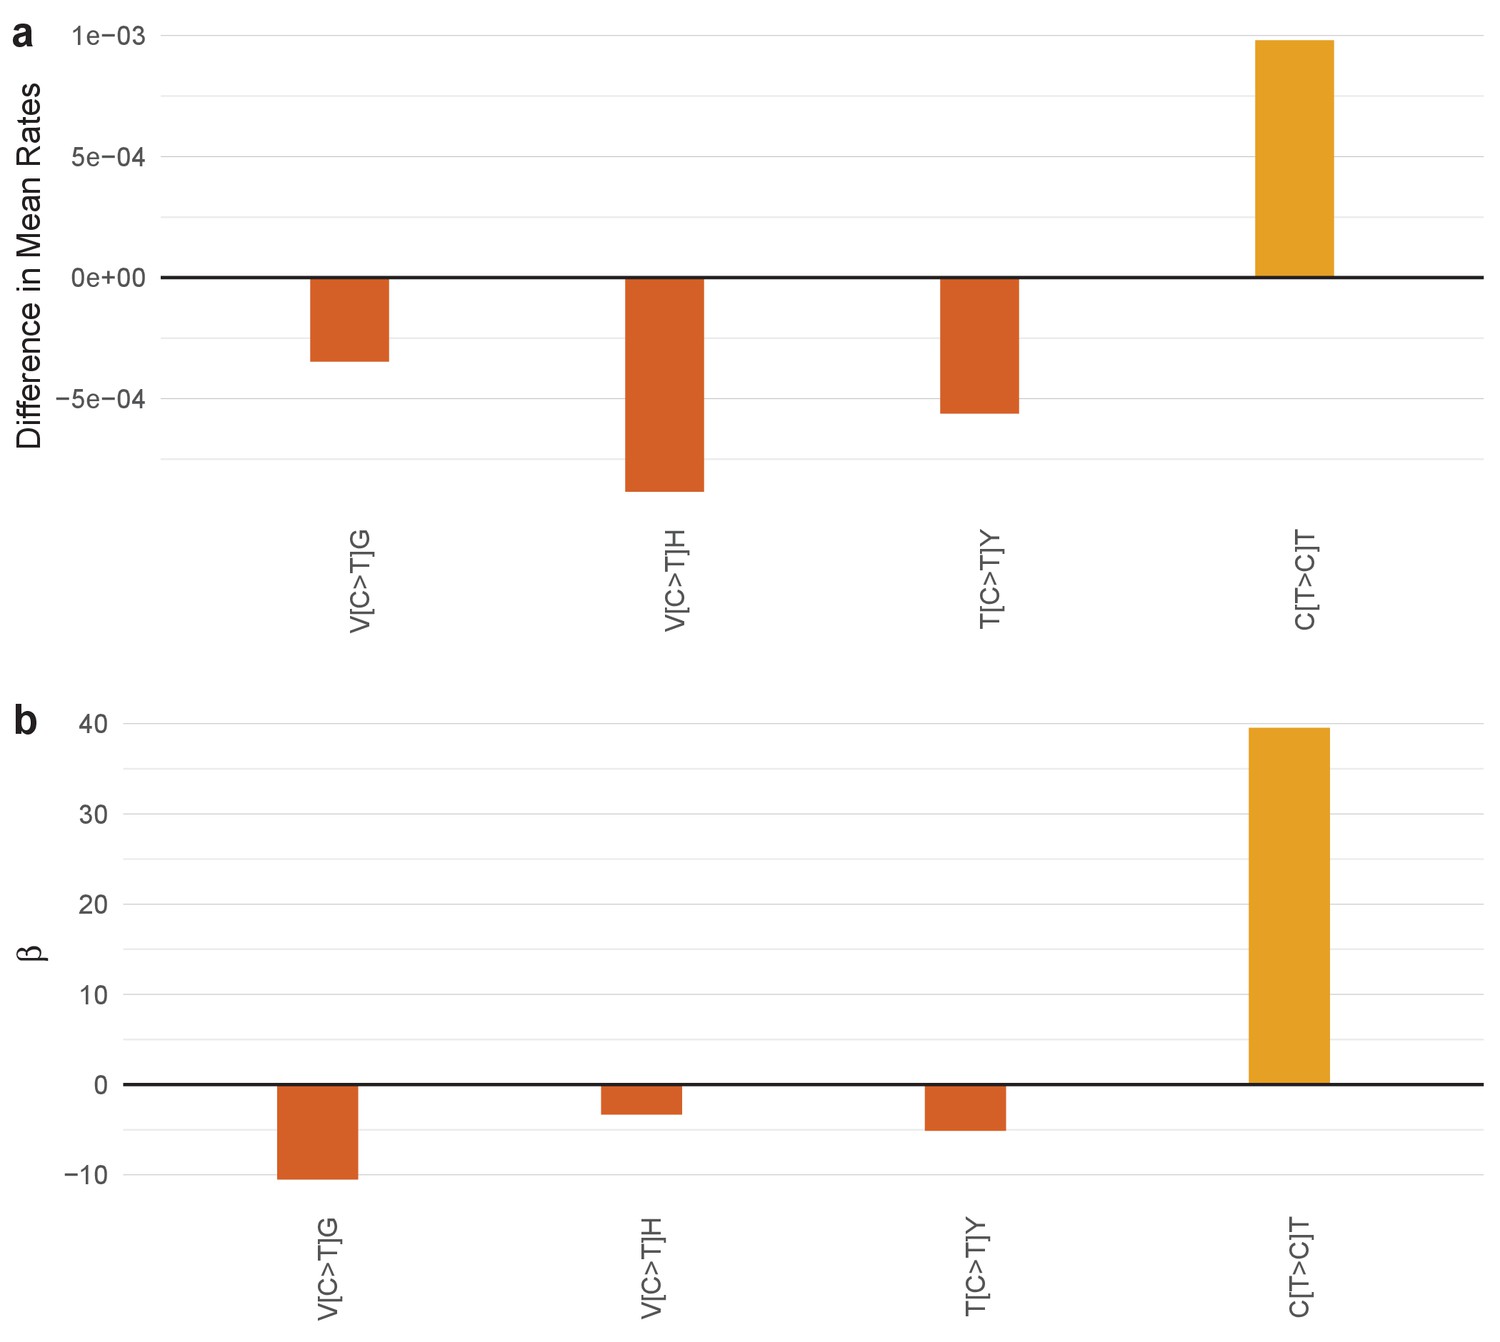
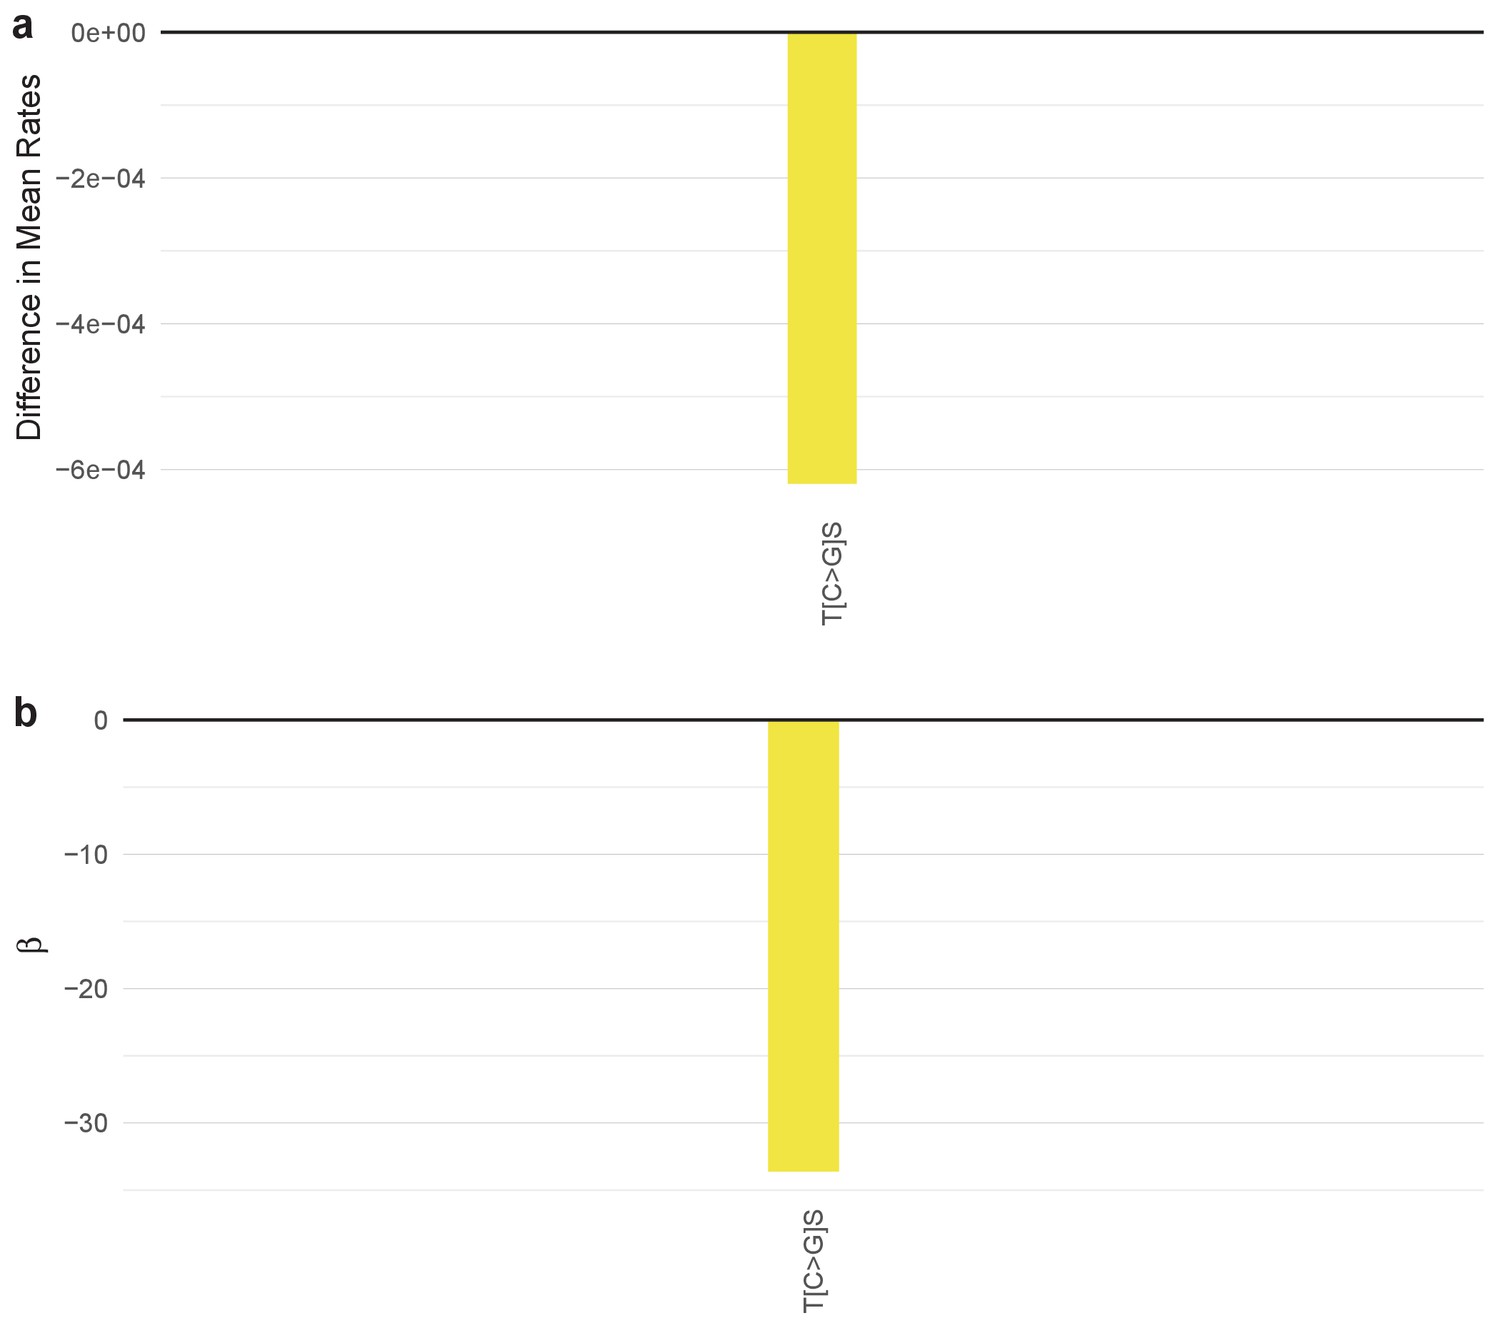
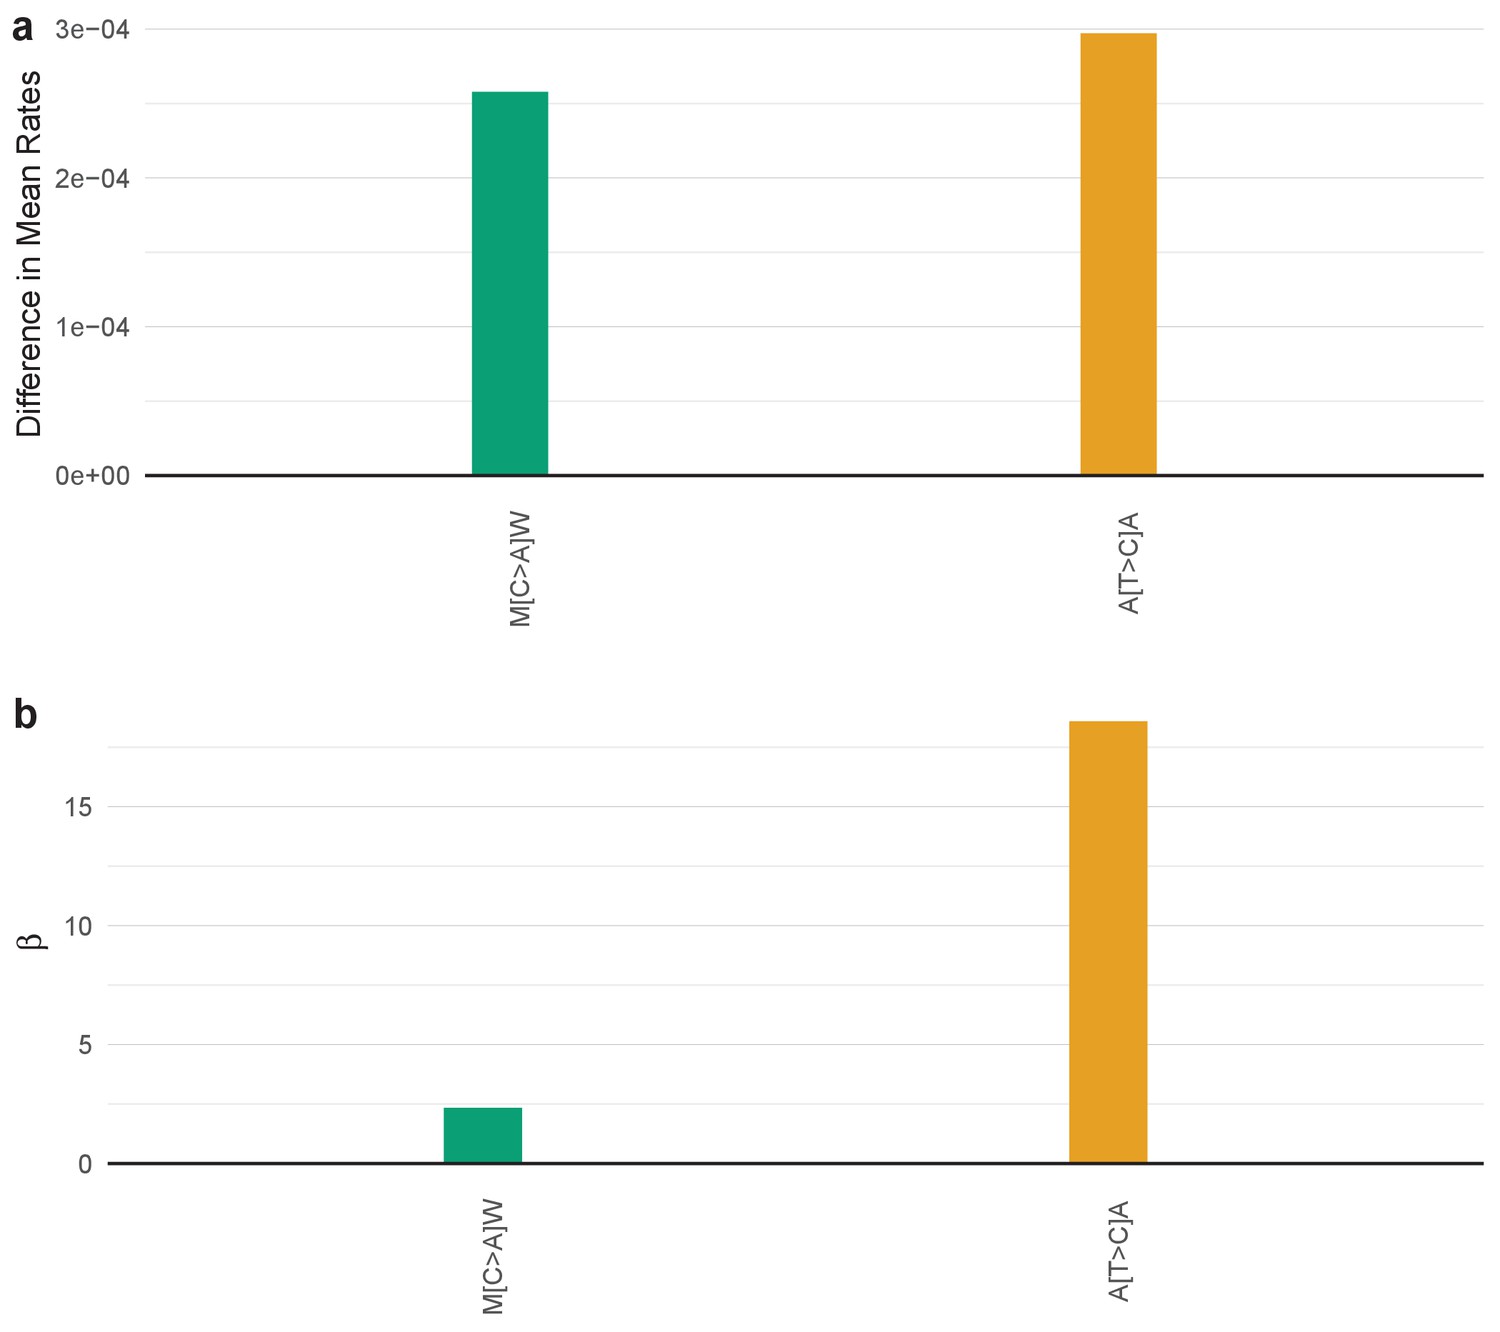
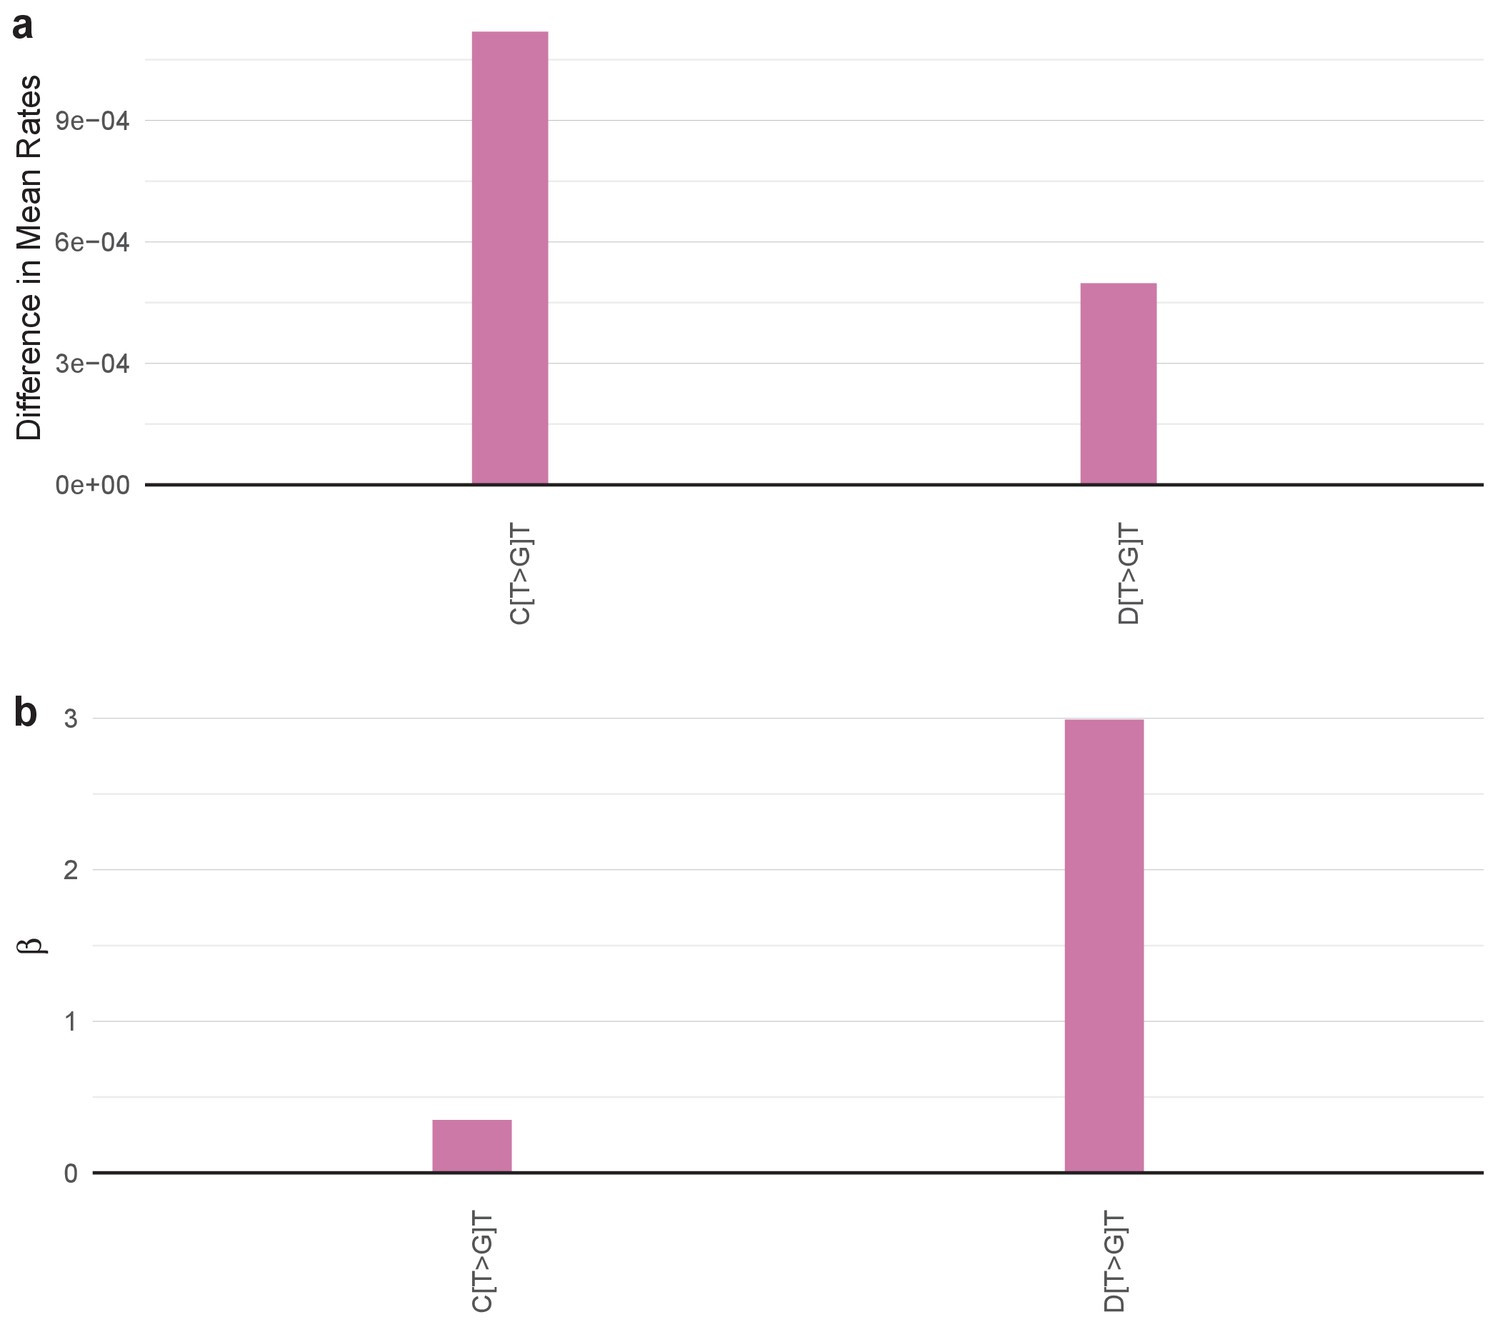
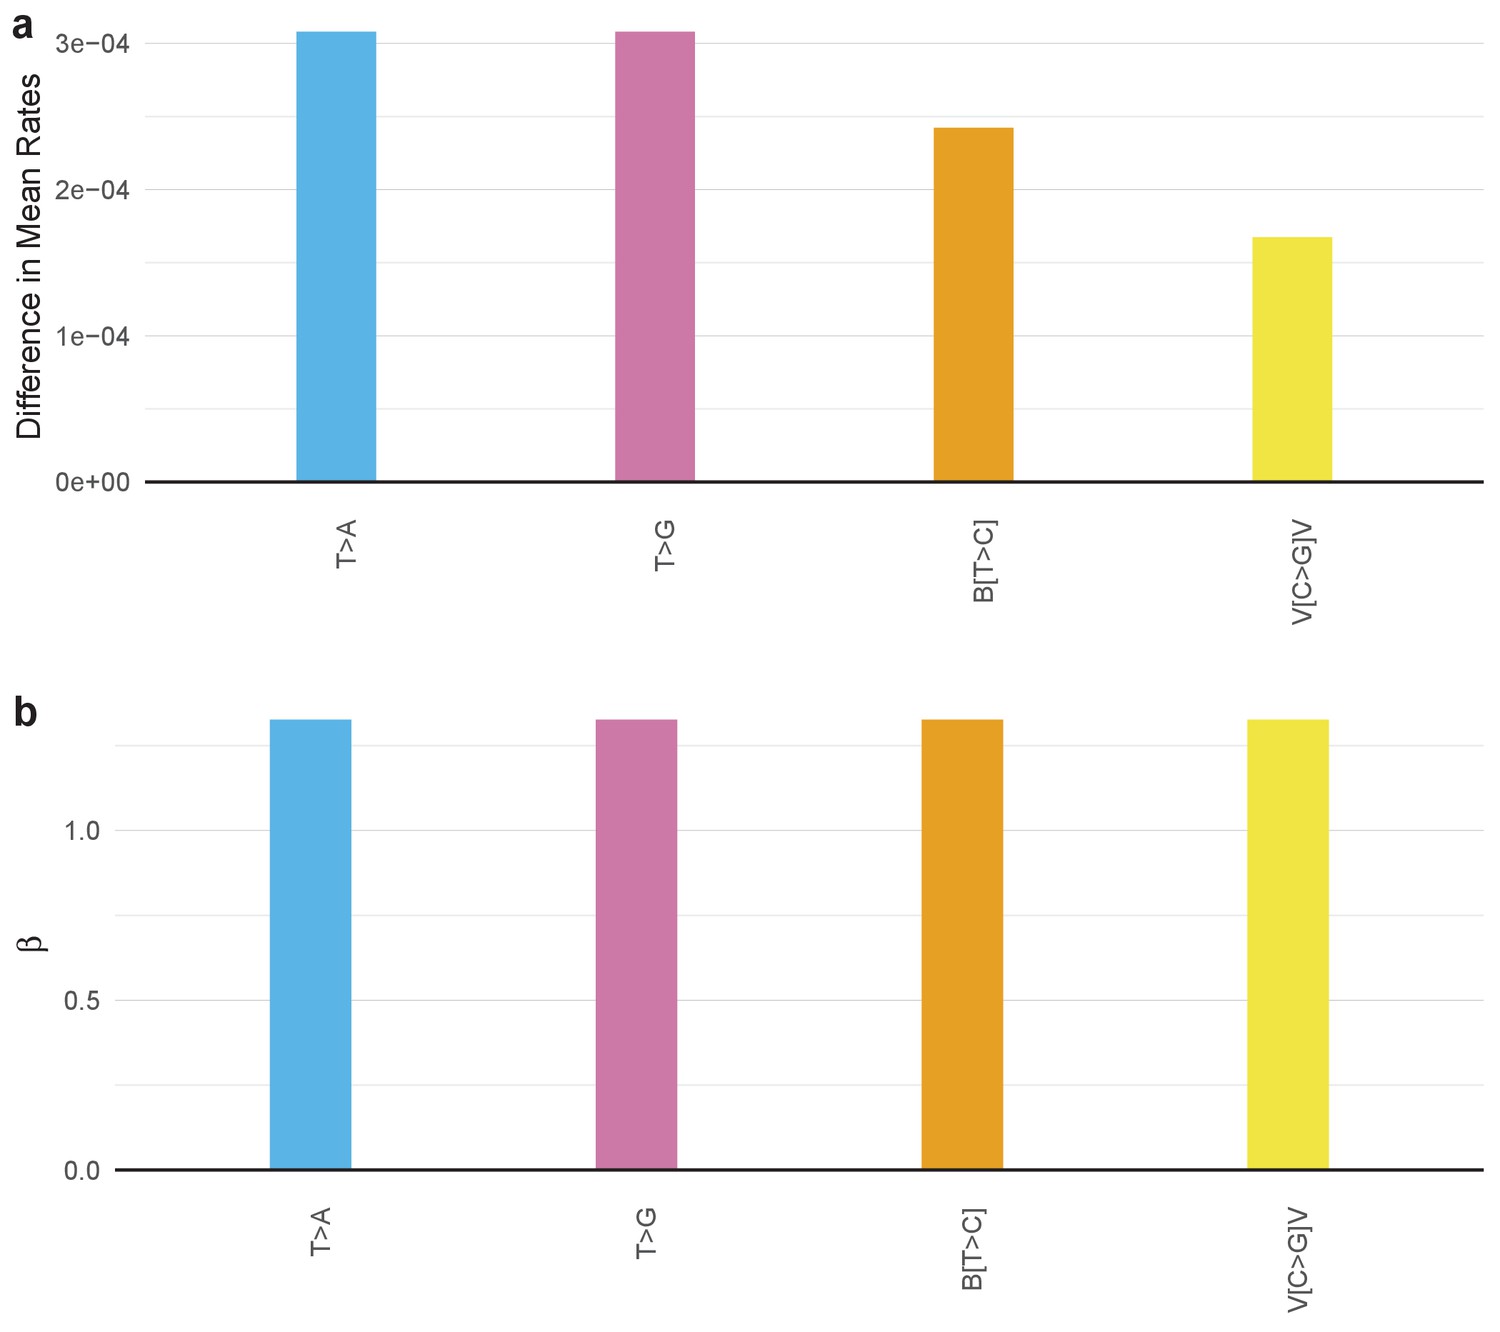
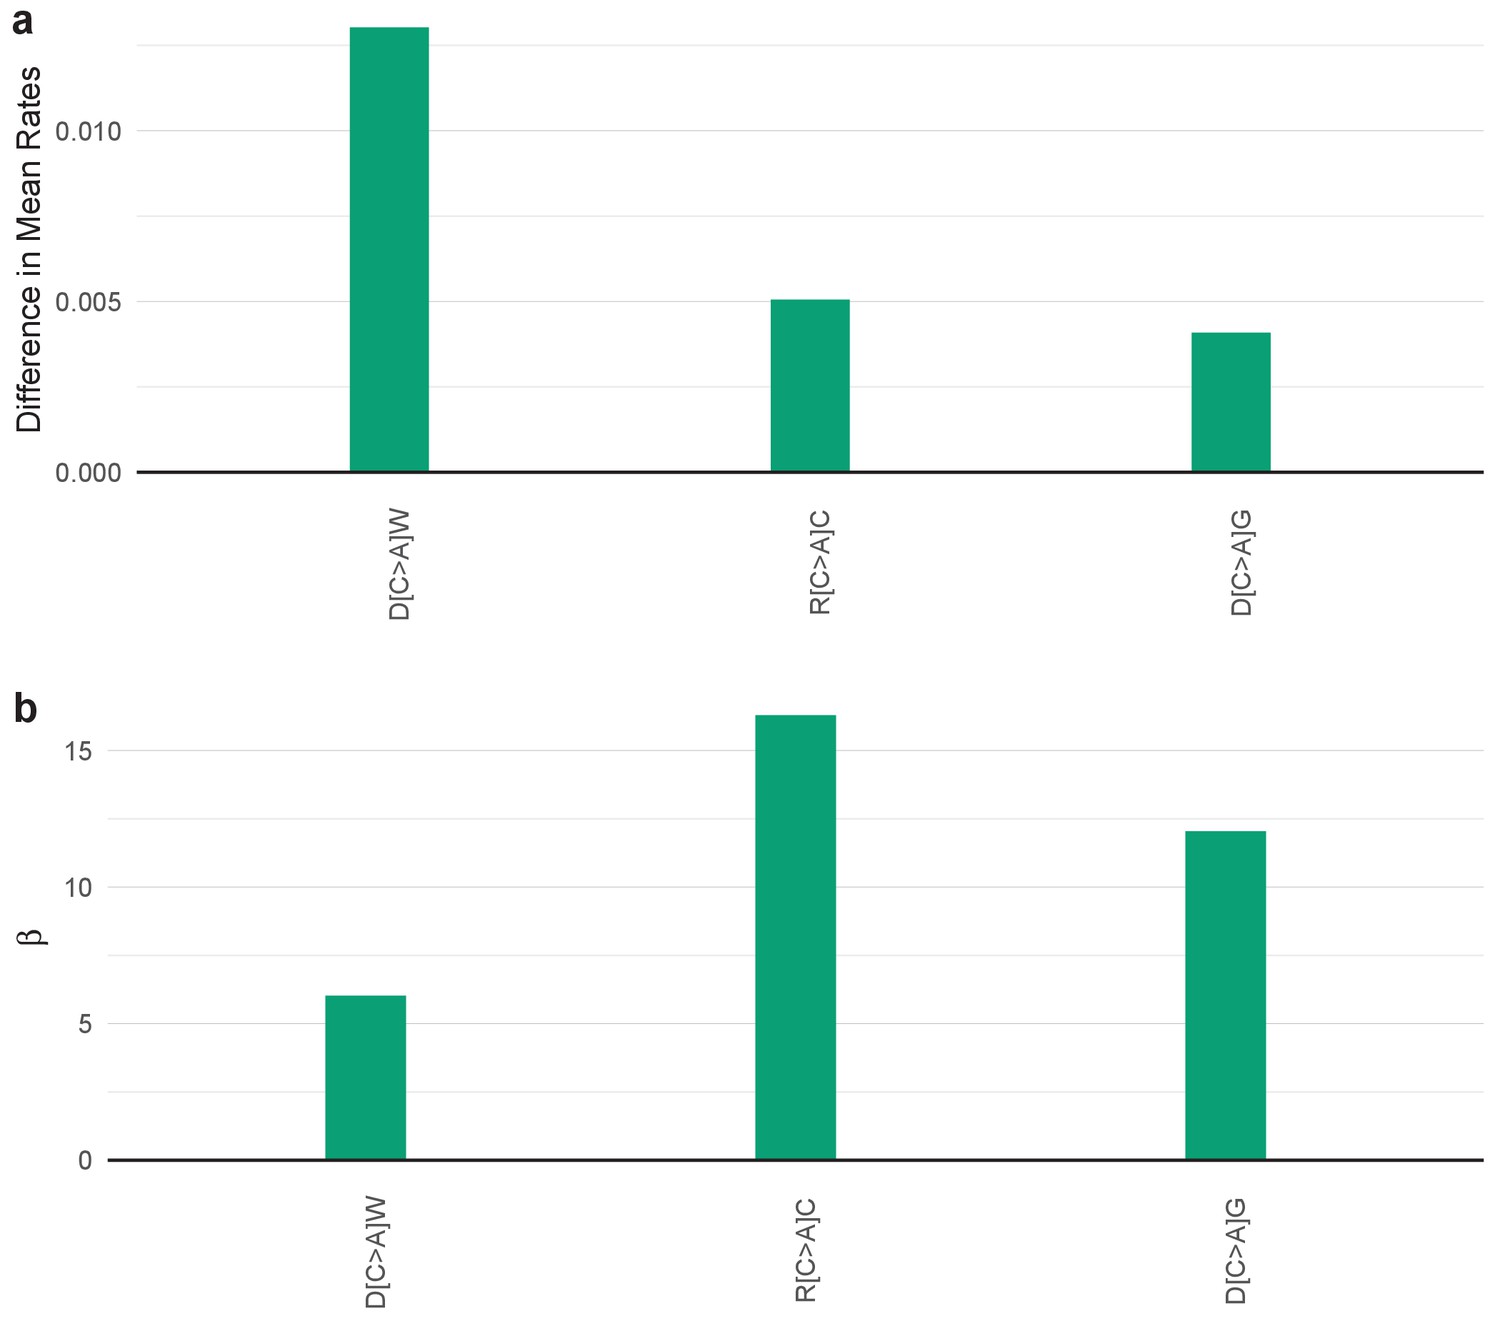
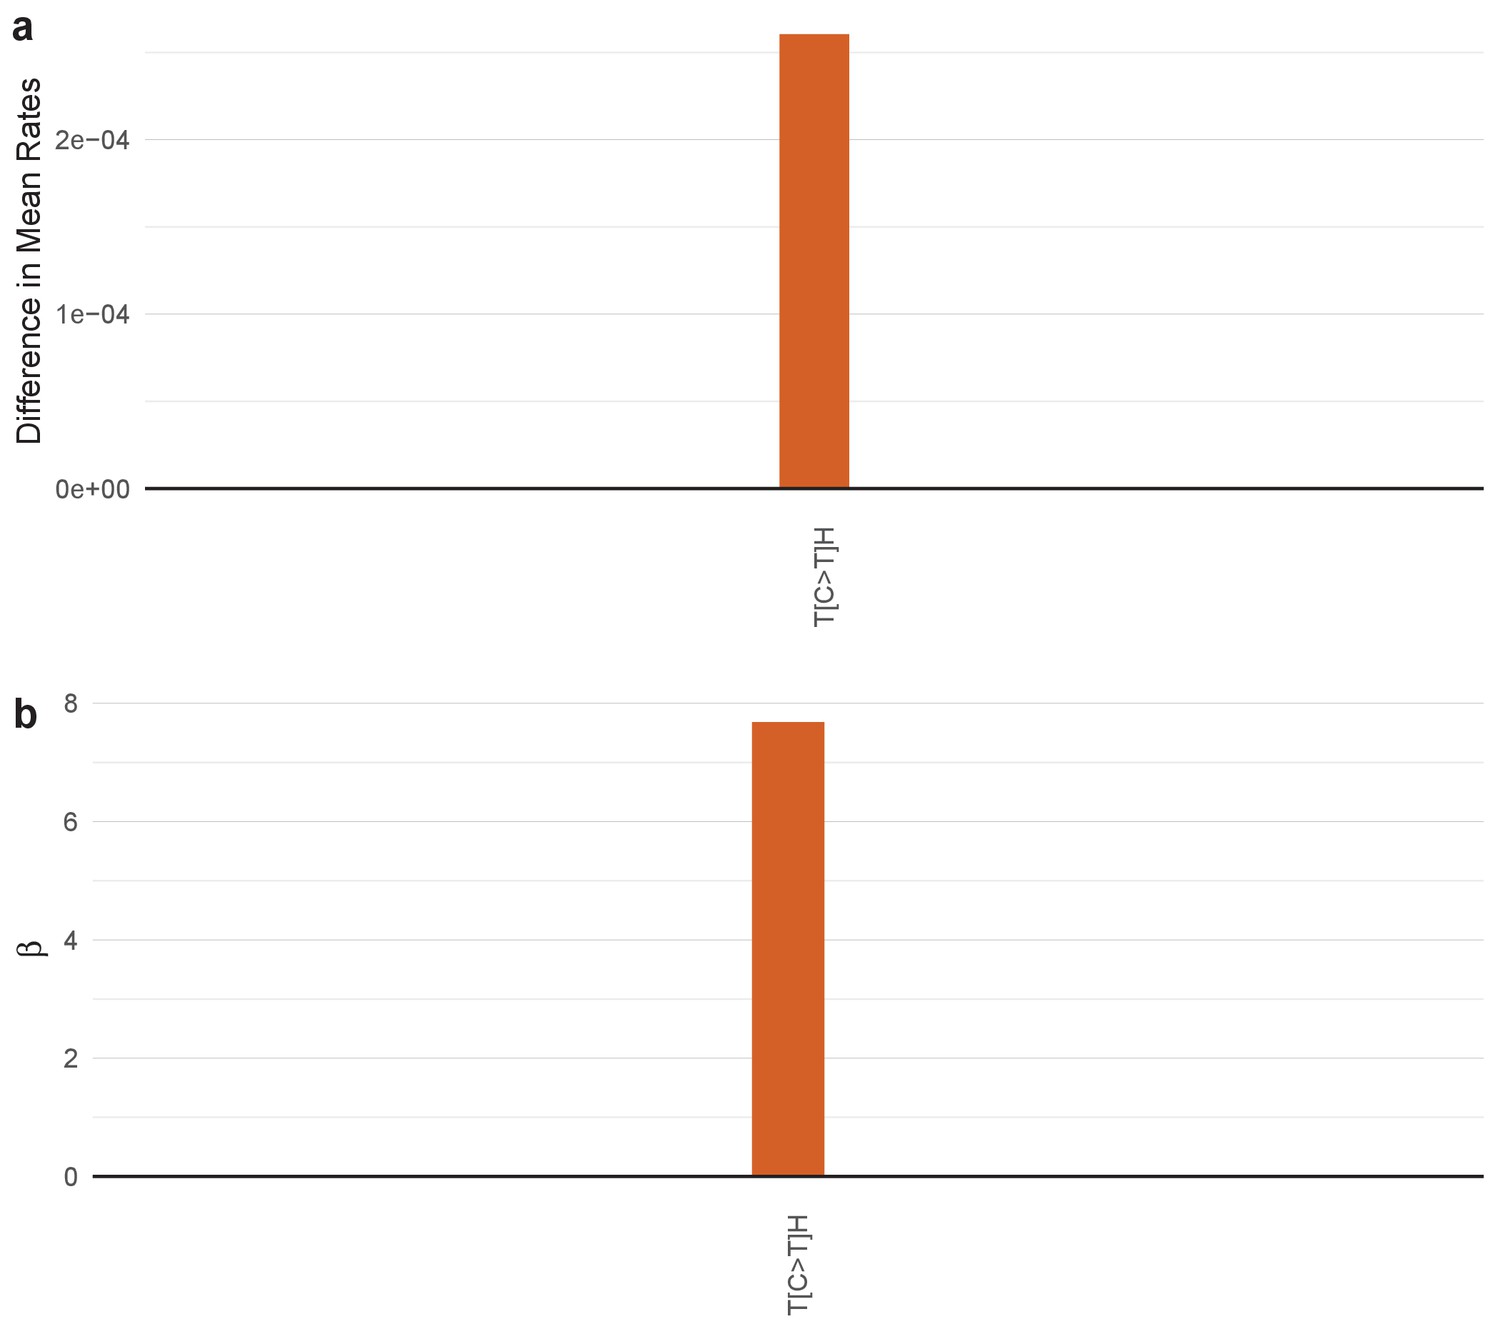
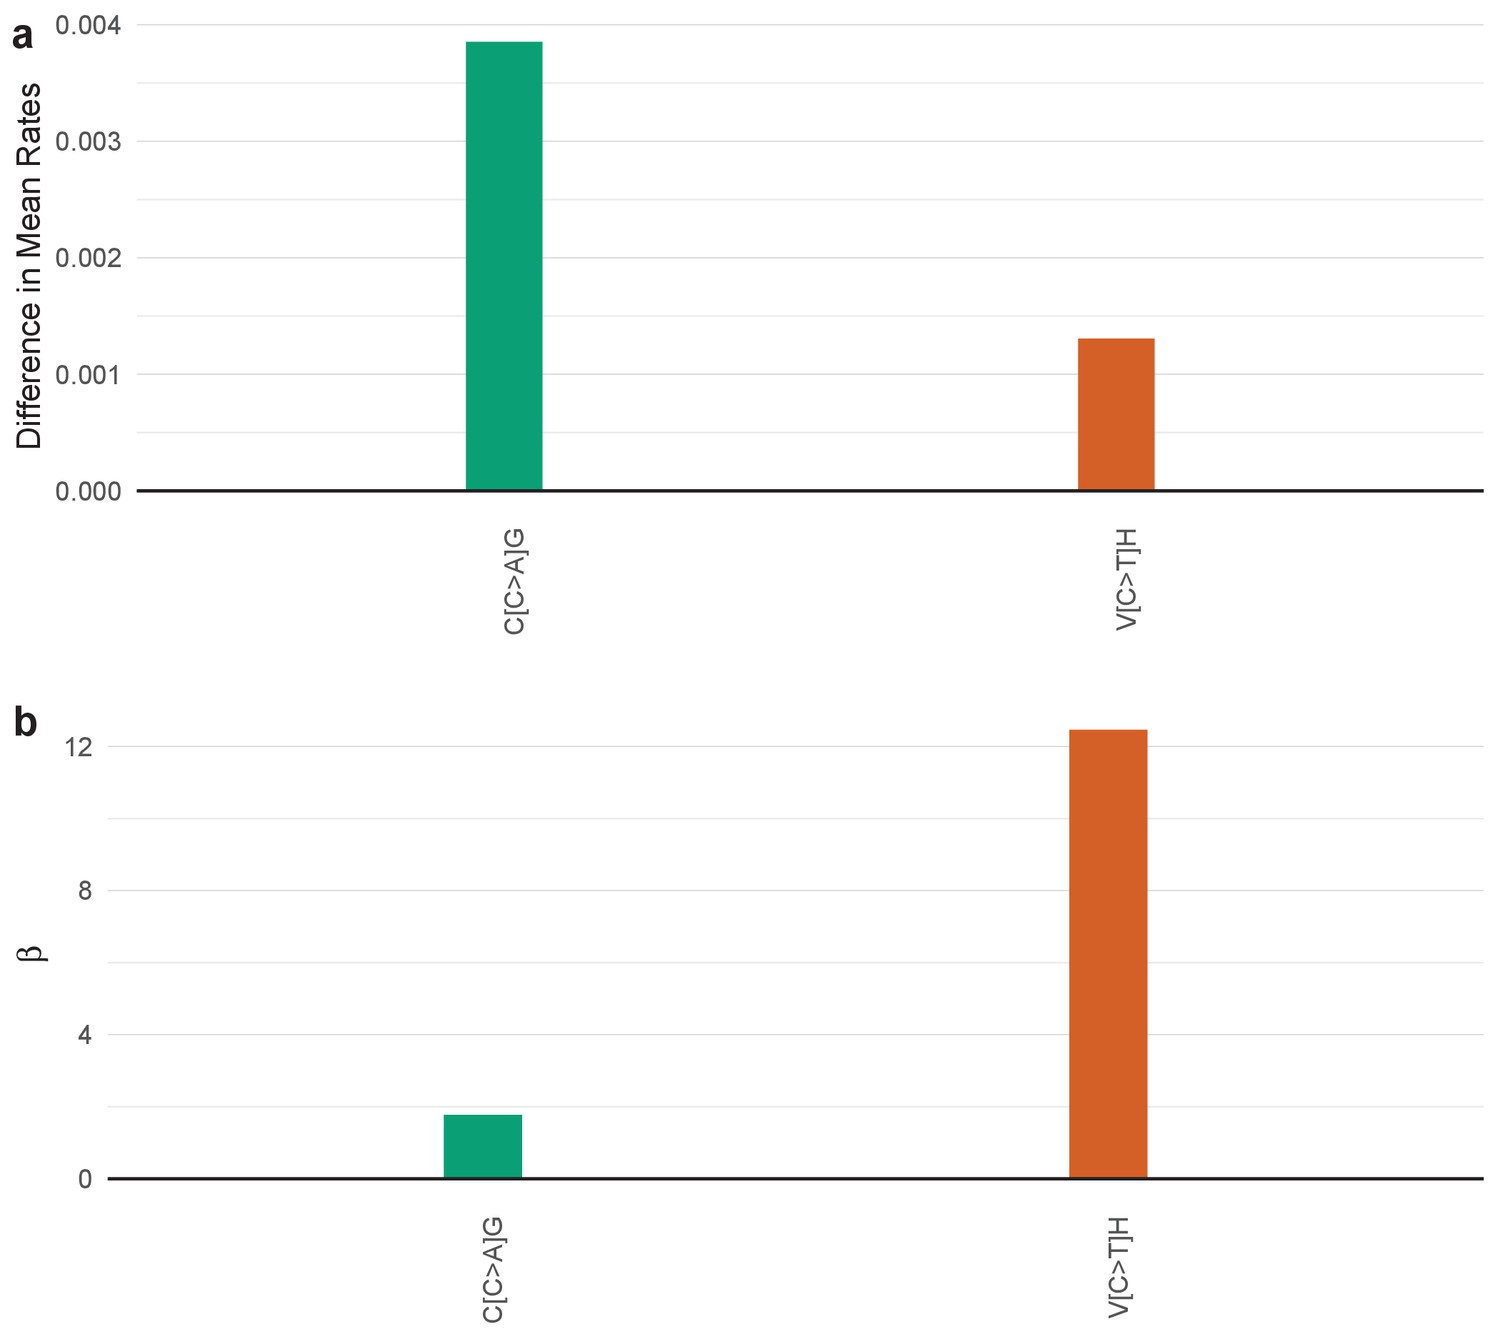
SuperSigs for environmental and inherited factors.
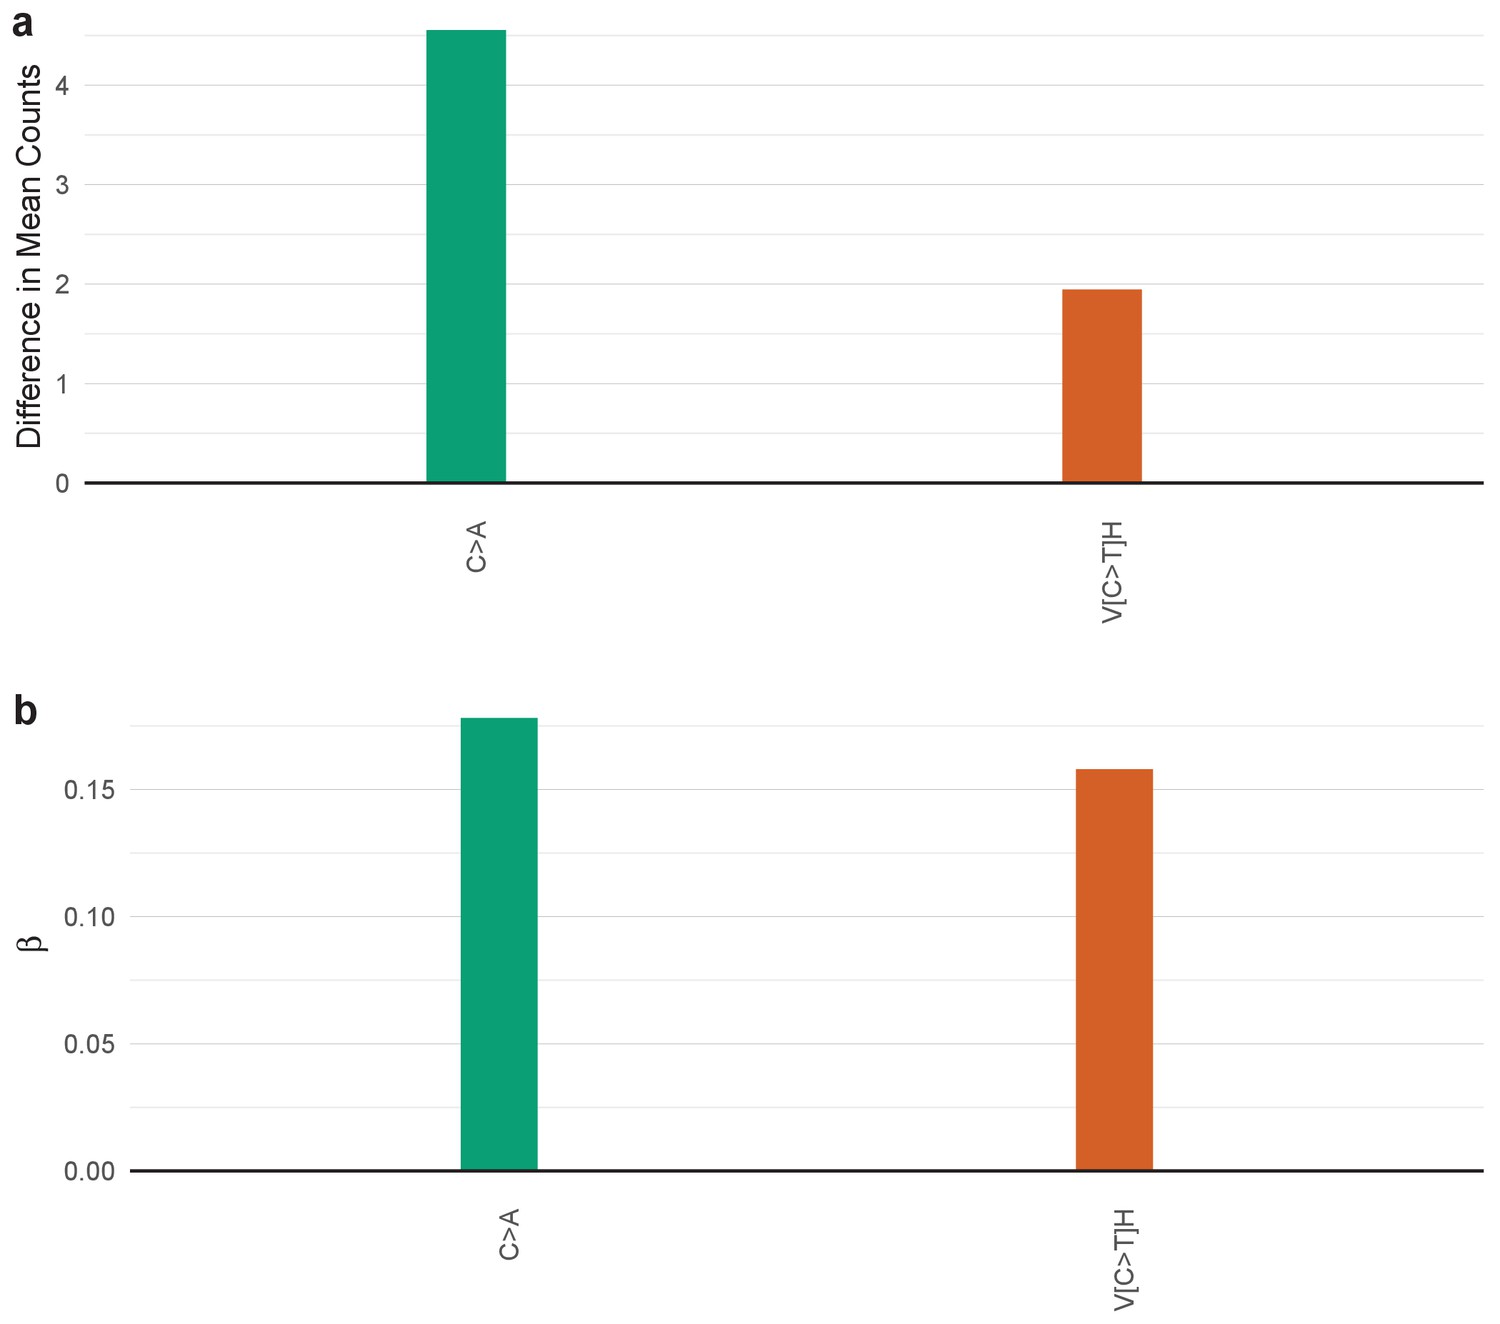
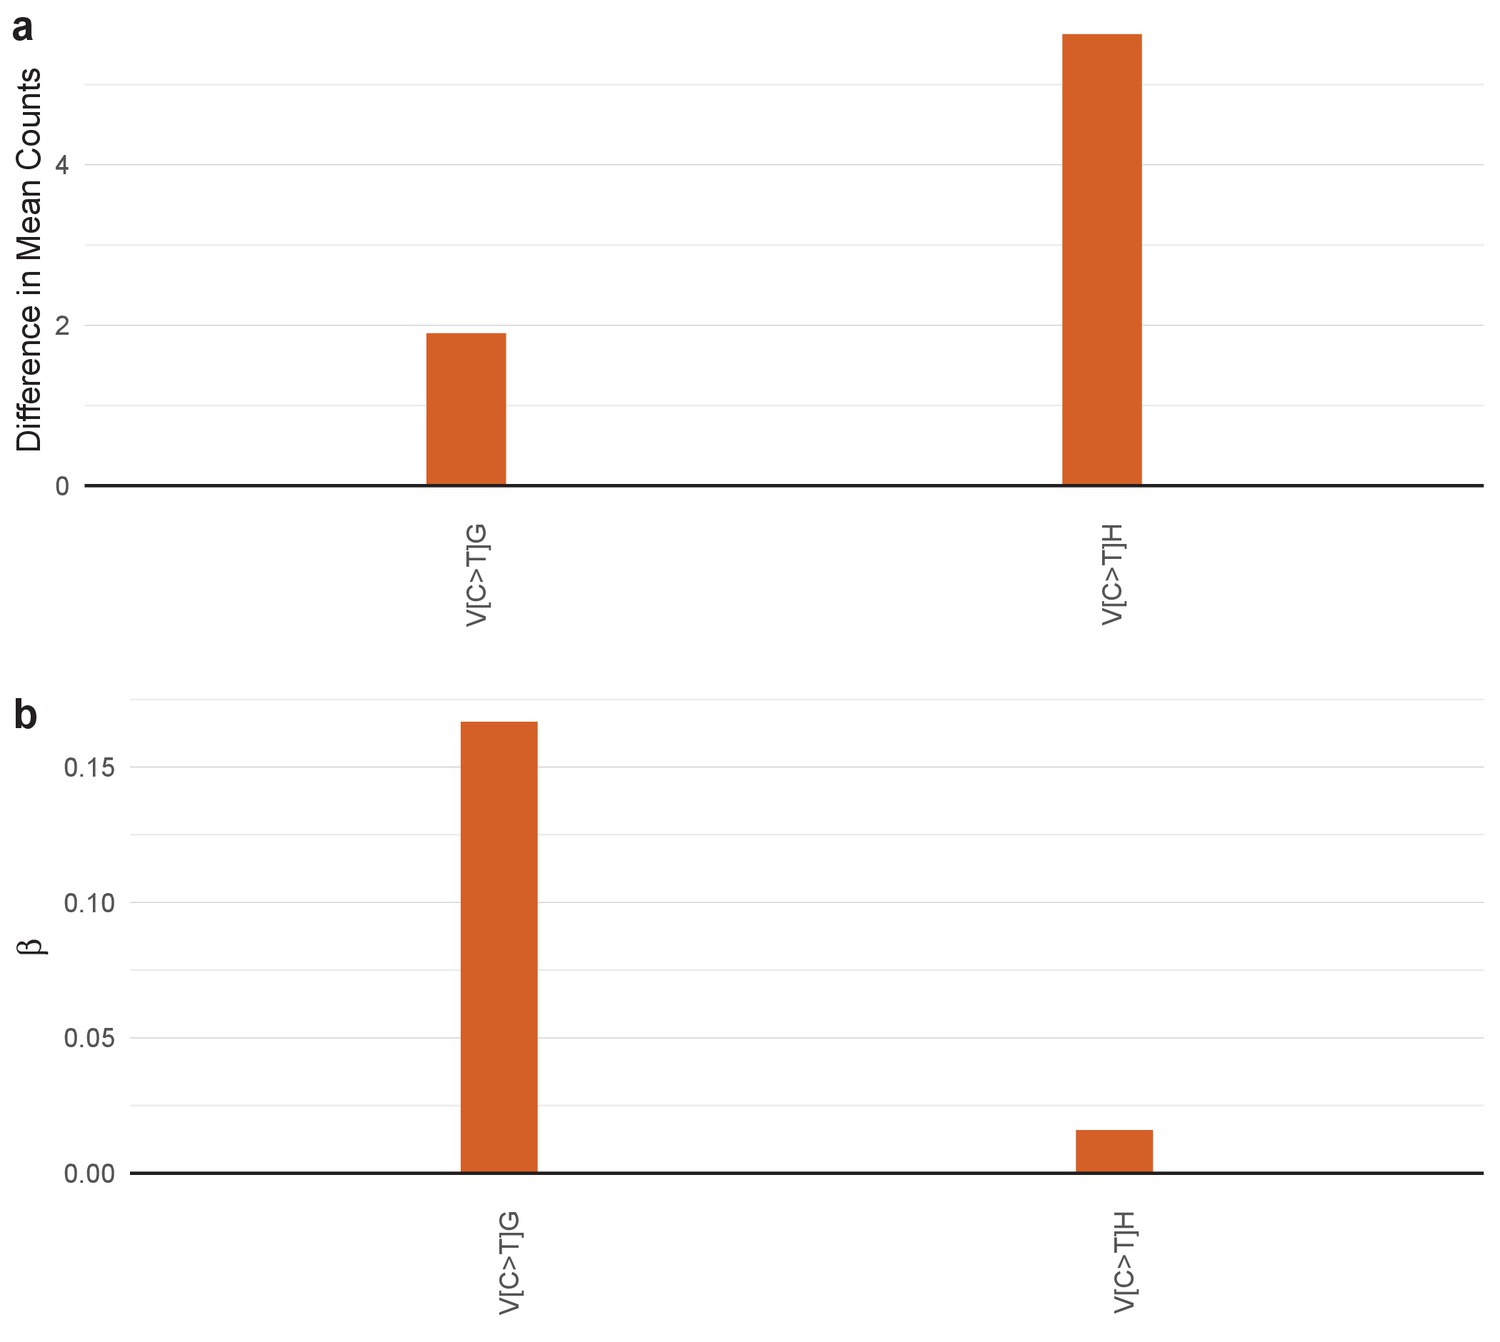
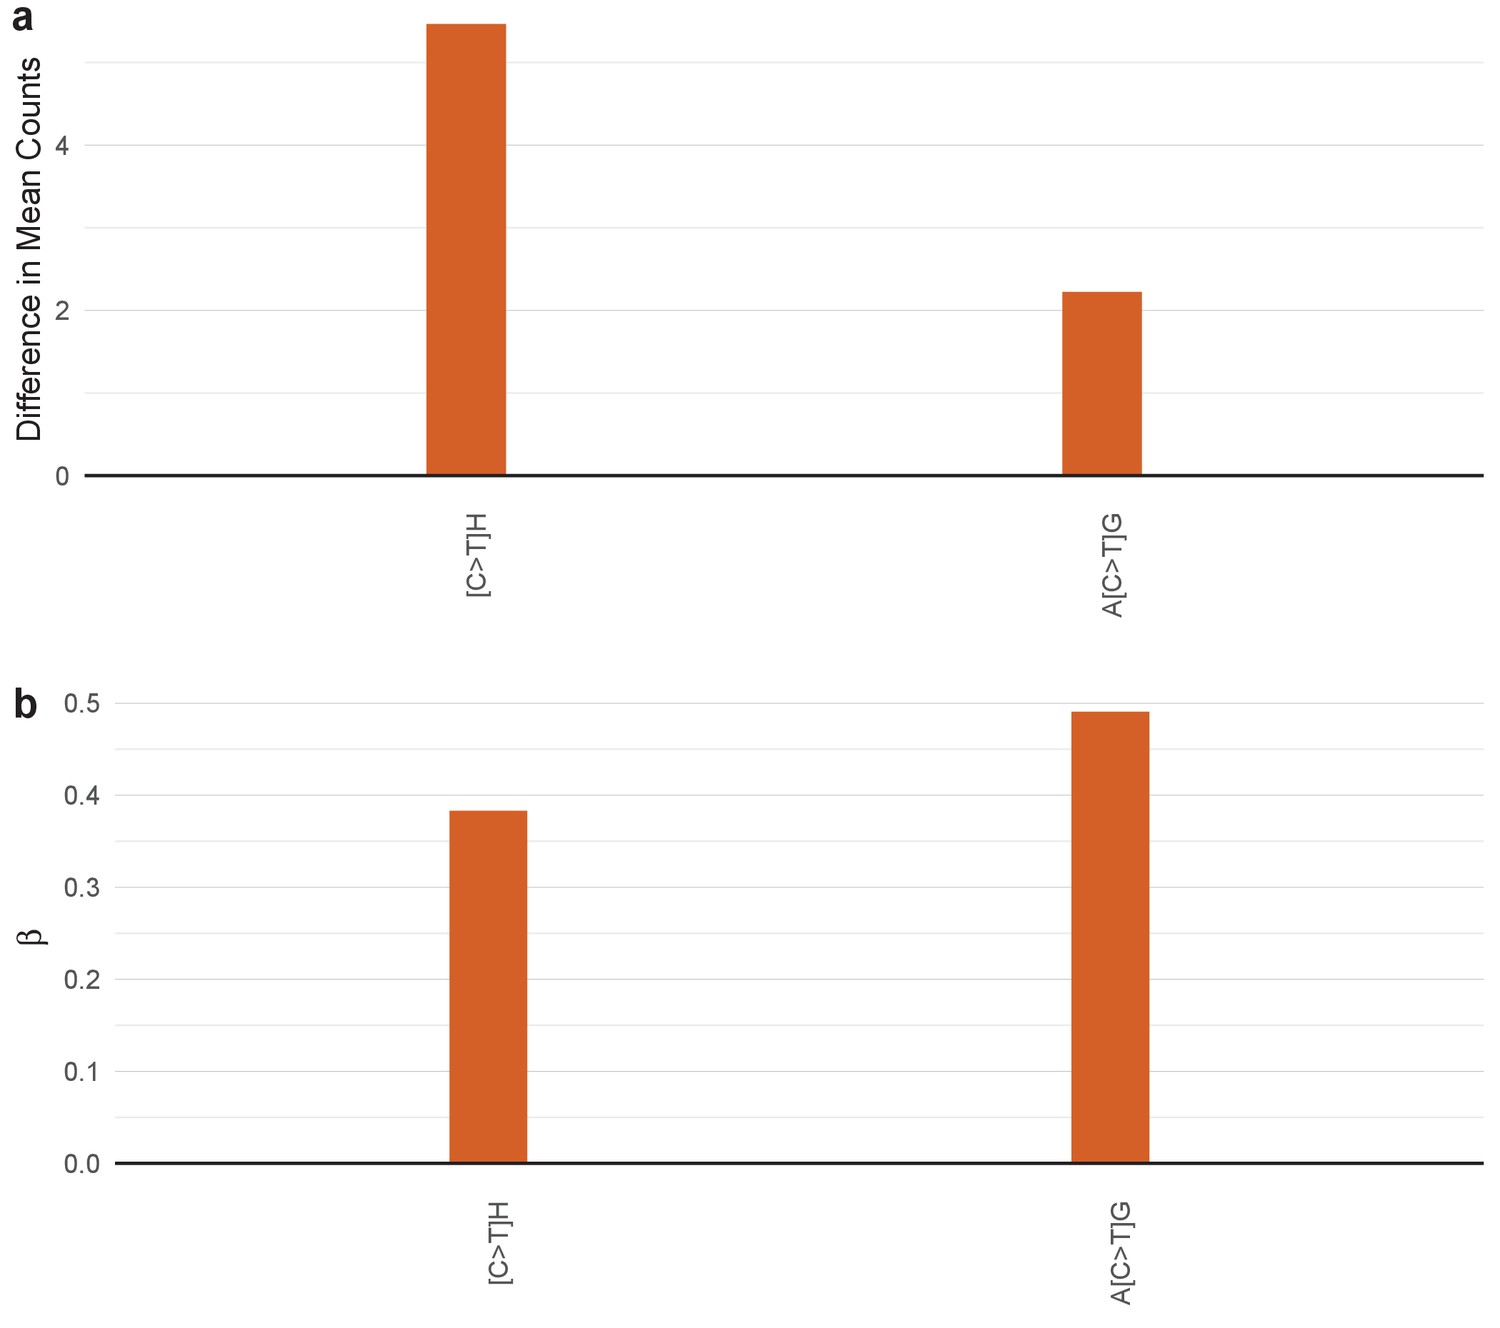
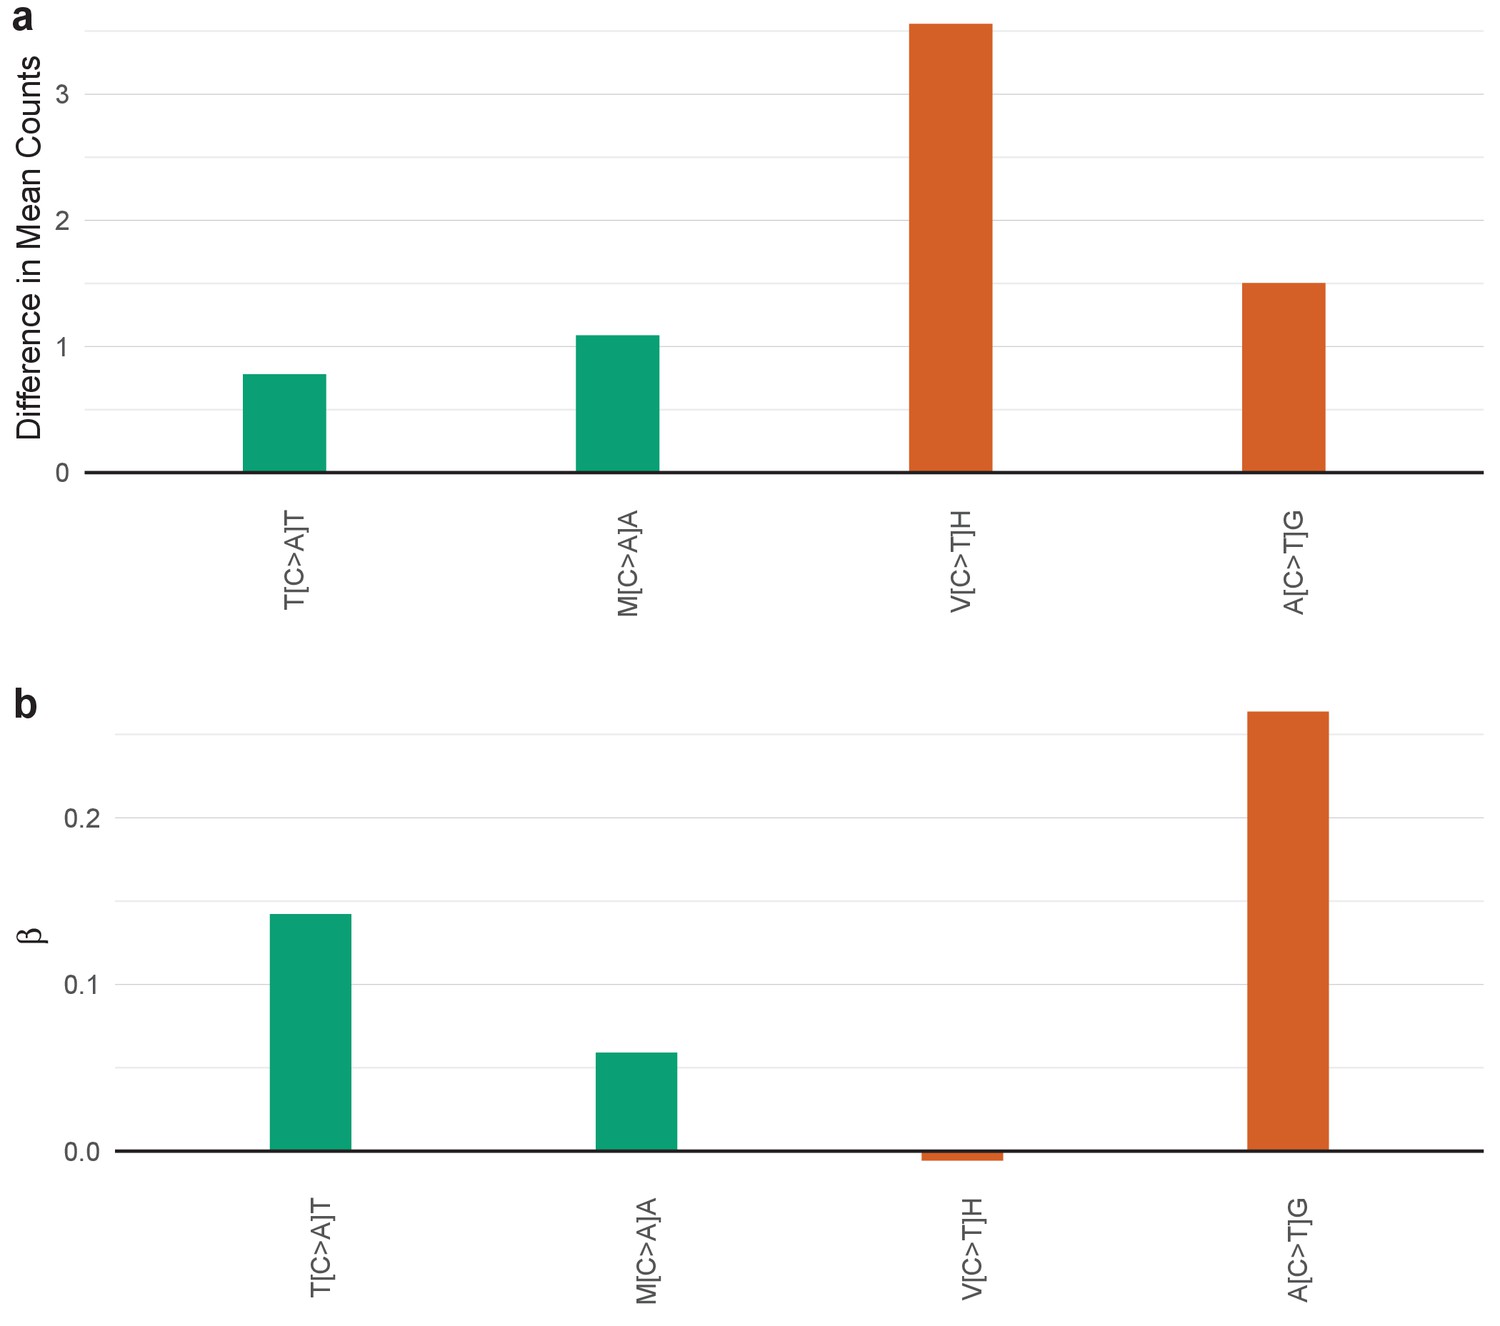
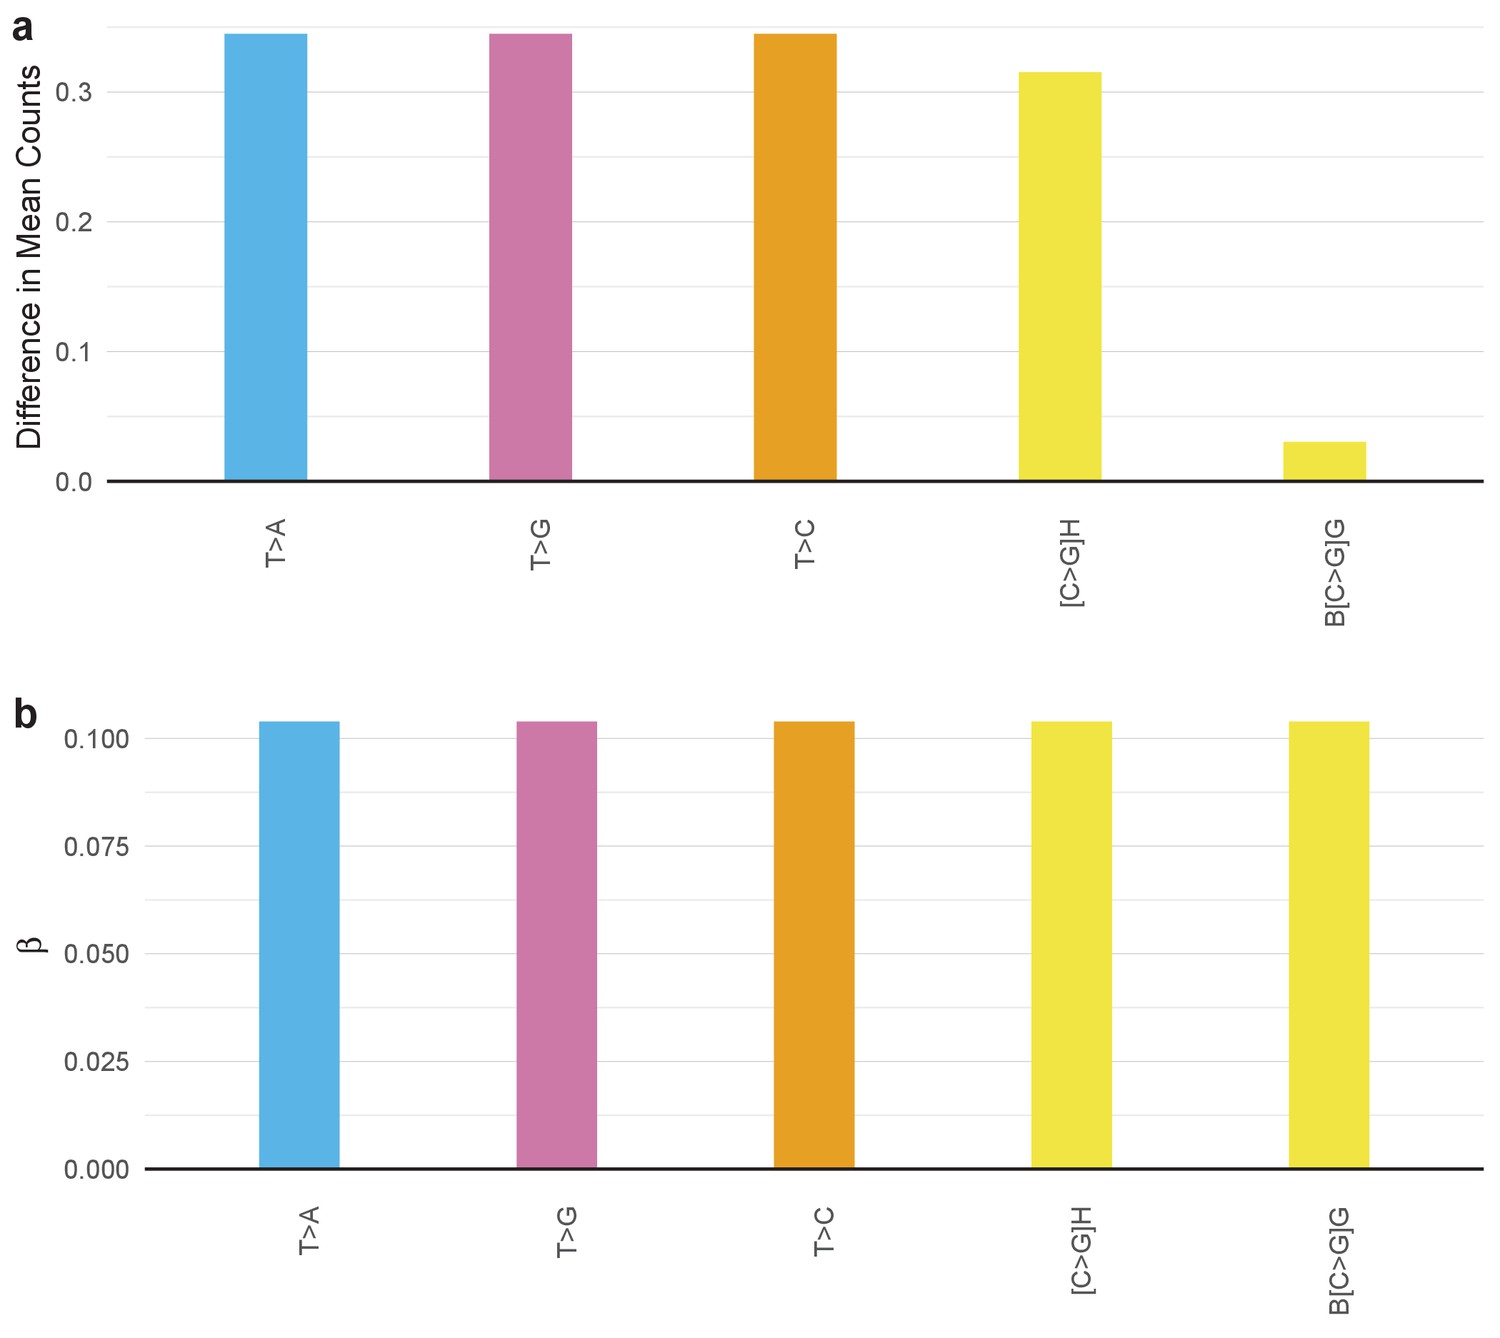
For the indicated risk factor and cancer type all selected features of its signature are listed (IUPAC notations: B=not A, D = not C, H = not G, V = not T, W = A or T, S = C or G, M = A or C, K = G or T, R = A or G, Y = C or T). The color of each bar is representing the point mutation type as follows: C to T mutations = red, C to A = green, C to G = yellow, T to C = orange, T to G = purple, T to A = blue. (a) The difference in the mean rate (=mutation count/age) between exposed and unexposed is reported for each predictive feature; (b) The beta of each predictive feature in the logistic regression is reported. Bars falling below zero represent mutation types which are underrepresented when the given exposure is present.
Figure 4—figure supplement 32
SuperSigs for environmental and inherited factors.
For the indicated risk factor and cancer type all selected features of its signature are listed (IUPAC notations: B=not A, D = not C, H = not G, V = not T, W = A or T, S = C or G, M = A or C, K = G or T, R = A or G, Y = C or T). The color of each bar is representing the point mutation type as follows: C to T mutations = red, C to A = green, C to G = yellow, T to C = orange, T to G = purple, T to A = blue. (a) The difference in the mean rate (=mutation count/age) between exposed and unexposed is reported for each predictive feature; (b) The beta of each predictive feature in the logistic regression is reported. Bars falling below zero represent mutation types which are underrepresented when the given exposure is present.
Figure 4—figure supplement 33
SuperSigs for environmental and inherited factors.
For the indicated risk factor and cancer type all selected features of its signature are listed (IUPAC notations: B=not A, D = not C, H = not G, V = not T, W = A or T, S = C or G, M = A or C, K = G or T, R = A or G, Y = C or T). The color of each bar is representing the point mutation type as follows: C to T mutations = red, C to A = green, C to G = yellow, T to C = orange, T to G = purple, T to A = blue. (a) The difference in the mean rate (=mutation count/age) between exposed and unexposed is reported for each predictive feature; (b) The beta of each predictive feature in the logistic regression is reported. Bars falling below zero represent mutation types which are underrepresented when the given exposure is present.
Figure 4—figure supplement 34
SuperSigs for environmental and inherited factors.
For the indicated risk factor and cancer type all selected features of its signature are listed (IUPAC notations: B=not A, D = not C, H = not G, V = not T, W = A or T, S = C or G, M = A or C, K = G or T, R = A or G, Y = C or T). The color of each bar is representing the point mutation type as follows: C to T mutations = red, C to A = green, C to G = yellow, T to C = orange, T to G = purple, T to A = blue. (a) The difference in the mean rate (=mutation count/age) between exposed and unexposed is reported for each predictive feature; (b) The beta of each predictive feature in the logistic regression is reported. Bars falling below zero represent mutation types which are underrepresented when the given exposure is present.
Figure 4—figure supplement 35
SuperSigs for environmental and inherited factors.
For the indicated risk factor and cancer type all selected features of its signature are listed (IUPAC notations: B=not A, D = not C, H = not G, V = not T, W = A or T, S = C or G, M = A or C, K = G or T, R = A or G, Y = C or T). The color of each bar is representing the point mutation type as follows: C to T mutations = red, C to A = green, C to G = yellow, T to C = orange, T to G = purple, T to A = blue. (a) The difference in the mean rate (=mutation count/age) between exposed and unexposed is reported for each predictive feature; (b) The beta of each predictive feature in the logistic regression is reported. Bars falling below zero represent mutation types which are underrepresented when the given exposure is present.
Figure 4—figure supplement 36
SuperSigs for environmental and inherited factors.
For the indicated risk factor and cancer type all selected features of its signature are listed (IUPAC notations: B=not A, D = not C, H = not G, V = not T, W = A or T, S = C or G, M = A or C, K = G or T, R = A or G, Y = C or T). The color of each bar is representing the point mutation type as follows: C to T mutations = red, C to A = green, C to G = yellow, T to C = orange, T to G = purple, T to A = blue. (a) The difference in the mean rate (=mutation count/age) between exposed and unexposed is reported for each predictive feature; (b) The beta of each predictive feature in the logistic regression is reported. Bars falling below zero represent mutation types which are underrepresented when the given exposure is present.
Figure 4—figure supplement 37
SuperSigs for environmental and inherited factors.
For the indicated risk factor and cancer type all selected features of its signature are listed (IUPAC notations: B=not A, D = not C, H = not G, V = not T, W = A or T, S = C or G, M = A or C, K = G or T, R = A or G, Y = C or T). The color of each bar is representing the point mutation type as follows: C to T mutations = red, C to A = green, C to G = yellow, T to C = orange, T to G = purple, T to A = blue. (a) The difference in the mean rate (=mutation count/age) between exposed and unexposed is reported for each predictive feature; (b) The beta of each predictive feature in the logistic regression is reported. Bars falling below zero represent mutation types which are underrepresented when the given exposure is present.
Figure 4—figure supplement 38
SuperSigs for environmental and inherited factors.
For the indicated risk factor and cancer type all selected features of its signature are listed (IUPAC notations: B=not A, D = not C, H = not G, V = not T, W = A or T, S = C or G, M = A or C, K = G or T, R = A or G, Y = C or T). The color of each bar is representing the point mutation type as follows: C to T mutations = red, C to A = green, C to G = yellow, T to C = orange, T to G = purple, T to A = blue. (a) The difference in the mean rate (=mutation count/age) between exposed and unexposed is reported for each predictive feature; (b) The beta of each predictive feature in the logistic regression is reported. Bars falling below zero represent mutation types which are underrepresented when the given exposure is present.
Figure 4—figure supplement 39
SuperSigs for environmental and inherited factors.
For the indicated risk factor and cancer type all selected features of its signature are listed (IUPAC notations: B=not A, D = not C, H = not G, V = not T, W = A or T, S = C or G, M = A or C, K = G or T, R = A or G, Y = C or T). The color of each bar is representing the point mutation type as follows: C to T mutations = red, C to A = green, C to G = yellow, T to C = orange, T to G = purple, T to A = blue. (a) The difference in the mean rate (=mutation count/age) between exposed and unexposed is reported for each predictive feature; (b) The beta of each predictive feature in the logistic regression is reported. Bars falling below zero represent mutation types which are underrepresented when the given exposure is present.
Figure 4—figure supplement 40
SuperSigs for environmental and inherited factors.
For the indicated risk factor and cancer type all selected features of its signature are listed (IUPAC notations: B=not A, D = not C, H = not G, V = not T, W = A or T, S = C or G, M = A or C, K = G or T, R = A or G, Y = C or T). The color of each bar is representing the point mutation type as follows: C to T mutations = red, C to A = green, C to G = yellow, T to C = orange, T to G = purple, T to A = blue. (a) The difference in the mean rate (=mutation count/age) between exposed and unexposed is reported for each predictive feature; (b) The beta of each predictive feature in the logistic regression is reported. Bars falling below zero represent mutation types which are underrepresented when the given exposure is present.
Figure 4—figure supplement 41
SuperSigs for environmental and inherited factors.
For the indicated risk factor and cancer type all selected features of its signature are listed (IUPAC notations: B=not A, D = not C, H = not G, V = not T, W = A or T, S = C or G, M = A or C, K = G or T, R = A or G, Y = C or T). The color of each bar is representing the point mutation type as follows: C to T mutations = red, C to A = green, C to G = yellow, T to C = orange, T to G = purple, T to A = blue. (a) The difference in the mean rate (=mutation count/age) between exposed and unexposed is reported for each predictive feature; (b) The beta of each predictive feature in the logistic regression is reported. Bars falling below zero represent mutation types which are underrepresented when the given exposure is present.
Figure 4—figure supplement 42
SuperSigs for environmental and inherited factors.
For the indicated risk factor and cancer type all selected features of its signature are listed (IUPAC notations: B=not A, D = not C, H = not G, V = not T, W = A or T, S = C or G, M = A or C, K = G or T, R = A or G, Y = C or T). The color of each bar is representing the point mutation type as follows: C to T mutations = red, C to A = green, C to G = yellow, T to C = orange, T to G = purple, T to A = blue. (a) The difference in the mean rate (=mutation count/age) between exposed and unexposed is reported for each predictive feature; (b) The beta of each predictive feature in the logistic regression is reported. Bars falling below zero represent mutation types which are underrepresented when the given exposure is present.
Figure 4—figure supplement 43
SuperSigs for environmental and inherited factors.
For the indicated risk factor and cancer type all selected features of its signature are listed (IUPAC notations: B=not A, D = not C, H = not G, V = not T, W = A or T, S = C or G, M = A or C, K = G or T, R = A or G, Y = C or T). The color of each bar is representing the point mutation type as follows: C to T mutations = red, C to A = green, C to G = yellow, T to C = orange, T to G = purple, T to A = blue. (a) The difference in the mean rate (=mutation count/age) between exposed and unexposed is reported for each predictive feature; (b) The beta of each predictive feature in the logistic regression is reported. Bars falling below zero represent mutation types which are underrepresented when the given exposure is present.
Figure 4—figure supplement 44
SuperSigs for environmental and inherited factors.
For the indicated risk factor and cancer type all selected features of its signature are listed (IUPAC notations: B=not A, D = not C, H = not G, V = not T, W = A or T, S = C or G, M = A or C, K = G or T, R = A or G, Y = C or T). The color of each bar is representing the point mutation type as follows: C to T mutations = red, C to A = green, C to G = yellow, T to C = orange, T to G = purple, T to A = blue. (a) The difference in the mean rate (=mutation count/age) between exposed and unexposed is reported for each predictive feature; (b) The beta of each predictive feature in the logistic regression is reported. Bars falling below zero represent mutation types which are underrepresented when the given exposure is present.
Figure 4—figure supplement 45
SuperSigs for environmental and inherited factors.
For the indicated risk factor and cancer type all selected features of its signature are listed (IUPAC notations: B=not A, D = not C, H = not G, V = not T, W = A or T, S = C or G, M = A or C, K = G or T, R = A or G, Y = C or T). The color of each bar is representing the point mutation type as follows: C to T mutations = red, C to A = green, C to G = yellow, T to C = orange, T to G = purple, T to A = blue. (a) The difference in the mean rate (=mutation count/age) between exposed and unexposed is reported for each predictive feature; (b) The beta of each predictive feature in the logistic regression is reported. Bars falling below zero represent mutation types which are underrepresented when the given exposure is present.
Figure 4—figure supplement 46
SuperSigs for environmental and inherited factors.
For the indicated risk factor and cancer type all selected features of its signature are listed (IUPAC notations: B=not A, D = not C, H = not G, V = not T, W = A or T, S = C or G, M = A or C, K = G or T, R = A or G, Y = C or T). The color of each bar is representing the point mutation type as follows: C to T mutations = red, C to A = green, C to G = yellow, T to C = orange, T to G = purple, T to A = blue. (a) The difference in the mean rate (=mutation count/age) between exposed and unexposed is reported for each predictive feature; (b) The beta of each predictive feature in the logistic regression is reported. Bars falling below zero represent mutation types which are underrepresented when the given exposure is present.
Figure 4—figure supplement 47
SuperSigs for environmental and inherited factors.
For the indicated risk factor and cancer type all selected features of its signature are listed (IUPAC notations: B=not A, D = not C, H = not G, V = not T, W = A or T, S = C or G, M = A or C, K = G or T, R = A or G, Y = C or T). The color of each bar is representing the point mutation type as follows: C to T mutations = red, C to A = green, C to G = yellow, T to C = orange, T to G = purple, T to A = blue. (a) The difference in the mean rate (=mutation count/age) between exposed and unexposed is reported for each predictive feature; (b) The beta of each predictive feature in the logistic regression is reported. Bars falling below zero represent mutation types which are underrepresented when the given exposure is present.
Figure 4—figure supplement 48
SuperSigs for environmental and inherited factors.
For the indicated risk factor and cancer type all selected features of its signature are listed (IUPAC notations: B=not A, D = not C, H = not G, V = not T, W = A or T, S = C or G, M = A or C, K = G or T, R = A or G, Y = C or T). The color of each bar is representing the point mutation type as follows: C to T mutations = red, C to A = green, C to G = yellow, T to C = orange, T to G = purple, T to A = blue. (a) The difference in the mean rate (=mutation count/age) between exposed and unexposed is reported for each predictive feature; (b) The beta of each predictive feature in the logistic regression is reported. Bars falling below zero represent mutation types which are underrepresented when the given exposure is present.
Figure 4—figure supplement 49

SuperSigs for environmental and inherited factors.
For the indicated risk factor and cancer type all selected features of its signature are listed (IUPAC notations: B=not A, D = not C, H = not G, V = not T, W = A or T, S = C or G, M = A or C, K = G or T, R = A or G, Y = C or T). The color of each bar is representing the point mutation type as follows: C to T mutations = red, C to A = green, C to G = yellow, T to C = orange, T to G = purple, T to A = blue. (a) The difference in the mean rate (=mutation count/age) between exposed and unexposed is reported for each predictive feature; (b) The beta of each predictive feature in the logistic regression is reported. Bars falling below zero represent mutation types which are underrepresented when the given exposure is present.
Figure 4—figure supplement 50
SuperSigs for environmental and inherited factors.
For the indicated risk factor and cancer type all selected features of its signature are listed (IUPAC notations: B=not A, D = not C, H = not G, V = not T, W = A or T, S = C or G, M = A or C, K = G or T, R = A or G, Y = C or T). The color of each bar is representing the point mutation type as follows: C to T mutations = red, C to A = green, C to G = yellow, T to C = orange, T to G = purple, T to A = blue. (a) The difference in the mean rate (=mutation count/age) between exposed and unexposed is reported for each predictive feature; (b) The beta of each predictive feature in the logistic regression is reported. Bars falling below zero represent mutation types which are underrepresented when the given exposure is present.
Figure 4—figure supplement 51
SuperSigs for environmental and inherited factors.
For the indicated risk factor and cancer type all selected features of its signature are listed (IUPAC notations: B=not A, D = not C, H = not G, V = not T, W = A or T, S = C or G, M = A or C, K = G or T, R = A or G, Y = C or T). The color of each bar is representing the point mutation type as follows: C to T mutations = red, C to A = green, C to G = yellow, T to C = orange, T to G = purple, T to A = blue. (a) The difference in the mean rate (=mutation count/age) between exposed and unexposed is reported for each predictive feature; (b) The beta of each predictive feature in the logistic regression is reported. Bars falling below zero represent mutation types which are underrepresented when the given exposure is present.
Figure 4—figure supplement 52
SuperSigs for environmental and inherited factors.
For the indicated risk factor and cancer type all selected features of its signature are listed (IUPAC notations: B=not A, D = not C, H = not G, V = not T, W = A or T, S = C or G, M = A or C, K = G or T, R = A or G, Y = C or T). The color of each bar is representing the point mutation type as follows: C to T mutations = red, C to A = green, C to G = yellow, T to C = orange, T to G = purple, T to A = blue. (a) The difference in the mean rate (=mutation count/age) between exposed and unexposed is reported for each predictive feature; (b) The beta of each predictive feature in the logistic regression is reported. Bars falling below zero represent mutation types which are underrepresented when the given exposure is present.
Figure 4—figure supplement 53
SuperSigs for environmental and inherited factors.
For the indicated risk factor and cancer type all selected features of its signature are listed (IUPAC notations: B=not A, D = not C, H = not G, V = not T, W = A or T, S = C or G, M = A or C, K = G or T, R = A or G, Y = C or T). The color of each bar is representing the point mutation type as follows: C to T mutations = red, C to A = green, C to G = yellow, T to C = orange, T to G = purple, T to A = blue. (a) The difference in the mean rate (=mutation count/age) between exposed and unexposed is reported for each predictive feature; (b) The beta of each predictive feature in the logistic regression is reported. Bars falling below zero represent mutation types which are underrepresented when the given exposure is present.
Figure 4—figure supplement 54
SuperSigs for environmental and inherited factors.
For the indicated risk factor and cancer type all selected features of its signature are listed (IUPAC notations: B=not A, D = not C, H = not G, V = not T, W = A or T, S = C or G, M = A or C, K = G or T, R = A or G, Y = C or T). The color of each bar is representing the point mutation type as follows: C to T mutations = red, C to A = green, C to G = yellow, T to C = orange, T to G = purple, T to A = blue. (a) The difference in the mean rate (=mutation count/age) between exposed and unexposed is reported for each predictive feature; (b) The beta of each predictive feature in the logistic regression is reported. Bars falling below zero represent mutation types which are underrepresented when the given exposure is present.
Figure 4—figure supplement 55
SuperSigs for environmental and inherited factors.
For the indicated risk factor and cancer type all selected features of its signature are listed (IUPAC notations: B=not A, D = not C, H = not G, V = not T, W = A or T, S = C or G, M = A or C, K = G or T, R = A or G, Y = C or T). The color of each bar is representing the point mutation type as follows: C to T mutations = red, C to A = green, C to G = yellow, T to C = orange, T to G = purple, T to A = blue. (a) The difference in the mean rate (=mutation count/age) between exposed and unexposed is reported for each predictive feature; (b) The beta of each predictive feature in the logistic regression is reported. Bars falling below zero represent mutation types which are underrepresented when the given exposure is present.
Figure 4—figure supplement 56
SuperSigs for environmental and inherited factors.
For the indicated risk factor and cancer type all selected features of its signature are listed (IUPAC notations: B=not A, D = not C, H = not G, V = not T, W = A or T, S = C or G, M = A or C, K = G or T, R = A or G, Y = C or T). The color of each bar is representing the point mutation type as follows: C to T mutations = red, C to A = green, C to G = yellow, T to C = orange, T to G = purple, T to A = blue. (a) The difference in the mean rate (=mutation count/age) between exposed and unexposed is reported for each predictive feature; (b) The beta of each predictive feature in the logistic regression is reported. Bars falling below zero represent mutation types which are underrepresented when the given exposure is present.
Figure 4—figure supplement 57
SuperSigs for environmental and inherited factors.
For the indicated risk factor and cancer type all selected features of its signature are listed (IUPAC notations: B=not A, D = not C, H = not G, V = not T, W = A or T, S = C or G, M = A or C, K = G or T, R = A or G, Y = C or T). The color of each bar is representing the point mutation type as follows: C to T mutations = red, C to A = green, C to G = yellow, T to C = orange, T to G = purple, T to A = blue. (a) The difference in the mean rate (=mutation count/age) between exposed and unexposed is reported for each predictive feature; (b) The beta of each predictive feature in the logistic regression is reported. Bars falling below zero represent mutation types which are underrepresented when the given exposure is present.
Figure 4—figure supplement 58
SuperSigs for environmental and inherited factors.
For the indicated risk factor and cancer type all selected features of its signature are listed (IUPAC notations: B=not A, D = not C, H = not G, V = not T, W = A or T, S = C or G, M = A or C, K = G or T, R = A or G, Y = C or T). The color of each bar is representing the point mutation type as follows: C to T mutations = red, C to A = green, C to G = yellow, T to C = orange, T to G = purple, T to A = blue. (a) The difference in the mean rate (=mutation count/age) between exposed and unexposed is reported for each predictive feature; (b) The beta of each predictive feature in the logistic regression is reported. Bars falling below zero represent mutation types which are underrepresented when the given exposure is present.
Figure 4—figure supplement 59
SuperSigs for environmental and inherited factors.
For the indicated risk factor and cancer type all selected features of its signature are listed (IUPAC notations: B=not A, D = not C, H = not G, V = not T, W = A or T, S = C or G, M = A or C, K = G or T, R = A or G, Y = C or T). The color of each bar is representing the point mutation type as follows: C to T mutations = red, C to A = green, C to G = yellow, T to C = orange, T to G = purple, T to A = blue. (a) The difference in the mean rate (=mutation count/age) between exposed and unexposed is reported for each predictive feature; (b) The beta of each predictive feature in the logistic regression is reported. Bars falling below zero represent mutation types which are underrepresented when the given exposure is present.
Figure 4—figure supplement 60
SuperSigs for environmental and inherited factors.
For the indicated risk factor and cancer type all selected features of its signature are listed (IUPAC notations: B=not A, D = not C, H = not G, V = not T, W = A or T, S = C or G, M = A or C, K = G or T, R = A or G, Y = C or T). The color of each bar is representing the point mutation type as follows: C to T mutations = red, C to A = green, C to G = yellow, T to C = orange, T to G = purple, T to A = blue. (a) The difference in the mean rate (=mutation count/age) between exposed and unexposed is reported for each predictive feature; (b) The beta of each predictive feature in the logistic regression is reported. Bars falling below zero represent mutation types which are underrepresented when the given exposure is present.
Figure 4—figure supplement 61
SuperSigs for environmental and inherited factors.
For the indicated risk factor and cancer type all selected features of its signature are listed (IUPAC notations: B=not A, D = not C, H = not G, V = not T, W = A or T, S = C or G, M = A or C, K = G or T, R = A or G, Y = C or T). The color of each bar is representing the point mutation type as follows: C to T mutations = red, C to A = green, C to G = yellow, T to C = orange, T to G = purple, T to A = blue. (a) The difference in the mean rate (=mutation count/age) between exposed and unexposed is reported for each predictive feature; (b) The beta of each predictive feature in the logistic regression is reported. Bars falling below zero represent mutation types which are underrepresented when the given exposure is present.
Figure 4—figure supplement 62
SuperSigs for environmental and inherited factors.
For the indicated risk factor and cancer type all selected features of its signature are listed (IUPAC notations: B=not A, D = not C, H = not G, V = not T, W = A or T, S = C or G, M = A or C, K = G or T, R = A or G, Y = C or T). The color of each bar is representing the point mutation type as follows: C to T mutations = red, C to A = green, C to G = yellow, T to C = orange, T to G = purple, T to A = blue. (a) The difference in the mean rate (=mutation count/age) between exposed and unexposed is reported for each predictive feature; (b) The beta of each predictive feature in the logistic regression is reported. Bars falling below zero represent mutation types which are underrepresented when the given exposure is present.
Figure 4—figure supplement 63
SuperSigs for environmental and inherited factors.
For the indicated risk factor and cancer type all selected features of its signature are listed (IUPAC notations: B=not A, D = not C, H = not G, V = not T, W = A or T, S = C or G, M = A or C, K = G or T, R = A or G, Y = C or T). The color of each bar is representing the point mutation type as follows: C to T mutations = red, C to A = green, C to G = yellow, T to C = orange, T to G = purple, T to A = blue. (a) The difference in the mean rate (=mutation count/age) between exposed and unexposed is reported for each predictive feature; (b) The beta of each predictive feature in the logistic regression is reported. Bars falling below zero represent mutation types which are underrepresented when the given exposure is present.
Figure 4—figure supplement 64
SuperSigs for environmental and inherited factors.
For the indicated risk factor and cancer type all selected features of its signature are listed (IUPAC notations: B=not A, D = not C, H = not G, V = not T, W = A or T, S = C or G, M = A or C, K = G or T, R = A or G, Y = C or T). The color of each bar is representing the point mutation type as follows: C to T mutations = red, C to A = green, C to G = yellow, T to C = orange, T to G = purple, T to A = blue. (a) The difference in the mean rate (=mutation count/age) between exposed and unexposed is reported for each predictive feature; (b) The beta of each predictive feature in the logistic regression is reported. Bars falling below zero represent mutation types which are underrepresented when the given exposure is present.
Figure 4—figure supplement 65
SuperSigs for environmental and inherited factors.
For the indicated risk factor and cancer type all selected features of its signature are listed (IUPAC notations: B=not A, D = not C, H = not G, V = not T, W = A or T, S = C or G, M = A or C, K = G or T, R = A or G, Y = C or T). The color of each bar is representing the point mutation type as follows: C to T mutations = red, C to A = green, C to G = yellow, T to C = orange, T to G = purple, T to A = blue. (a) The difference in the mean rate (=mutation count/age) between exposed and unexposed is reported for each predictive feature; (b) The beta of each predictive feature in the logistic regression is reported. Bars falling below zero represent mutation types which are underrepresented when the given exposure is present.
Figure 4—figure supplement 66
SuperSigs for environmental and inherited factors.
For the indicated risk factor and cancer type all selected features of its signature are listed (IUPAC notations: B=not A, D = not C, H = not G, V = not T, W = A or T, S = C or G, M = A or C, K = G or T, R = A or G, Y = C or T). The color of each bar is representing the point mutation type as follows: C to T mutations = red, C to A = green, C to G = yellow, T to C = orange, T to G = purple, T to A = blue. (a) The difference in the mean rate (=mutation count/age) between exposed and unexposed is reported for each predictive feature; (b) The beta of each predictive feature in the logistic regression is reported. Bars falling below zero represent mutation types which are underrepresented when the given exposure is present.
Figure 4—figure supplement 67
SuperSigs for environmental and inherited factors.
For the indicated risk factor and cancer type all selected features of its signature are listed (IUPAC notations: B=not A, D = not C, H = not G, V = not T, W = A or T, S = C or G, M = A or C, K = G or T, R = A or G, Y = C or T). The color of each bar is representing the point mutation type as follows: C to T mutations = red, C to A = green, C to G = yellow, T to C = orange, T to G = purple, T to A = blue. (a) The difference in the mean rate (=mutation count/age) between exposed and unexposed is reported for each predictive feature; (b) The beta of each predictive feature in the logistic regression is reported. Bars falling below zero represent mutation types.
Figure 5

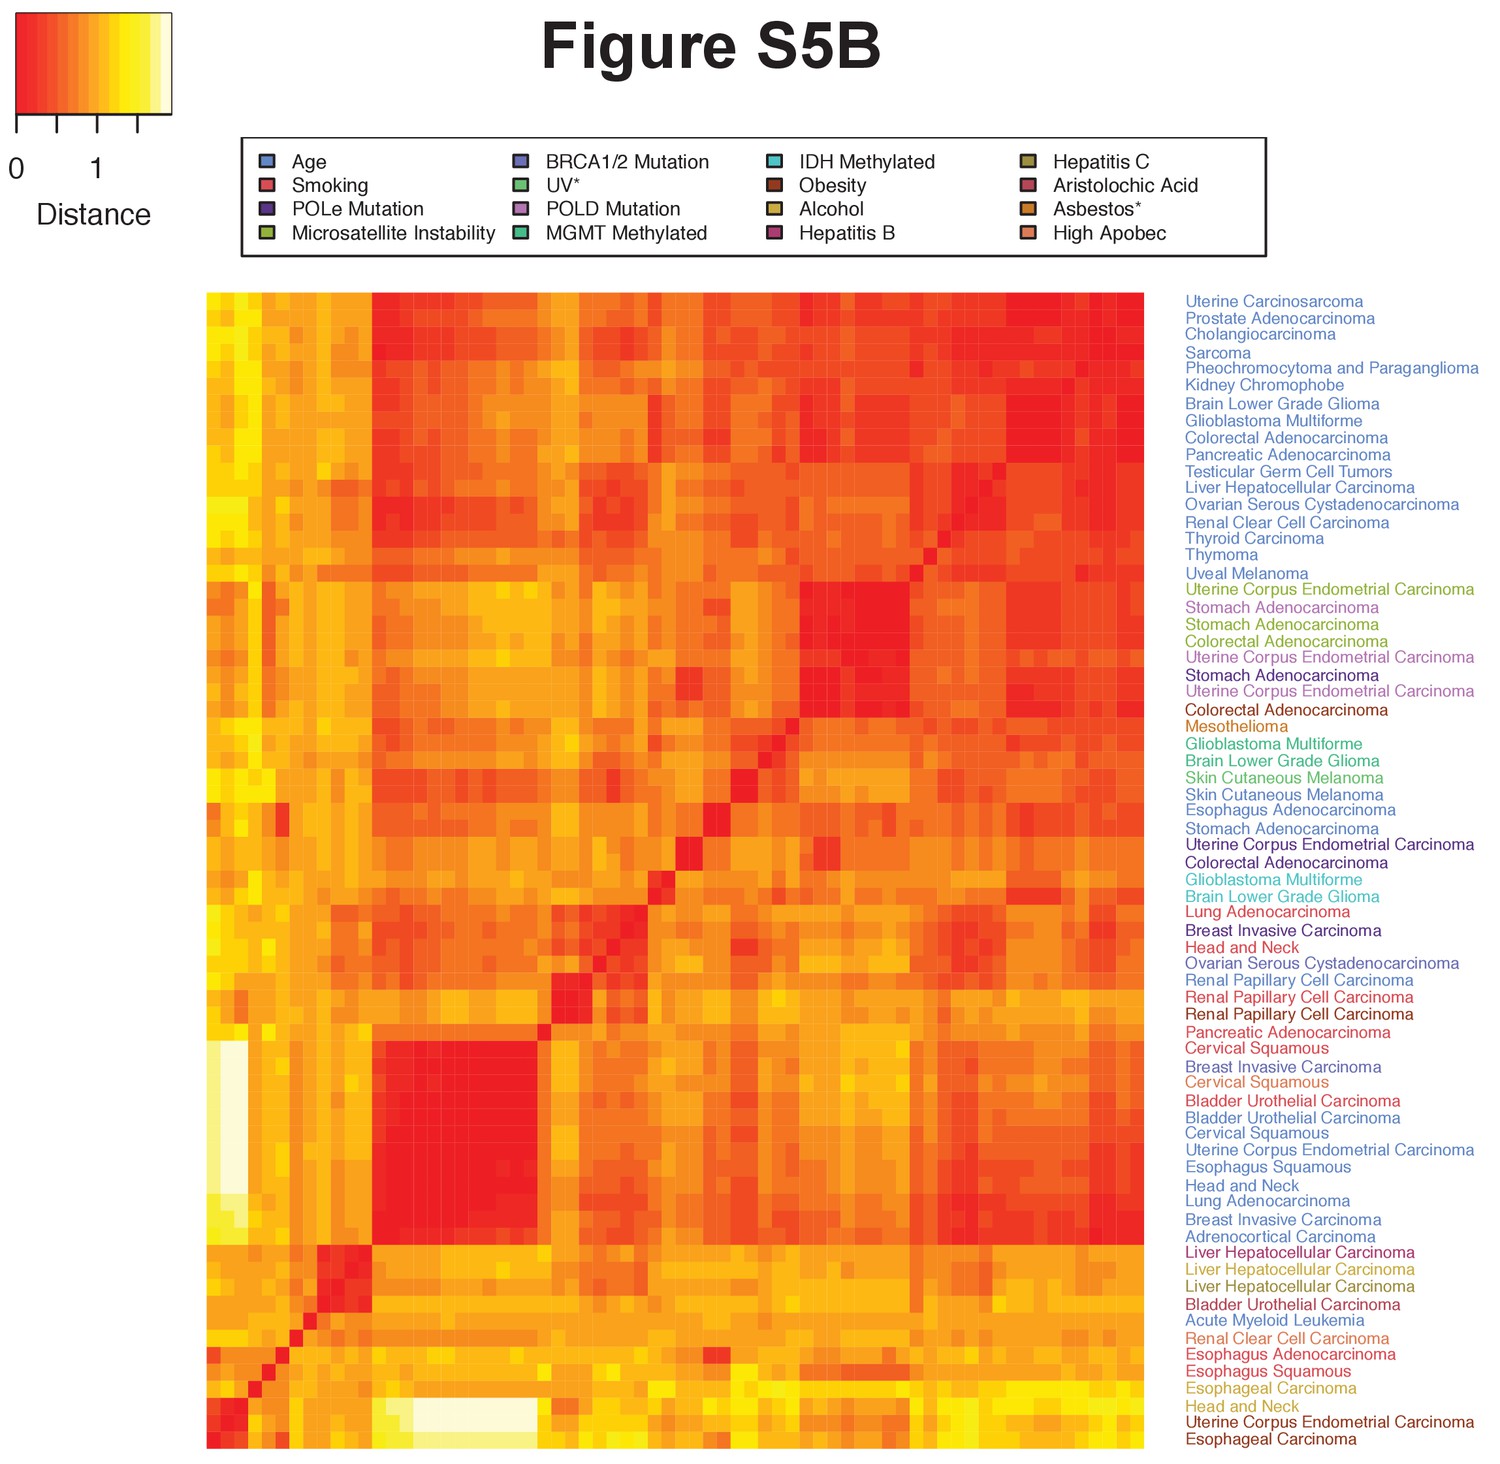
The tissue dependence of mutational signatures.
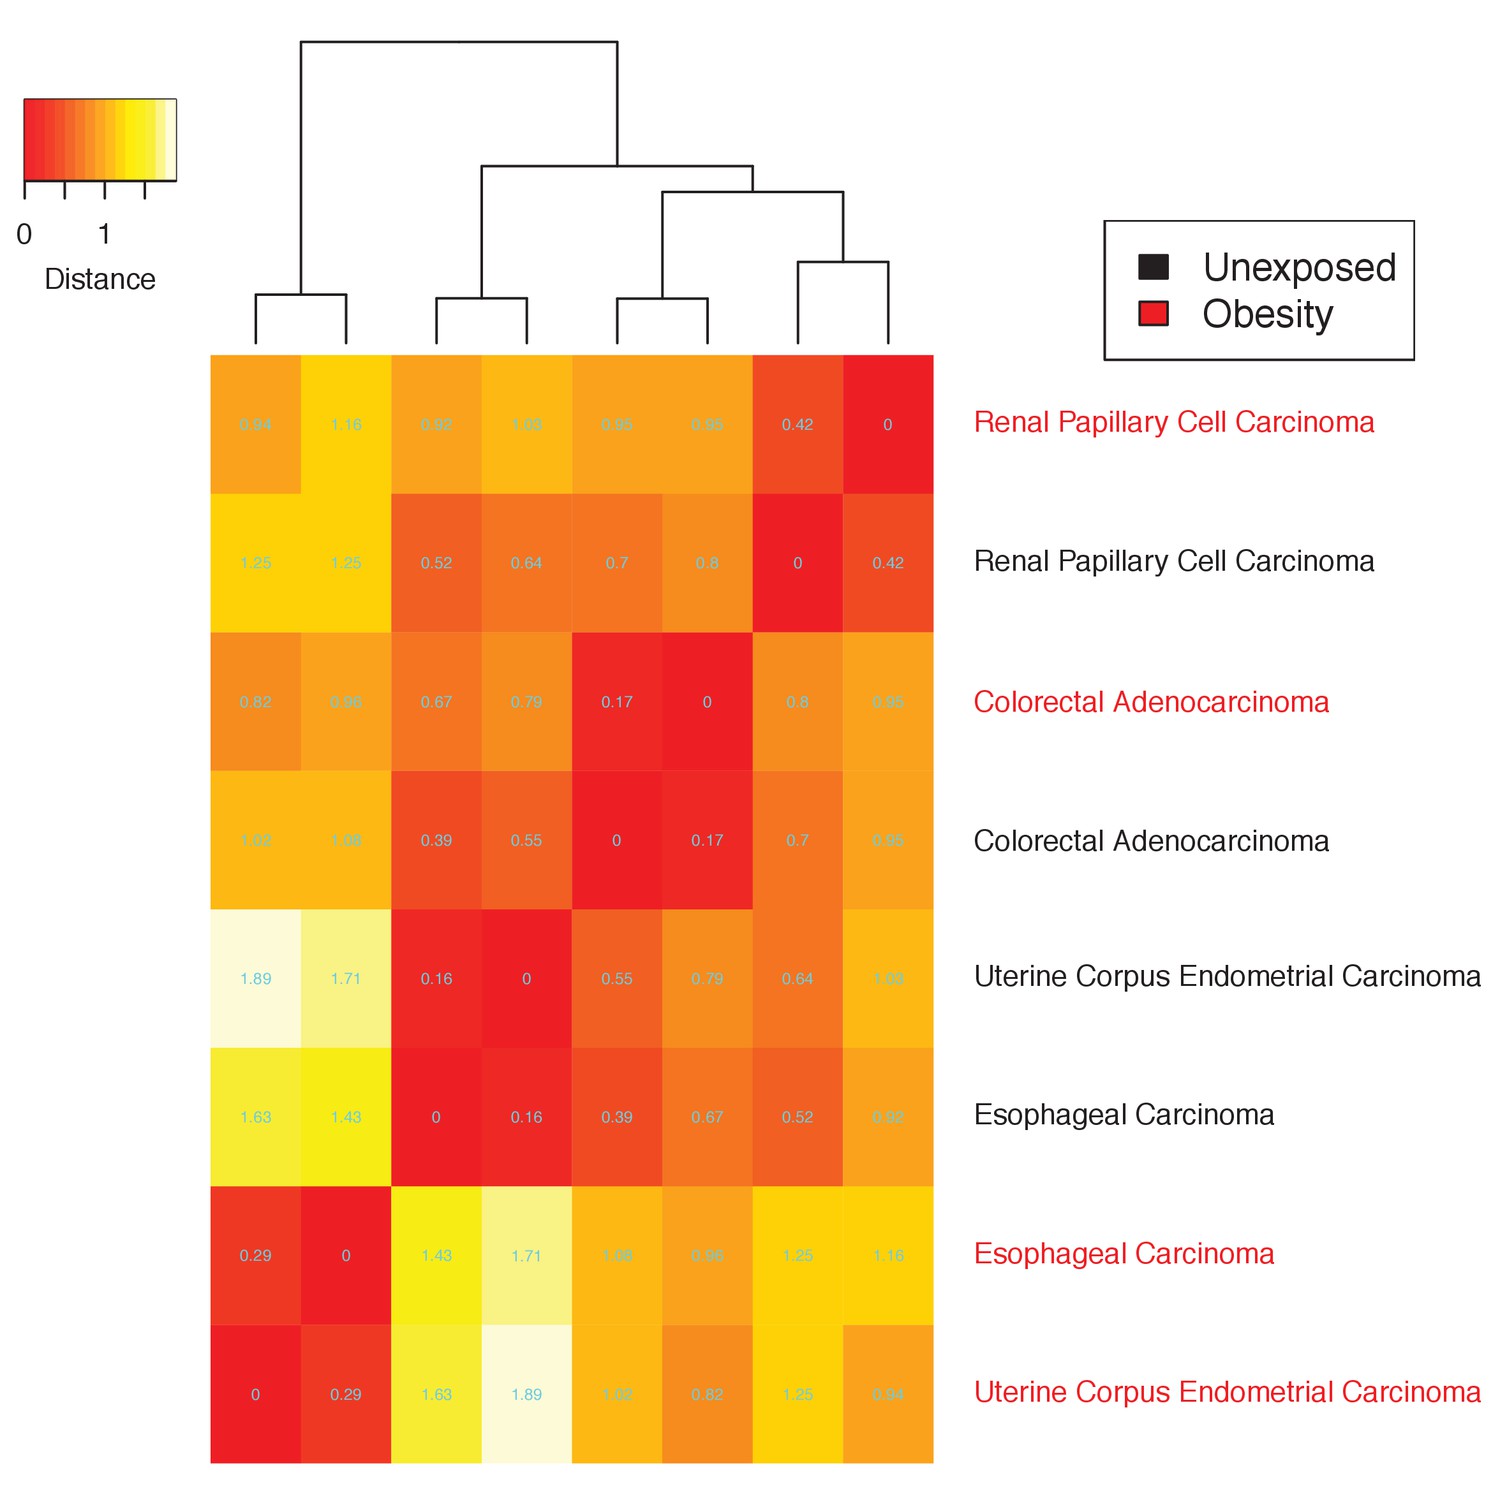
Heat map of the distances among mutational landscapes of different etiological factors for different tissues. Pearson’s correlation was used to calculate the distance (see Materials and methods). The lower the distance the more similar the corresponding mutational landscapes are.
Figure 6
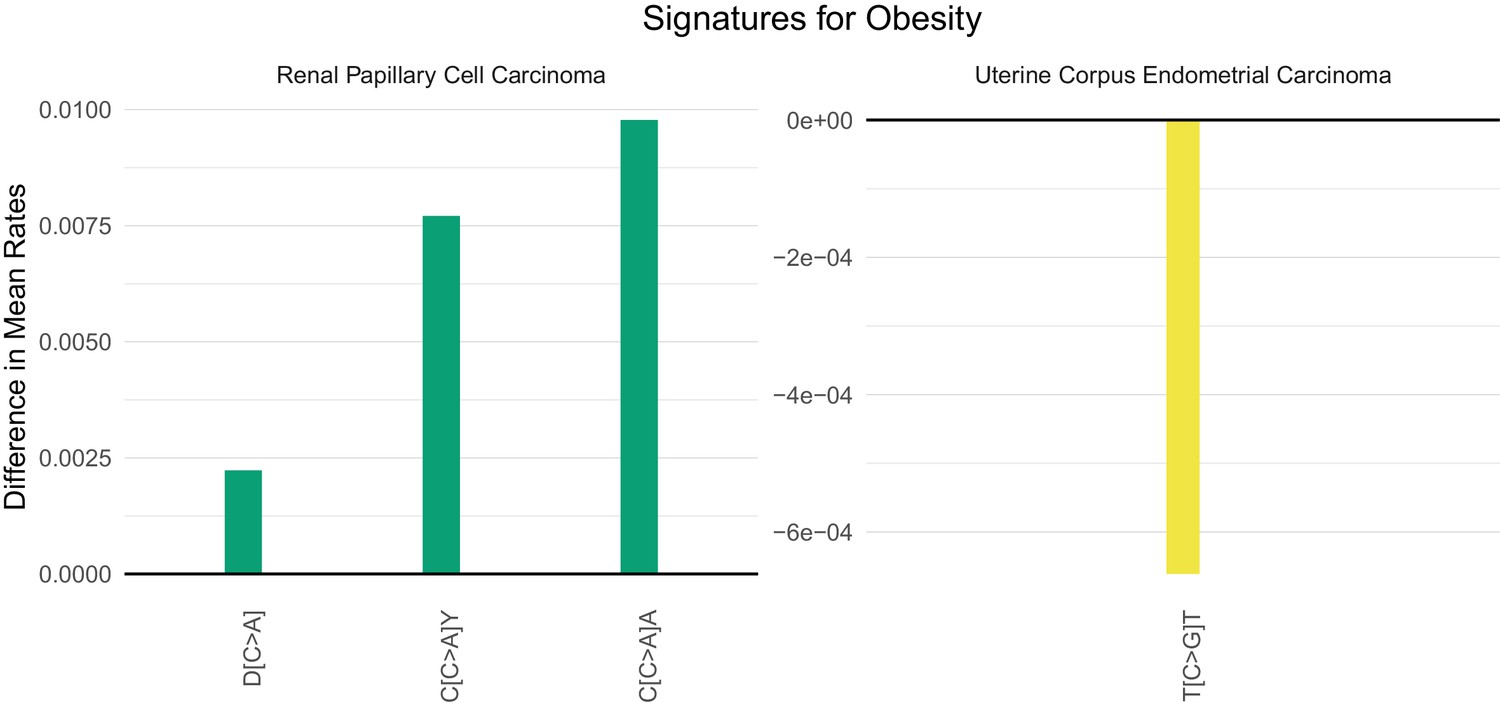
Mutational signatures of obesity in kidney (KIRP) and uterine (UCEC) cancer patients.
All features of a signature are depicted (IUPAC notations: B=not A, D = not C, H = not G, V = not T, W = A or T, S = C or G, M = A or C, K = G or T, R = A or G, Y = C or T). The color of each bar is representing the point mutation type as follows: C to T mutations = red, C to A = green, C to G = yellow, T to C = orange, T to G = purple, T to A = blue. The difference in the mean mutation rate (mutation count/age) between exposed and unexposed is reported for each predictive feature present in the two mutational signatures for obesity. Bars falling below zero represent mutation types which are underrepresented when the given exposure is present.
Author response image 1
Tables
Table 1
External validation of the SuperSigs using the ICGC database.
Cross-validated performances (AUCs) of the indicated SuperSigs on TCGA data, compared to their performance when then used as predictors on ICGC data. The number n of samples tested for each combination of tumor type and factor is indicated in parenthesis.
| Tissue | Factor | TCGA | ICGC |
|---|---|---|---|
| CHOL | AGE | 0.73 (n = 26) | 0.66 (n = 35) |
| HNSCC | AGE | 0.73 (n = 120) | 0.80 (n = 9) |
| KIRC | AGE | 0.81 (n = 123) | 0.75 (n = 82) |
| LIHC | AGE | 0.70 (n = 57) | 0.66 (n = 208) |
| OV | AGE | 0.71 (n = 87) | 0.87 (n = 92) |
| PAAD | AGE | 0.65 (n = 35) | 0.66 (n = 203) |
| PRAD | AGE | 0.65 (n = 305) | 0.83 (n = 120) |
| SKCM | AGE | 0.61 (n = 82) | 0.45 (n = 47) |
| STAD | AGE | 0.66 (n = 176) | 0.64 (n = 21) |
| LIHC | ALCOHOL | 0.62 (n = 154) | 0.66 (n = 25) |
| HNSCC | SMOKING | 0.81 (n = 354) | 0.78 (n = 13) |
Additional files
-
Supplementary file 1
Comparisons of prediction accuracy (AUC) and correlation across methods.
The AUCs and correlations, both apparent and cross-validated, are reported for age and all other etiological factors across all tissue types for each one of the mutational signature methodologies considered in this study: Logistic Regression (Logit), Linear Discriminant Analysis (LDA), Non-negative Least Square Logit using the Betas (NNLS_Logit_betas), Non-negative Least Square Logit using the means (NNLS_Logit_means), Random Forest (RF), Unsupervised as in Alexandrov et al., 2013a (Unsupervised), Best_NMF, Matched_NMF, Signature one as in Alexandrov et al., 2013b (Signature1), and Single Peak (SinglePeak). For their detailed description see the Materials and methods.
- https://cdn.elifesciences.org/articles/61082/elife-61082-supp1-v2.xlsx
-
Supplementary file 2
SuperSigs and their predictive features.
The set of n predictive features forming the supervised signature (SuperSig) are listed for each tissue type and for each etiological exposure. Two values are associated to each one of these predictive features: (1) the difference in mean counts (age) or rates (all other exposures) between the exposed and unexposed cohorts, and (2) the beta (β) coefficient for that feature as estimated by logistic regression. See Figure 4—figure supplements 1–67.
- https://cdn.elifesciences.org/articles/61082/elife-61082-supp2-v2.zip
-
Supplementary file 3
Estimated contributions of the age signature in different tissue types.
For each tissue type and for each etiological factor the estimated mean and median contribution of that factor, out of the total number of mutations present in that tissue, are reported together with the sample sizes (number of patients analyzed).
- https://cdn.elifesciences.org/articles/61082/elife-61082-supp3-v2.zip
-
Supplementary file 4
Comparisons of prediction accuracy (AUC) after random shuffling across methods.
After random shuffling, the AUCs, both apparent and cross-validated (CV), are reported for age and all other etiological factors across all tissue types for each one of the mutational signature methodologies considered in this study: Logistic Regression (Logit), Linear Discriminant Analysis (LDA), Non-negative Least Square Logit using the Betas (NNLS_Logit_betas), Non-negative Least Square Logit using the means (NNLS_Logit_means), Random Forest (RF), Unsupervised as in Alexandrov et al. (Unsupervised), Best_NMF, Matched_NMF, Signature one as in Alexandrov et al. (Signature1), and Single Peak (SinglePeak). For their detailed description see Materials and methods.
- https://cdn.elifesciences.org/articles/61082/elife-61082-supp4-v2.xlsx
-
Supplementary file 5
Comparisons of prediction accuracy (AUC) with different mislabeled proportions (5, 10, 20, and 25% of samples mislabeled) in the training set.
The AUCs, both apparent and cross-validated (CV), are reported for age and all other etiological factors across all tissue types for each one of the mutational signature methodologies considered in this study: Logistic Regression (Logit), Linear Discriminant Analysis (LDA), Non-negative Least Square Logit using the Betas (NNLS_Logit_betas), Non-negative Least Square Logit using the means (NNLS_Logit_means), Random Forest (RF), Unsupervised as in Alexandrov et al. (Unsupervised), Best_NMF, Matched_NMF, Signature one as in Alexandrov et al. (Signature1), and Single Peak (SinglePeak). For their detailed description see Materials and methods.
- https://cdn.elifesciences.org/articles/61082/elife-61082-supp5-v2.xlsx
-
Transparent reporting form
- https://cdn.elifesciences.org/articles/61082/elife-61082-transrepform-v2.docx
Download links
A two-part list of links to download the article, or parts of the article, in various formats.
Downloads (link to download the article as PDF)
Open citations (links to open the citations from this article in various online reference manager services)
Cite this article (links to download the citations from this article in formats compatible with various reference manager tools)
Supervised mutational signatures for obesity and other tissue-specific etiological factors in cancer
eLife 10:e61082.
https://doi.org/10.7554/eLife.61082


