Histone deposition pathways determine the chromatin landscapes of H3.1 and H3.3 K27M oncohistones
- Basic Sciences Division, Fred Hutchinson Cancer Research Center, United States
- Cancer and Blood Disorders, United States
- Human Biology Division, Fred Hutchinson Cancer Research Center, United States
- Department of Laboratory Medicine and Pathology, University of Washington School of Medicine, United States
- Clinical Research Division Fred Hutchinson Cancer Research Center, United States
- Howard Hughes Medical Institute, United States
Figures
Figure 1
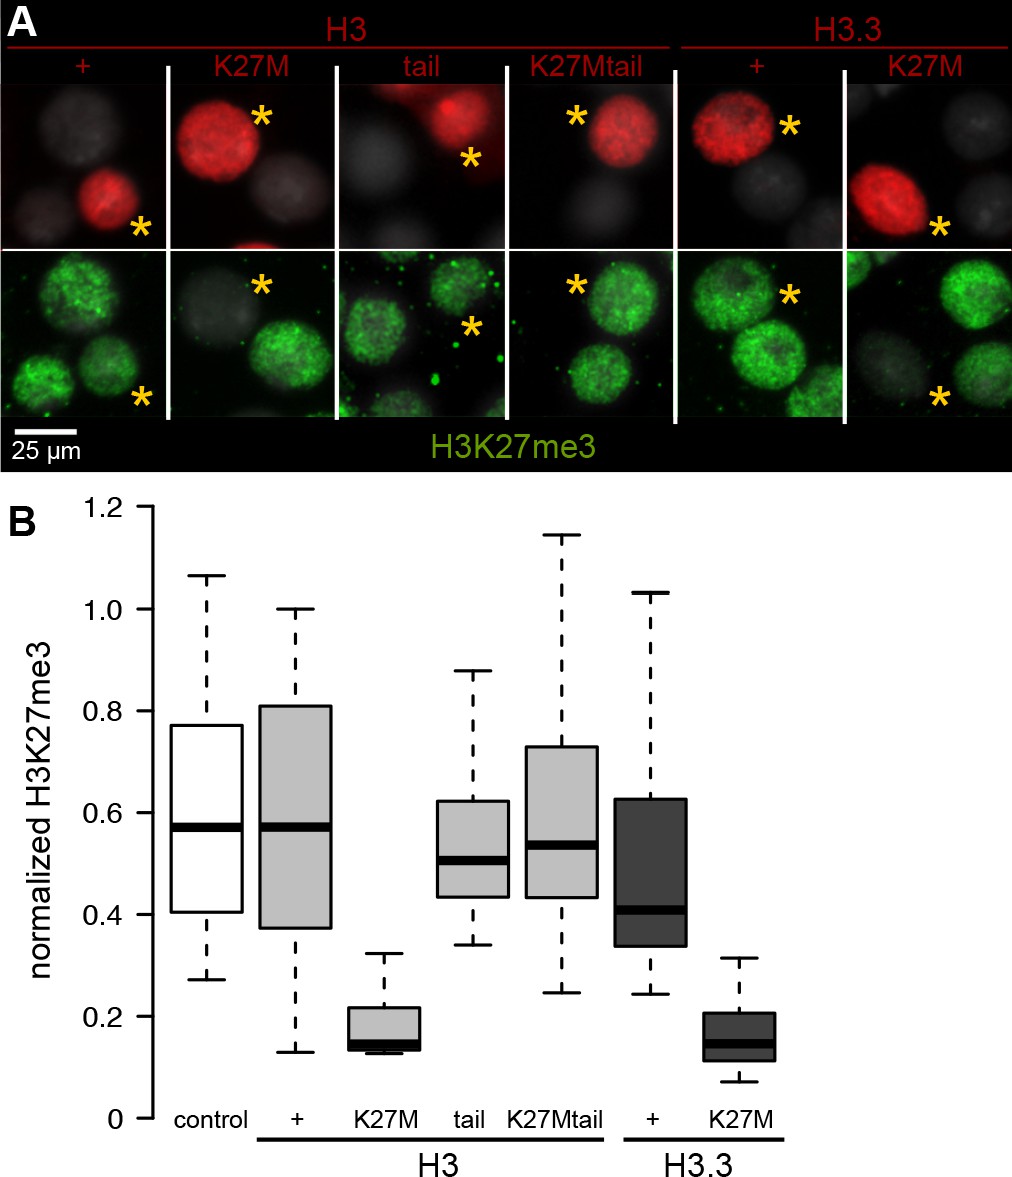
Chromatin-bound K27M histones inhibit H3K27 trimethylation.
Drosophila S2 cells were transfected with epitope-tagged histone constructs, and immunostained for H3K27 trimethylation (green) after 2 days of protein (red) expression. (A) Representative images of non-transfected cells and cells transfected with the indicated epitope-tagged histone construct (yellow asterisks). (B) The mean signal intensity of 50 transfected nuclei and of 50 non-transfected nuclei from two transfections for each construct is plotted.
Figure 2

Inhibition of H3K27 methylation by K27M histones is limited to cycling cells.
Eye imaginal discs from late larvae are divided by the morphogenetic furrow (MF, yellow arrowhead) into an anterior region (left) with asynchronously dividing cells and a posterior region (right). Discs were immunostained for the ELAV neuronal marker (red), which marks differentiating photoreceptors in the posterior region of the disc, the H3K27me3 modification (green), the H3.3K27M oncohistone (blue), or for mitotic cells (S10-phosphorylation, magenta). (A,B) In eye imaginal discs, one last wave of mitosis occurs in the posterior portion (to the right) of the disc behind the MF, as cells initiate neuronal differentiation. The GMR-GAL4 driver induces expression of the H3.3K27M oncohistone in this region of the disc. (C,D) Expression of the S phase inhibitor p21 in the posterior region of the eye disc blocks progression of the last cell cycle, indicated by the absence of mitotic cells in the posterior region of the eye disc. GMR-GAL4 induced expression of the H3.3K27M oncohistone in the posterior region of the disc is unaffected. (E,F) Adult eye morphology is unaffected by expression of either a wild-type H3.3 transgene (+) or an H3.3K27M transgene late in development by the GMR-GAL4 driver. (G,H) GMR-induced expression of the cell cycle inhibitor p21 results in moderately reduced eye size in both wild-type (G) and H3.3K27M-expressing animals (H). (I) Eye imaginal discs from wild-type larvae (+) show high H3K27me3 signal apparent in both the anterior and posterior regions of the eye disc. (J) Induced overexpression of a wild-type H3.3 histone in the posterior portion of the eye disc does not affect H3K27me3 staining. (K) Induced overexpression of H3.3K27M histone strongly reduces H3K27me3 staining in the posterior region of the eye disc. (L) Co-expression of H3.3K27M and the p21 inhibitor show high level H3K27me3 staining in both the anterior and posterior regions of the eye disc. (M) Quantification of H3K27me3 signal intensity differences between the anterior portion of eye discs and the posterior portion, where the GMR-GAL4 driver induces histone transgene expression. At least 10 discs were measured for each genotype.
Figure 3 with 3 supplements
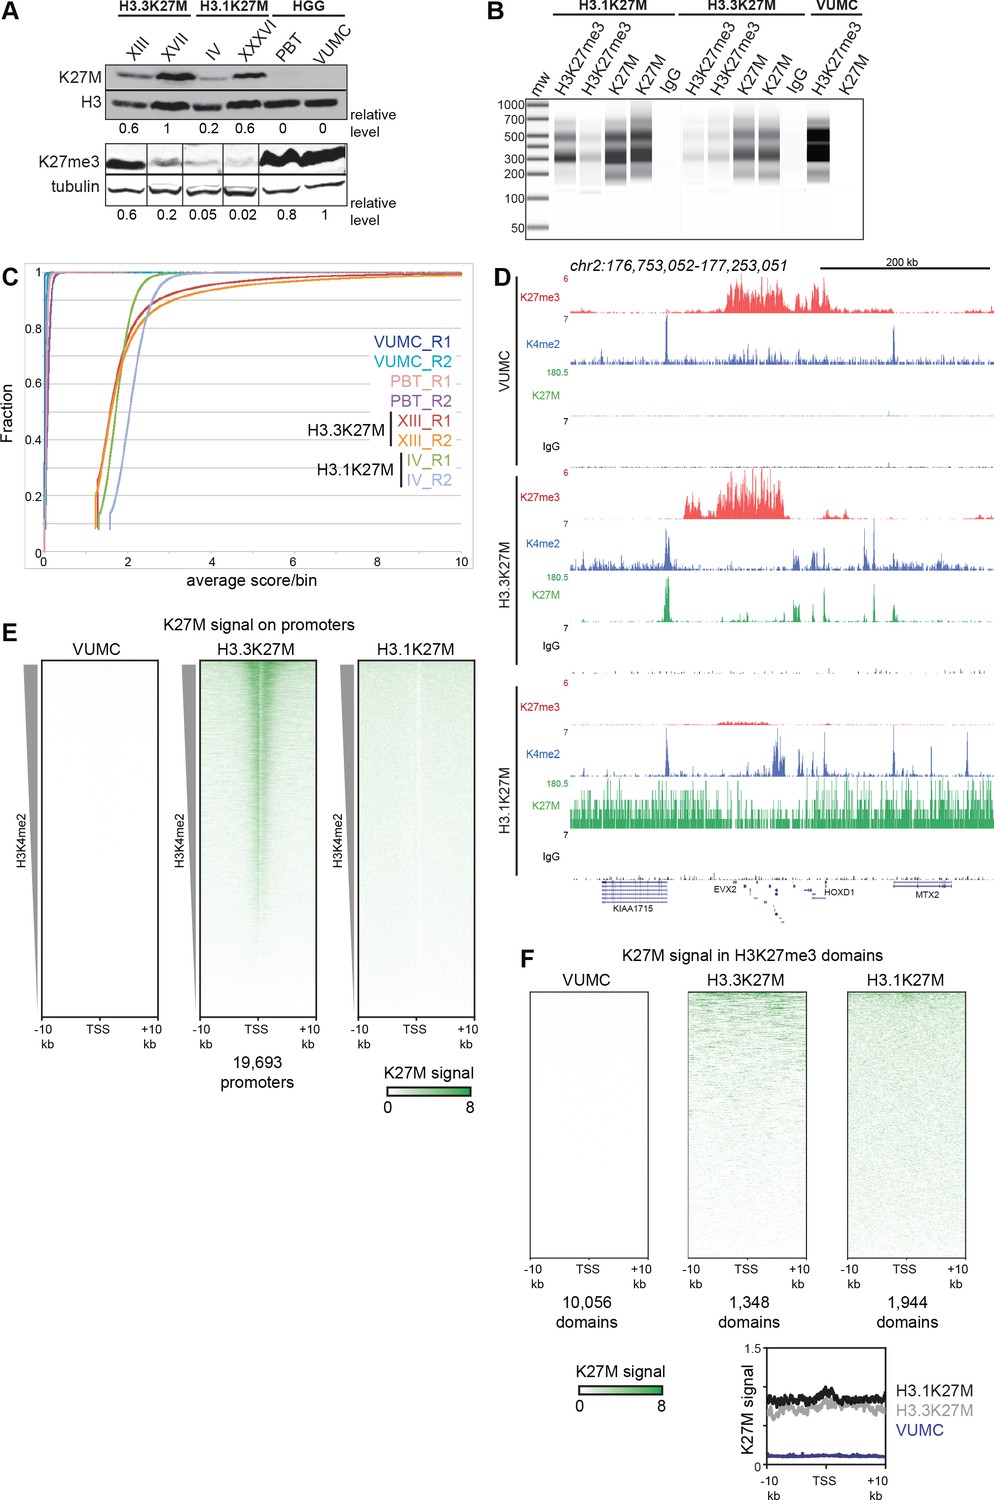
Global K27M distributions depend upon histone H3 types.
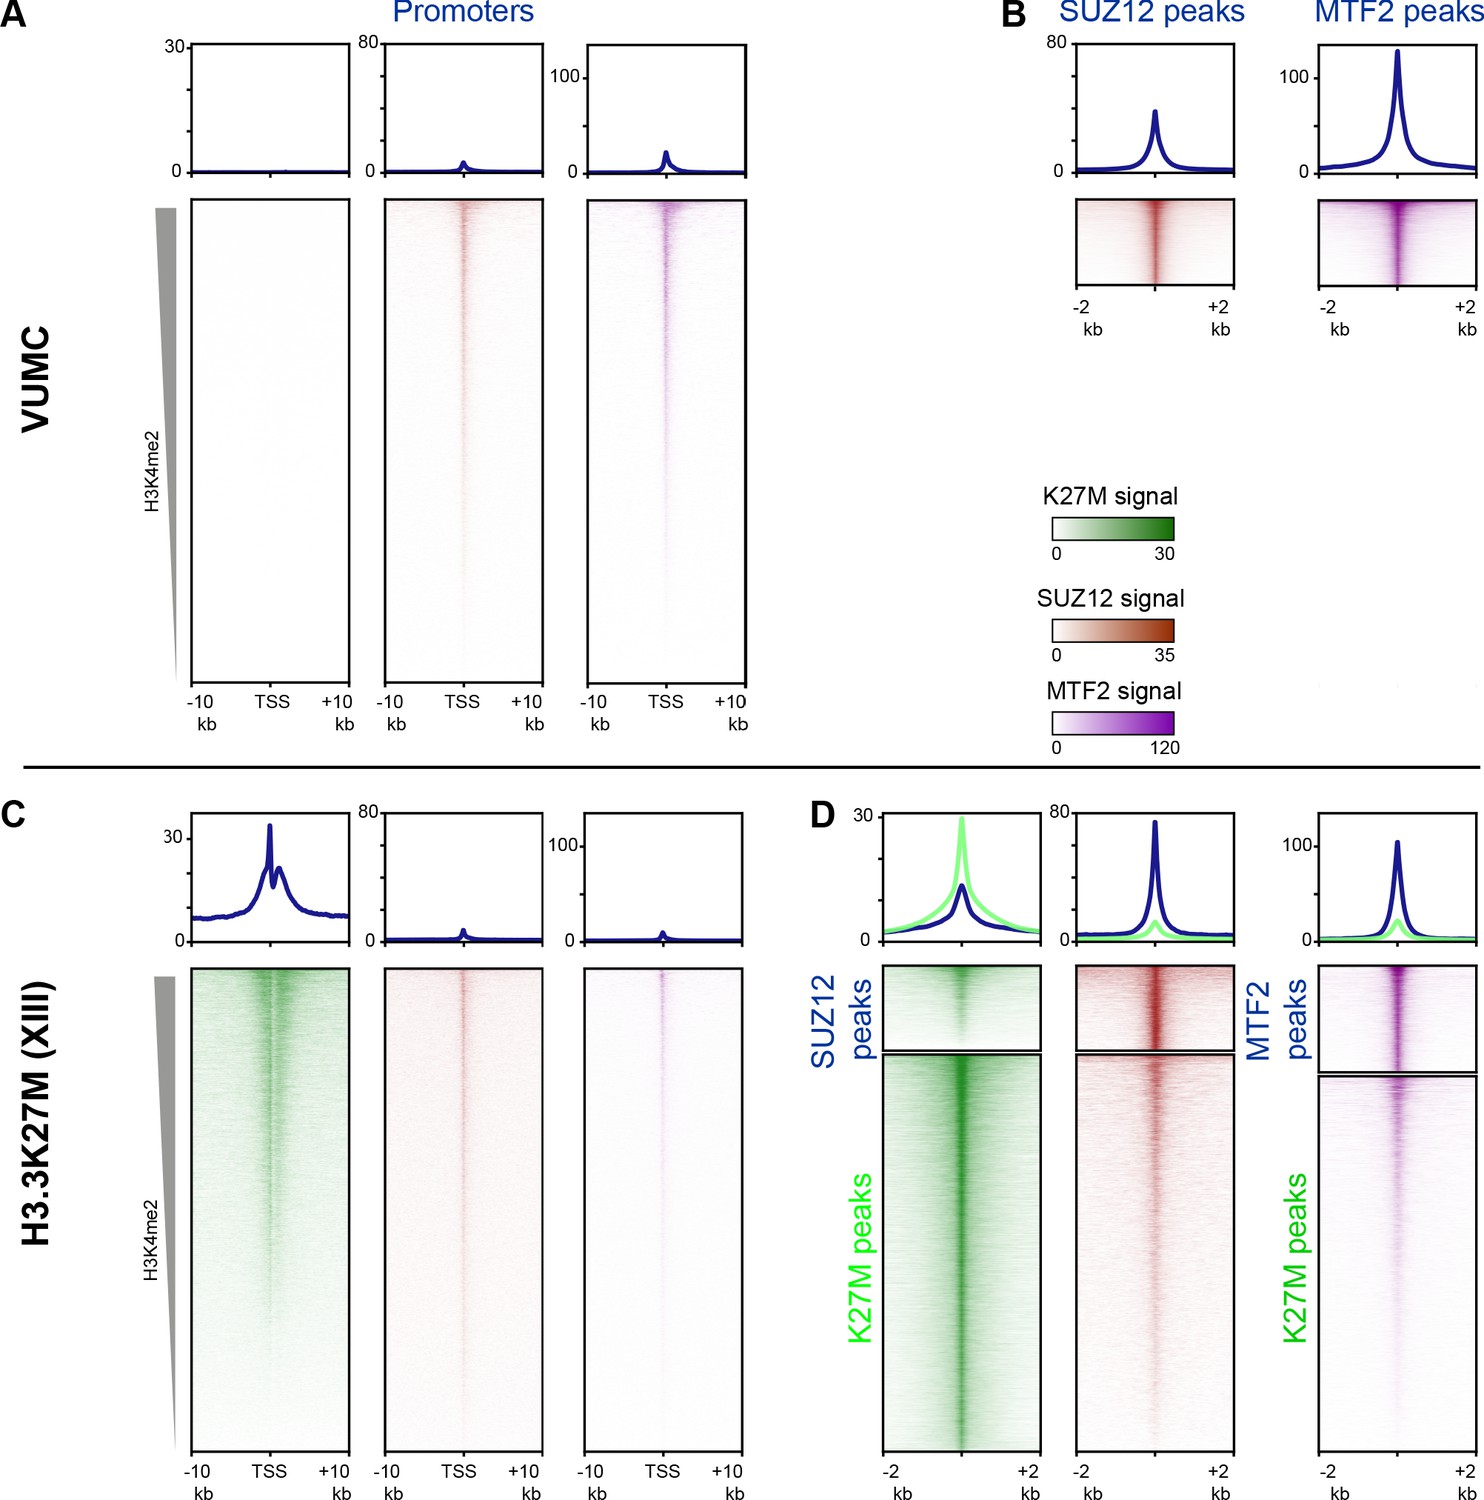
(A) Western detection of K27M and H3K27me3 in glioma cell lines. K27M epitope amounts were normalized to histone H3 signal on the same blot, and H3K27me3 was normalized to tubulin on the same blot. The K27M histone is expressed over a range of levels in H3.1 and H3.3 mutant cell lines, but absent from VUMC and PBT gliomas. (B) Capillary electrophoresis of replicate CUT&RUN reactions. Antibody-targeted cleavage produce a nucleosomal ladder in amounts proportional to the amount of target epitope in samples. The H3 WT VUMC cell line is shown as a positive control for H3K27me3 and negative control for H3K27M. (C) Distribution graphs of read counts in 5 kb bins across the genome in glioma cell lines. H3.1K27M and H3.3K27M cells have moderate signal across the genome, while H3 wild-type VUMC and PBT cells have much lower counts, representing the very low non-specific background of H3K27M profiling. (D) Chromatin landscape of the silenced HOXD locus in glioma cell lines. All tracks are normalized by spike-in material to represent absolute amounts of signal. (E) Heat maps of H3K27M CUT&RUN signal on gene promoters in glioma cell lines. Promoters were ordered by the amount of CUT&RUN signal for H3K4me2, a mark of active transcription, in a 1 kb window around each TSS. The H3.3K27M cell line shows specific promoter enrichment of K27M in the most active promoters. (F) Heat maps of H3K27M across H3K27me3 domains in glioma cell lines. Domains were ordered by the amount of H3K27M signal. Both H3.1K27M and H3.3K27M cells show moderate K27M enrichment across domains. The average plot shows the enrichment of the K27M signal across the domains in each cell type.
Figure 3—figure supplement 1
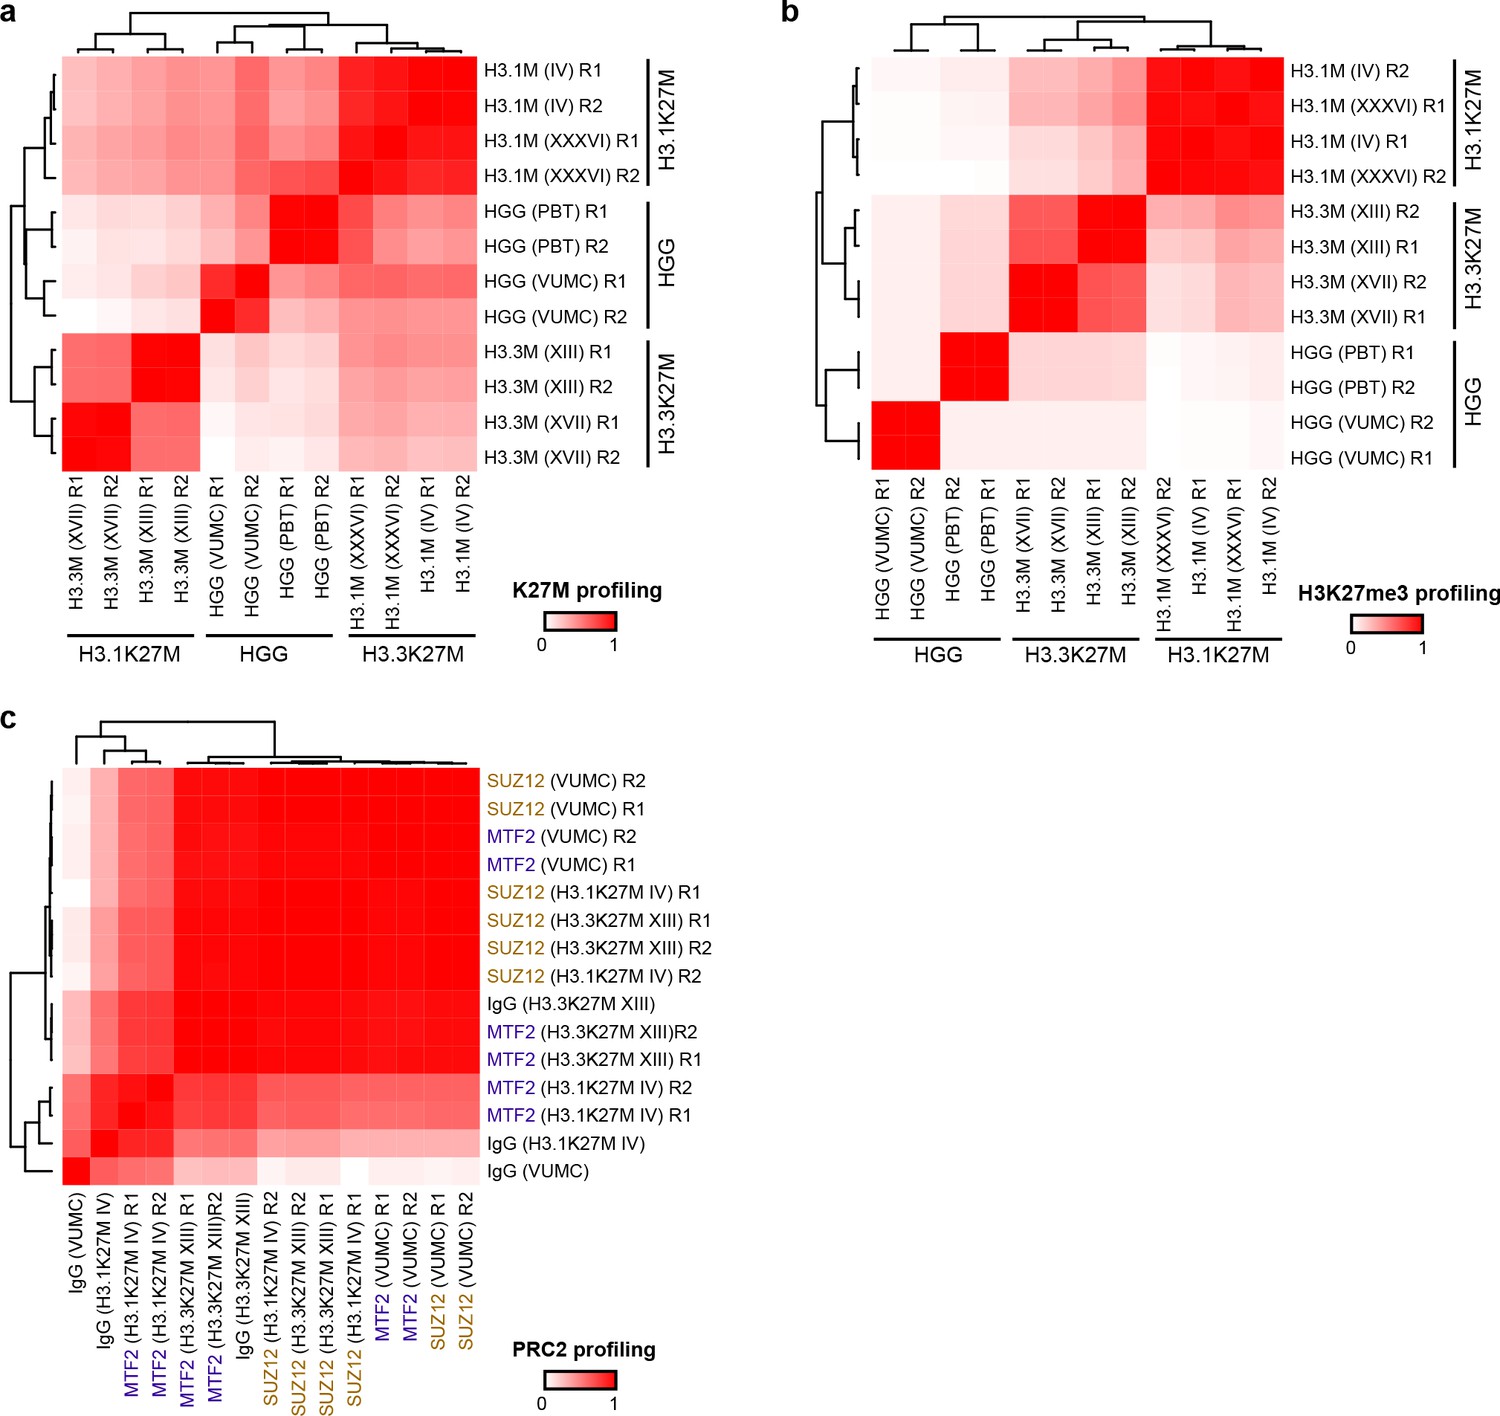
Reproducibility of chromatin profiling experiments.
Heatmaps display Pearson’s correlation (R2) between denoted cell line replicates (R1 or R2) for CUT&RUN signal from H3K27M (A), H3K27me3 (B), or PRC2 subunits SUZ12 and MTF2 (C).
Figure 3—figure supplement 2
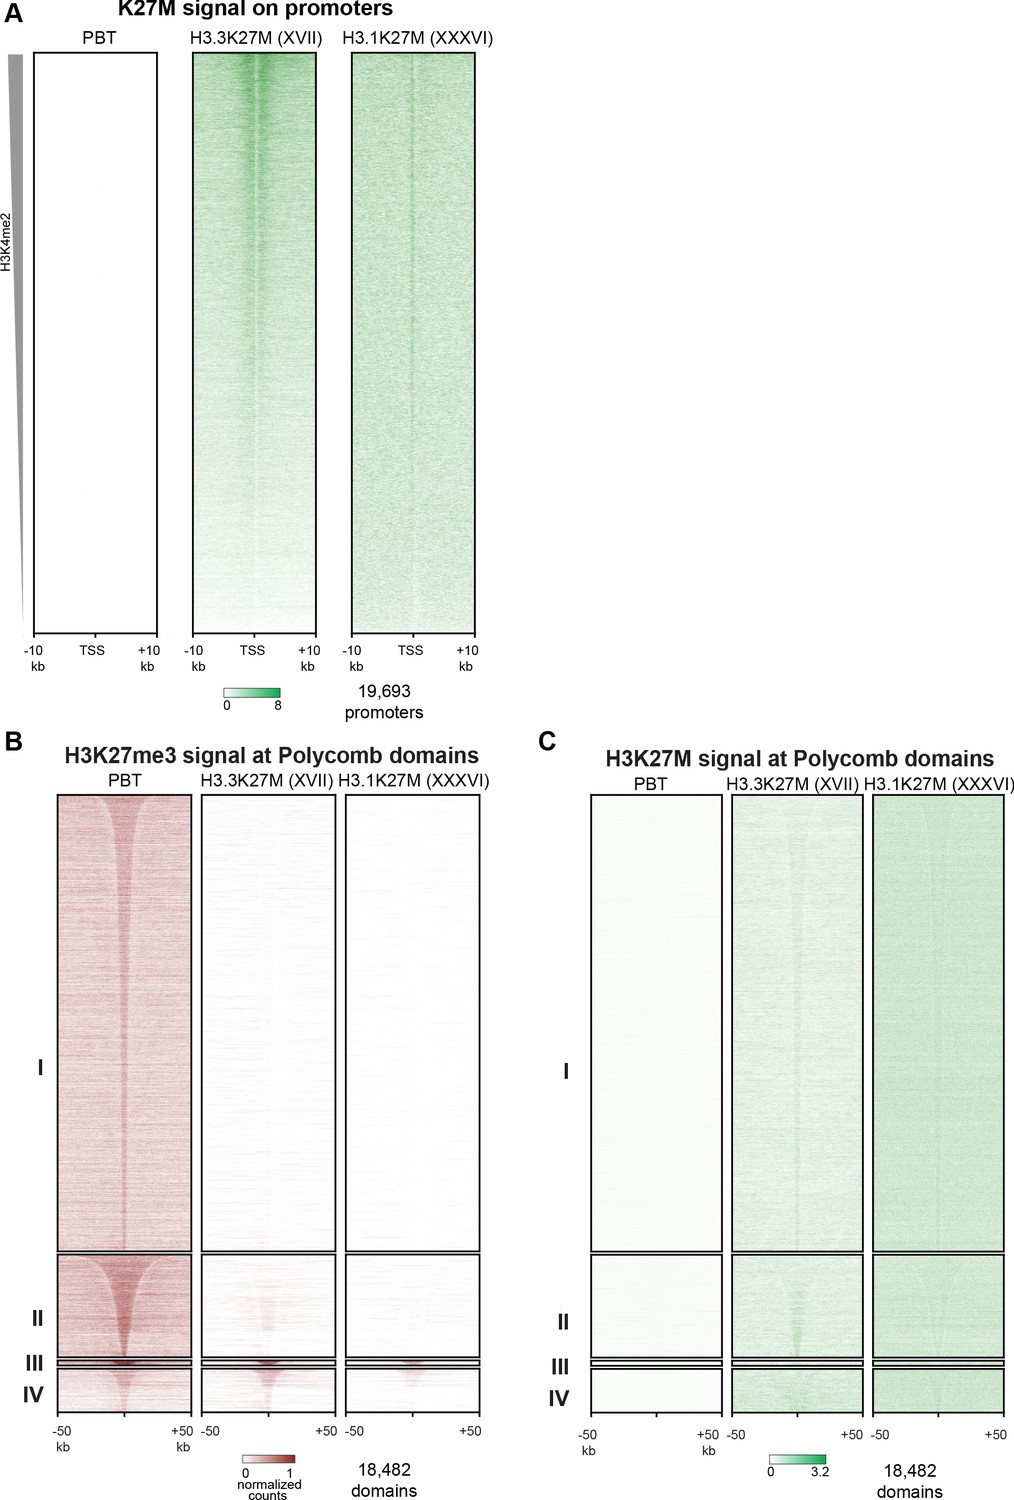
Analyses of PBT-04 HGG and DIPGXVII and DIPGXXXVI glioma cell lines.
(A) Heat maps of H3K27M CUT&RUN signal on gene promoters in HGG and glioma cell lines, ordered by H3K4me2 CUT&RUN signal as in Figure 3D. (B) Enrichment of H3K27me3 in HGG and glioma cell lines in differential H3K27me3 clusters defined in Figure 4A. (C) Enrichment of H3K27M in HGG and glioma cell lines in differential H3K27me3 clusters defined in Figure 4A.
Figure 3—figure supplement 3
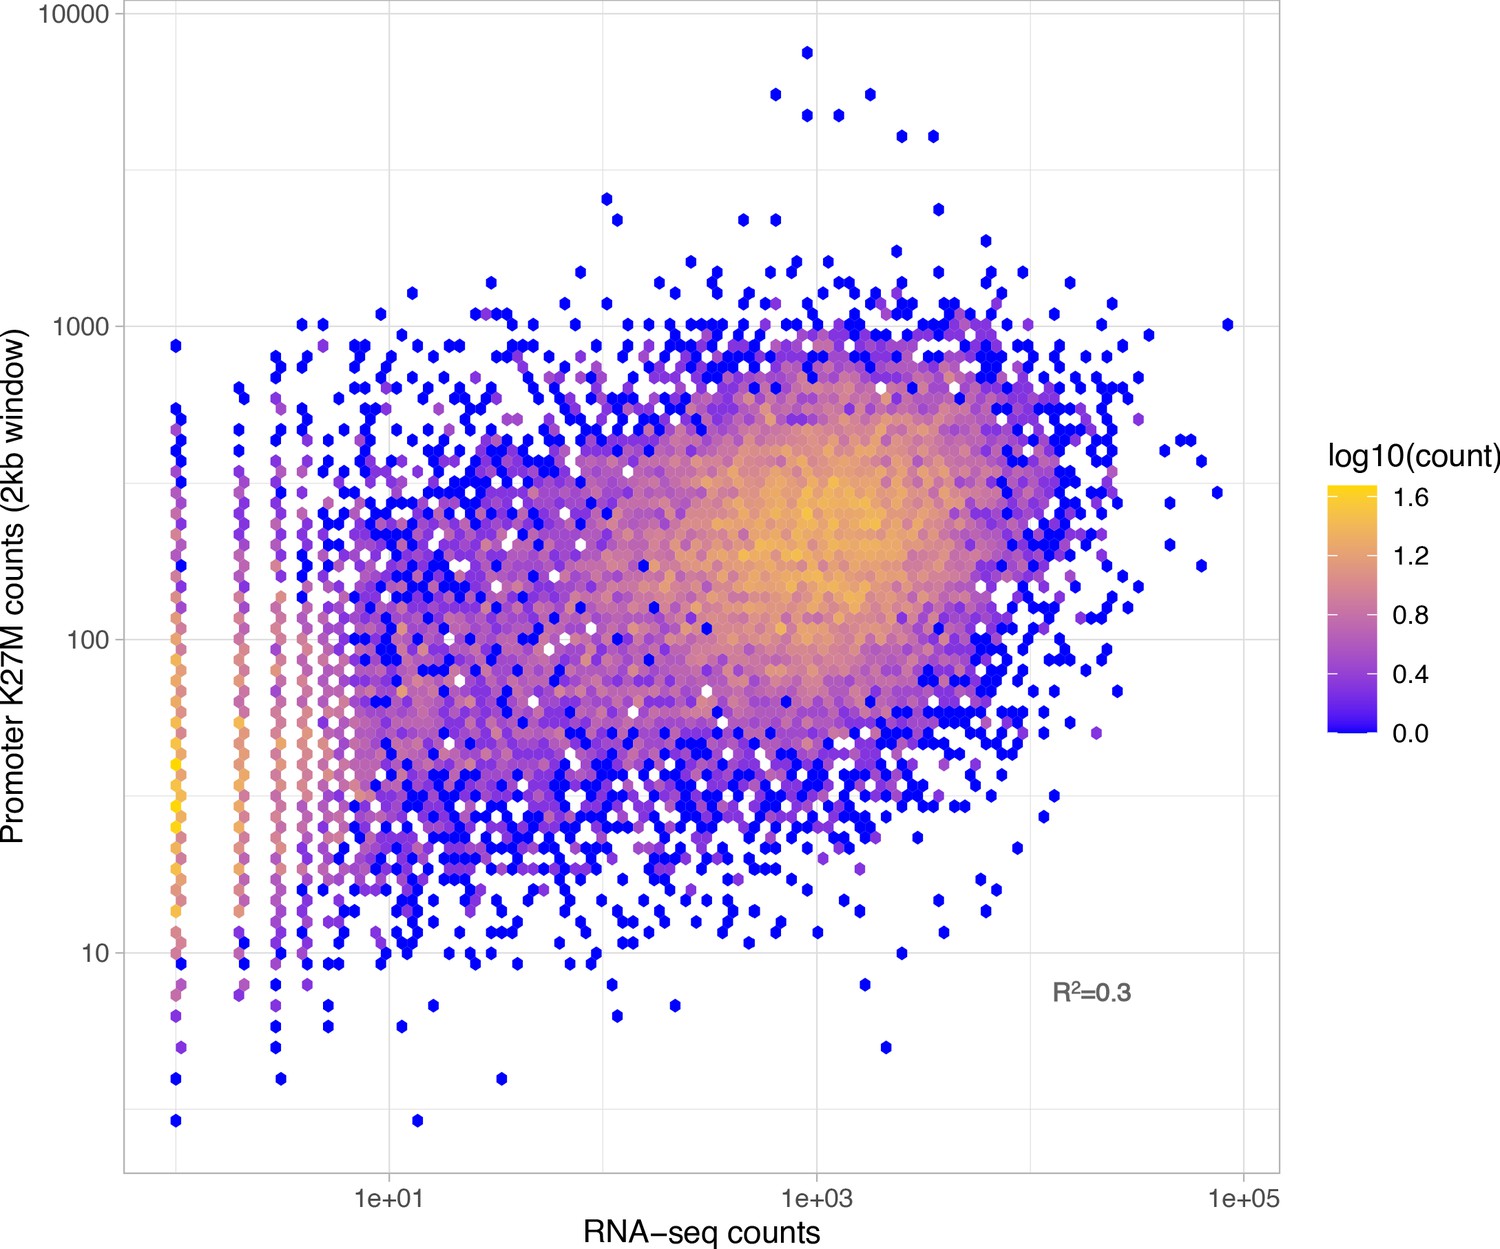
Overlap between RNA-seq signal and H3K27M-enriched regions in the SU-DIPG-XIII cell line.
Figure 4
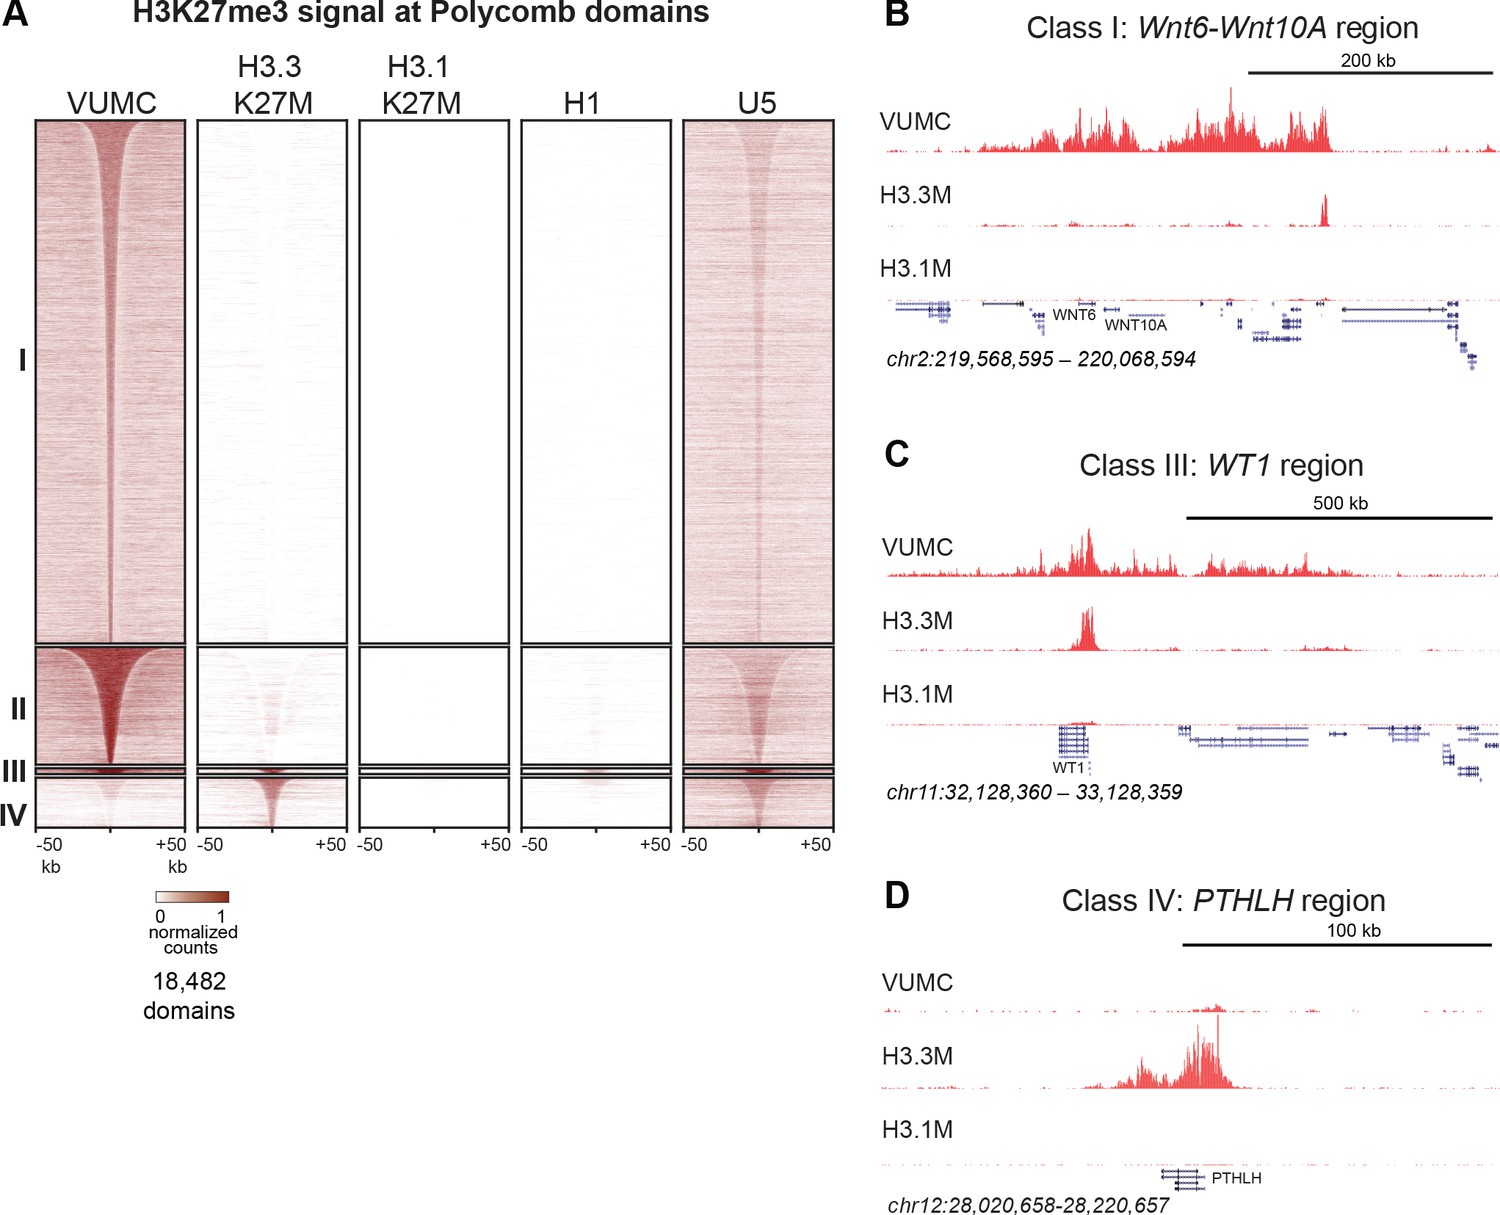
Shared and distinct H3K27me3 domains in K27M histone-expressing cells.
(A) Heat maps of Drosophila normalized H3K27me3 domains in glioma, embryonic stem cell (H1) and neural stem cell (U5) cell lines. Domains that differ between VUMC, H3.3K27M and H3.1K27M cells were selected, and divided into four groups byK-means (k = 4) clustering. H3K27me3 signal across these regions was then plotted for H1 ESC and an NSC lines. Clusters I and II contain domains most enriched in VUMC and NSC lines. Cluster III contains heavily methylated domains that are present in all cell lines examined, although at low absolute levels in H3.1K27M cells. Cluster IV contains domains that are absent in VUMC cells but present to varying degrees in the other lines. (B) H3K27me3 landscape in a Cluster I region (present in VUMC but not in K27M histone mutant gliomas), encompassing the WNT6 and WNT10 oncogenes. (C) H3K27me3 landscape in a Cluster III region (present in VUMC and in H3.3K27M gliomas), encompassing the WT1 tumor suppressor gene. (D) H3K27me3 landscape in a Cluster IV region (absent in VUMC but present in H3.3K27M gliomas), encompassing the PTHLH gene.
Figure 5 with 2 supplements
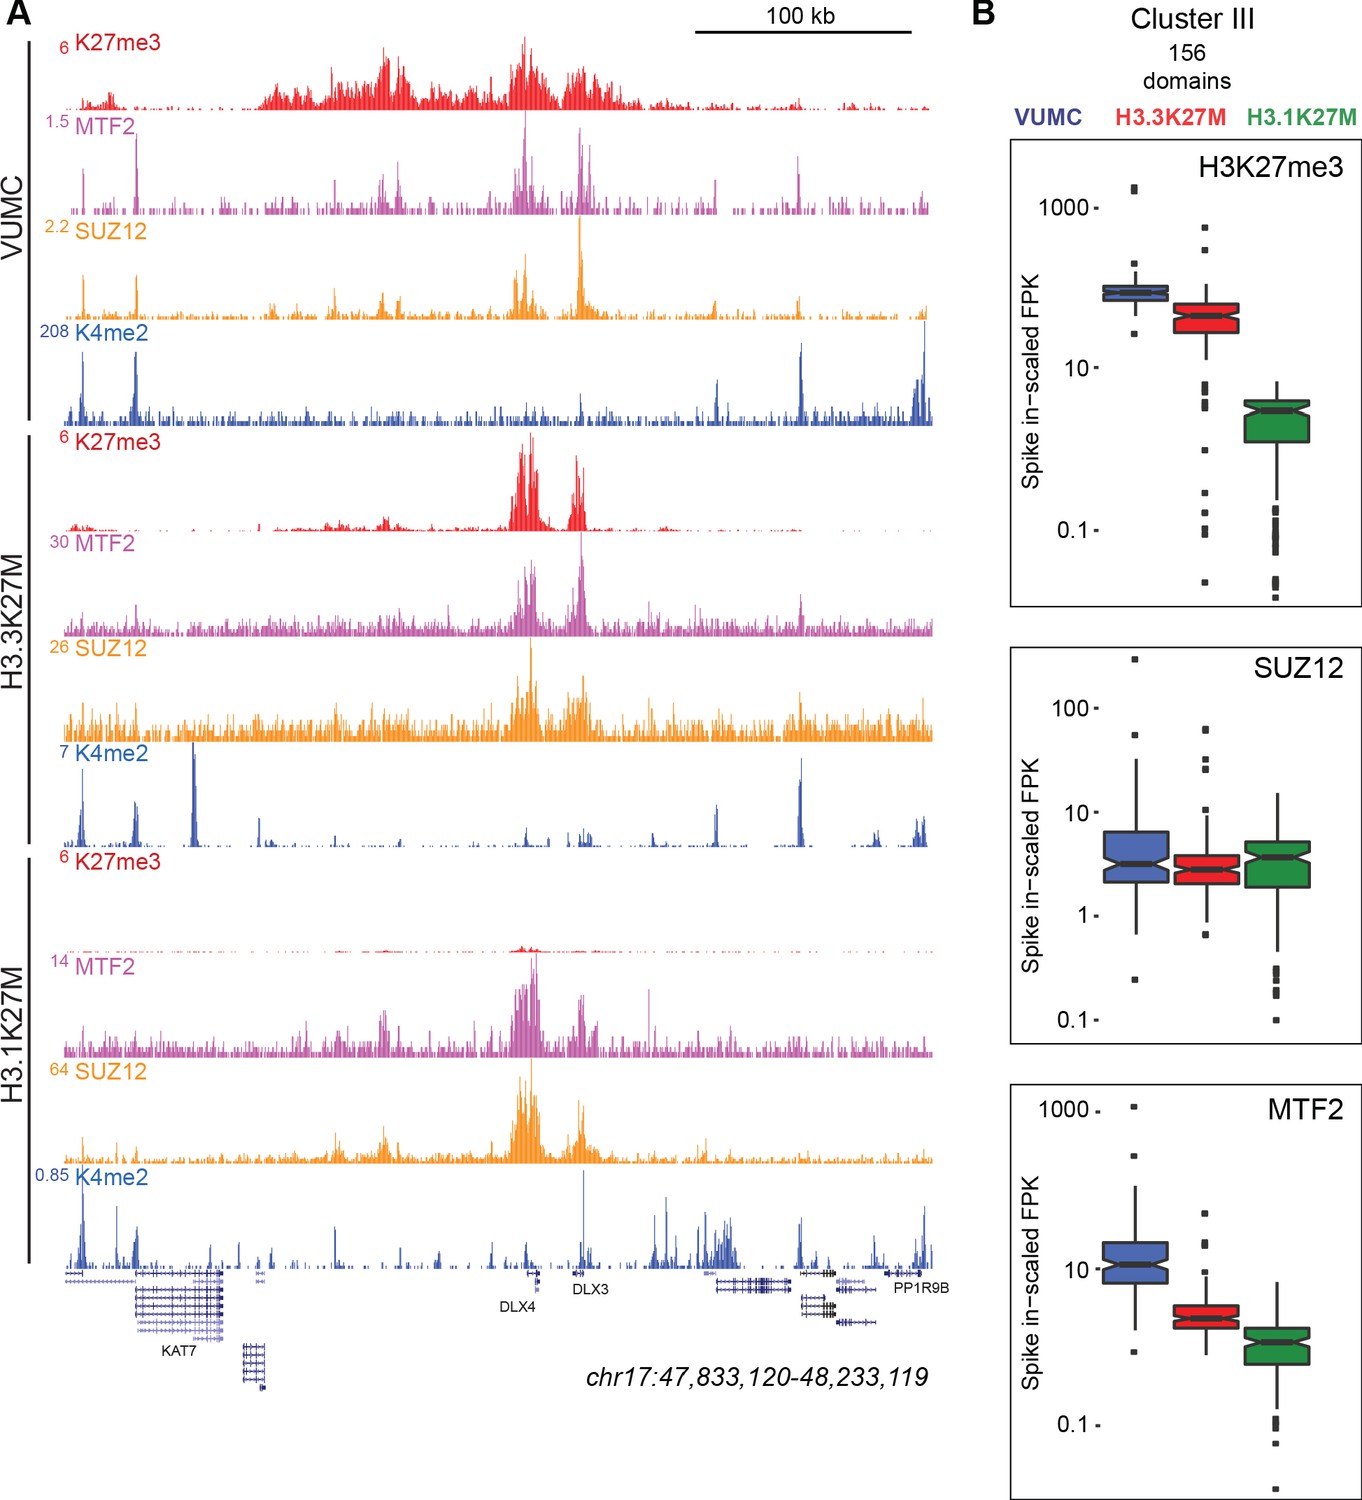
K27M histone-expressing cells maintain PRC2 binding.
(A) Chromatin landscape around the DLX3 gene for H3K27me3, H3K4me2, and Polycomb components in glioma cell lines. All three cell lines display binding of Polycomb components within the H3K27me3 domain (B) Bar-and-whisker plots of H3K27me3, SUZ12, and MTF2 signals in shared Cluster III domains in VUMC, H3.3K27M (XIII), and H3.1K27M (IV) cell lines. H3K27me3 signal is similar between VUMC and H3.3K27M lines, but low in H3.1K27M cells. In contrast, the PRC2 subunit SUZ12 is similarly enriched in all three cell lines at these shared domains, while MTF2 enrichment varies between lines.
Figure 5—figure supplement 1
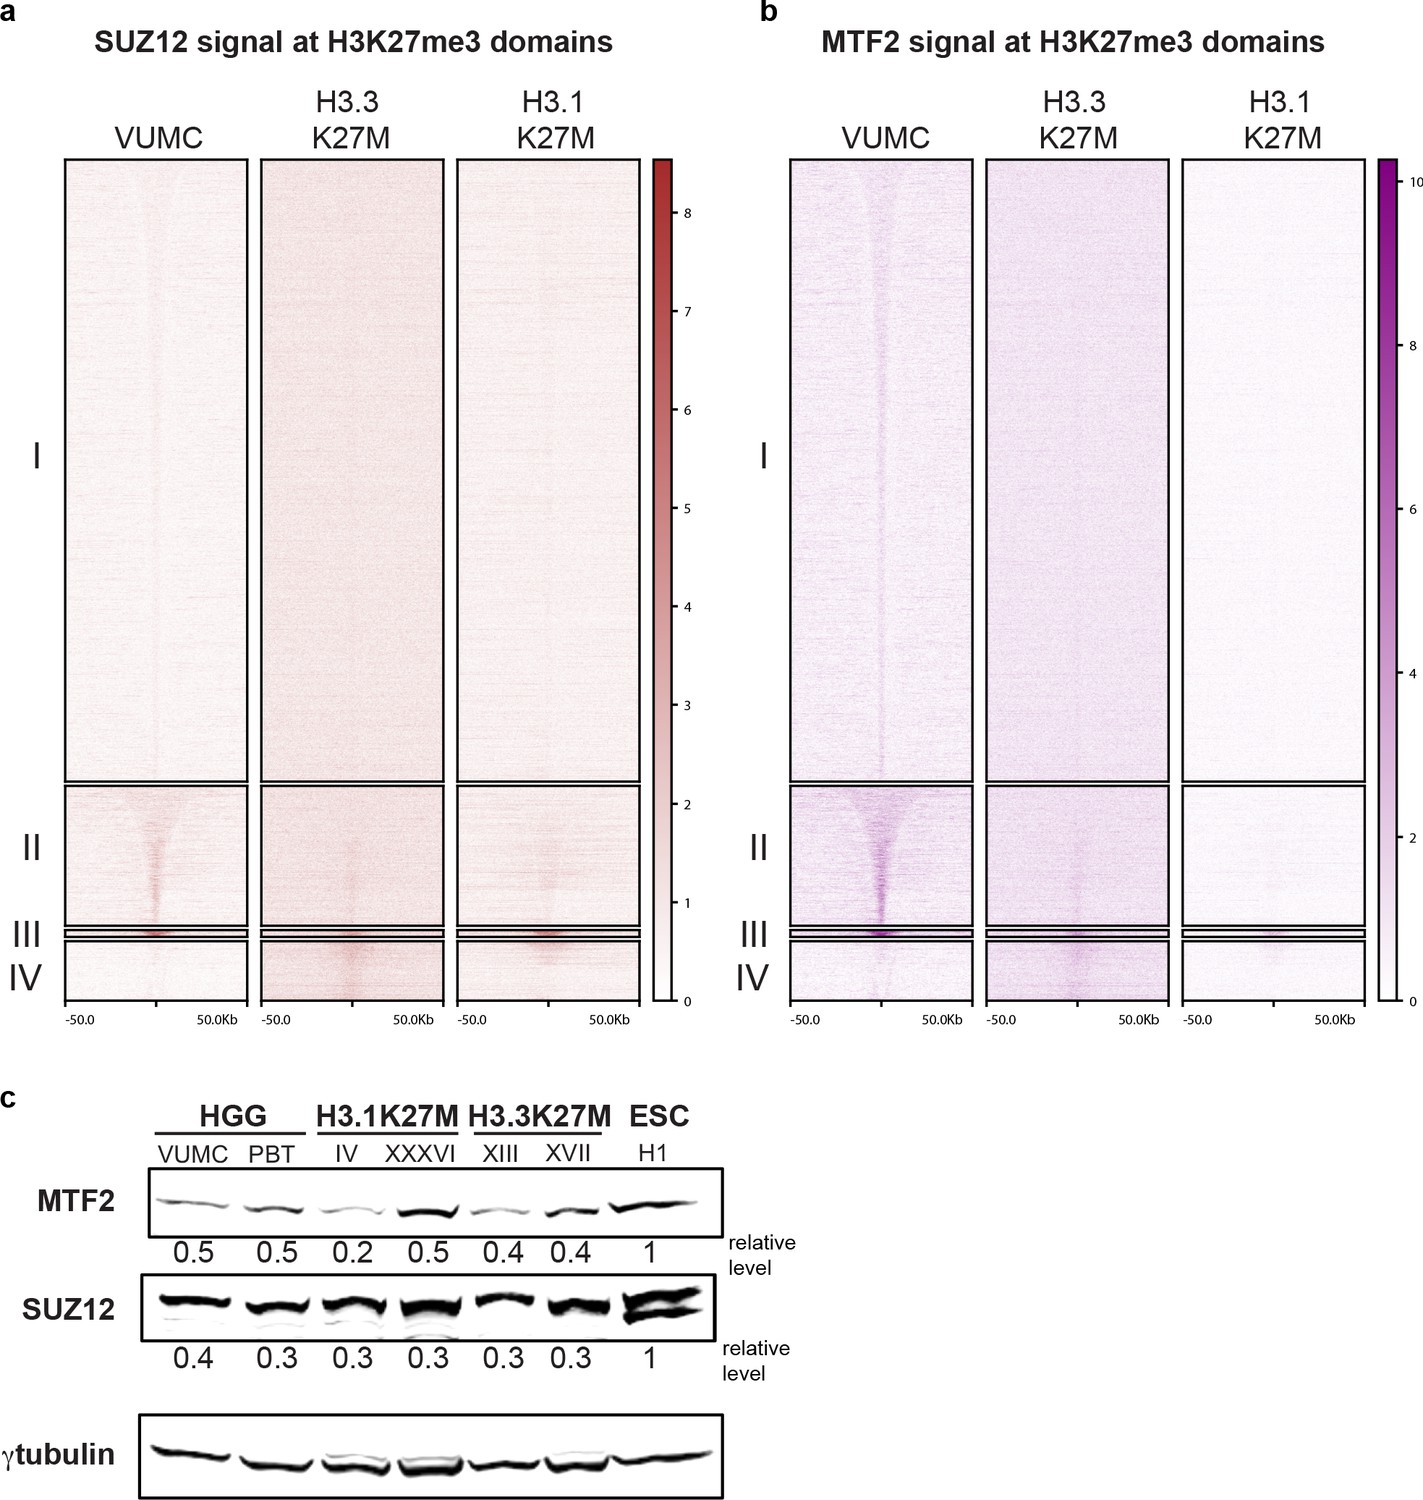
Enrichment of PRC2 in H3K27me3 domains.
(A and B) CUT&RUN signal for SUZ12 (brown, left) or MTF2 (purple, right) in differential H3K27me3 domains defined in Figure 4A. (C) Western detection of PRC2 subunits MTF2 and SUZ12 in glioma cell lines. MTF2 and SUZ12 were normalized to γ-tubulin signal on the same blot. MTF2 and SUZ12 are expressed at similar relative levels across glioma cell lines.
Figure 5—figure supplement 2
Enrichment of PRC2 components at sites of active histone turnover.
Enrichment of K27M (green), SUZ12 (brown), or MTF2 (purple) CUT&RUN signal at indicated regions, scaled by CUT&RUN target. (A and C) Enrichment at promoters ordered by H3K4me2 signal in VUMC (A) or XIII (C). (B and D) Enrichment at PRC2 and K27M peaks in VUMC (B) and XIII (D).
Figure 6
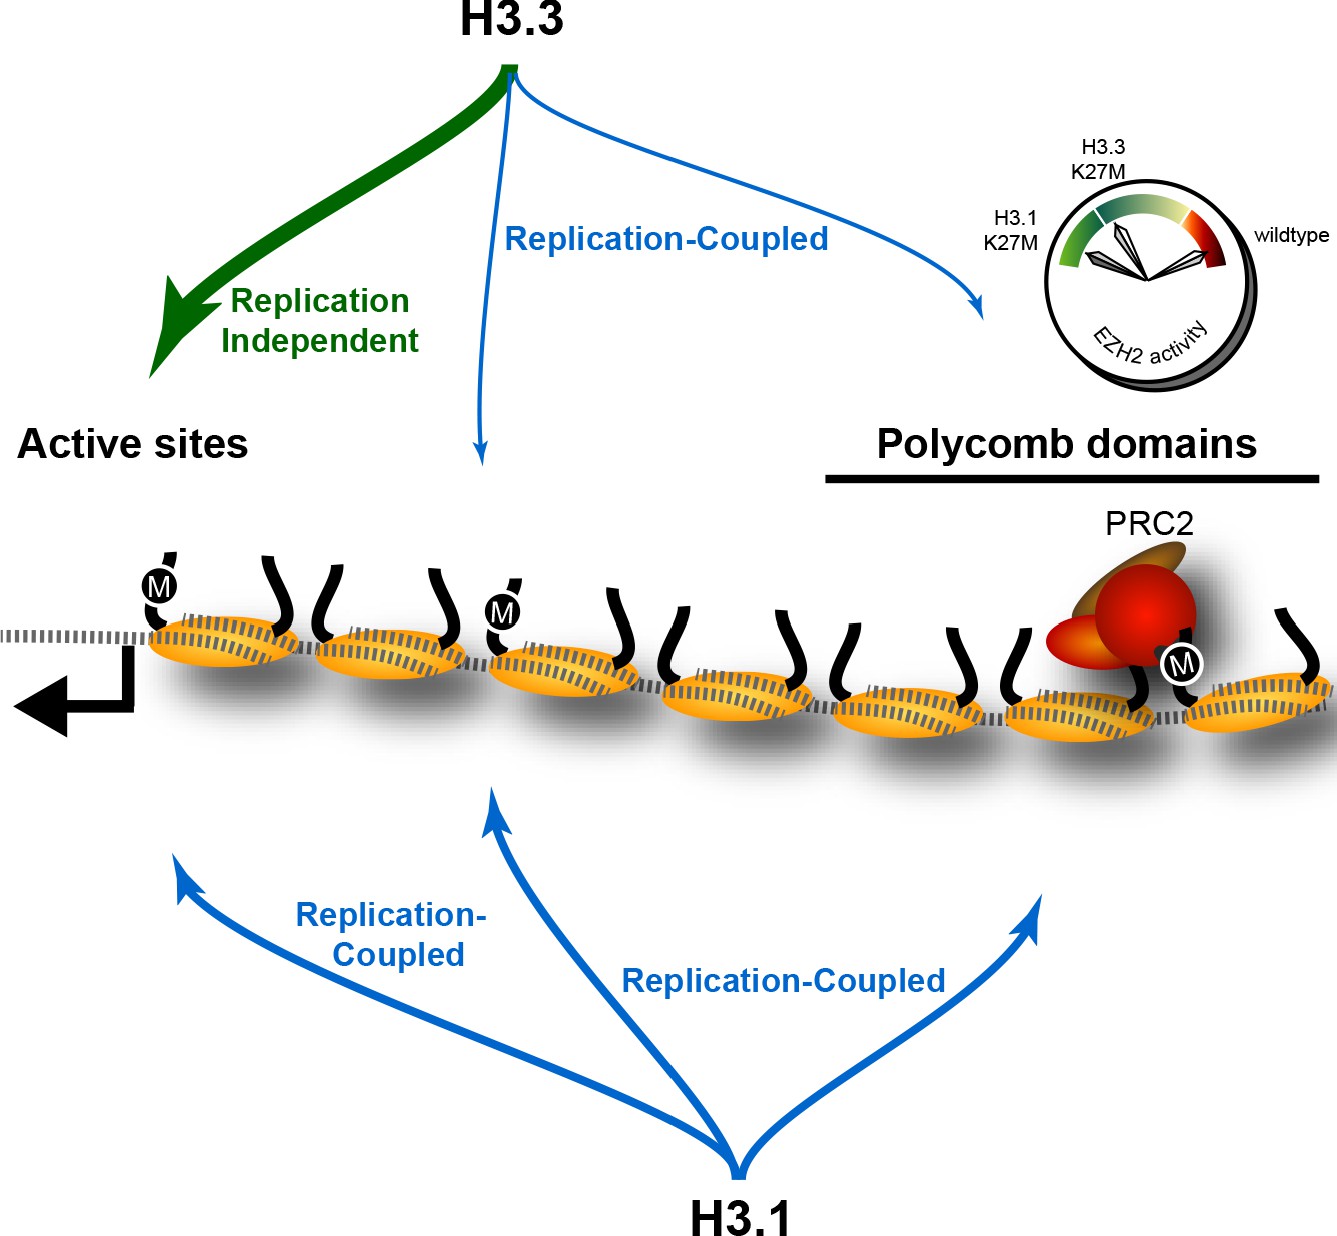
The effect of K27M histones is determined by histone deposition pathways and the distribution of PRC2 complexes on chromatin.
Nucleosomes (yellow) are assembled from new histones by replication-coupled (blue arrows) and replication-independent (green arrow) pathways. Most H3.3 histones are bound by variant-specific chaperones and incorporated at active sites and promoters by replication-independent pathways, but a small amount of H3.3 histones are incorporated during DNA replication throughout the genome. The H3.1 histone is exclusively used for replication-coupled assembly, and so deposited throughout the genome at higher levels. Thus, H3.1K27M mutants incorporate high levels of the K27M (‘M’) epitope in polycomb domains, where it binds and inhibits the histone methyltransferase activity of the PRC2 complex. In contrast, most K27M epitope in H3.3K27M mutants is incorporated at active sites far from polycomb domains, resulting in weaker inhibition of PRC2 in these cells.
Author response image 1
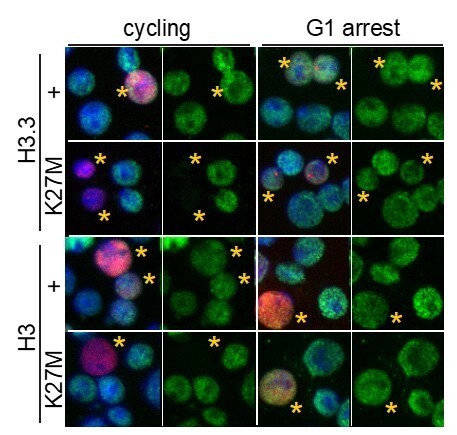
H3K27M fails to inhibit H3K27 trimethylation in G1-arrested cells.
S2 cells were lipofected with heat-shock-inducible epitope-tagged histone (red) constructs and allowed to progress through cell cycles or arrested with mimosine for 24 hrs before construct induction or 1 hr at 37°, and then allowed to recover for 8 hrs at 25°. Cells were fixed and stained with anti-H3K27me3 antibody (green) and DAPI (blue). Nuclei with epitope-tagged histone are marked with a yellow asterisks. H3K27M and H3.3K27M oncohistones inhibit H3K27 trimethylation in cycling cells, but are less inhibitory in mimosine-arrested cells.
Author response image 2

Enrichment of EZH2 in H3K27me3 domains.
CUT&RUN signal for EZH2 (blue) in differential H3K27me3 domains defined in Figure 4A.
Additional files
-
Supplementary file 1
MSExcel spreadsheets of all called peaks and domains from profiling experiments.
- https://cdn.elifesciences.org/articles/61090/elife-61090-supp1-v2.xlsx
-
Supplementary file 2
Gene IDs for H3K27M-enriched peaks from H3K27M performed in H3.3K27M-mutant DMG cell lines.
- https://cdn.elifesciences.org/articles/61090/elife-61090-supp2-v2.xlsx
-
Supplementary file 3
Sequencing read counts for each profiling experiment.
- https://cdn.elifesciences.org/articles/61090/elife-61090-supp3-v2.xlsx
-
Supplementary file 4
Gene Ontology term analysis for genes overlapped by differential H3K27me3 domains in Cluster IV.
- https://cdn.elifesciences.org/articles/61090/elife-61090-supp4-v2.xlsx
-
Supplementary file 5
Oncoplex sequencing results of the H3K27M-positive high grade glioma cell lines.
- https://cdn.elifesciences.org/articles/61090/elife-61090-supp5-v2.xlsx
-
Transparent reporting form
- https://cdn.elifesciences.org/articles/61090/elife-61090-transrepform-v2.pdf
Download links
A two-part list of links to download the article, or parts of the article, in various formats.
Downloads (link to download the article as PDF)
Open citations (links to open the citations from this article in various online reference manager services)
Cite this article (links to download the citations from this article in formats compatible with various reference manager tools)
Histone deposition pathways determine the chromatin landscapes of H3.1 and H3.3 K27M oncohistones
eLife 9:e61090.
https://doi.org/10.7554/eLife.61090


