Optogenetic inhibition-mediated activity-dependent modification of CA1 pyramidal-interneuron connections during behavior
- Institute of Science and Technology Austria (IST Austria), Austria
Figures
Figure 1 with 1 supplement
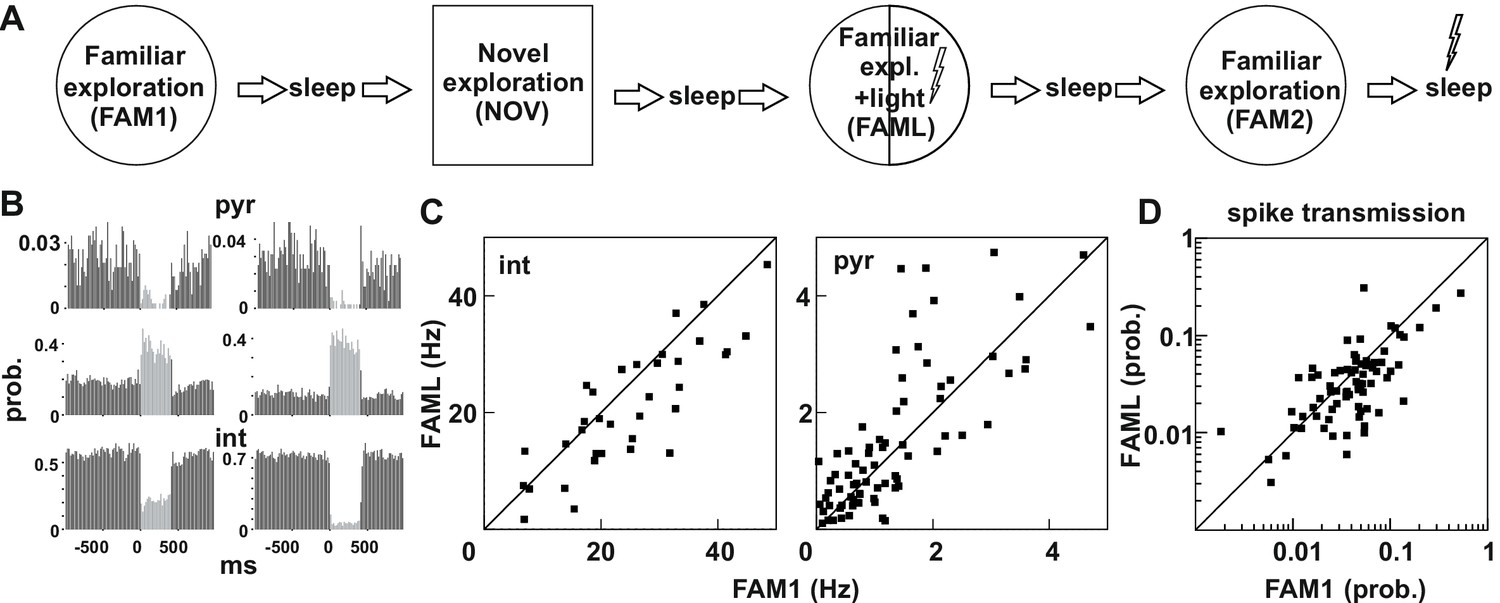
Light-induced firing changes in the CA1 region by halorhodopsin-mediated inhibition of a subgroup of pyramidal cells and interneurons.
(A) Experimental paradigm: on each recording day the animal was exposed three times to the same familiar environment (FAM1, FAML, and FAM2), including one session in which light stimulation was triggered (FAML) as the animal explored a defined sector of the environment (1/3 – ½ of the arena). In addition, the animal also explored a novel environment (NOV). Each behavioral session was flanked by sleep, with 500 ms light pulses given in the last. (B) examples of cells in which light application suppressed activity and triggered an elevated rate, through disinhibition. int, interneuron; pyr, pyramidal cells. Light responses were measured during the last rest session by applying 500 ms test light pulses. The histograms show the probability of spiking within the 20 ms time bins. (C) The mean firing rate of the postsynaptic interneurons (left) and presynaptic pyramidal cells (right) that were part of a detected monosynaptic cell pair were plotted during FAM1 vs. FAML sessions. Lines represent the x = y line. Note that the majority of interneurons were inhibited by the light, whereas several pyramidal cells exhibited either prominent suppression or excitation of their rate. (D) Monosynaptic spike transmission probabilities also exhibit alterations during the FAML session with more cell pairs showing a reduction of spike transmission probabilities relative to FAM1.
Figure 1—figure supplement 1
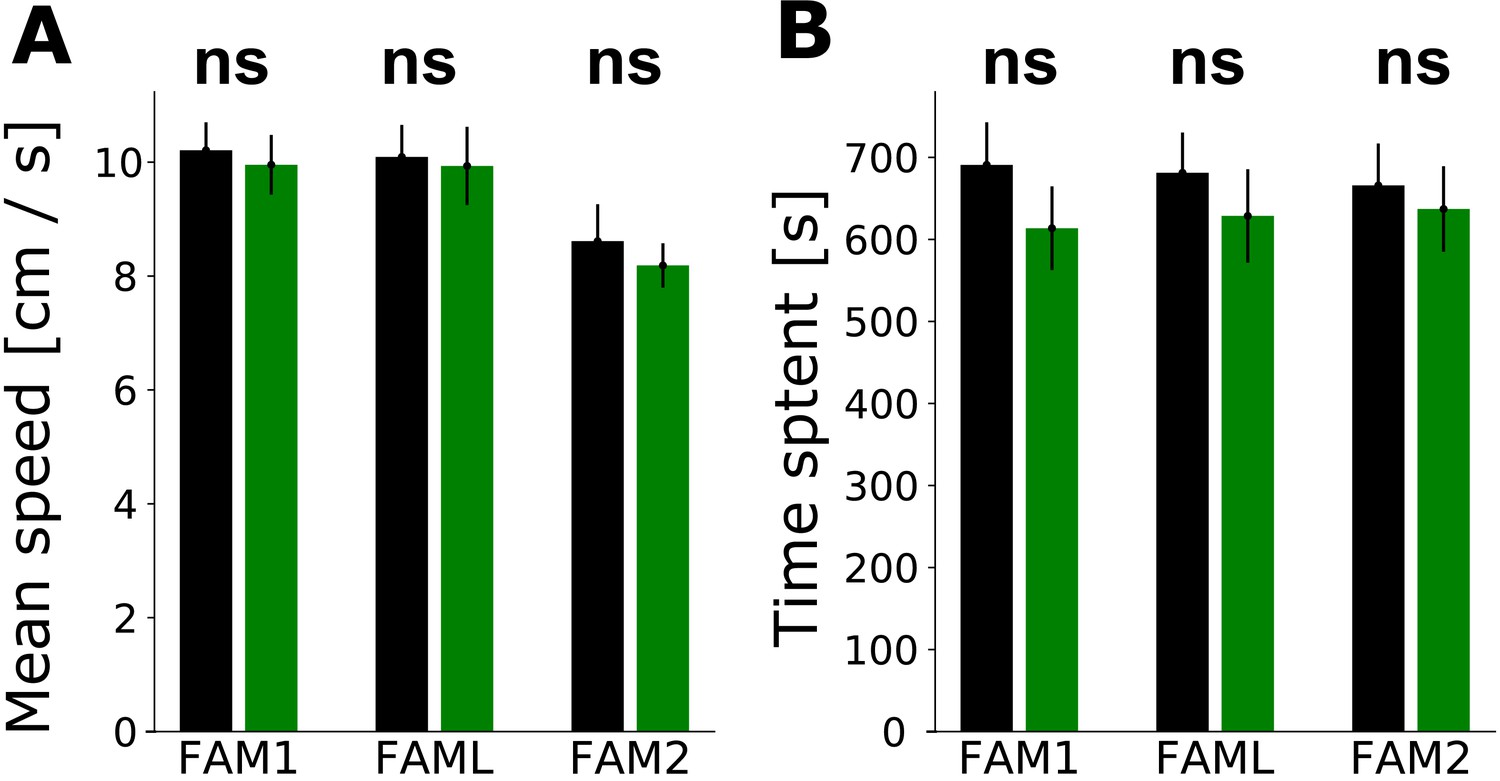
Effect of light application on the behavior of animals.
Influence of light application on the behavior of the animal in familiar environment sessions: FAM1, FAML,and FAM2. A: Mean (± SEM) speed of animal in light sector vs. the rest of the environment. B: Time that animal spent in the light sector vs. rest of the environment (mean ± SEM).
Figure 2
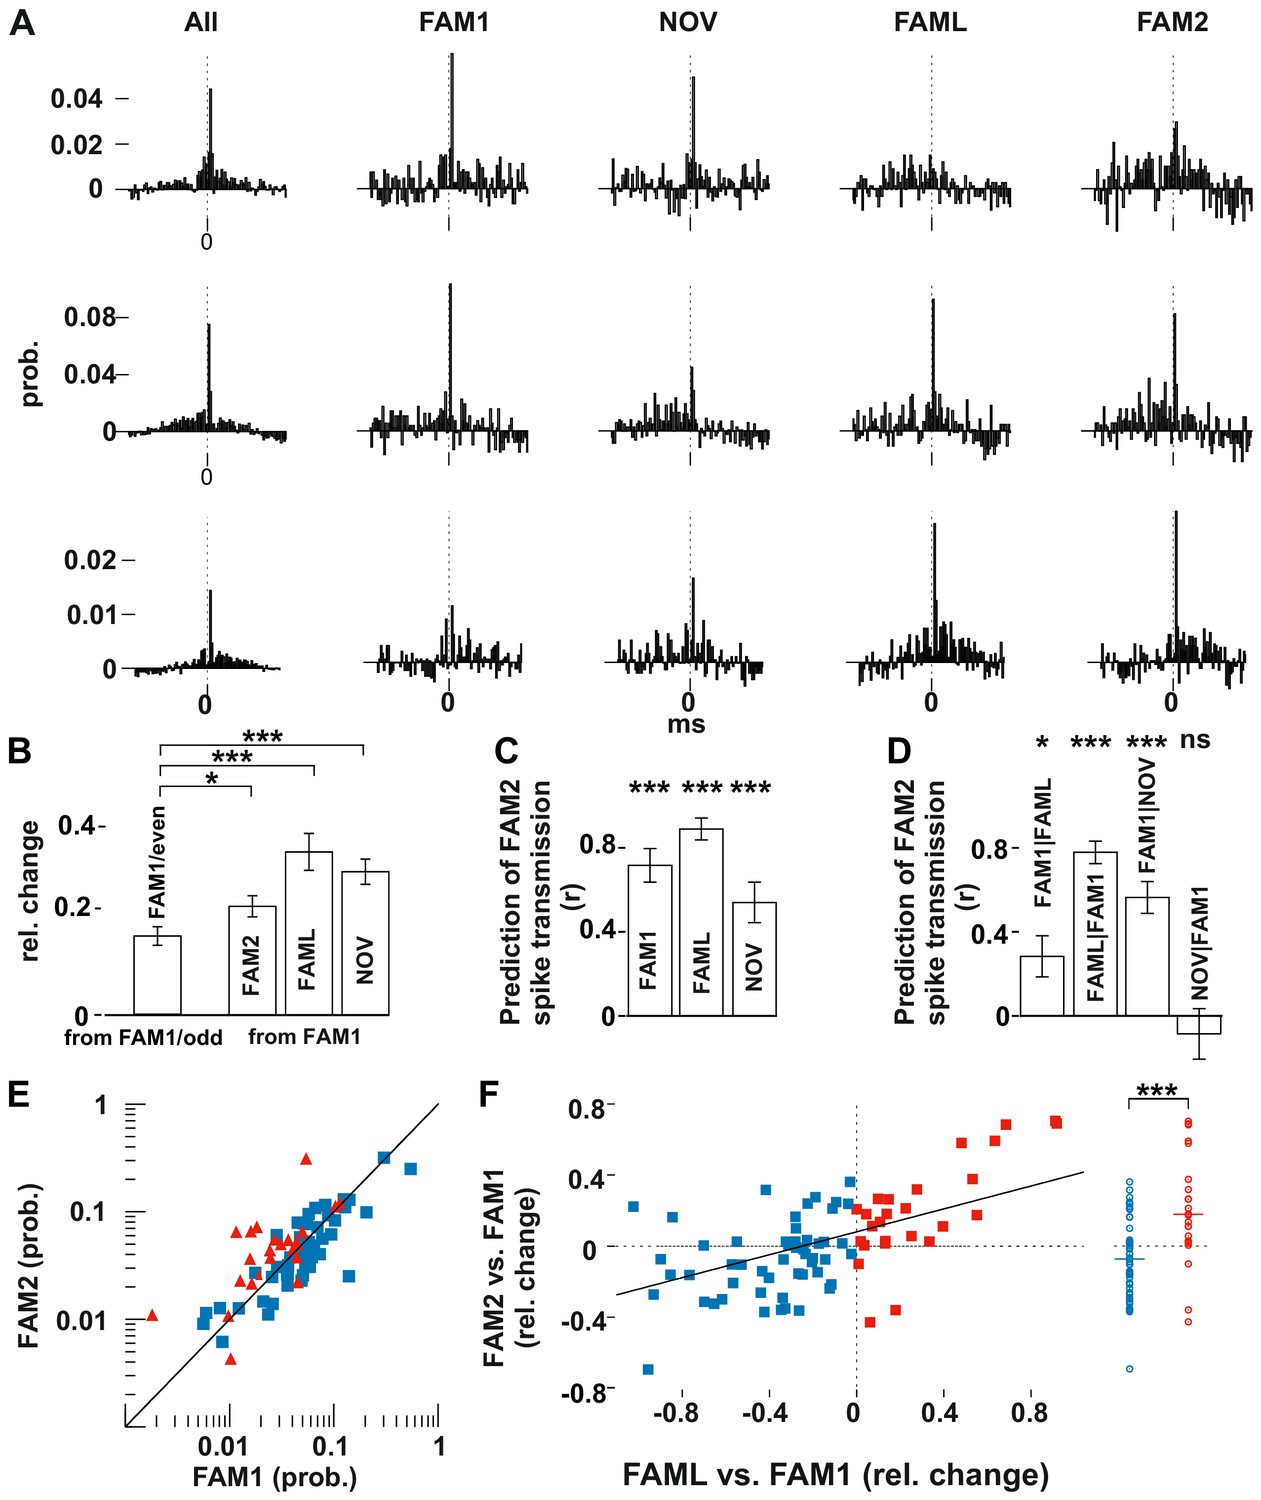
Light application triggered lasting changes in spike transmission probabilities in the same environmental context.
(A) Representative examples of monosynaptic cross-correlations demonstrating altered spike transmission probabilities across different sessions. Left histograms show the cross-correlations calculated during the entire recording session (all), which were used to detect the monosynaptic pairs. The remaining histograms show the cross-correlations at different sessions. Chance joint firing probability was estimated by the average cross-correlation values in the ±10–50 ms bins and subtracted. Each bin represents a 1 ms time windows in [−50 ms, +50 ms] intervals. (B) Mean (± SEM) absolute difference of spike transmission probabilities, measured as relative change (difference/sum) between the odd- and even-numbered 5 s intervals of the FAM1 session and between FAM1 and other sessions. Mean (± SEM) absolute difference of spike transmission probabilities, measured as relative change (difference/sum), relative to the first FAM1 session. Note the significant reorganization of the spike transmission probabilities across all sessions, with FAM2-FAM1 being the weakest. *p=0.0268, ***p<0.0001. (C) Prediction (i.e., correlation) of transmission probabilities in FAM2 with those in the previous exploration sessions ***p<0.0001. (D) Partial correlations to illustrate the influence of each session on FAM2, while removing the effect of other behavioral sessions. Note that the linear mixed model comparison analysis showed that the NOV session did not influence FAM2 spike transmission when the FAM1 spike transmissions were taken into consideration, whereas FAM1 did influence FAM2. Significance for linear mixed model comparison is indicated. *p=0.0105, ***p<0.0001, ns not significant. (E) Spike transmission values plotted in the FAM1 and FAM2 sessions. Cell pairs that increased (red) and decreased (blue) their spike transmission in the FAML relative to FAM1 are displayed separately. Diagonal line: x = y. (F) Relative (difference/sum) changes of spike transmission probabilities between FAML-FAM1 predict those of FAM2-FAM1 changes. The relative FAM2-FAM1 changes of cell pairs with reduction (blue) and increase (red) in spike transmission from FAM1 to FAML are also displayed along a single line on the right to illustrate the negative and positive bias of these groups. The solid diagonal line represents the regression line for the data. Horizontal line: median.
Figure 3
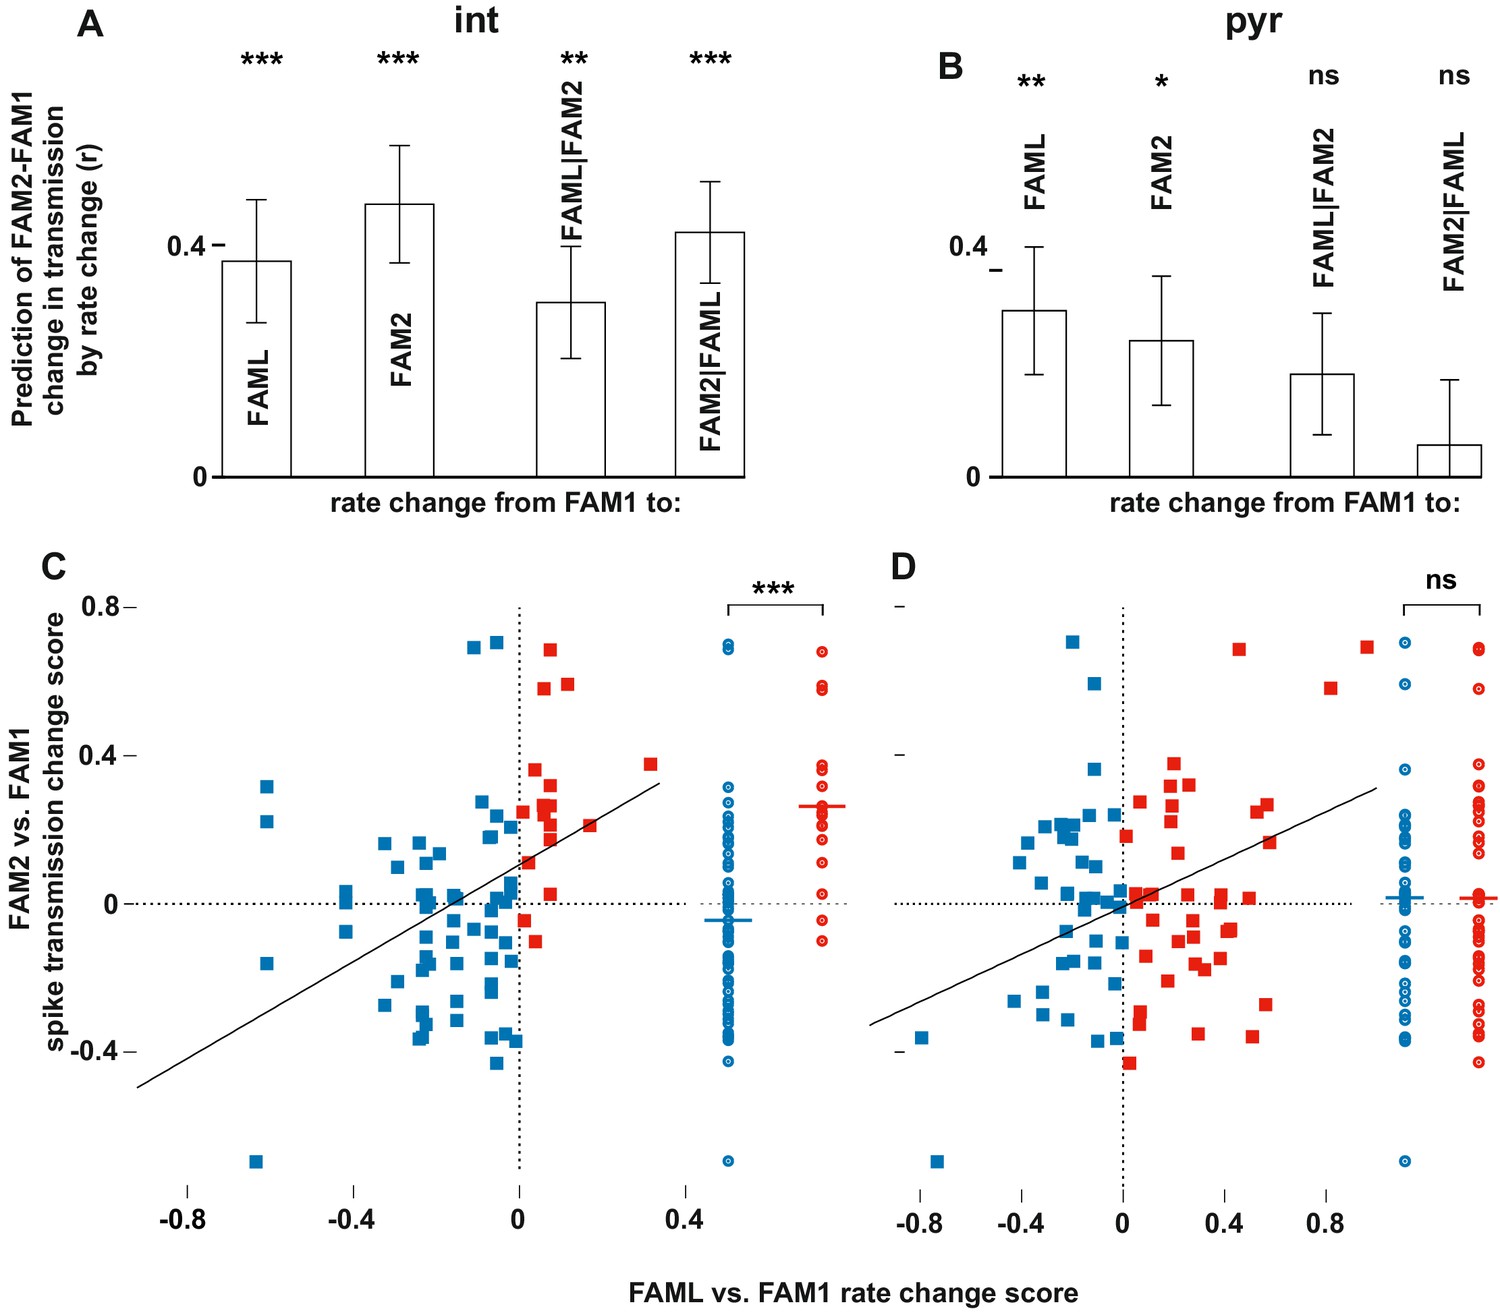
Light-induced firing rate changes of interneurons but not pyramidal cells influenced lasting familiar environment-associated spike transmission alterations between before and after the light application session.
The relative changes in rate and transmission probabilities are expressed as a score throughout (difference/sum). The influence of light-induced firing rate changes on spike transmission alterations between before and after the light application session. The relative changes in rate and transmissionprobabilities are expressed as a score throughout (difference/sum). (A) The correlation predicts relative FAM2-FAM1 spike transmission changes based on relative rate changes of FAML-FAM1 and FAM2-FAM1 sessions. Both correlations (left) and partial correlations (right) are shown. The comparisons of linear mixed models with one or both rate change variables show that interneuron rates in both FAML and FAM2 independently influence FAM2-FAM1 spike transmission changes. (B) same as (A) but for pyramidal cells. In this case, FAML but not FAM2 rates independently predict FAM2-FAM1 spike transmission changes. (C) Relative FAML-FAM1 rate change of interneurons versus the relative spike transmission probability changes (FAM2-FAM1) with their presynaptic pyramidal partner. Right plots spike transmission changes were plotted for the rate decrease (blue) and increase (red) pairs. Horizontal lines: median. Note that almost all pairs that exhibited an interneuron rate increase during FAML also increased their spike transmission in FAM2 and the rate decrease group exhibited a significantly smaller spike transmission change than the rate increase group. (D) Same as (C) but for pyramidal rate changes. Here the direction of rate change does not predict spike transmission changes. *p<0.0256, **p<0.0068, ***p<0.0001, ns not significant.
Figure 4
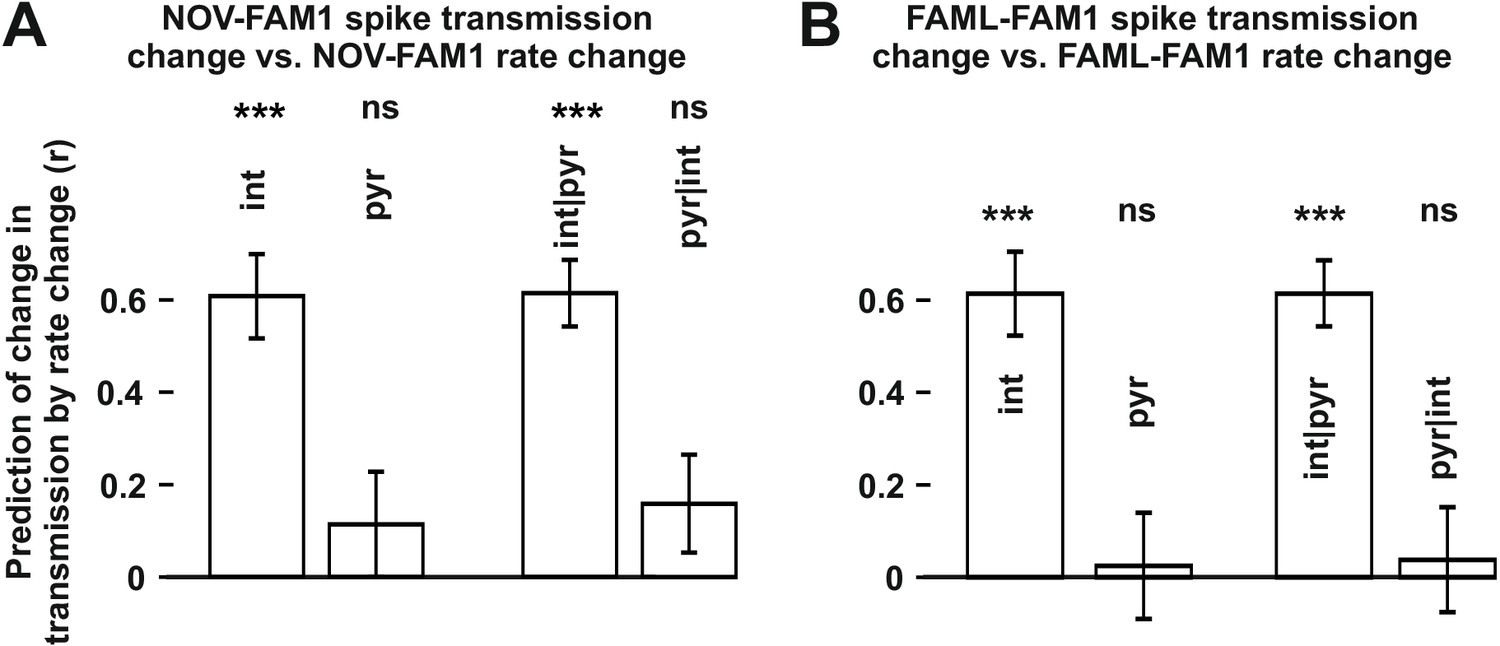
The influence of interneuron rate change on spike transmission changes in the NOV and FAML sessions, relative to FAM1.
(A) Left: correlation of pyramidal and interneuron relative rate changes (NOV-FAM1) and the corresponding relative spike transmission changes. Partial correlations are also shown on the right. In both cases, interneuron rate changes predict the corresponding spike transmission changes but not pyramidal cells according to linear mixed model comparison. (B) same as (A) but comparing FAML-FAM1. Interneuron rate changes had a strong influence on spike transmission changes. All relative rates and transmission changes are measured as difference/sum. ***p<0.0001, ns not significant.
Figure 5
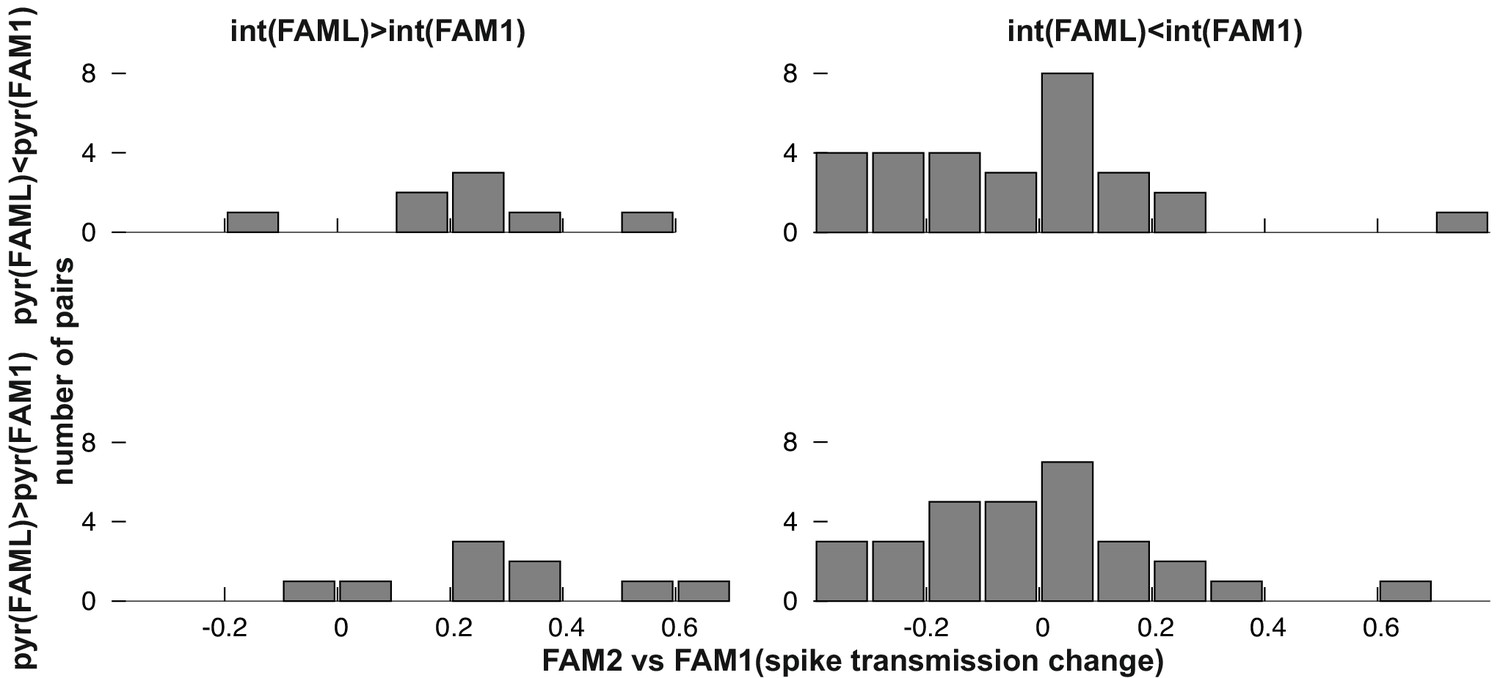
Frequency distribution of relative FAM2-FAM1 spike transmission changes for monosynaptic cell pairs according to the direction of change of the pre- and postsynaptic cell partner.
Figure 6
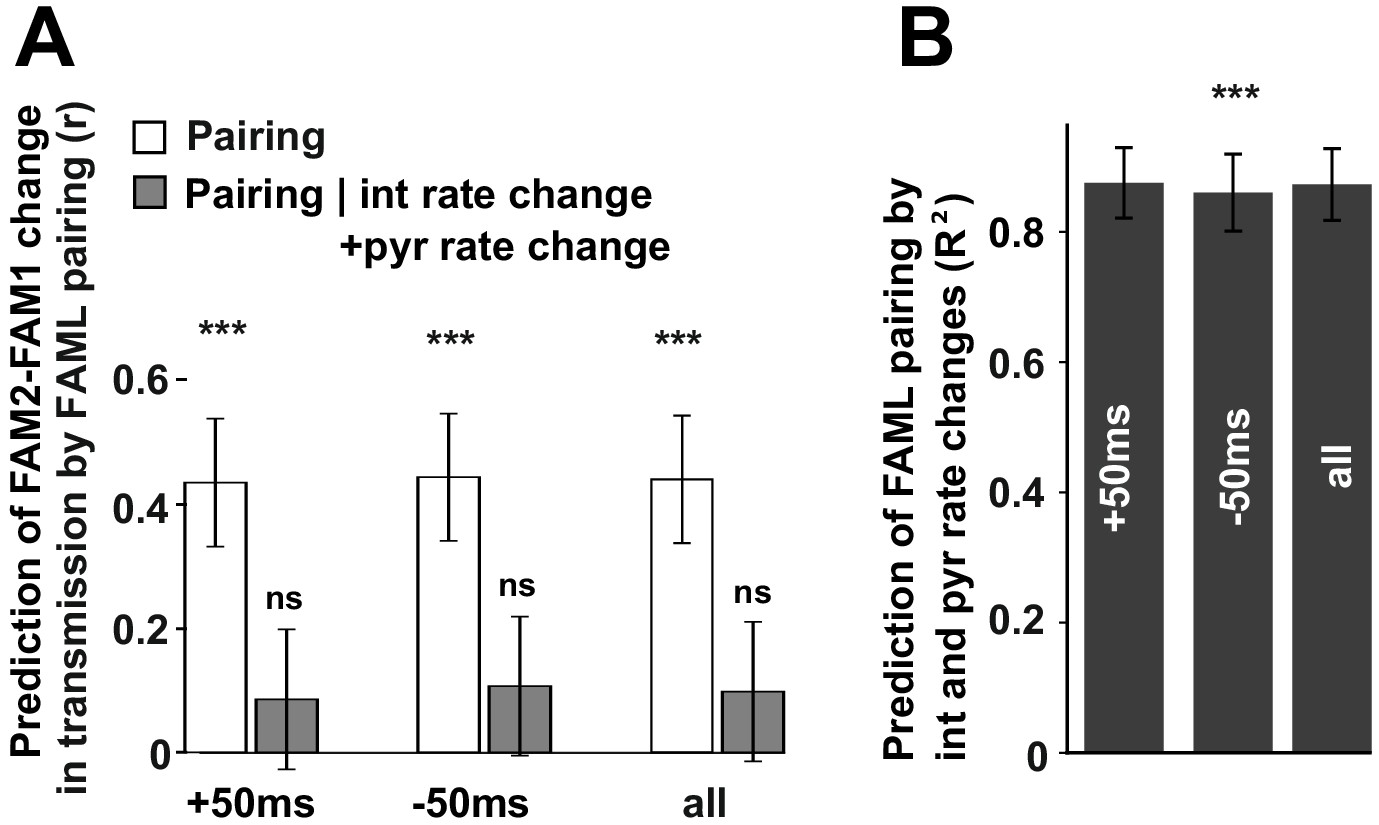
The influence of pyramidal cell-interneuron pairing on spike transmission changes.
(A) The number of pairing events in FAML predicted FAM2-FAM1 spike transmission changes. The number of spike pairing events were measured in cases when interneuron spike followed by pyramidal spike within 50 ms (+50 ms) and those where it preceded that (−50 ms) and the sum of both events (all). The relative difference (difference divided by the sum) of pairing event numbers between FAML and FAM1 was calculated. Pairing change predicted with relative spike transmission change (difference divided by the sum, unfilled white histograms on the left panels). We also examined whether the light-induced interneuron and pyramidal firing rate changes that itself altered the number of pairing events alone can explain this prediction. The number of pairing events no longer predicted spike transmission changes when both pyramidal and interneuron rate changes were taken into account according to the linear mixed model comparison. (B) Change in the number of spike pairing events strongly predicted the change in interneuron and pyramidal firing rates. R2 values and their 95% confidence intervals are plotted. ***p<0.00099, ns not significant.
Tables
Key resources table
| Reagent type (species) or resource | Designation | Source or reference | Identifiers | Additional information |
|---|---|---|---|---|
| Strain, strain background (Rattus norvegicus) | Long-Evans Rats | Janvier, France | RRID:RGD-631593 | |
| Recombinant DNA reagent (Rattus norvegicus) | AAV2/1.CAMKII.ArchT.GFP.WPRE.SV40 | Penn Vector Core | RRID:Addgene: 26971-AAV1 | |
| Transfected construct | AAV2/1.CaMKIIα::eNpHR3.0-YFP | Penn Vector Core | RRID:Addgene: 99039-AAV1 | |
| Software, algorithm | Python | Python | RRID:SCR_008394 https://www.python.org | |
| Software, algorithm | LFP Online | GtiHub | https://github.com/igridchyn/lfp_online | |
| Other | 12 um tungsten wires | California Fine Wire | M294520 | |
| Other | Headstage amplifier | Axona, St. Albans, UK | http://www.axona.com |
Additional files
Download links
A two-part list of links to download the article, or parts of the article, in various formats.
Downloads (link to download the article as PDF)
Open citations (links to open the citations from this article in various online reference manager services)
Cite this article (links to download the citations from this article in formats compatible with various reference manager tools)
Optogenetic inhibition-mediated activity-dependent modification of CA1 pyramidal-interneuron connections during behavior
eLife 9:e61106.
https://doi.org/10.7554/eLife.61106


