Feeding state functionally reconfigures a sensory circuit to drive thermosensory behavioral plasticity
- Department of Biology, Brandeis University, United States
- Department of Organismic and Evolutionary Biology, Center for Brain Science, Harvard University, United States
Figures
Figure 1 with 2 supplements
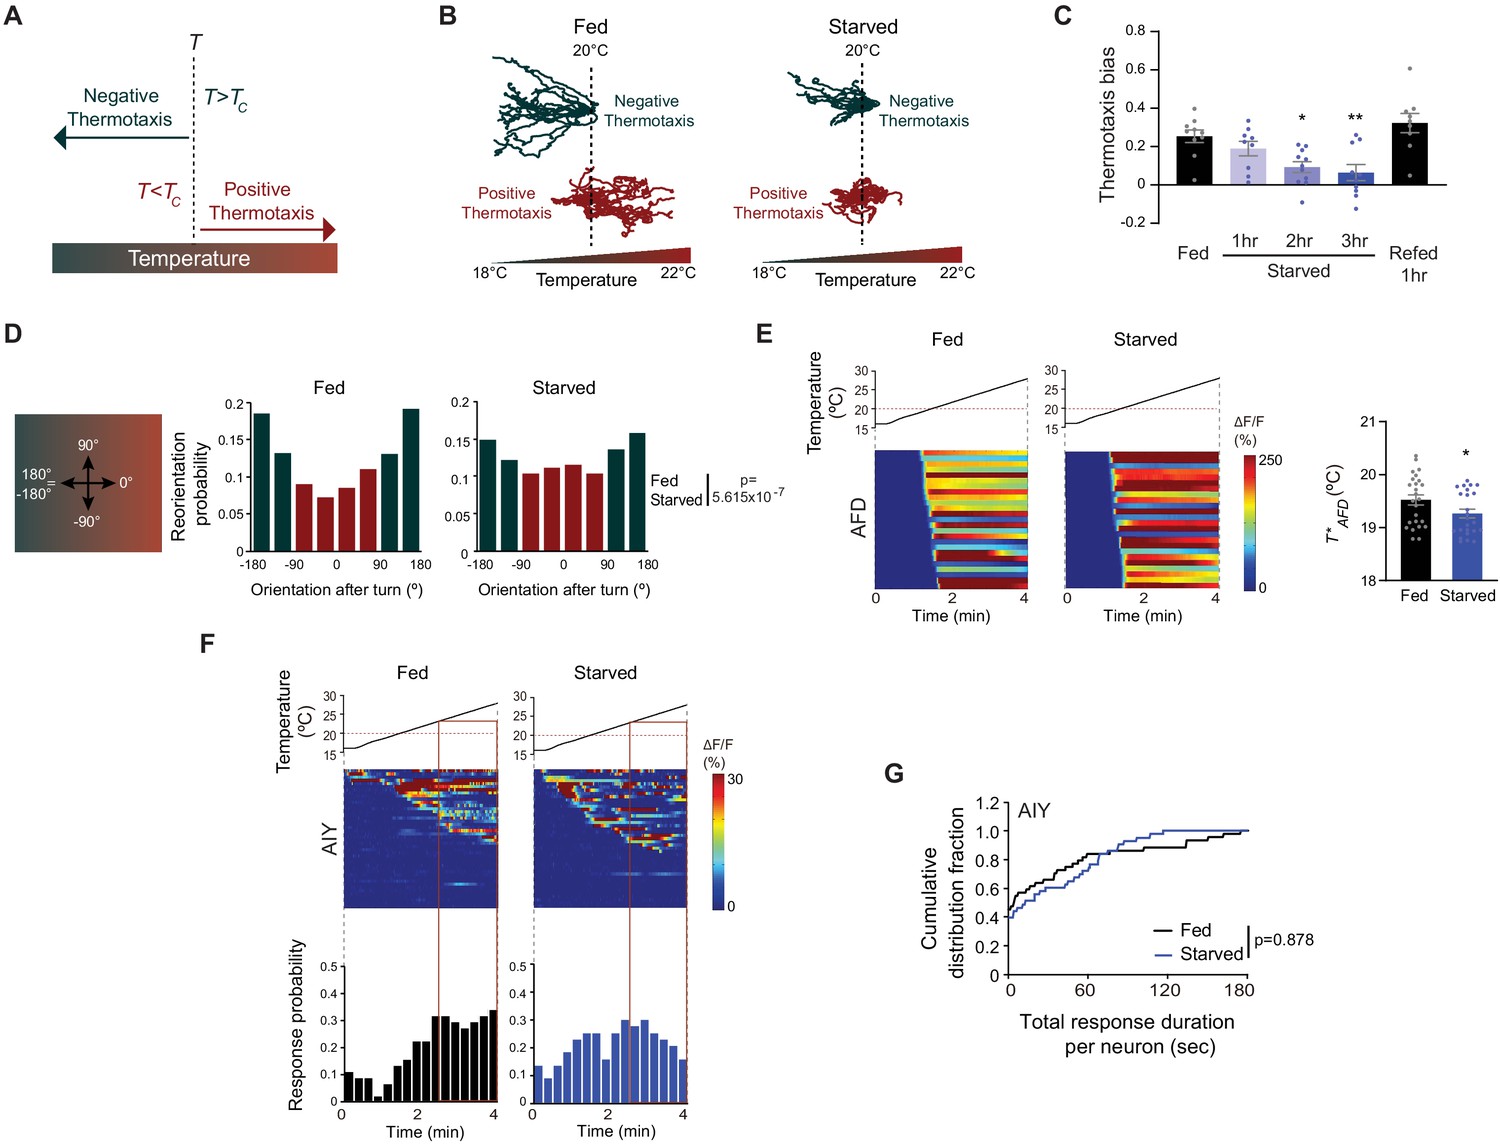
Starvation disrupts negative thermotaxis but does not affect temperature responses in AFD and AIY.
(A) Schematic of experience-dependent thermotaxis behavior of C. elegans (Hedgecock and Russell, 1975). T: starting temperature on gradient; Tc = cultivation temperature 3–4 hr prior to assay. Warm and cool temperatures are indicated in red and green, respectively. (B) Tracks of individual worms on a long linear thermal gradient from a single representative assay of ~15 animals each. Worms were cultivated at 15°C or 25°C for negative (green tracks) or positive (red tracks) thermotaxis assays, respectively, with (fed) or without (starved) bacterial food for 3 hr prior to assay. Dashed lines indicate the temperature (20°C) at which animals were placed at the start of the assay. Tracks were superimposed post analysis for presentation. (C) Mean thermotaxis bias of animals subjected to the indicated feeding conditions on a short thermal gradient. Thermotaxis bias was calculated as (run duration toward colder side – run duration toward warmer side)/total run duration. Each dot represents the thermotaxis bias of a biologically independent assay comprised of 15 animals. Errors are SEM. * and ** indicates different from fed at p<0.05 and p<0.01, respectively (ANOVA with Tukey’s multiple comparisons test). (D) (Left) Schematic of track orientation on a linear thermal gradient. Orientation parallel to the gradient toward warm temperatures is 0°, orientation orthogonal to the gradient is 90° or −90°, and orientation parallel to the gradient toward cold temperatures is 180° or-180°. (Right) Histograms of movement orientation following a turn. Tracks from 8 assays of 15 animals each were categorized into bins of 45°. Red and green bars indicate orientation toward the warmer/orthogonal or cooler side, respectively. The p-value was derived using the Mardia-Watson-Wheeler non-parametric test for circular data. (E) (Left) Intracellular calcium dynamics in AFD expressing GCaMP6s in response to a linear rising temperature stimulus (black lines) at 0.05 °C/s. Red dashed line indicates cultivation temperature of 20°C. Each row in the heatmaps displays responses from a single AFD neuron from different animals ordered by the time of the first response; n = 25 (fed) and 24 (starved). (Right) Mean T*AFD of fed and starved animals calculated from data shown in heatmaps at left. Each dot is the T*AFD of a single neuron. Errors are SEM. * indicates different from fed at p<0.05 (Student’s t-test). (F) (Top) Intracellular calcium dynamics in AIY expressing GCaMP6s in response to a linear rising temperature stimulus (black lines) at 0.05 °C/s. Red dashed line indicates cultivation temperature of 20°C. Each row in the heatmaps displays responses from a single neuron from different animals ordered by the time of the first response; n = 44 (fed) and 43 (starved). (Bottom) Each bar in the histograms represents the proportion of neurons responding during 15 s bins. The behavioral temperature range of 23–28°C is indicated by vertical solid lines. (G) Cumulative distribution fraction plots of total duration of calcium responses per AIY neuron calculated from data shown in F. Distributions were compared using the Kolmogorov-Smirnov test. Also see Figure 1—figure supplement 1 and Figure 1—figure supplement 2.
-
Figure 1—source data 1
Source data for Figure 1.
- https://cdn.elifesciences.org/articles/61167/elife-61167-fig1-data1-v2.xlsx
Figure 1—figure supplement 1
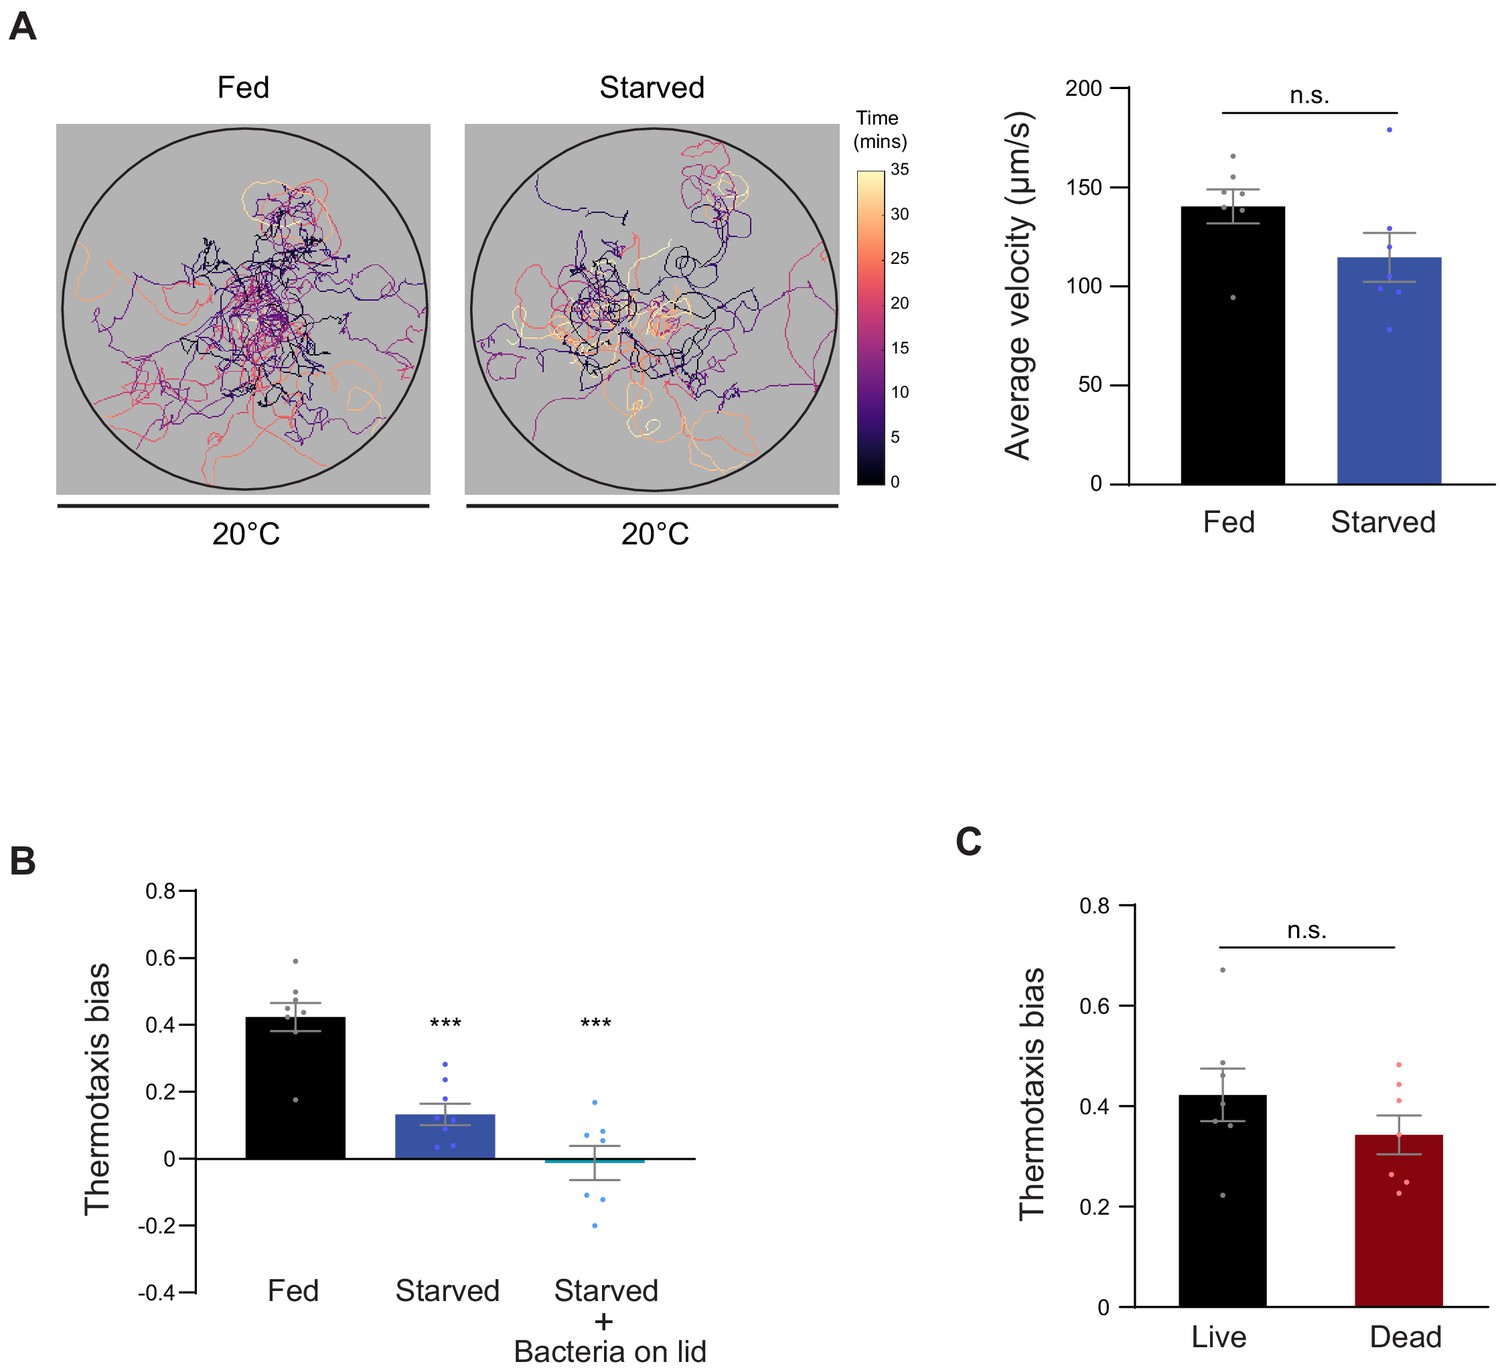
Negative thermotaxis is modulated by internal feeding state.
(A) (Left) Trajectories of fed and starved (3 hr) animals on isothermal plates at 20°C. Worm trajectories are color-coded by time during the assay. (Right) Average velocities of animals navigating an isothermal plate at 20°C. Each dot represents the mean velocity of 15 animals in an assay; n = 7 assays. Errors are SEM. n.s. – not significant. (B–C) Mean thermotaxis bias of animals subjected to the indicated conditions. Animals were starved for 3 hr with or without exposure to OP50 bacteria present on the plate lids in B. Animals were fed with antibiotic-killed bacteria in C for 3 hr prior to the assay. Each dot represents the thermotaxis bias of a biologically independent assay comprised of 15 animals. Errors are SEM. n.s. – not significant. *** indicates different from fed at p<0.001 (A, C: Student’s t-test, B: ANOVA with Tukey’s multiple comparison test).
-
Figure 1—figure supplement 1—source data 1
Source data for Figure 1—figure supplement 1.
- https://cdn.elifesciences.org/articles/61167/elife-61167-fig1-figsupp1-data1-v2.xlsx
Figure 1—figure supplement 2
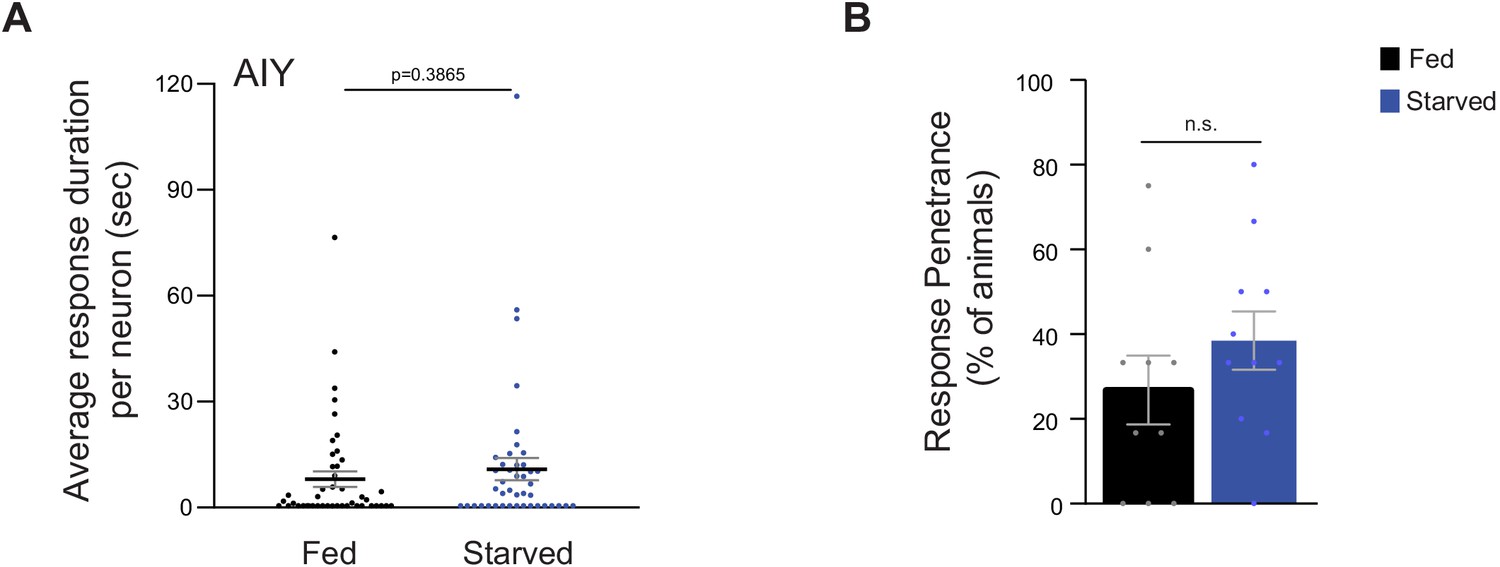
AIY temperature responses are largely unaltered by feeding state.
(A) Average duration of individual response events per AIY neuron (dots) in fed and starved animals, derived from data shown in Figure 1F. Means are indicated by horizontal black lines; errors are SEM. p-value was obtained using the Mann-Whitney U test. (B) Percentage of AIY neurons exhibiting responses (dots) in the 18–22°C temperature range (peri-Tc; Tc = 20°C). The average percentage of responses from 10 (fed) or 11 (starved) biologically independent experiments with 3–6 animals each is shown. Data are from Figure 1F. Errors are SEM. n.s. – not significant.
-
Figure 1—figure supplement 2—source data 1
Source data for Figure 1—figure supplement 2.
- https://cdn.elifesciences.org/articles/61167/elife-61167-fig1-figsupp2-data1-v2.xlsx
Figure 2 with 1 supplement

AWC activity is necessary for starvation-dependent suppression of negative thermotaxis.
(A) Mean thermotaxis bias of fed and starved wild-type and transgenic animals expressing HisCl1 in AWC under the odr-1 promoter in the presence or absence of 10 mM histamine (His). Histamine was present during starvation but not on the assay plate, or only on the assay plate as indicated. Each dot represents the thermotaxis bias of a biologically independent assay comprised of 15 animals. Errors are SEM. *** indicates different from fed at each condition at p<0.001 (Student’s t-test). n.s. – not significant. P-values in red indicate Wald F-statistic from linear regression analysis for the effect of the indicated genotype on the magnitude of the feeding state effect in the indicated conditions. Wild-type data were interleaved with experimental data in Figure 3F–G, and Figure 2—figure supplement 1C, and are repeated. (B) Mean thermotaxis index of wild-type and transgenic animals expressing GtACR2 in AWC under the ceh-36(prom3) promoter (gift from Steve Flavell). Thermotaxis index was calculated as (number of animals at 23–24°C on gradient)- (number of animals at 27–28°C on gradient)/(total number of animals). Animals were grown overnight and assayed with or without 50 μM all-trans retinal (ATR) in the plates as indicated. Assays were performed in the presence of blue light (see Materials and methods). Each dot represents the thermotaxis index of a biologically independent assay comprised of 15 animals. Errors are SEM. *** indicates different from fed at each condition at p<0.001 (Student’s t-test). n.s. – not significant. P-values in red indicate Wald F-statistic from linear regression analysis for the effect of the indicated genotype on the magnitude of the feeding state effect. Wild-type data were interleaved with experimental data in Figure 3H, and are repeated. (C–D) (Top) Intracellular calcium dynamics in AWC expressing GCaMP3 in response to a linear rising temperature stimulus at 0.05 °C/s (C) or at a constant temperature of 20°C (D) (black lines). Each row in the heatmaps displays responses from a single neuron from different animals ordered by the time of the first response; n = 21 (rising ramp, fed), 22 (rising ramp, starved), and 20 each (constant temperature, fed and starved). Each bar in the histograms represents the percentage of neurons responding during 15 s bins. (Bottom) Cumulative distribution fraction plots of total duration of calcium responses per AWC neuron calculated from data shown in the corresponding heatmaps and histograms. Distributions were compared using the Kolmogorov-Smirnov test. Also see Figure 2—figure supplement 1.
-
Figure 2—source data 1
Source data for Figure 2.
- https://cdn.elifesciences.org/articles/61167/elife-61167-fig2-data1-v2.xlsx
Figure 2—figure supplement 1
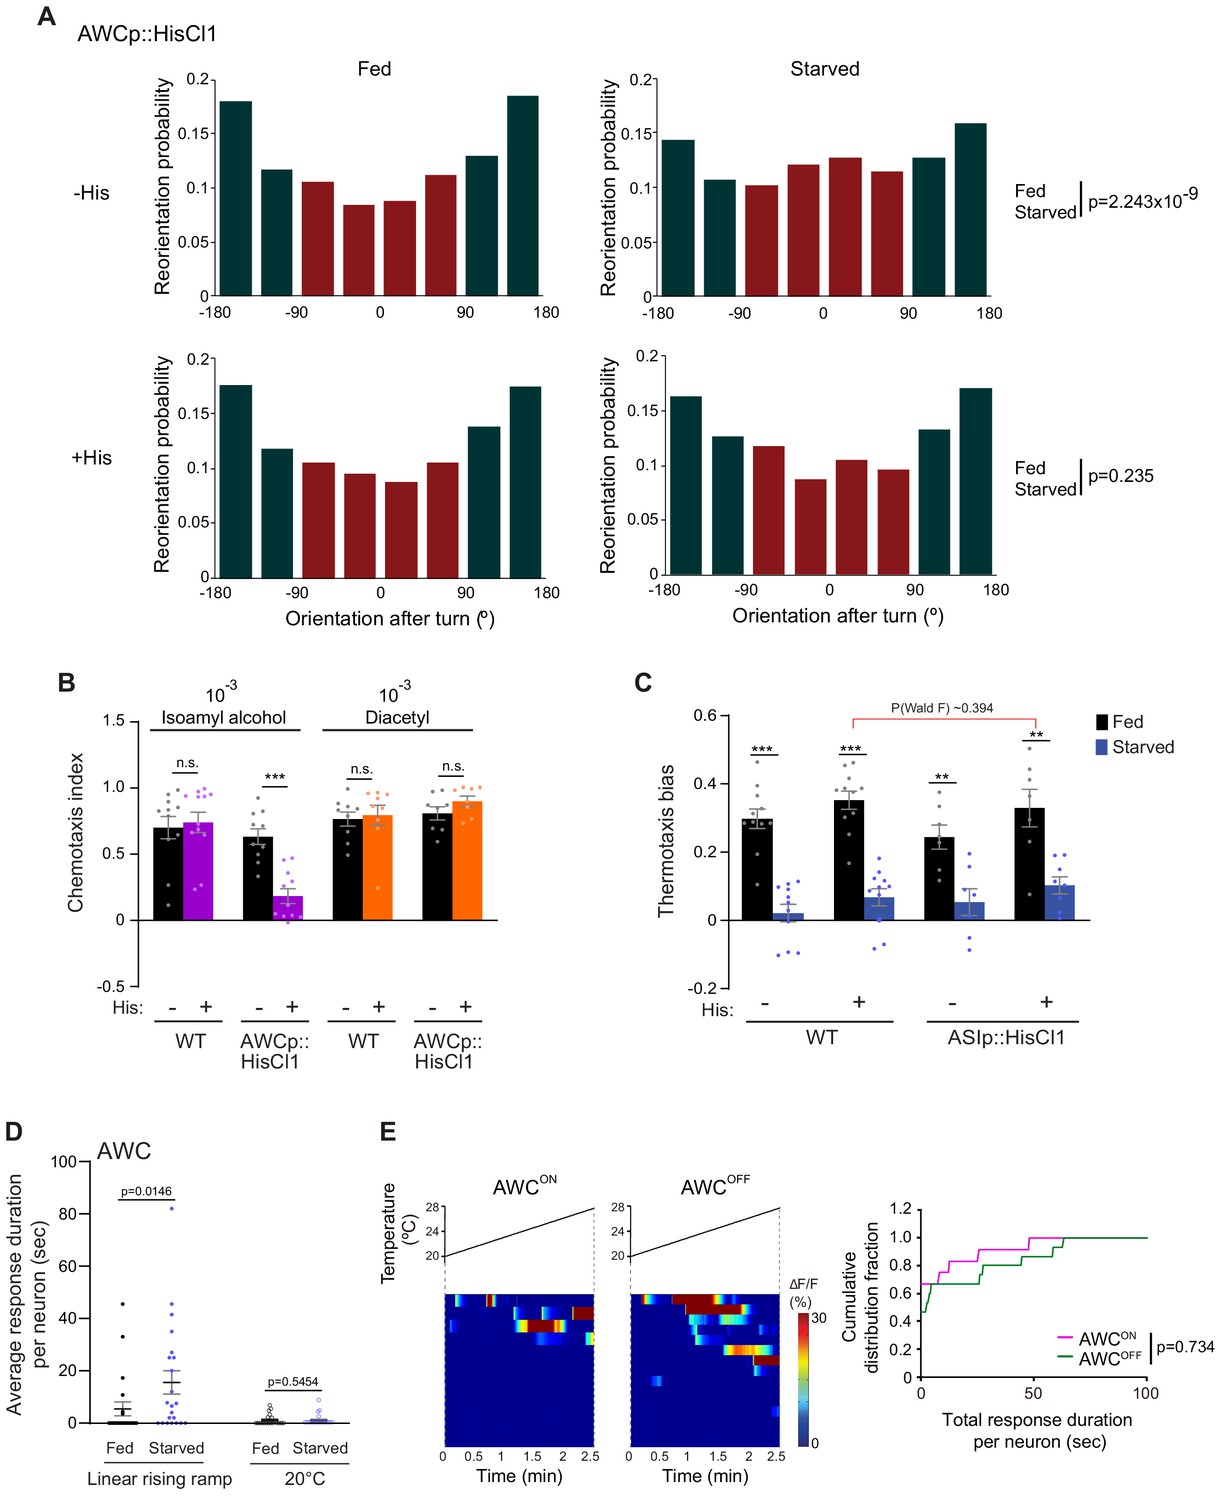
Inhibition of AWC temperature responses restores negative thermotaxis in starved animals.
(A) Histograms of movement orientation following a turn in animals expressing HisCl1 in AWC in the absence or presence of histamine on the assay plate. Data are from Figure 2A. Tracks from 8 assays of 15 animals each were categorized into bins of 45°. Red and green bars indicate orientation toward the warmer/orthogonal or cooler side, respectively. p-values were derived using the Mardia-Watson-Wheeler non-parametric test for circular data. (B) Mean chemotaxis index of animals of the indicated genotypes to a point source of the odorants isoamyl alcohol or diacetyl. Chemotaxis index is defined as (number of animals at the odorant) – (number of animals at the control)/total number of animals. Assays were performed in the absence or presence of 10 mM histamine on the assay plate as indicated. Each dot represents a biologically independent assay of ~100 animals each. Errors are SEM. *** indicates different from fed (Student’s t-test); n.s. – not significant. (C) Mean thermotaxis bias of fed and starved wild-type and transgenic animals expressing HisCl1 in ASI under the srg-47 promoter in the presence or absence of 10 mM histamine on the assay plate. Each dot represents the thermotaxis bias of a biologically independent assay comprised of 15 animals. Errors are SEM. *** and ** indicate different from fed at each condition at p<0.001 and p<0.01, respectively (Student’s t-test). P-value in red indicates Wald F-statistic from linear regression analysis for the effect of the indicated genotype on the magnitude of the feeding state effect. Wild-type data were interleaved with experimental data in Figure 2A, and Figure 3F–G, and are repeated. (D) Average duration of individual calcium events per AWC neuron (dots) in fed and starved animals in response to a rising linear temperature ramp or a constant temperature of 20°C, derived from data shown in Figure 2C–D. Means are indicated by horizontal black lines; errors are SEM. p-value was obtained using the Mann–Whitney U test. (E) (Left) Intracellular calcium dynamics in AWCON and AWCOFF neurons in starved animals expressing GCaMP3 in response to a linear rising temperature stimulus (black lines) at 0.05 °C/s. AWCON and AWCOFF neurons were identified via the expression of srsx-3p::mScarlet in AWCOFF. Each row in the heatmaps displays responses from a single neuron from different animals ordered by the time of the first response; n = 12 (AWCON) and 15 (AWCOFF). (Right) Cumulative distribution fraction plots of total duration of calcium responses per AWCON and AWCOFF neuron calculated from data shown at left. Distributions were compared using the Kolmogorov-Smirnov test.
-
Figure 2—figure supplement 1—source data 1
Source data for Figure 2—figure supplement 1.
- https://cdn.elifesciences.org/articles/61167/elife-61167-fig2-figsupp1-data1-v2.xlsx
Figure 3 with 1 supplement
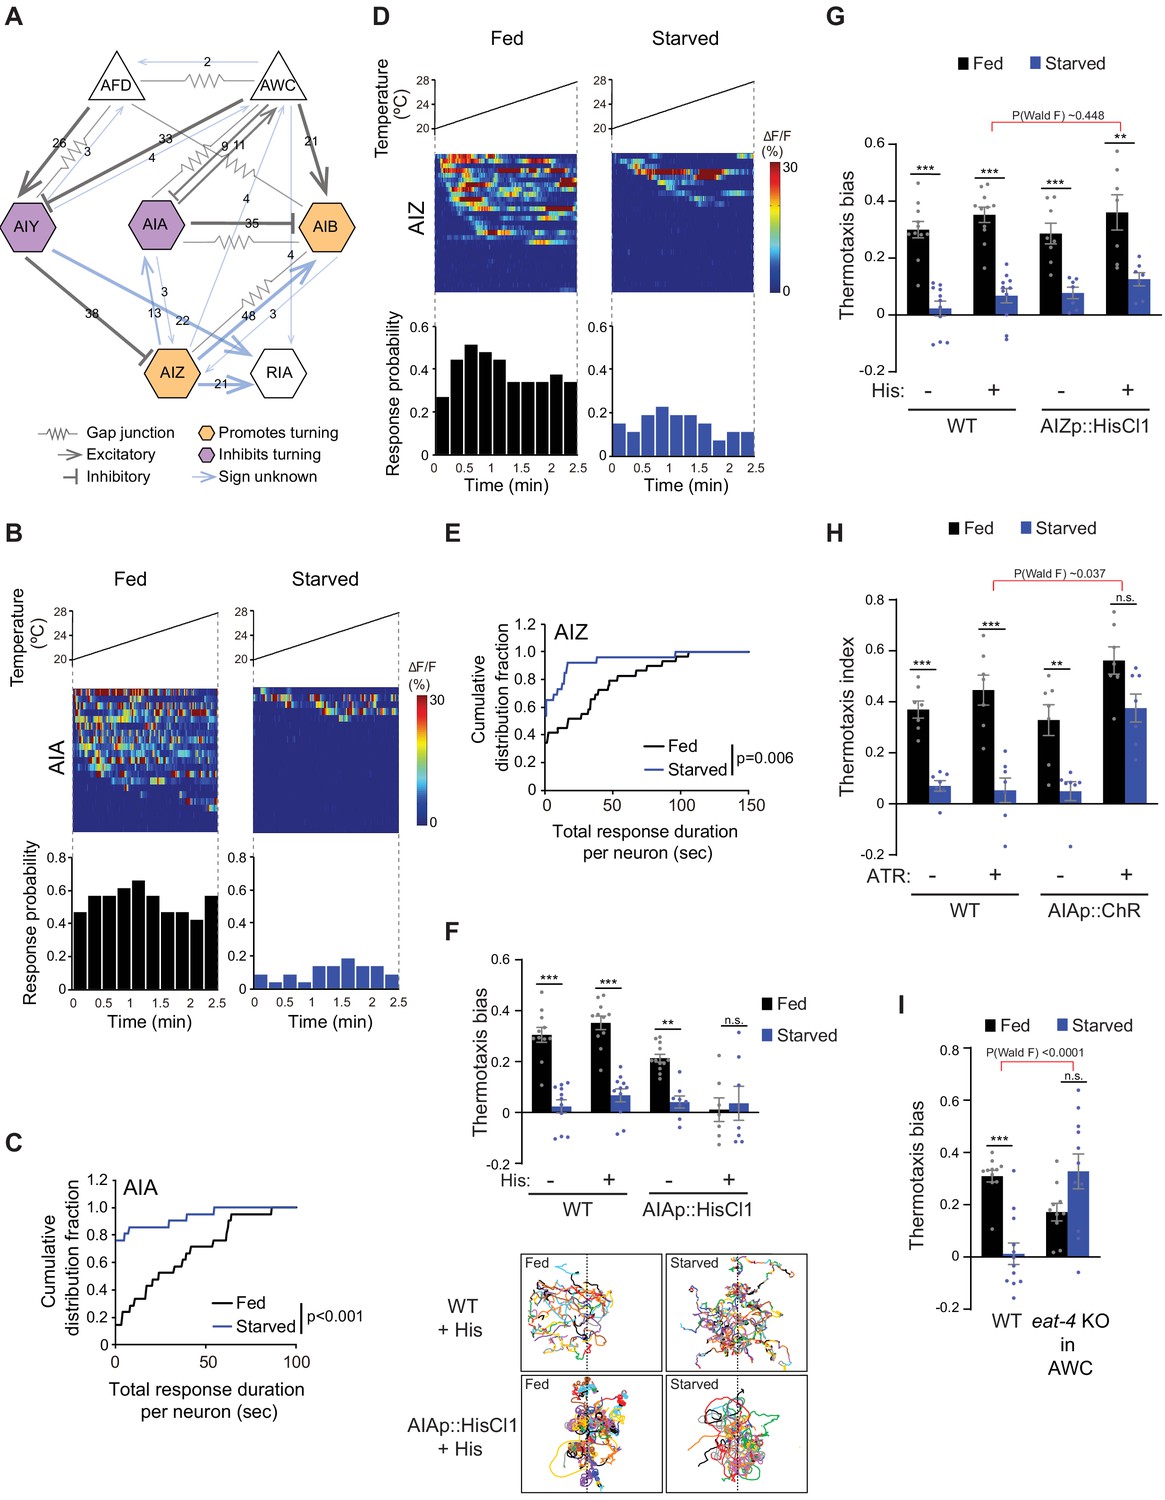
Inhibition of AIA temperature responses is necessary and sufficient for starvation-dependent suppression of negative thermotaxis.
(A) Schematic of chemical and electrical connectivity of indicated sensory neurons and interneurons. Connections whose signs have not been experimentally validated are indicated in blue. Numbers of synapses (≥2) observed via serial section electron microscopy are indicated. Weights of connecting lines are scaled to synaptic strength. Color codes indicate neurons whose activity is associated with promotion or inhibition of reversals and turns. Adapted from Cook et al., 2019; White et al., 1986 (www.wormwiring.org). (B, D) Intracellular calcium dynamics in AIA (B) and AIZ (D) expressing GCaMP5A (AIA) or GCaMP6s (AIZ) in response to a linear rising temperature stimulus (black lines) at 0.05 °C/s. Each row in the heatmaps displays responses from a single neuron from different animals ordered by the time of the first response; n = 21 (AIA, each fed and starved), 29 (AIZ, fed) and 26 (AIZ, starved). (Bottom) Each bar in the histograms represents the percentage of neurons responding during 15 s bins. (C, E) Cumulative distribution fraction plots of total duration of calcium responses per AIA (C) and AIZ (E) neuron calculated from data shown in B and D, respectively. Distributions were compared using the Kolmogorov-Smirnov test. (F, G) Mean thermotaxis bias of fed and starved wild-type and transgenic animals expressing HisCl1 in AIA (F), and AIZ (G) in the presence or absence of 10 mM histamine on the assay plate (see Supplementary file 1 for genotypes). Each dot represents the thermotaxis bias of a biologically independent assay comprised of 15 animals. Errors are SEM. *** and ** indicate different from fed at each condition at p<0.001 and p<0.01, respectively (Student’s t-test). n.s. – not significant. Wild-type data were interleaved with experimental data in Figure 2A, and Figure 2—figure supplement 1C, and are repeated. P-values in red indicate Wald F-statistic from linear regression analysis for the effect of the indicated genotype on the magnitude of the feeding state effect. Traces in F show trajectories of fed and starved animals from a representative 35 min assay of 15 animals of wild-type animals and animals expressing HisCl1 in AIA on histamine-containing plates; dashed lines indicate the starting temperature of 25.5°C on the thermal gradient. Individual worm trajectories are color-coded. Since trajectories are terminated by omega turns or collisions, trajectories of the same color may not represent the movement of a single animal throughout the assay. (H) Mean thermotaxis index of wild-type and transgenic animals expressing ChR in AIA under the ins-1(s) promoter. Animals were grown overnight and assayed with or without 50 μM all-trans retinal (ATR) in the plates as indicated. Assays were performed in the presence of blue light. Each dot represents the thermotaxis index of a biologically independent assay comprised of 15 animals. Errors are SEM. *** and ** indicate different from fed at each condition at p<0.001 and p<0.01, respectively (Student’s t-test). n.s. – not significant. P-values in red indicate Wald F-statistic from linear regression analysis for the effect of the indicated genotype on the magnitude of the feeding state effect. Wild-type data were interleaved with experimental data in Figure 2B, and are repeated. (I) Mean thermotaxis bias of animals of the indicated genotypes. eat-4 was knocked out in AWC via FLP-FRT-mediated recombination (López-Cruz et al., 2019). Each dot represents the thermotaxis bias of a biologically independent assay comprised of 15 animals. Errors are SEM. *** indicates different from fed at p<0.001 (Student’s t-test). n.s. – not significant. P-values in red indicate Wald F-statistic from linear regression analysis for the effect of the indicated genotype on the magnitude of the feeding state effect. Wild-type control data were interleaved with experimental data in Figure 3—figure supplement 1E, Figure 4—figure supplement 2A, and Figure 4—figure supplement 2D, and are repeated. Also see Figure 3—figure supplement 1.
-
Figure 3—source data 1
Source data for Figure 3.
- https://cdn.elifesciences.org/articles/61167/elife-61167-fig3-data1-v2.xlsx
Figure 3—figure supplement 1
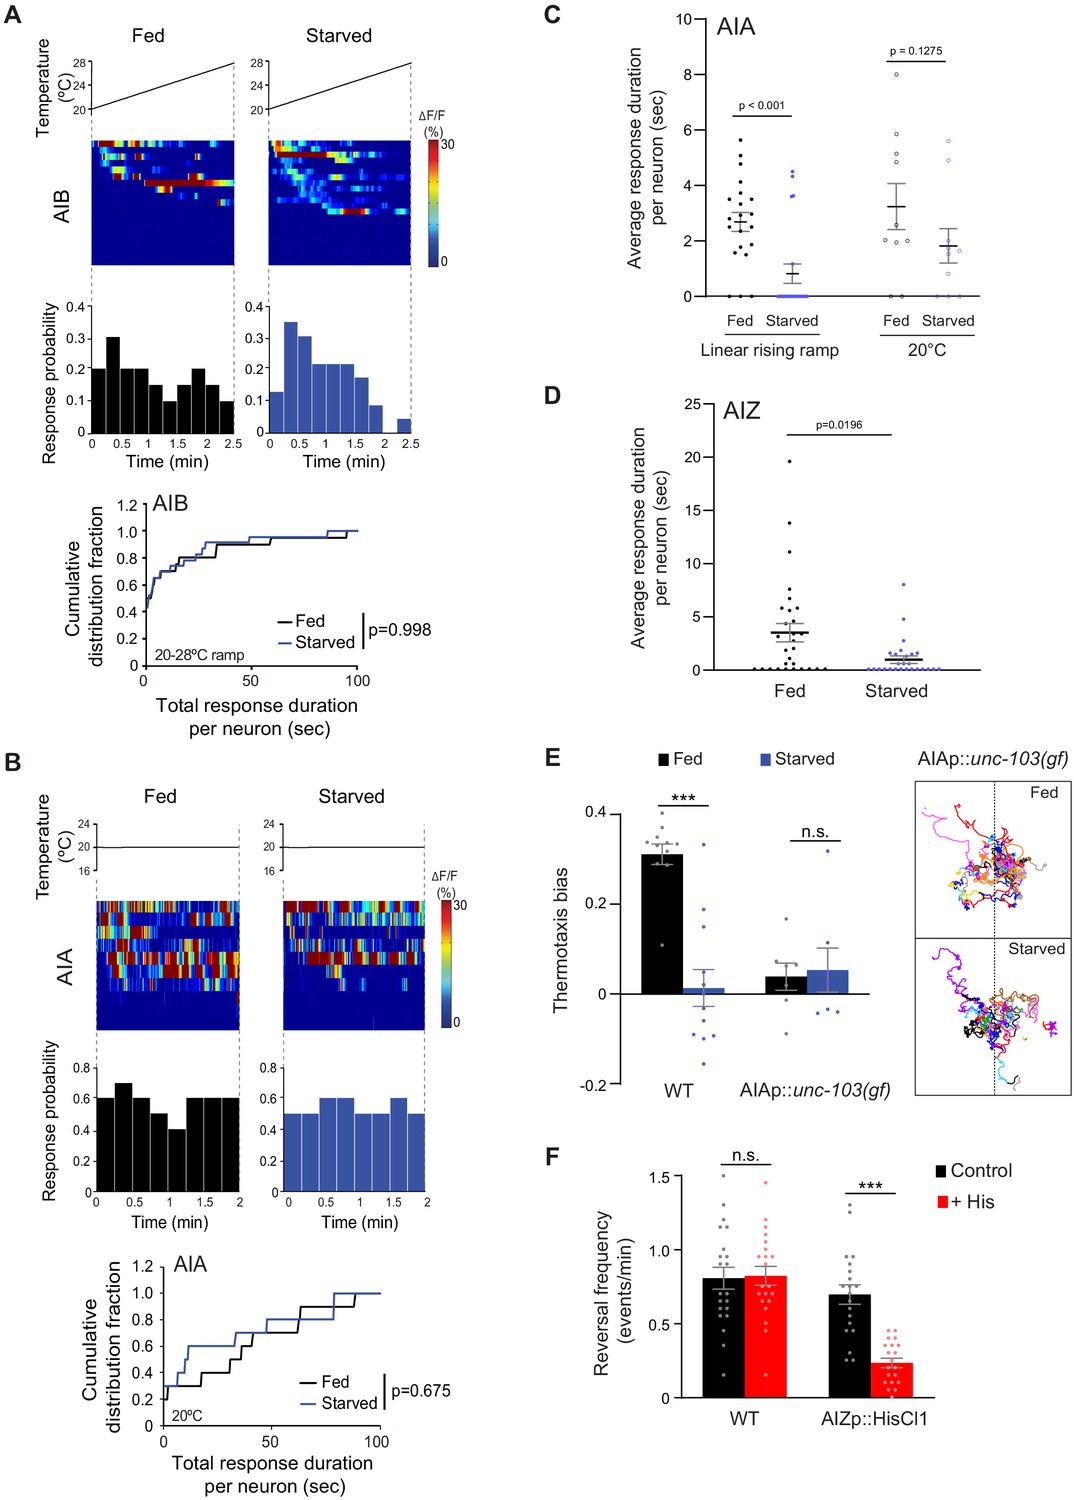
Temperature responses in interneurons are differentially altered by starvation.
(A) (Top) Intracellular calcium dynamics in AIB expressing GCaMP3 in response to a linear rising temperature stimulus (black lines) at 0.05 °C/s. Each row in the heatmaps displays responses from a single neuron from different animals ordered by the time of the first response; n = 20 (fed) and 23 (starved). Each bar in the histograms represents the percentage of neurons from animals of the indicated genotypes responding during 15 s bins. (Bottom) Cumulative distribution fraction plots of total duration of calcium responses per AIB neuron calculated from data shown in heatmaps and histograms. Distributions were compared using the Kolmogorov-Smirnov test. (B) (Top) Intracellular calcium dynamics in AIA expressing GCaMP5A in animals held at a constant temperature of 20°C (black lines). Each row in the heatmaps displays responses from a single neuron from different animals ordered by the time of the first response; n = 10 each (fed and starved). Each bar in the histograms represents the percentage of neurons from animals of the indicated genotypes responding during 15 s bins. (Bottom) Cumulative distribution fraction plots of total duration of calcium responses per AIA neuron calculated from data shown in the heatmaps and histograms. Distributions were compared using the Kolmogorov-Smirnov test. (C–D) Average duration of individual response events (dots) per AIA neuron to a rising linear temperature ramp or constant temperature of 20°C (C) and per AIZ neuron to a rising linear temperature ramp (D) in fed and starved animals. Data for AIA are derived from data shown in Figure 3B and (B); data for AIZ are derived from Figure 3D. Means are indicated by horizontal black lines; errors are SEM. p-values were obtained using the Mann-Whitney U test. (E) Mean thermotaxis bias of fed and starved wild-type and transgenic animals of the indicated genotypes. Each dot represents the thermotaxis bias of a biologically independent assay comprised of 15 animals. Errors are SEM. *** indicates different from fed at p<0.001 (Student’s t-test). n.s. – not significant. Wild-type data were interleaved with experimental data in Figure 3I, Figure 4—figure supplement 2A, and Figure 4—figure supplement 2D, and are repeated. Traces at right show trajectories of fed and starved animals expressing unc-103(gf) in AIA; dashed lines indicate the starting temperature of 25.5°C on the thermal gradient. Individual worm trajectories are color-coded. Since trajectories are terminated by omega turns or collisions, trajectories of the same color may not represent the movement of a single animal throughout the assay. (F) Mean reversal frequency of fed and starved wild-type and transgenic animals expressing HisCl1 in AIZ in the presence or absence of 10 mM histamine on an isothermal plate at 20°C. Each dot represents the reversal frequency of an individual animal over the assay period. n = 20. Errors are SEM. *** indicates different from fed (Student’s t-test); n.s. – not significant.
-
Figure 3—figure supplement 1—source data 1
Source data for Figure 3—figure supplement 1.
- https://cdn.elifesciences.org/articles/61167/elife-61167-fig3-figsupp1-data1-v2.xlsx
Figure 4 with 2 supplements

INS-1 insulin signaling from the gut modulates AWC and AIA temperature responses to disrupt negative thermotaxis upon starvation.
(A, D, E) Mean thermotaxis bias of animals of the indicated genotypes. ins-1 was knocked out cell-specifically via Cre-Lox-mediated recombination using ins-1 alleles flanked with loxP sequences, and cell-specific expression of nCre (A) (Figure 4—figure supplement 1A–B, Supplementary file 1). Promoters used to drive Cre::SL2::GFP expression were ins-1 (ins-1-expressing cells), gcy-28d (AIA), odr-2b(3a) (AIB and AIZ), and ifb-2 (intestine). Alleles used in (D) were ins-1(nr2091), daf-18(ok480), daf-16(m26), and daf-2(e1368). DAF-16 was depleted in AWC via auxin-induced degradation of a degron-tagged daf-16 allele and AWC-specific expression of TIR1 under the ceh-36prom2_del1ASE promoter (E) (Figure 4—figure supplement 2B). Auxin was added during starvation and to the assay plate, or to the assay plate alone, as indicated in (E). Each dot represents the thermotaxis bias of a biologically independent assay comprised of 15 animals. Errors are SEM. *** and ** indicate different from fed p<0.001 and p<0.01, respectively (Student’s t-test). n.s. – not significant. P-values in red indicate t-statistic from posthoc effect size comparisons (Dunnett’s test) between the indicated genotypes (A) or the conditions (E), respectively, on the magnitude of the feeding state effect. Wild-type data in (E) were interleaved with experimental data in Figure 4—figure supplement 2C, and are repeated. (B) Representative image of the expression pattern of an ins-1p::GFP::PEST reporter in a well-fed adult hermaphrodite. Expression in the gut and in AIA is indicated by an arrow and arrowhead, respectively. Anterior is at left. Scale bar: 20 μm. (C) Schematic of starvation-dependent inhibition of the canonical insulin signaling pathway via ILP-mediated antagonism of DAF-2. (F, G) Intracellular calcium dynamics in AWC (F) and AIA (G) neurons in ins-1 mutants expressing GCaMP3 (AWC) or GCaMP5A (AIA) in response to a linear rising temperature stimulus (black lines) at 0.05 °C/s. Each row in the heatmaps displays responses from a single neuron from different animals ordered by the time of the first response; n = 19 (AWC, each fed and starved), 20 (AIA, fed) and 19 (AIA, starved). (Bottom) Each bar in the histograms represents the percentage of neurons from animals of the indicated genotypes responding during 15 s bins. Open bars indicate data from wild-type neurons repeated from Figure 2C (AWC) and Figure 3B (AIA). (H) Cumulative distribution fraction plots of total duration of calcium responses per AWC (top) and AIA (bottom) neuron calculated from data shown in F and G, respectively. Dashed lines indicate wild-type data repeated from Figure 2C (AWC) and Figure 3C (AIA). Distributions were compared using the Kolmogorov-Smirnov test. (I) Working model of AWC- and AIA-mediated disruption of negative thermotaxis upon starvation. AFD and AIY temperature responses are indifferent to feeding state. In fed animals, low and high activity in AWC and AIA, respectively is permissive for AFD-mediated negative thermotaxis. Upon prolonged starvation, INS-1 signaling from the gut acts directly or indirectly on AWC via DAF-16 to increase temperature responses. Glutamatergic signaling from AWC inhibits AIA resulting in temperature change-uncorrelated reversals and turns and disruption of AFD-mediated negative thermotaxis. Also see Figure 4—figure supplement 1 and Figure 4—figure supplement 2.
-
Figure 4—source data 1
Source data for Figure 4.
- https://cdn.elifesciences.org/articles/61167/elife-61167-fig4-data1-v2.xlsx
Figure 4—figure supplement 1
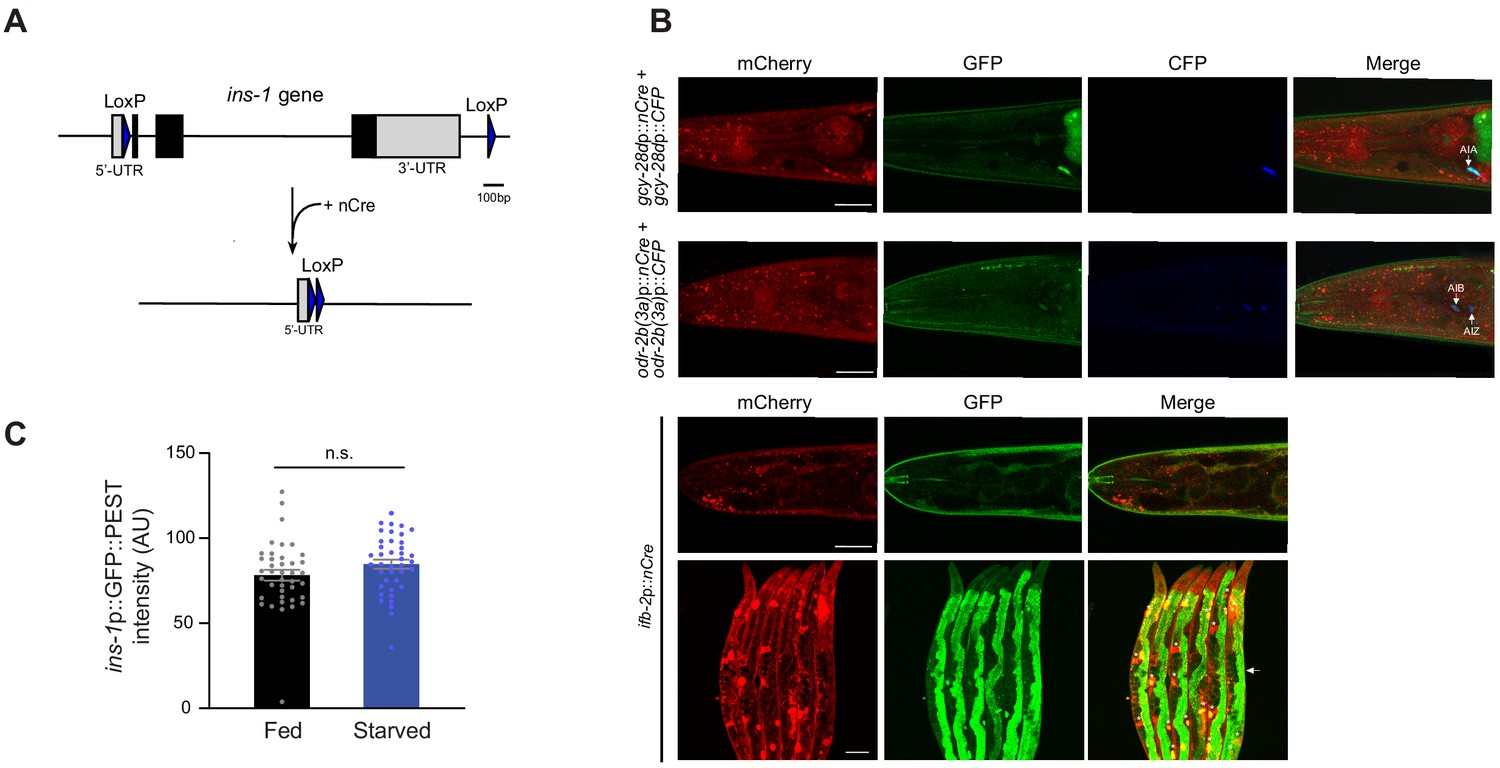
INS-1 insulin signaling from the intestine mediates starvation-dependent thermotaxis behavioral plasticity.
(A) Schematic of Cre-Lox-mediated recombination strategy for cell-specific knockout of ins-1. loxP sequences were inserted flanking the ins-1 genomic sequence via gene editing. nCre was expressed under cell-specific promoters (Supplementary file 1). (B) Representative images of cell- and tissue-specific reporter expression driven by Cre-mediated recombination from the heIs105 recombination reporter (Ruijtenberg and van den Heuvel, 2015). (Top) Representative images upon nCre and CFP expression under the gcy-28d and odr-2b(3a) promoters. Arrows indicate colocalization of CFP and excision-dependent GFP expression in AIA, and AIB/AIZ. Neurons were also identified by their stereotypical soma positions and axon trajectories. Scale bar: 20 μm. (Bottom) Representative images of the head alone and the body of animals expressing nCre under the ifb-2 promoter. Arrow indicates excision-dependent GFP expression in the gut; asterisks indicate mCherry expression in coelomocytes from the coinjection marker. Scale bars: 100 μm. (C) Average pixel intensity of ins-1p::GFP::PEST fluorescence in the anterior intestine of well-fed and starved (3 hr) animals. Each dot is the average fluorescence intensity in a single animal. Errors are SEM. n.s. – not significant.
-
Figure 4—figure supplement 1—source data 1
Source data for Figure 4—figure supplement 1.
- https://cdn.elifesciences.org/articles/61167/elife-61167-fig4-figsupp1-data1-v2.xlsx
Figure 4—figure supplement 2
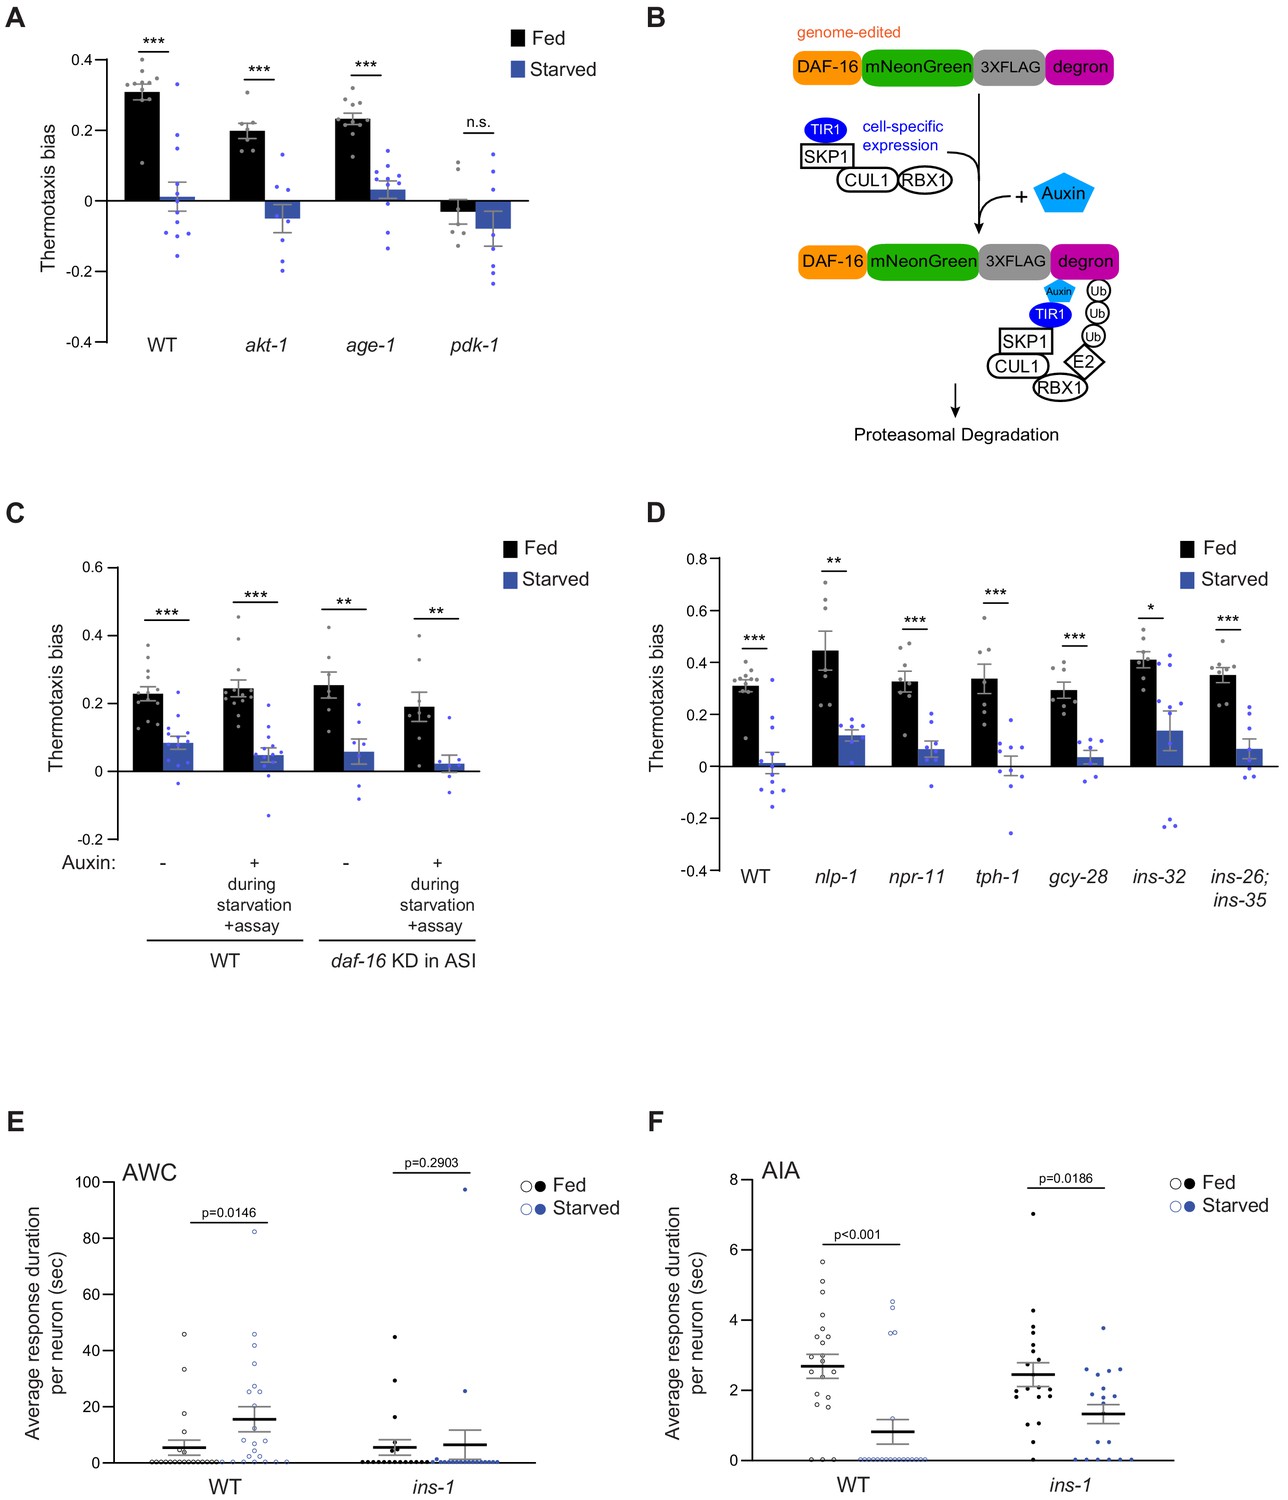
INS-1 targets AWC to alter temperature responses as a function of satiety state.
(A, C, D) Mean thermotaxis bias of fed and starved animals of the indicated genotypes (see Supplementary file 1 for alleles used). Each dot represents the thermotaxis bias of a biologically independent assay comprised of 15 animals. Errors are SEM. DAF-16 was depleted in ASI via auxin-induced degradation of a degron-tagged daf-16 allele and ASI-specific expression of TIR1 under the srg-47 promoter (C). Data from two independent transgenic strains are combined (C). Auxin was added during starvation and to the assay plate (C). ***, ** and * indicate different from fed at p<0.001, p<0.01, and p<0.05, respectively (Student’s t-test). n.s. – not significant. Wild-type data in A and D were interleaved with experimental data in Figure 3I and Figure 3—figure supplement 1E, and are repeated. Wild-type data in C were interleaved with experimental data in Figure 4E, and are repeated. (B) Schematic of auxin-induced degradation strategy. The daf-16 gene edited allele was a kind gift of Oliver Hobert (Columbia University) (Aghayeva et al., 2020). TIR1-encoding sequences were expressed under cell-specific promoters (Supplementary file 2). (E, F) Average duration of individual response events (dots) per AWC (E) and AIA (F) neuron in fed and starved wild-type and ins-1 mutants. Wild-type data are repeated (open circles) from Figure 2—figure supplement 1D (E) and Figure 3—figure supplement 1C (F). ins-1 data are derived from Figure 4F and G. Means are indicated by horizontal black lines; errors are SEM. p-values were obtained using the Mann-Whitney U test.
-
Figure 4—figure supplement 2—source data 1
Source data for Figure 4—figure supplement 2.
- https://cdn.elifesciences.org/articles/61167/elife-61167-fig4-figsupp2-data1-v2.xlsx
Additional files
-
Supplementary file 1
Strains used in this work.
- https://cdn.elifesciences.org/articles/61167/elife-61167-supp1-v2.docx
-
Supplementary file 2
Plasmids used in this work.
- https://cdn.elifesciences.org/articles/61167/elife-61167-supp2-v2.docx
Download links
A two-part list of links to download the article, or parts of the article, in various formats.
Downloads (link to download the article as PDF)
Open citations (links to open the citations from this article in various online reference manager services)
Cite this article (links to download the citations from this article in formats compatible with various reference manager tools)
Feeding state functionally reconfigures a sensory circuit to drive thermosensory behavioral plasticity
eLife 9:e61167.
https://doi.org/10.7554/eLife.61167


