Opposing JAK-STAT and Wnt signaling gradients define a stem cell domain by regulating differentiation at two borders
- Department of Biological Sciences, Columbia University, United States
Figures
Figure 1
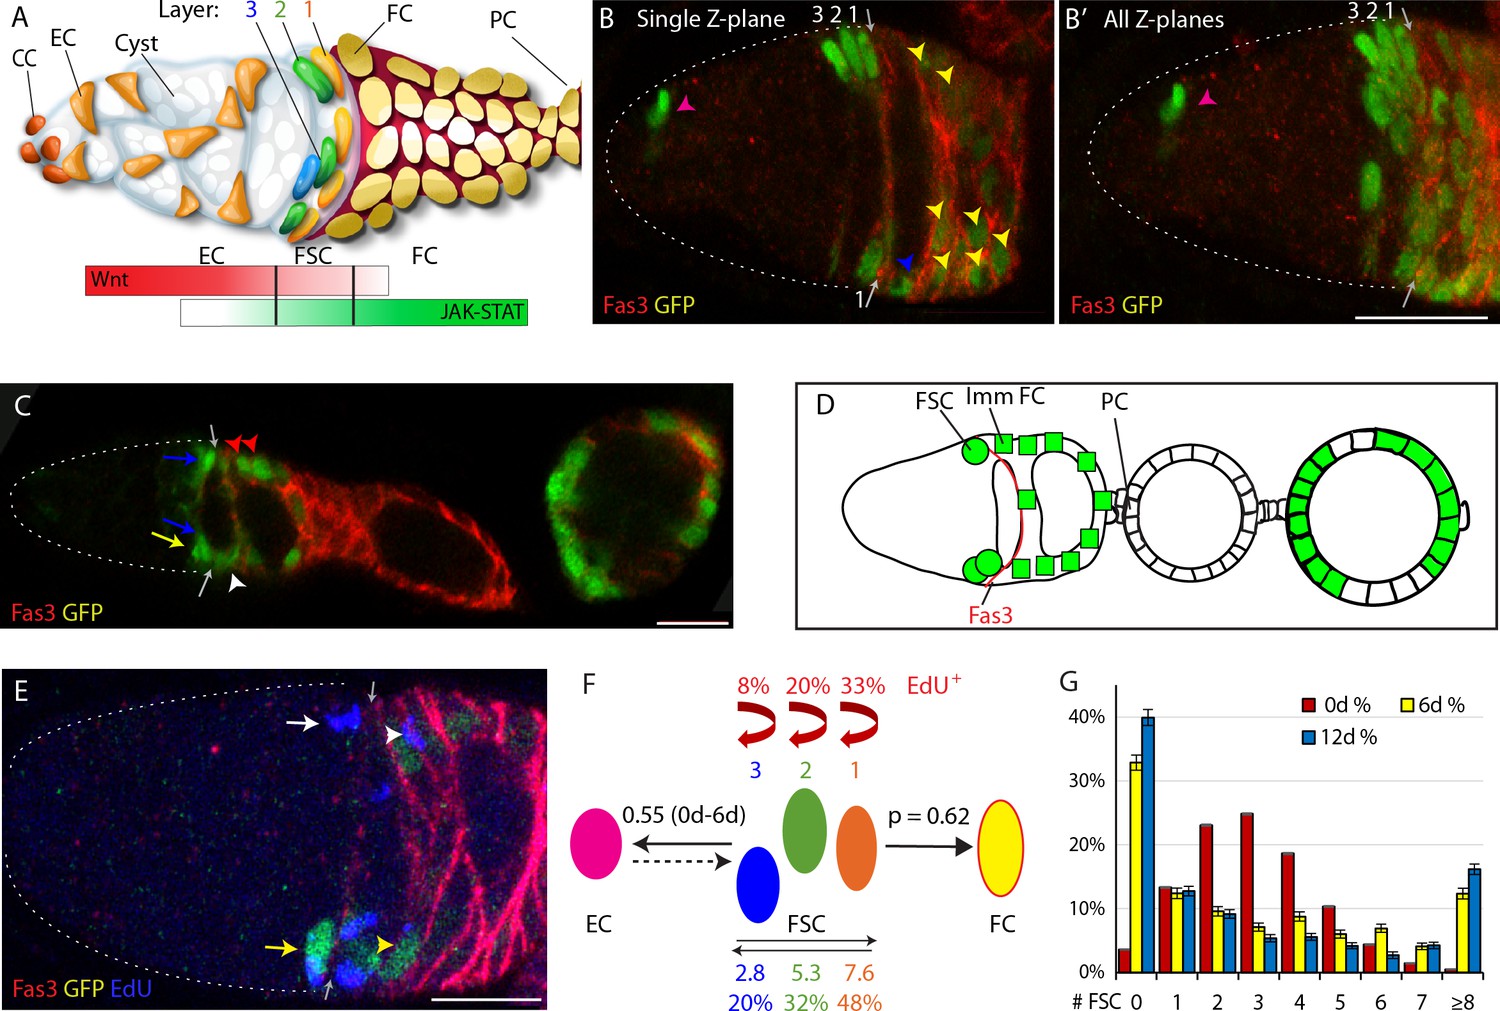
Follicle Stem Cell locations, signals and behaviors.
(A) Cartoon representation of a germarium. Cap Cells (CC) at the anterior (left) contact Germline Stem Cells (not shown), which produce Cystoblast daughters that mature into 16 cell germline cysts (white) as they progress posteriorly. Quiescent Escort Cells (ECs) extend processes around germline cysts and support their differentiation. Follicle Stem Cells (FSCs) occupy three AP Layers (3, 2, 1) around the germarial circumference and immediately anterior to strong Fas3 staining (red) on the surface of all early Follicle Cells (FCs). FCs proliferate to form a monolayer epithelium, including specialized terminal Polar Cells (PCs), which secrete the Upd ligand responsible for generating a JAK-STAT pathway gradient (green) of opposite polarity to the Wnt pathway gradient (red), generated by ligands produced in CCs and ECs. (B) A GFP-positive (green) MARCM FSC lineage that includes FSCs in each layer, an EC (magenta arrowhead), a recently produced ‘immediate’ FC (blue arrowhead) and other FCs (yellow arrowheads) visualized together with Fas3 (red, arrows mark anterior Fas3 border) as (B) a single 3 μm z-section and (B’) a projection of ten z-sections (scoring is done by examining each z-section). The dotted white line outlines the germarium here and in future similar images. (C, D) Early portion of an ovariole with marked FSCs (green) in layer 1 (blue arrows) and layer 2 (yellow arrows), a marked immediate FC (white arrowhead) and more posterior FCs (magenta arrowheads) together with the anterior Fas3 (red) border (gray arrows), also (D) shown diagrammatically with anterior PCs of the first budded egg chamber indicated. (E) Germarium with a MARCM FSC lineage (green) stained for EdU (blue) incorporation during 1 hr prior to fixation, showing examples of a GFP-positive EdU+ FSC (yellow arrow) and FC (yellow arrowhead), a GFP-negative EdU+ FSC (white arrow) and FC (white arrowhead) and the anterior Fas3 (red) border (gray arrows). (F) Diagram showing four of five properties of FSC behavior measured for all marked FSCs in MARCM lineages, with values indicated for normal FSCs: EdU incorporation frequency for each FSC layer (red text and arrows), FSC location among the three layers (indicated by absolute numbers and frequencies), ECs produced per anterior FSC (those in layers 2 and 3) over a given period (0.55 from 0-6d), and the likelihood for a layer 1 FSC to become an FC (p=0.62) in a single budding cycle. (G) Distribution of the number of surviving FSCs observed for control genotypes at 6d (yellow) and 12d (blue), with the theoretically expected binomial distribution of FSCs initially marked (0d; red) based on the measured average number of surviving marked FSCs. All scale bars are 10 μm.
-
Figure 1—source data 1
Numerical data for graphs in Figure 1.
- https://cdn.elifesciences.org/articles/61204/elife-61204-fig1-data1-v2.xlsx
Figure 2 with 1 supplement
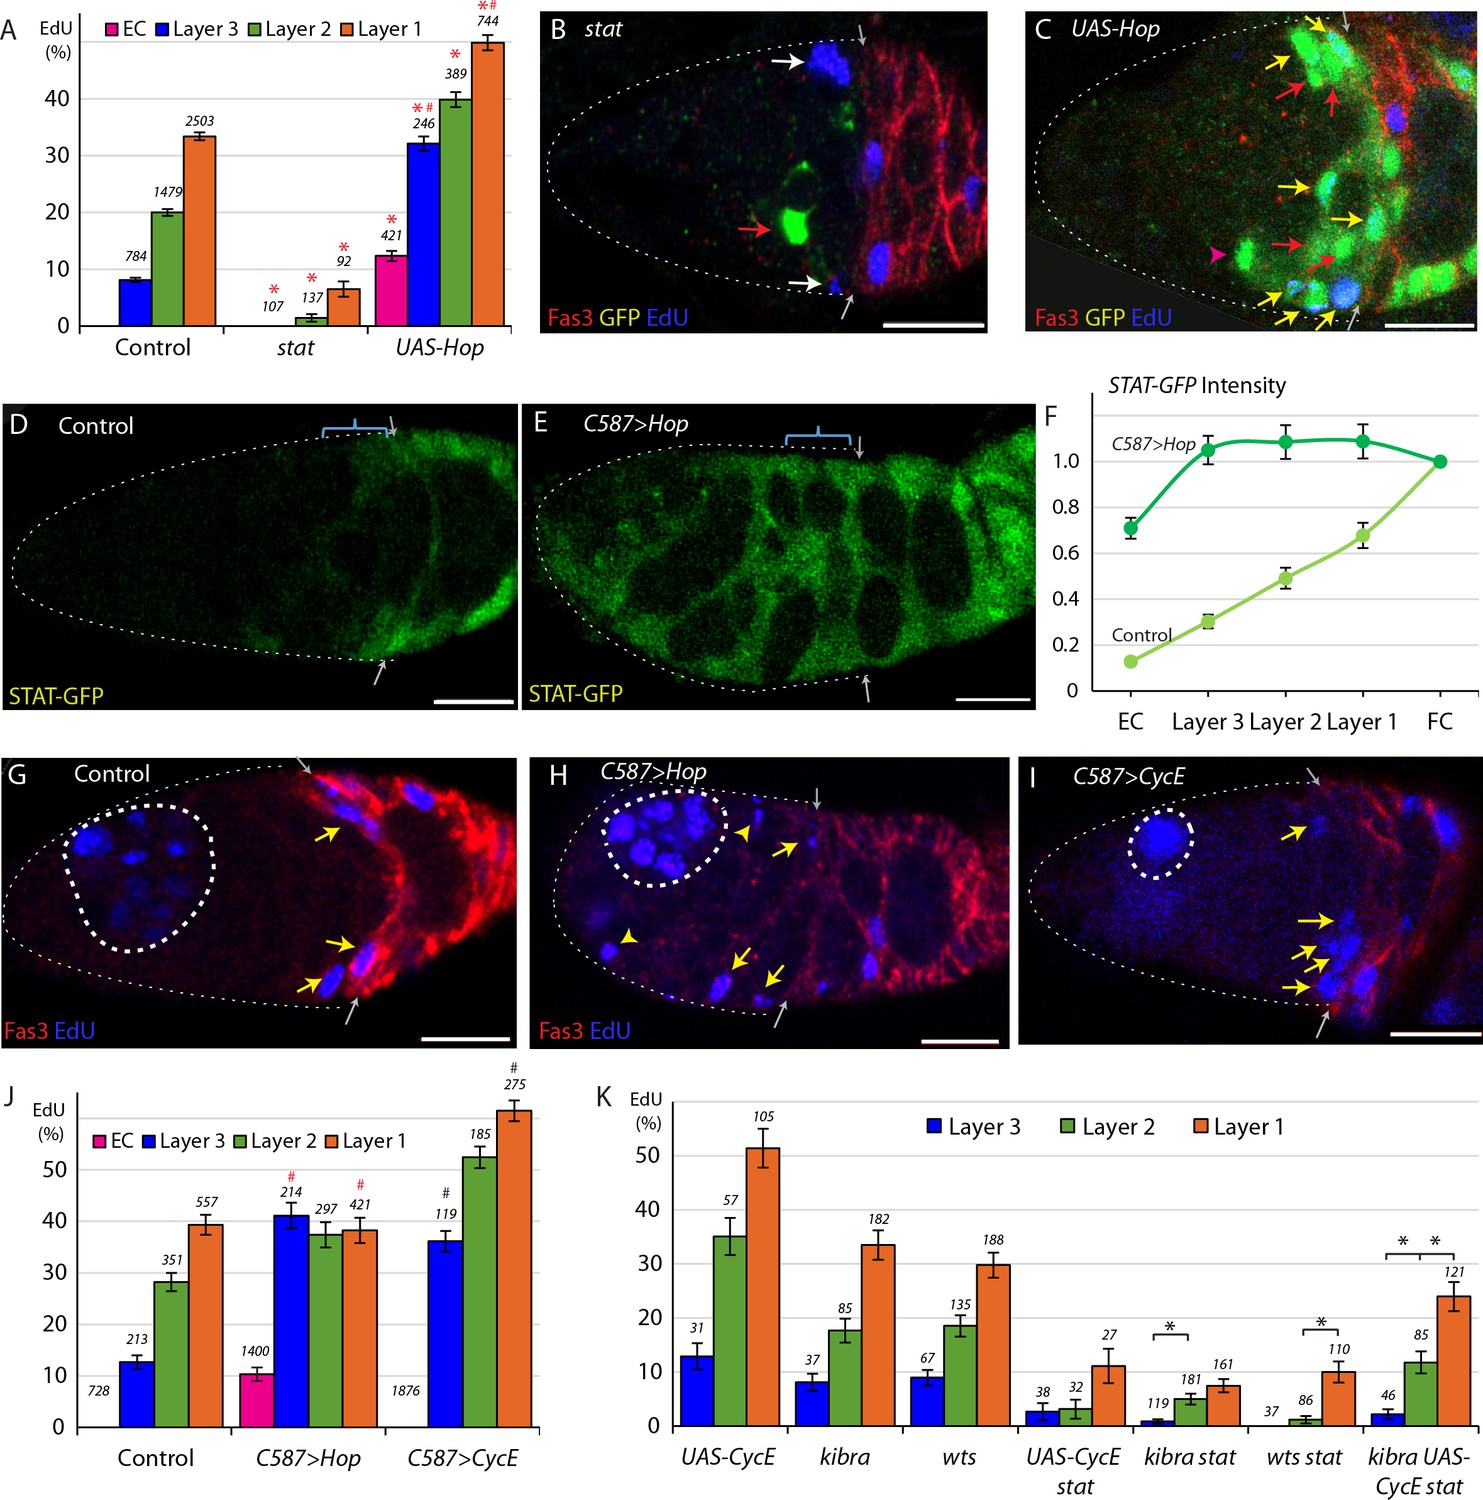
Graded JAK-STAT signaling determines FSC and EC proliferation profile.
(A) EdU incorporation frequency into FSCs in layers 1–3 and ECs for the indicated genotypes of MARCM lineages, with the number of cells scored and significant differences to control values (red asterisks, p<0.001). The statistical significance of the EdU index of each FSC layer as a fraction of overall EdU index relative to controls was calculated for all genotypes. Significant differences are indicated by the # symbol (# [in red] p<0.001). (B, C) EdU (blue) incorporation into MARCM FSC lineages 6d after clone induction with anterior border of Fas3 (red) marked (gray arrows). (B) Most FSCs lacking stat activity (green) did not incorporate EdU (red arrow), unlike unmarked GFP-negative neighbors (white arrows). (C) Increased JAK-STAT pathway activity from expression of UAS-Hop produced many GFP-positive EdU+ FSCs (yellow arrows). GFP-positive EdU- FSCs (red arrows) and a GFP-positive EdU- EC (magenta arrowhead) are also indicated. (D–E) STAT-GFP reporter activity (green) (D) normally declines from the posterior over the FSC domain (blue bracket; arrows mark Fas3 (not shown) anterior border) but (E) becomes uniformly high 3d after UAS-Hop expression with C587-GAL4. (F) Average relative intensity of GFP fluorescence from STAT-GFP reporter in the indicated cell types for Control (n = 20) and C587 >Hop (n = 22) germaria. (G–I) EdU (blue) incorporation in somatic cells is (G) normally restricted to FSCs (yellow arrows) and FCs beyond the Fas3 (red) border (gray arrows), (I) even when CycE activity is increased, but (H) ECs (arrowheads) are also labeled when JAK-STAT pathway activity is elevated. Thick dashed white lines outline germline cysts labeled by EdU. Thin dotted white line outlines the germarium. (J) EdU incorporation frequency into FSCs of layers 1–3 and ECs for germaria with the indicated genotypes. EdU incorporation is expressed as the percentage of all counted FSCs in layers 1, 2 and 3, while the total number of ECs in each germarium was not counted but assumed to be 40 in all cases (the total number of DAPI-labeled nuclei scored is above each column). The statistical significance of the EdU index of each FSC layer as a fraction of overall EdU index relative to controls was calculated for both altered genotypes. Significant differences are indicated by the # symbol (# p<0.05, # [in red] p<0.001). (K) EdU incorporation frequency into FSCs of layers 1–3 and ECs for the indicated genotypes of MARCM lineages with number of cells scored above each column and significant differences between pairs of FSC layers indicated only for stat-containing genotypes (black asterisks, p<0.05). The statistical significance of the EdU index of each FSC layer as a fraction of overall EdU index relative to controls was also calculated for all genotypes. No significant differences were found, indicating a gradient of EdU incorporation that is not significantly different from controls. All scale bars are 10 μm. See also Figure 2—figure supplement 1.
-
Figure 2—source data 1
Numerical data for graphs in Figure 2.
- https://cdn.elifesciences.org/articles/61204/elife-61204-fig2-data1-v2.xlsx
Figure 2—figure supplement 1
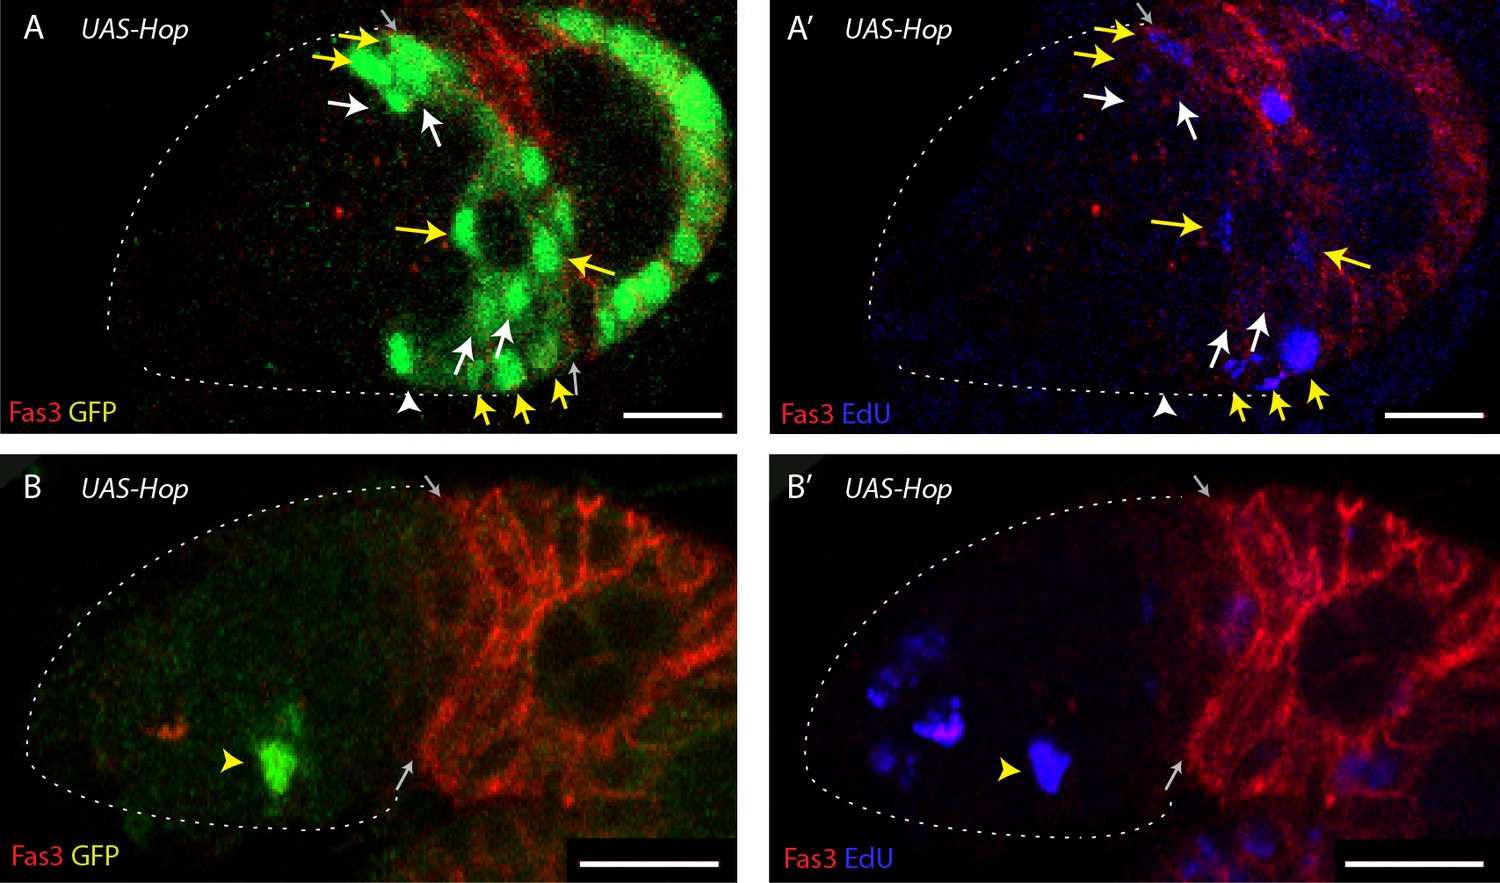
JAK-STAT pathway promotes division of FSCs and cells in EC territory.
(A, B) EdU (blue) incorporation into MARCM FSC lineages expressing UAS-Hop 6d after clone induction with anterior border of Fas3 (red) marked (gray arrows), showing (A, B) GFP and (A’, B’) EdU channels separately. (A) The proportion of all GFP-positive FSCs (white and yellow arrows) that incorporated EdU (yellow arrows) was higher than for controls and (B) there were sometimes GFP-positive cells in EC locations that incorporated EdU (yellow arrowhead), which are never seen for control MARCM lineages. All scale bars are 10 μm.
Figure 3
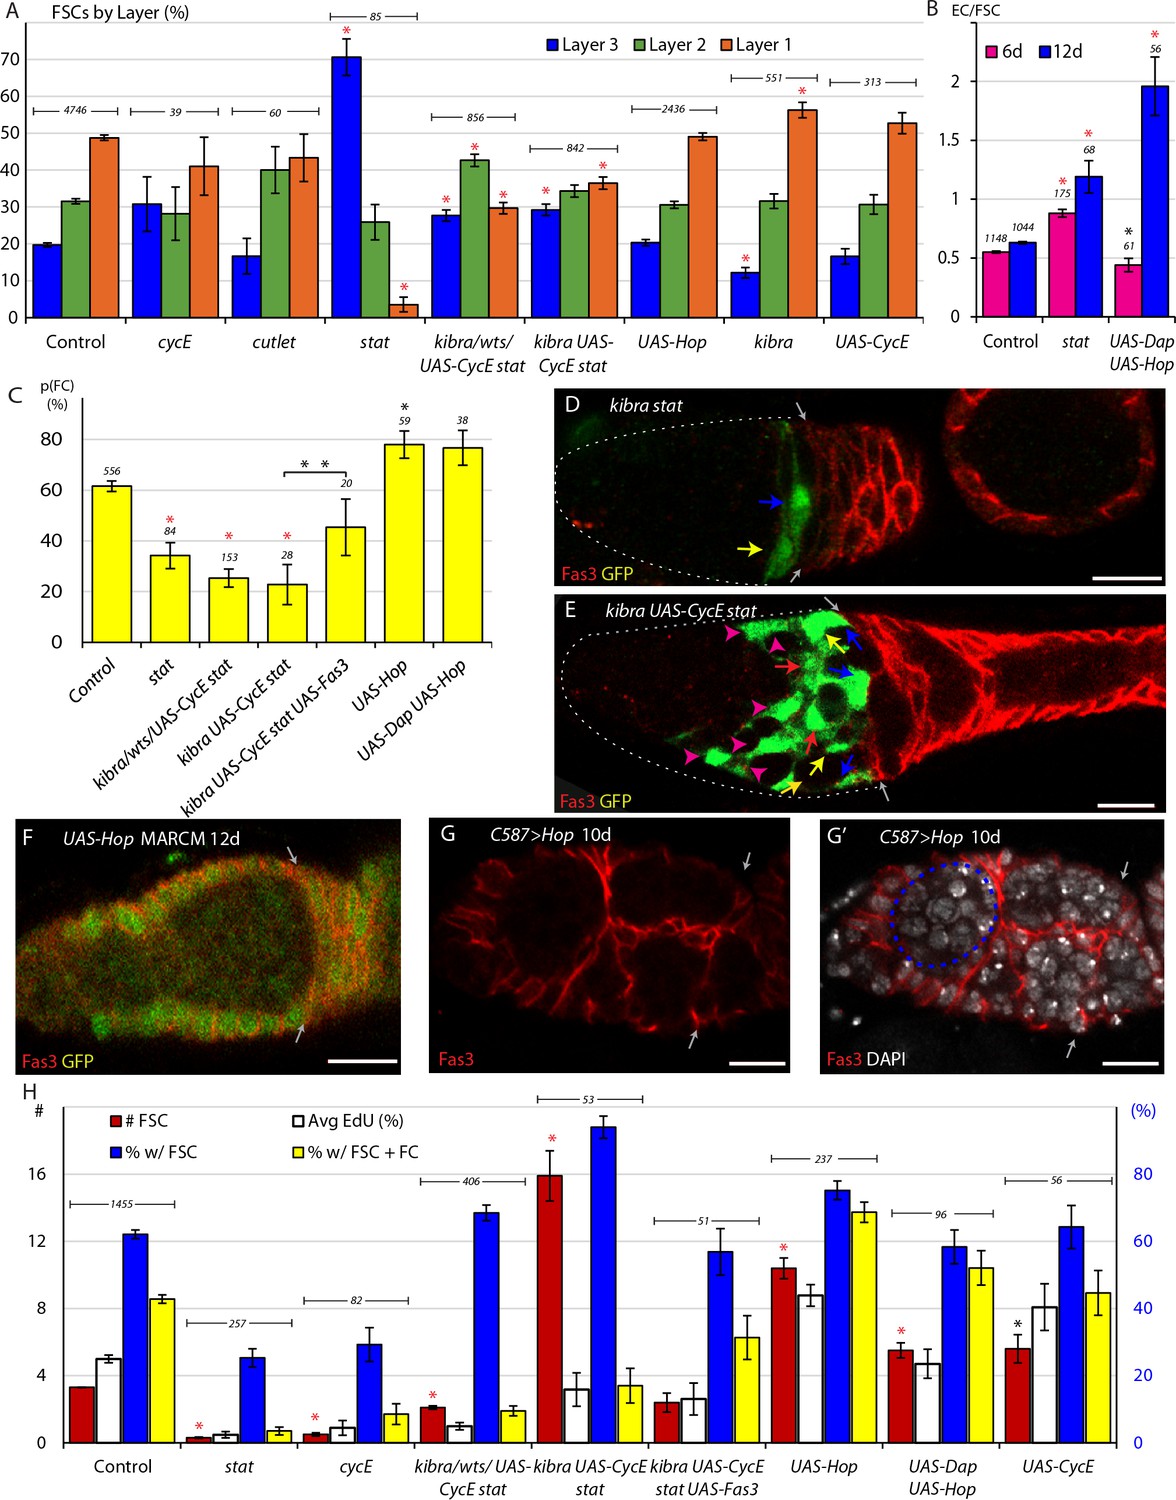
JAK-STAT signaling promotes conversion of FSCs to FCs.
(A) Relative frequency of marked FSCs in each layer for the indicated genotypes of MARCM lineages, with the number of total FSCs scored for each genotype and significant differences to control values (red asterisks, p<0.001). Here and elsewhere, ‘kibra/wts/UAS-CycE stat’ is the sum of all tests with kibra stat, wts stat and UAS-CycE stat. (B) ECs produced per anterior FSC from 0-6d (magenta) and 0-12d (blue) for the indicated MARCM lineage genotypes with the total number of relevant germaria scored and significant differences to control values (black asterisk, p<0.05, red asterisks, p<0.001). (C) Average probability of a layer 1 FSC becoming an FC during a single budding cycle for the indicated MARCM lineage genotypes with the number of informative germaria scored and significant differences to control values, or for the bracketed comparison (double asterisks) showing the impact of UAS-Fas3 (black asterisks, p<0.05, red asterisks, p<0.001). (D–E) Despite marked FSCs in layer 1 (blue arrows), and a significant number of layer 2 FSCs (yellow arrows), layer 3 FSCs (red arrows), and ECs (magenta arrowheads), marked FCs, posterior to the Fas3 (red) border (gray arrows) are absent here (and were generally rare) in kibra stat and kibra UAS-CycE stat MARCM lineages. (F–G) Increased JAK-STAT pathway activity induced ectopic anterior Fas3 (red) expression (F) cell autonomously in MARCM lineages (green) and (G–G’) in numerous cells anterior to the normal Fas3 border (arrows) when increased throughout the anterior germarium using C587-GAL4, sometimes partitioning single cysts, visualized by DAPI (white) nuclear staining, into egg chamber-like structures (dashed blue line). (H) Number of FSCs per germarium (red) using y-axis scale on the left, percentage of FSCs incorporating EdU (aggregating all layers, white), percentage of ovarioles with a marked FSC (blue) and percentage of ovarioles with a marked FSC and marked FCs (yellow) (percentage y-axis scale in blue on the right) for the indicated genotypes, with the number of germaria scored at 12d (EdU was scored at 6d with n reported in (A)) and significant differences for FSC numbers compared to control values (black asterisks, p<0.05, red asterisks, p<0.001). All scale bars are 10 μm.
-
Figure 3—source data 1
Numerical data for graphs in Figure 3.
- https://cdn.elifesciences.org/articles/61204/elife-61204-fig3-data1-v2.xlsx
Figure 4
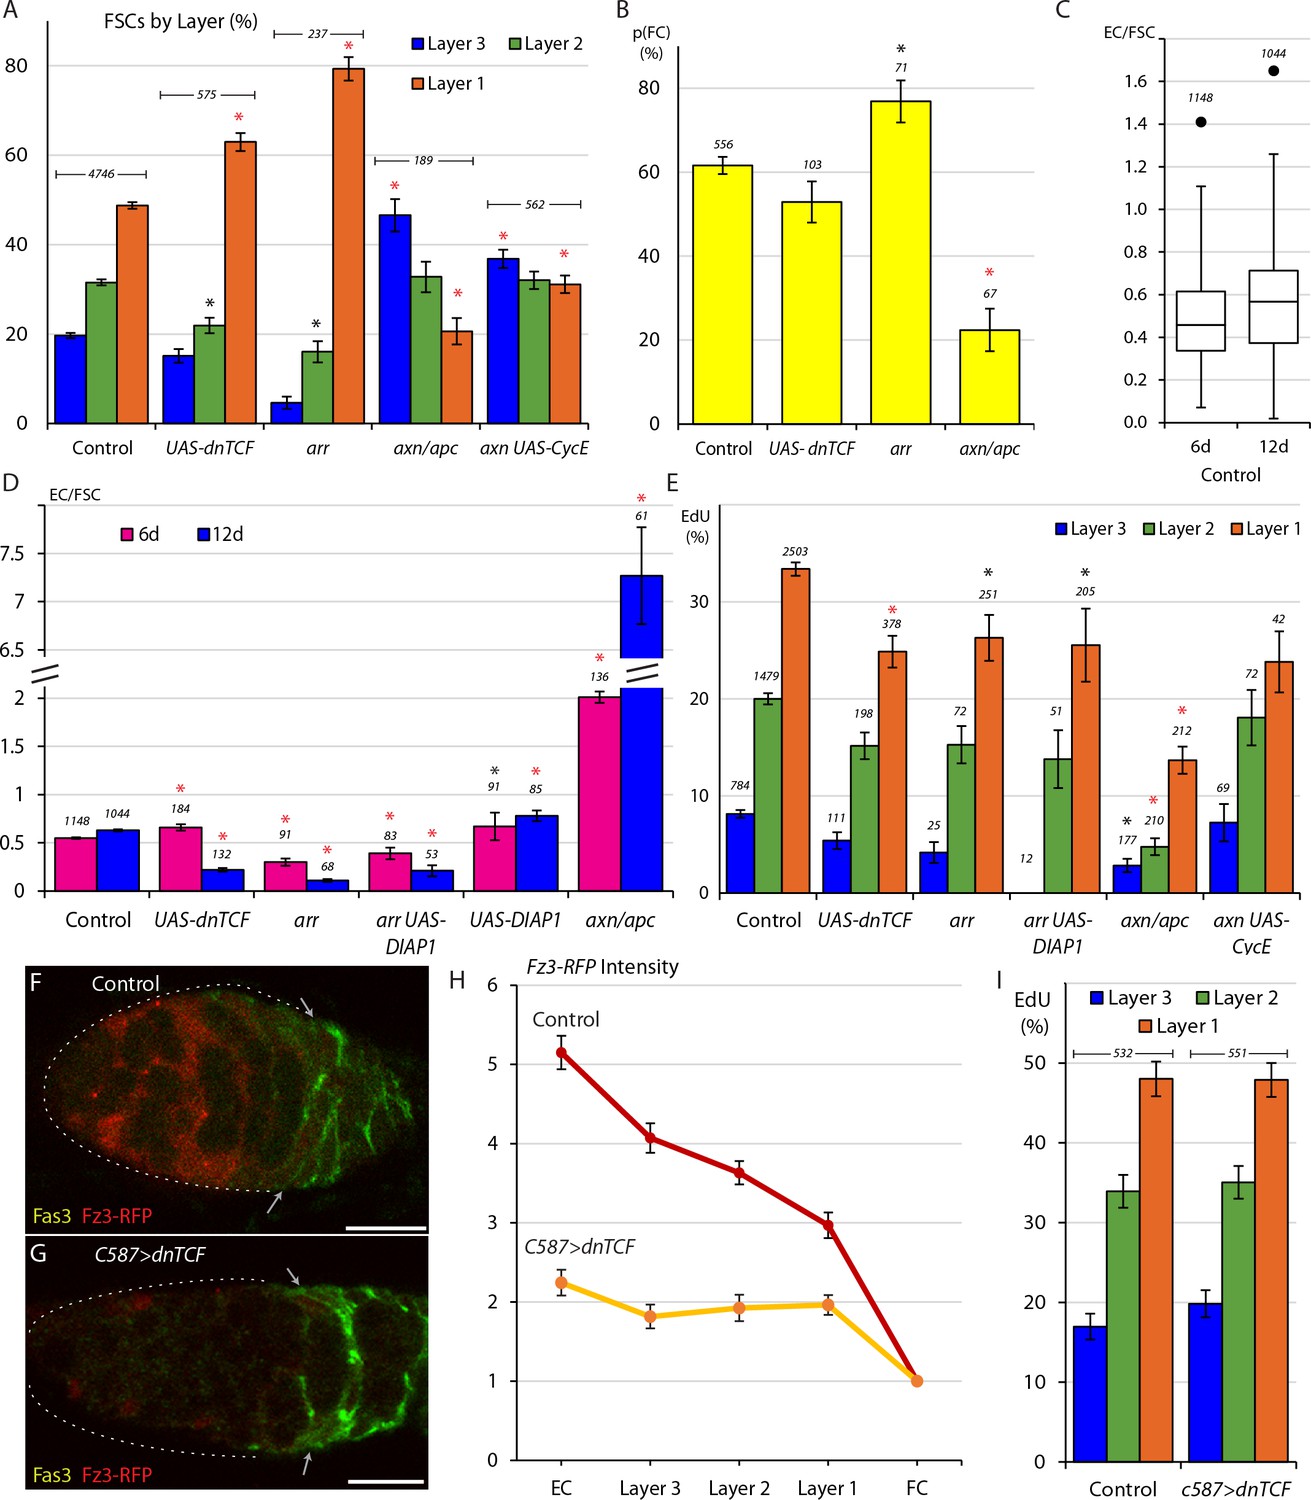
Wnt signaling opposes FC production and promotes anterior FSC location and EC production.
(A) Relative frequency of marked FSCs in each layer for the indicated genotypes of MARCM lineages, with the number of total FSCs scored for each genotype and significant differences to control values (black asterisks, p<0.05, red asterisks, p<0.001). (B) Average probability of a layer 1 FSC becoming an FC during a single budding cycle for the indicated MARCM lineage genotypes with the number of informative germaria scored and significant differences to control values (black asterisks, p<0.05, red asterisks, p<0.001). (C) Box-and-whisker plot (median, first and third quartile, minimum and maximum) of ECs produced per anterior FSC from 0-6d and 0-12d across all MARCM controls (n = 31 experiments) with a single outlier and the number of germaria scored. (D) ECs produced per anterior FSC from 0-6d (magenta) and 0-12d (blue) for the indicated MARCM lineage genotypes with the total number of informative germaria scored and significant differences to control values (black asterisks, p<0.05, red asterisks, p<0.001). (E) EdU incorporation frequency into FSCs of layers 1–3 and ECs for the indicated genotypes of MARCM lineages with number of cells scored above each column and significant differences between FSC layers indicated (black asterisks, p<0.05, red asterisks, p<0.001). The statistical significance of the EdU index of each FSC layer as a fraction of overall EdU index relative to controls was also calculated for all genotypes. No significant differences were found, indicating a gradient of EdU incorporation that is not significantly different from controls. (F–G) Fz3-RFP reporter of Wnt pathway activity (red) (F) normally declines in strength from anterior to posterior but (G) was mostly eliminated after 3d of UAS-dnTCF expression with C587-GAL4. (H) Average Fz3-RFP intensity for control (n = 23 germaria) and C587>dnTCF (n = 22 germaria) genotypes. (I) EdU incorporation frequency into FSCs in layers 1–3 for the indicated genotypes (number of DAPI-labeled nuclei scored is above each column). The statistical significance of the EdU index of each FSC layer as a fraction of overall EdU index relative to controls was also calculated for C587>dnTCF. No significant differences were found, indicating a gradient of EdU incorporation that is not significantly different from controls. All scale bars are 10 μm.
-
Figure 4—source data 1
Numerical data for graphs in Figure 4.
- https://cdn.elifesciences.org/articles/61204/elife-61204-fig4-data1-v2.xlsx
Figure 5 with 3 supplements
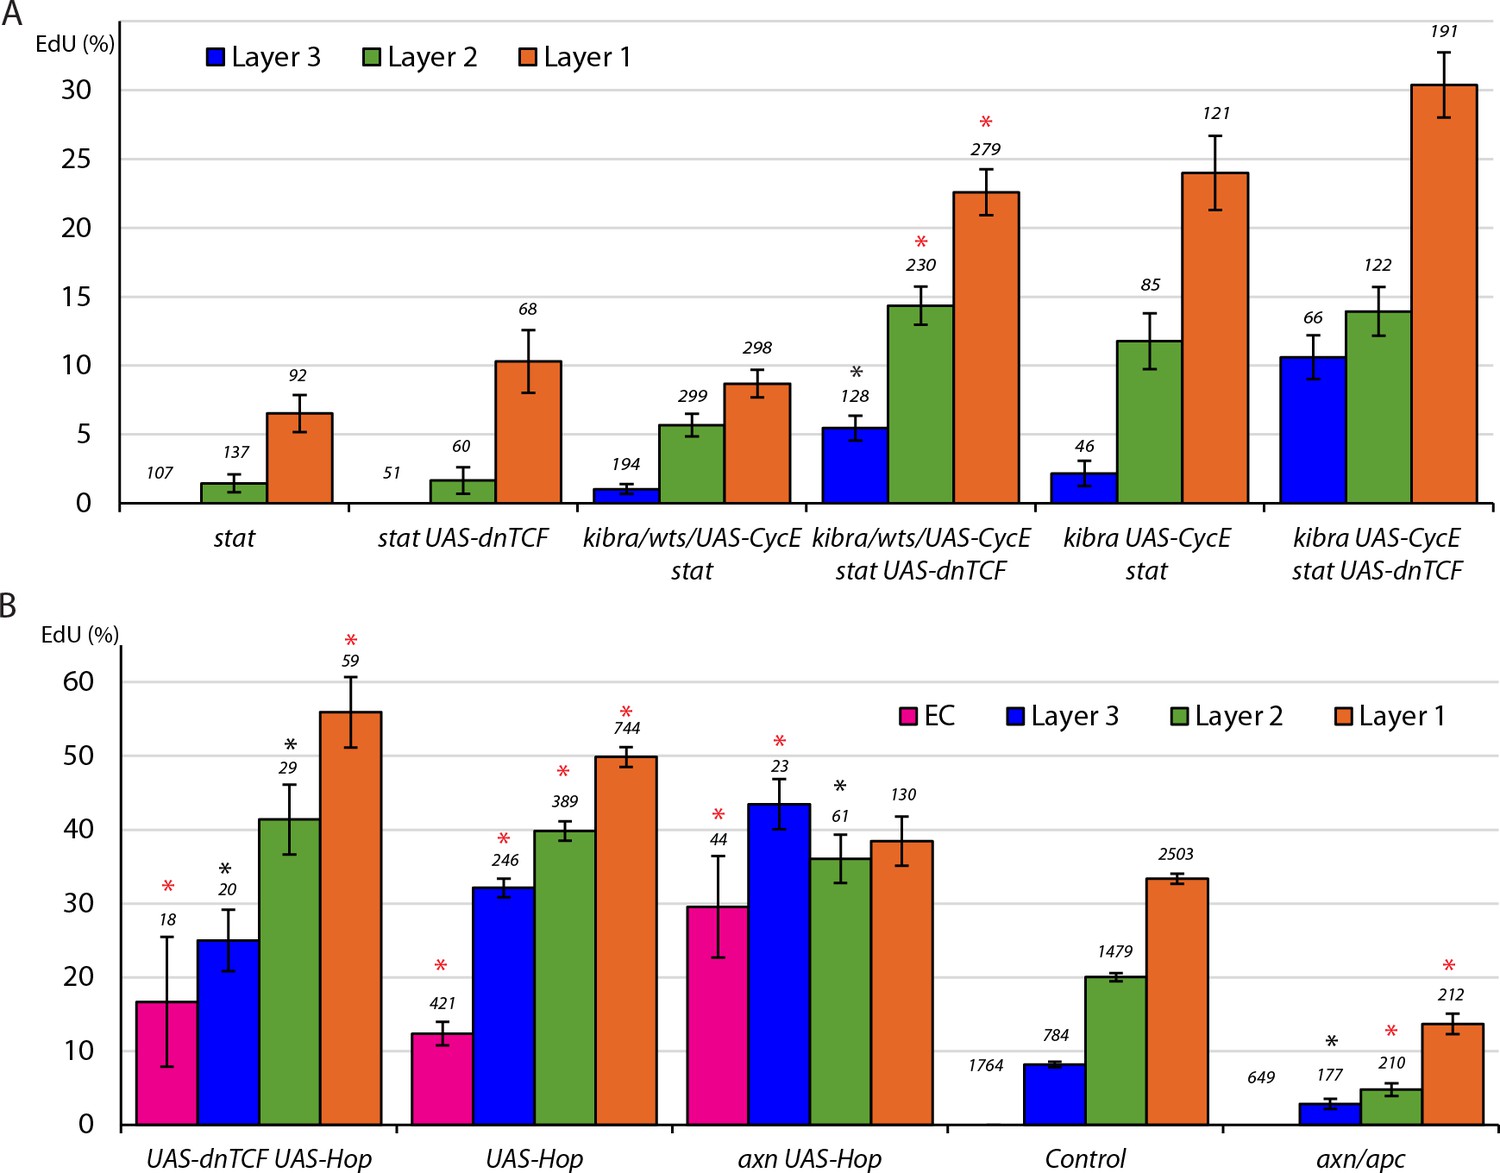
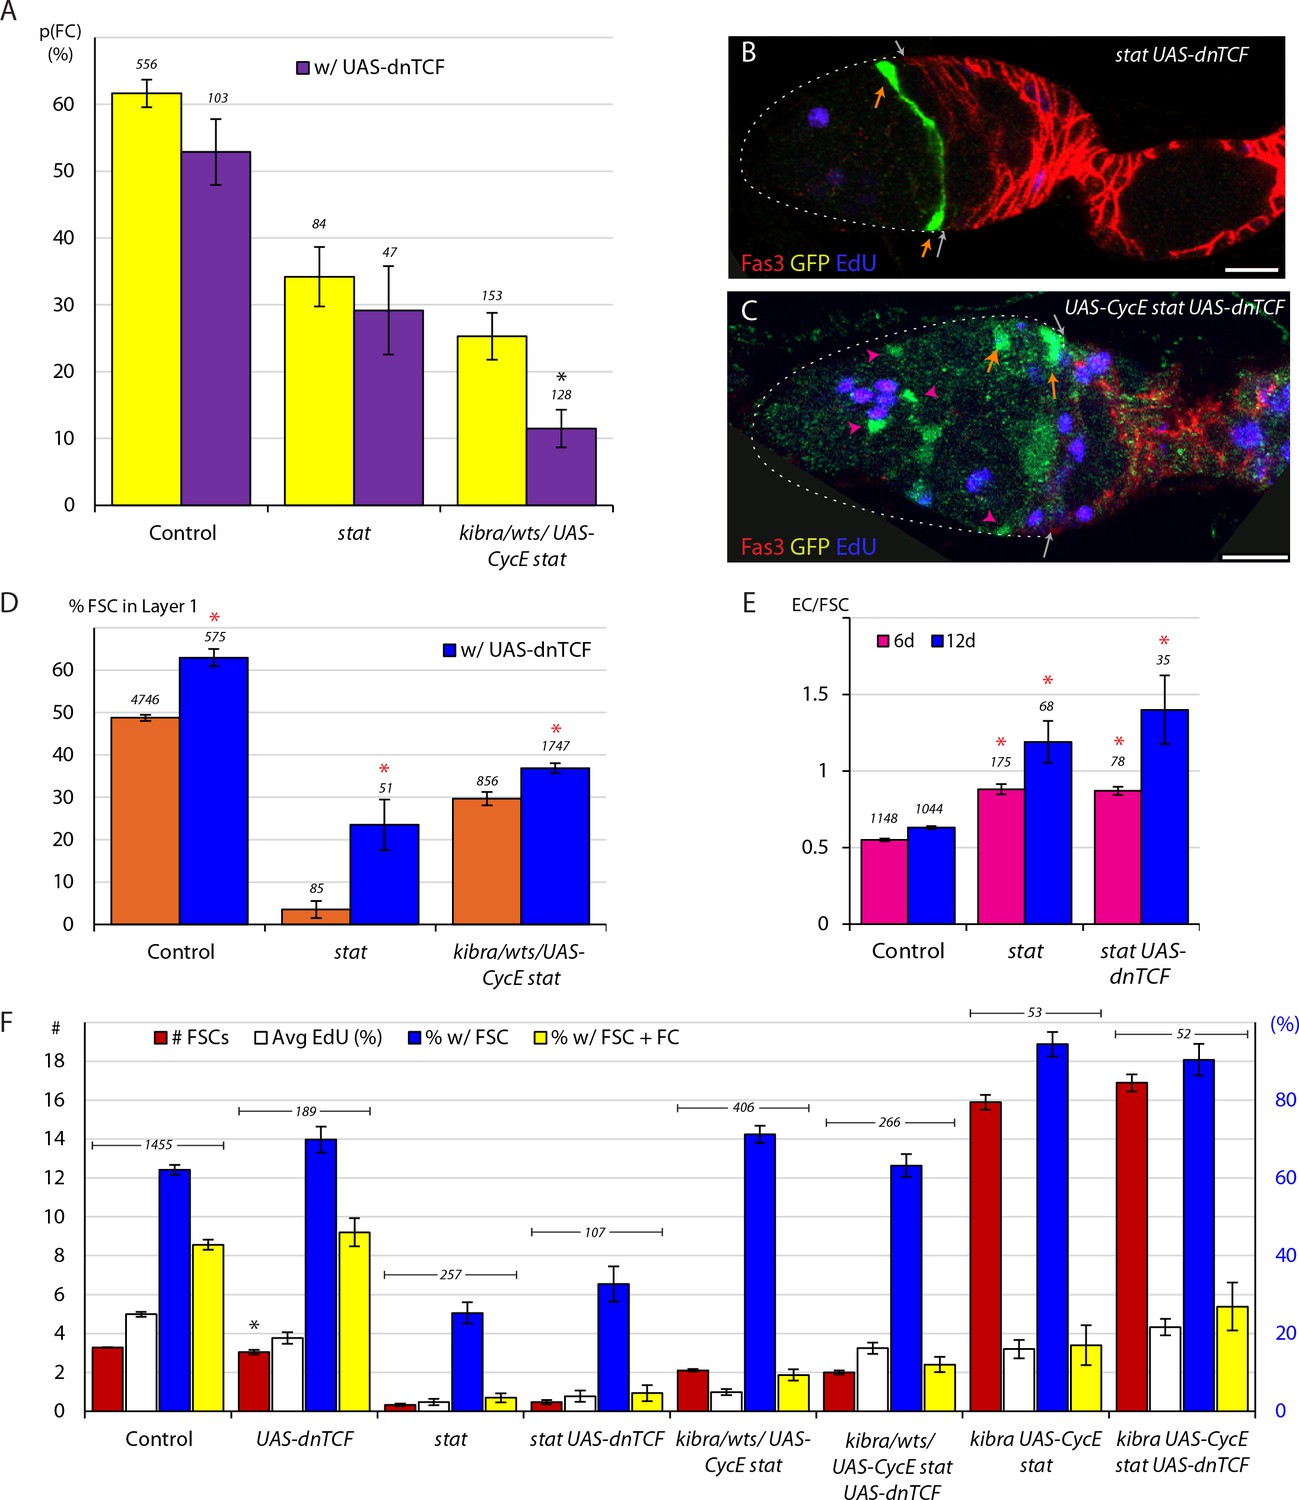
Wnt pathway activity reduces FSC division only in the absence of JAK-STAT pathway activity and JAK-STAT overrides inhibition by the Wnt pathway when both are in excess.
(A, B) EdU incorporation frequency into FSCs of layers 1–3 and ECs for the indicated genotypes of MARCM lineages with number of cells scored above each column. (A) Significant differences between genotypes with and without UAS-dnTCF (black asterisks, p<0.05, red asterisks, p<0.001) are indicated for individual FSC layers. The statistical significance of the EdU index of each FSC layer as a fraction of overall EdU index relative to controls was also calculated for all genotypes. No significant differences were found, indicating a gradient of EdU incorporation that is not significantly different from controls. (B) Significant differences from control values are indicated for each FSC layer (black asterisks, p<0.05, red asterisks, p<0.001). See also Figure 5—figure supplements 1–3.
-
Figure 5—source data 1
Numerical data for graphs in Figure 5.
- https://cdn.elifesciences.org/articles/61204/elife-61204-fig5-data1-v2.xlsx
Figure 5—figure supplement 1
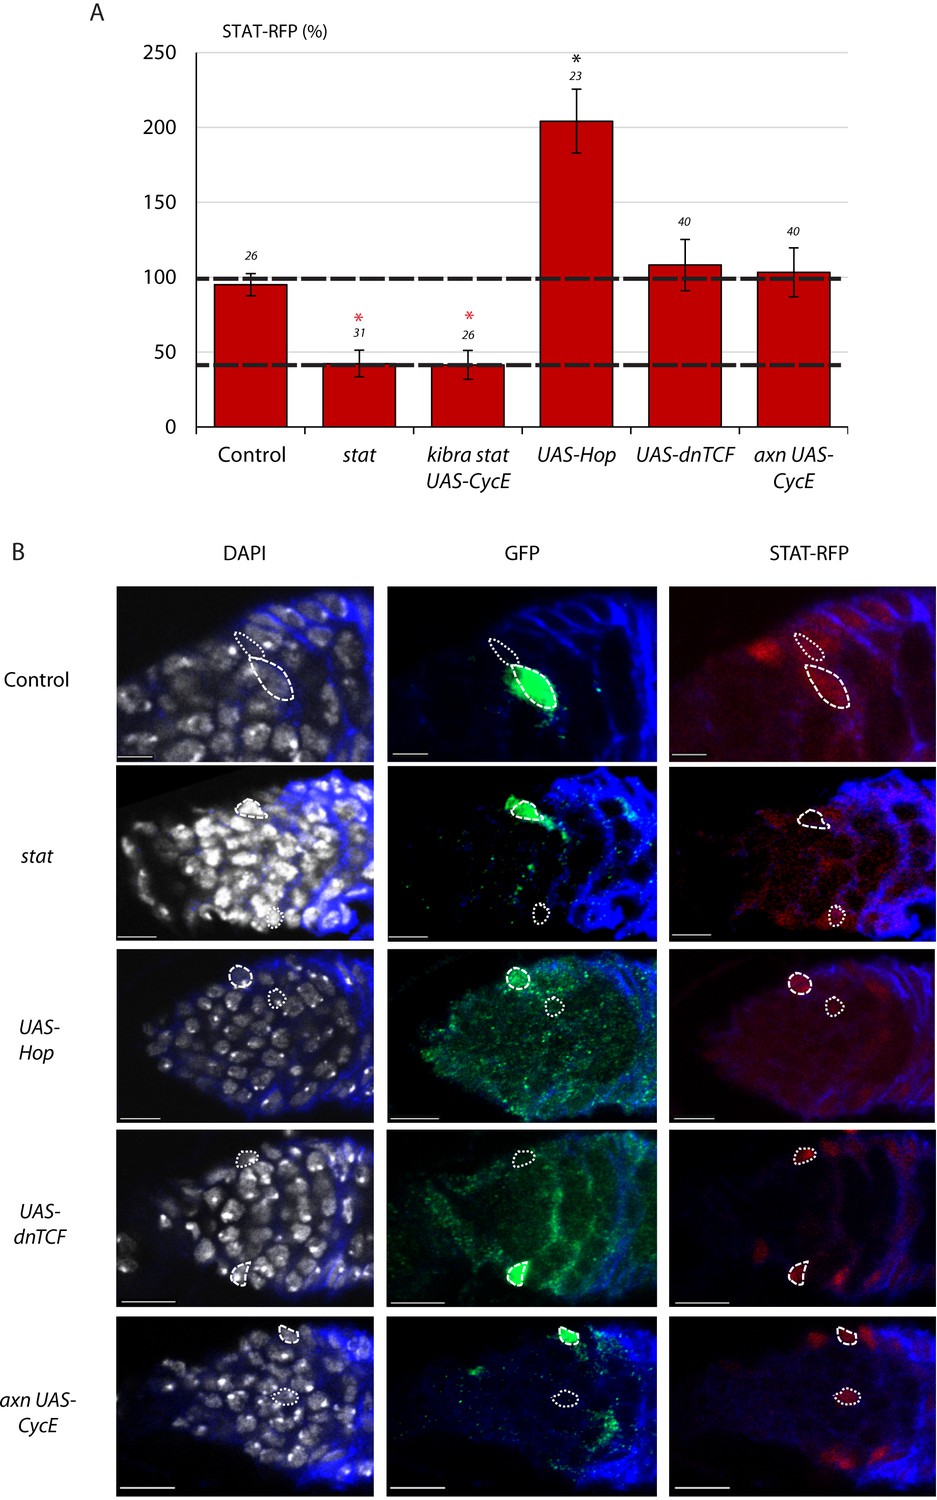
STAT-RFP intensity is not affected by Wnt pathway activity.
(A) Average STAT-RFP JAK-STAT pathway reporter intensity in MARCM lineages of the indicated genotypes compared to unmarked neighbors at the same AP location and in the same z-section (set at 100% and indicated by the dashed line) with the number of cells measured above the columns. A second dashed line (at 39%) represents the RFP intensity observed in stat mutant cells, which are expected to have no JAK-STAT pathway activity (39%). (B) Images showing the outlines of GFP-positive cells (long dashed line) of the indicated genotypes and their unmarked neighbor (short dashed line) traced from DAPI nuclear staining (white) to evaluate STAT-RFP (red) intensity. Fas3 (blue) and all scale bars are 10 μm.
-
Figure 5—figure supplement 1—source data 1
Numerical data for graphs in Figure 5—figure supplement 1.
- https://cdn.elifesciences.org/articles/61204/elife-61204-fig5-figsupp1-data1-v2.xlsx
Figure 5—figure supplement 2
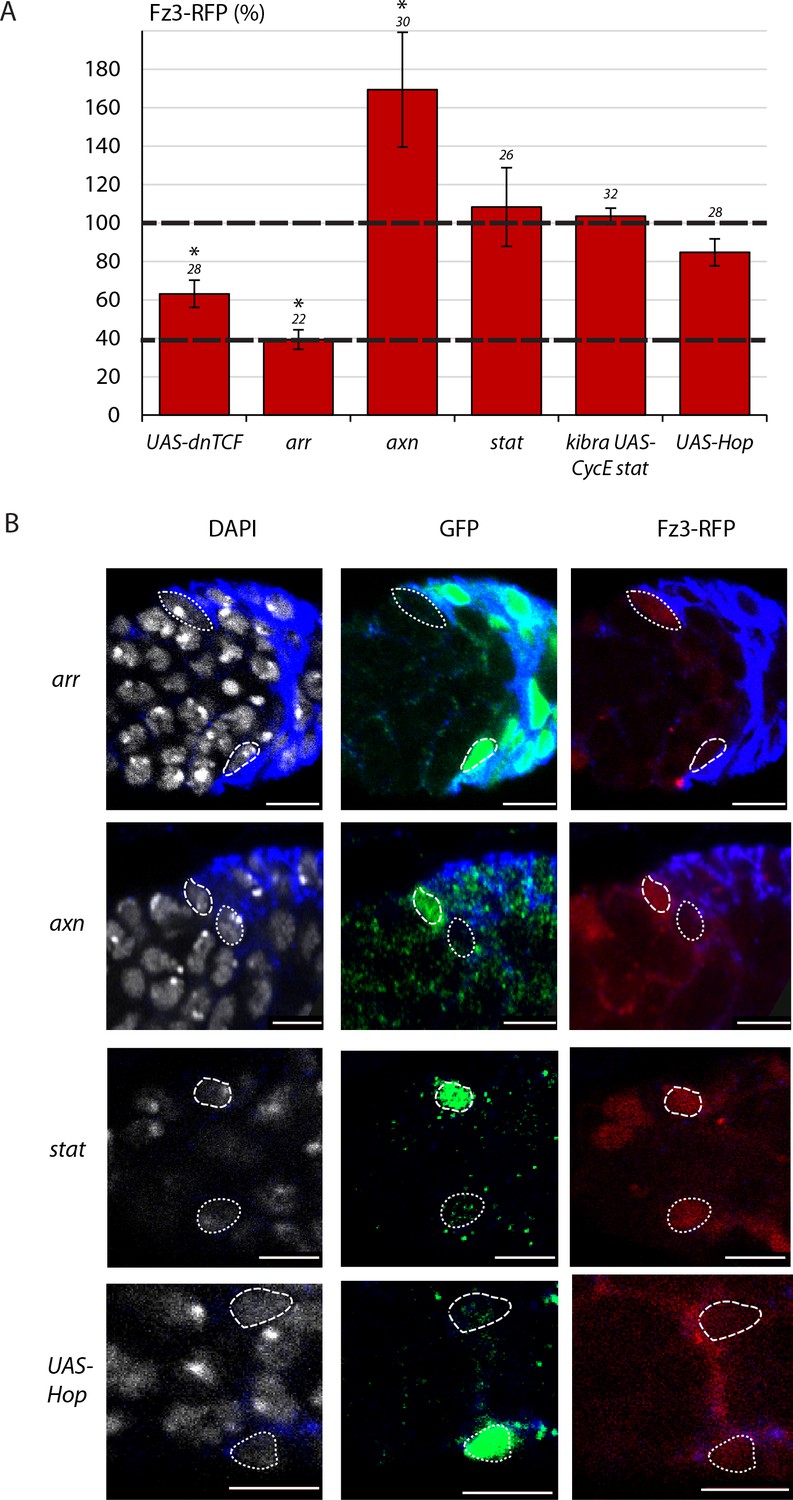
Fz3-RFP intensity is not affected by JAK-STAT pathway activity.
(A) Average Fz3-RFP Wnt pathway reporter intensity in MARCM lineages of the indicated genotypes compared to unmarked neighbors at the same AP location and in the same z-section (set at 100% and indicated by the dashed line) with the number of cells measured above the columns. A second dashed line (at 39%) represents the RFP intensity observed in arr mutant cells, which are expected to have no Wnt pathway activity (39%). (B) Images showing the outlines of GFP-positive cells (long dashed line) of the indicated genotypes and their unmarked neighbor (short dashed line) traced from DAPI nuclear staining (white) to evaluate Fz3-RFP (red) intensity. Fas3 (blue) and all scale bars are 10 μm.
-
Figure 5—figure supplement 2—source data 1
Numerical data for graphs in Figure 5—figure supplement 2.
- https://cdn.elifesciences.org/articles/61204/elife-61204-fig5-figsupp2-data1-v2.xlsx
Figure 5—figure supplement 3
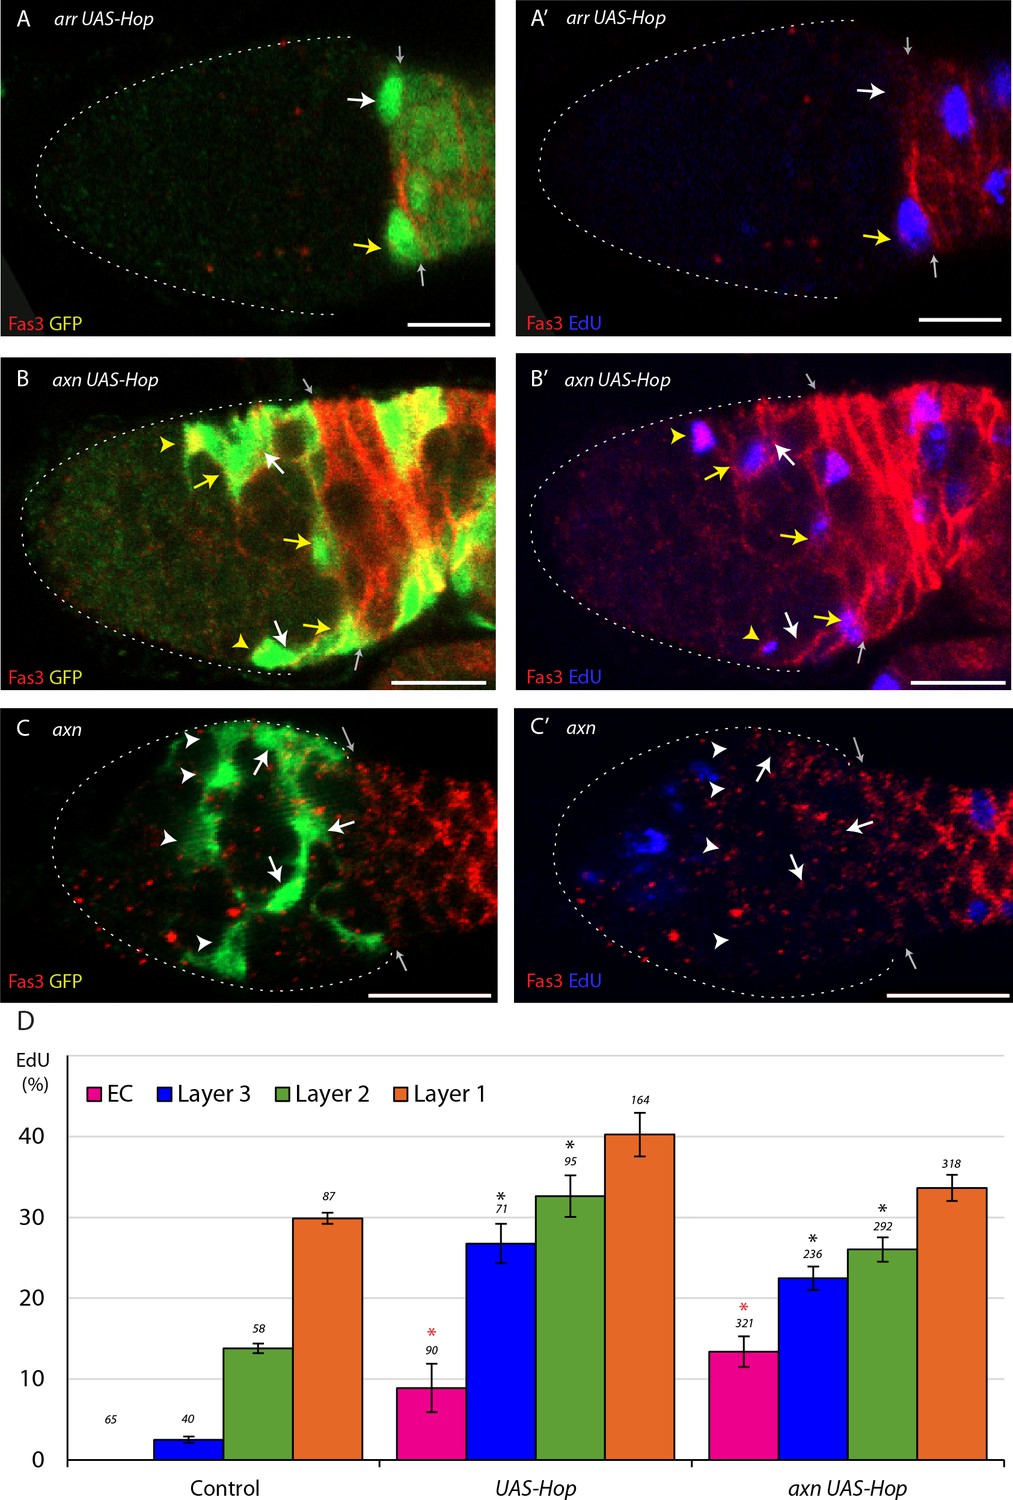
Increased JAK-STAT signaling promotes FSC division even when Wnt pathway activity is altered.
(A–C) EdU (blue) incorporation into MARCM FSC lineages 6d after clone induction with anterior border of Fas3 (red) marked (gray arrows), showing (A–C) GFP and (A’–C’) EdU channels separately. The proportion of marked FSCs with EdU (yellow arrows) compared to those without EdU (white arrows) was (A, B) higher than controls for arr and axn genotypes with UAS-Hop and (C) lower than controls for axn with no alteration of JAK-STAT signaling. All scale bars are 10 μm. (D) EdU incorporation frequency at 6d after heat shock into FSCs of layers 1–3 and ECs for the indicated genotypes of MARCM lineages with number of cells scored above each column and significant differences from control values (black asterisks, p<0.05, red asterisks, p<0.001). These experiments were performed at 22°C so that UAS-Hop expression was lower than for results shown in Figure 5. Only experiments for axn UAS-Hop performed at 22C could be scored for FSC numbers at 12d (data presented in Figure 6H).
-
Figure 5—figure supplement 3—source data 1
Numerical data for graphs in Figure 5—figure supplement 3.
- https://cdn.elifesciences.org/articles/61204/elife-61204-fig5-figsupp3-data1-v2.xlsx
Figure 6 with 2 supplements
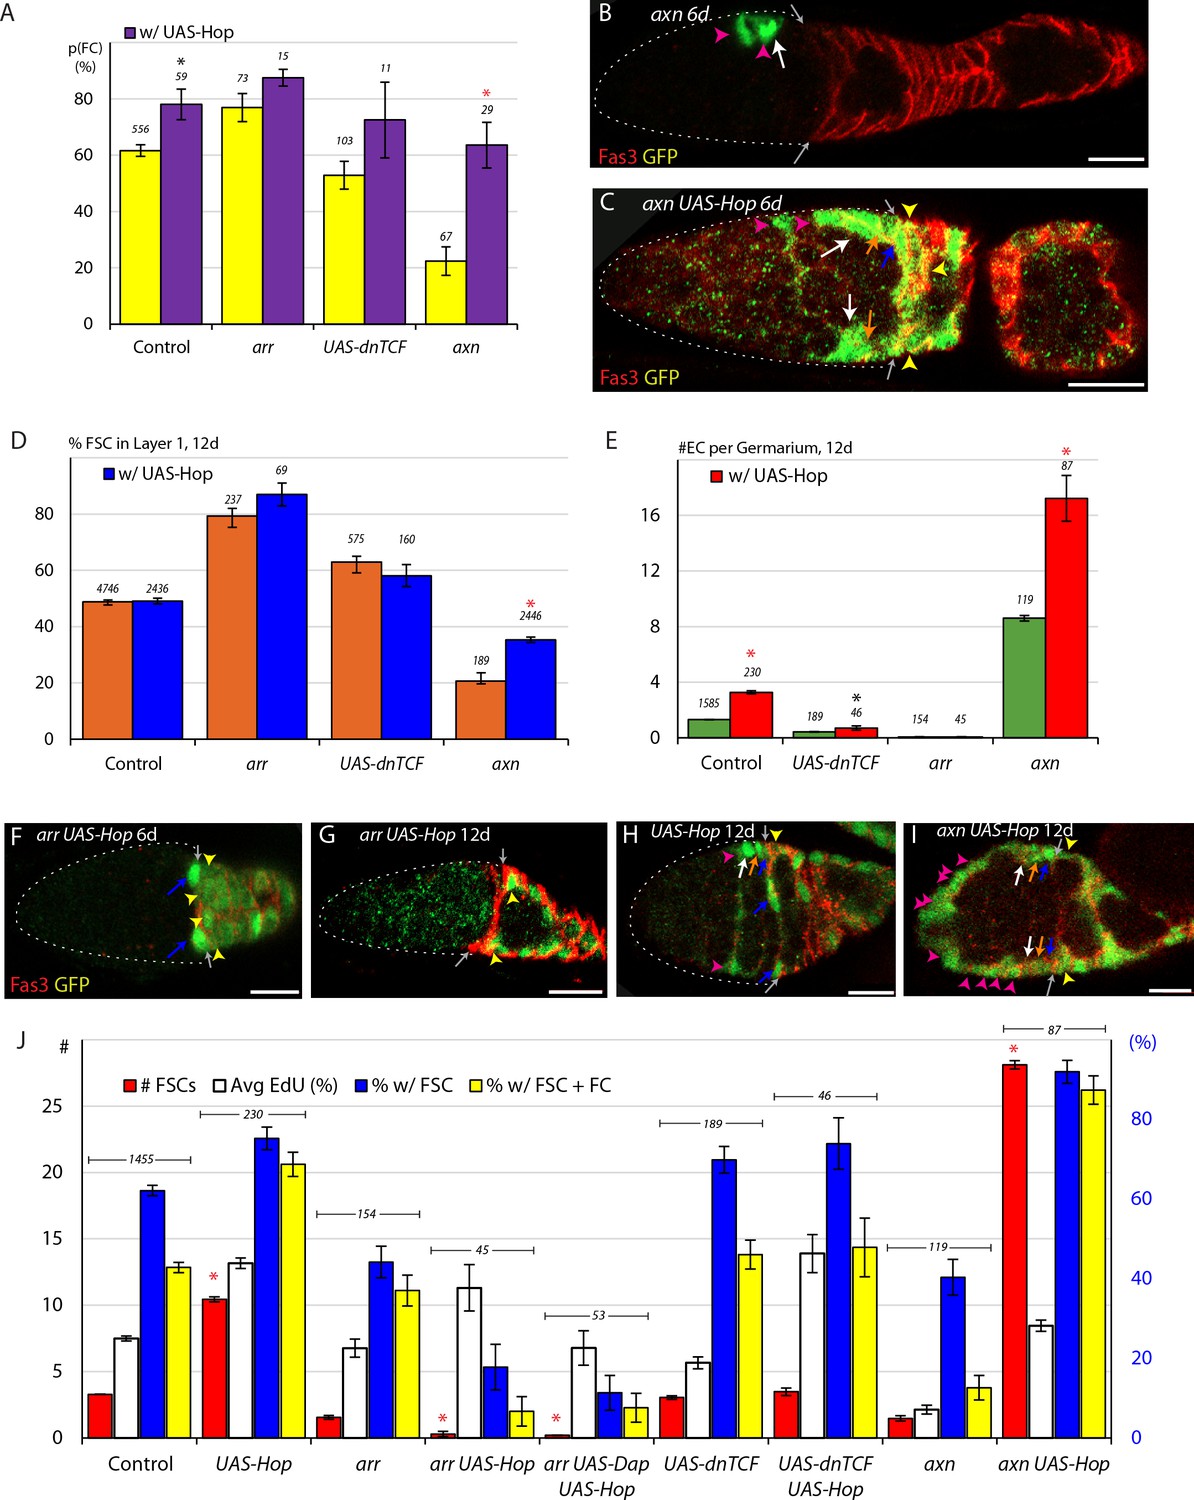
Promotion of FC production by the JAK-STAT pathway overrides the opposing influence of increased Wnt pathway activity and synergizes with loss of Wnt pathway activity to cause dramatic loss of highly proliferative FSCs.
(A) Average probability of a layer 1 FSC becoming an FC during a single budding cycle for the indicated MARCM lineage genotypes with the number of informative germaria scored and significant differences resulting from the presence (purple) of UAS-Hop (black asterisks, p<0.05, red asterisks, p<0.001). (B, C) axn mutant MARCM lineages (green) at 6d, with the Fas3 (red) anterior border (gray arrows indicated) generally include, as here, anterior FSCs (layer 3, white arrows), and ECs (magenta arrowheads) but (C) addition of UAS-Hop resulted in more marked FSCs, including layer 1 (blue arrows) and layer 2 (orange arrows) FSCs, and marked FCs (yellow arrowheads). (D) Proportion of FSCs in layer one for the indicated MARCM lineage genotypes, with the number of FSCs scored and significant differences resulting from the presence (blue) of UAS-Hop (red asterisks, p<0.001). (E) Number of ECs per germarium for the indicated MARCM lineage genotypes at 12d, with the number of germaria scored and significant differences resulting from the presence (red) of UAS-Hop (black asterisks, p<0.05, red asterisks, p<0.001). (F–I) MARCM lineages (green) with the Fas3 (red) anterior border indicated (gray arrows), commonly showed, as here, (F) only layer 1 FSCs (blue arrows) and FCs (immediate FCs, yellow arrowheads) for arr UAS-Hop at 6d and (G) loss of FSCs, leaving only labeled FCs (yellow arrowheads) by 12d and (H, I) a large increase of labeled cells in EC locations (magenta arrowheads) when Wnt pathway activity is increased (axn) on top of increased JAK-STAT pathway (UAS-Hop), supplementing the many labeled FSCs in layers 1 (blue arrows), 2 (orange arrows) and 3 (white arrows) and FCs (yellow arrowheads). (J) Number of FSCs per germarium (red) using y-axis scale on the left, percentage of FSCs incorporating EdU (aggregating all layers, white), percentage of ovarioles with a marked FSC (blue) and percentage of ovarioles with a marked FSC and marked FCs (yellow) (percentage y-axis scale in blue on the right) for the indicated genotypes, with the number of germaria scored at 12d (EdU was scored at 6d) and significant differences for the number of FSCs (red asterisks, p<0.001) compared between genotypes with and without UAS-Hop. All scale bars are 10 μm. See also Figure 6—figure supplements 1–2.
-
Figure 6—source data 1
Numerical data for graphs in Figure 6.
- https://cdn.elifesciences.org/articles/61204/elife-61204-fig6-data1-v2.xlsx
Figure 6—figure supplement 1
Decreasing Wnt signaling increases FSC division and posterior location but does not strongly alter loss of FC production or increased FC production in the absence of JAK-STAT signaling.
(A) Average probability of a layer 1 FSC becoming an FC during a single budding cycle for the indicated MARCM lineage genotypes with the number of informative germaria scored and significant differences resulting from the presence (purple) of UAS-dnTCF (black asterisks, p<0.05). (B, C) Reduction of Wnt signaling with UAS-dnTCF increased the very low incorporation of EdU (blue) into (B) stat and (C) UAS-CycE stat mutant FSC lineages (green). GFP-positive cells with EdU (orange arrows) and without EdU (blue arrow) are indicated together with the Fas3 (red) anterior border (gray arrows). (D) Proportion of FSCs in layer one for the indicated MARCM lineage genotypes, with the number of FSCs scored and significant differences resulting from the presence (blue) of UAS-dnTCF (red asterisks, p<0.001). (E) ECs produced per anterior FSC from 0-6d (magenta) and 0-12d (blue) for the indicated MARCM lineage genotypes with the total number of informative germaria scored and significant differences from control values indicated (red asterisks, p<0.001). (F) Number of FSCs per germarium (red) using y-axis scale on the left, percentage of FSCs incorporating EdU (aggregating all layers, white), percentage of ovarioles with a marked FSC (blue) and percentage of ovarioles with a marked FSC and marked FCs (yellow) (percentage y-axis scale in blue on the right) for the indicated genotypes, with the number of germaria scored at 12d (EdU was scored at 6d) and significant differences for the number of FSCs (black asterisks, p<0.05) compared between genotypes with and without UAS-dnTCF. All scale bars are 10 μm.
-
Figure 6—figure supplement 1—source data 1
Numerical data for graphs in Figure 6—figure supplement 1.
- https://cdn.elifesciences.org/articles/61204/elife-61204-fig6-figsupp1-data1-v2.xlsx
Figure 6—figure supplement 2

Excess JAK-STAT pathway activity promotes conversion of layer 1 FSCs to FCs even when Wnt pathway activity is increased.
Average probability of a layer 1 FSC becoming an FC during a single budding cycle for the indicated MARCM lineage genotypes with the number of informative germaria scored. This experiment was performed at 22°C; the same genotypes were tested at 25°C with results shown in Figure 6A.
-
Figure 6—figure supplement 2—source data 1
Numerical data for graphs in Figure 6—figure supplement 2.
- https://cdn.elifesciences.org/articles/61204/elife-61204-fig6-figsupp2-data1-v2.xlsx
Figure 7
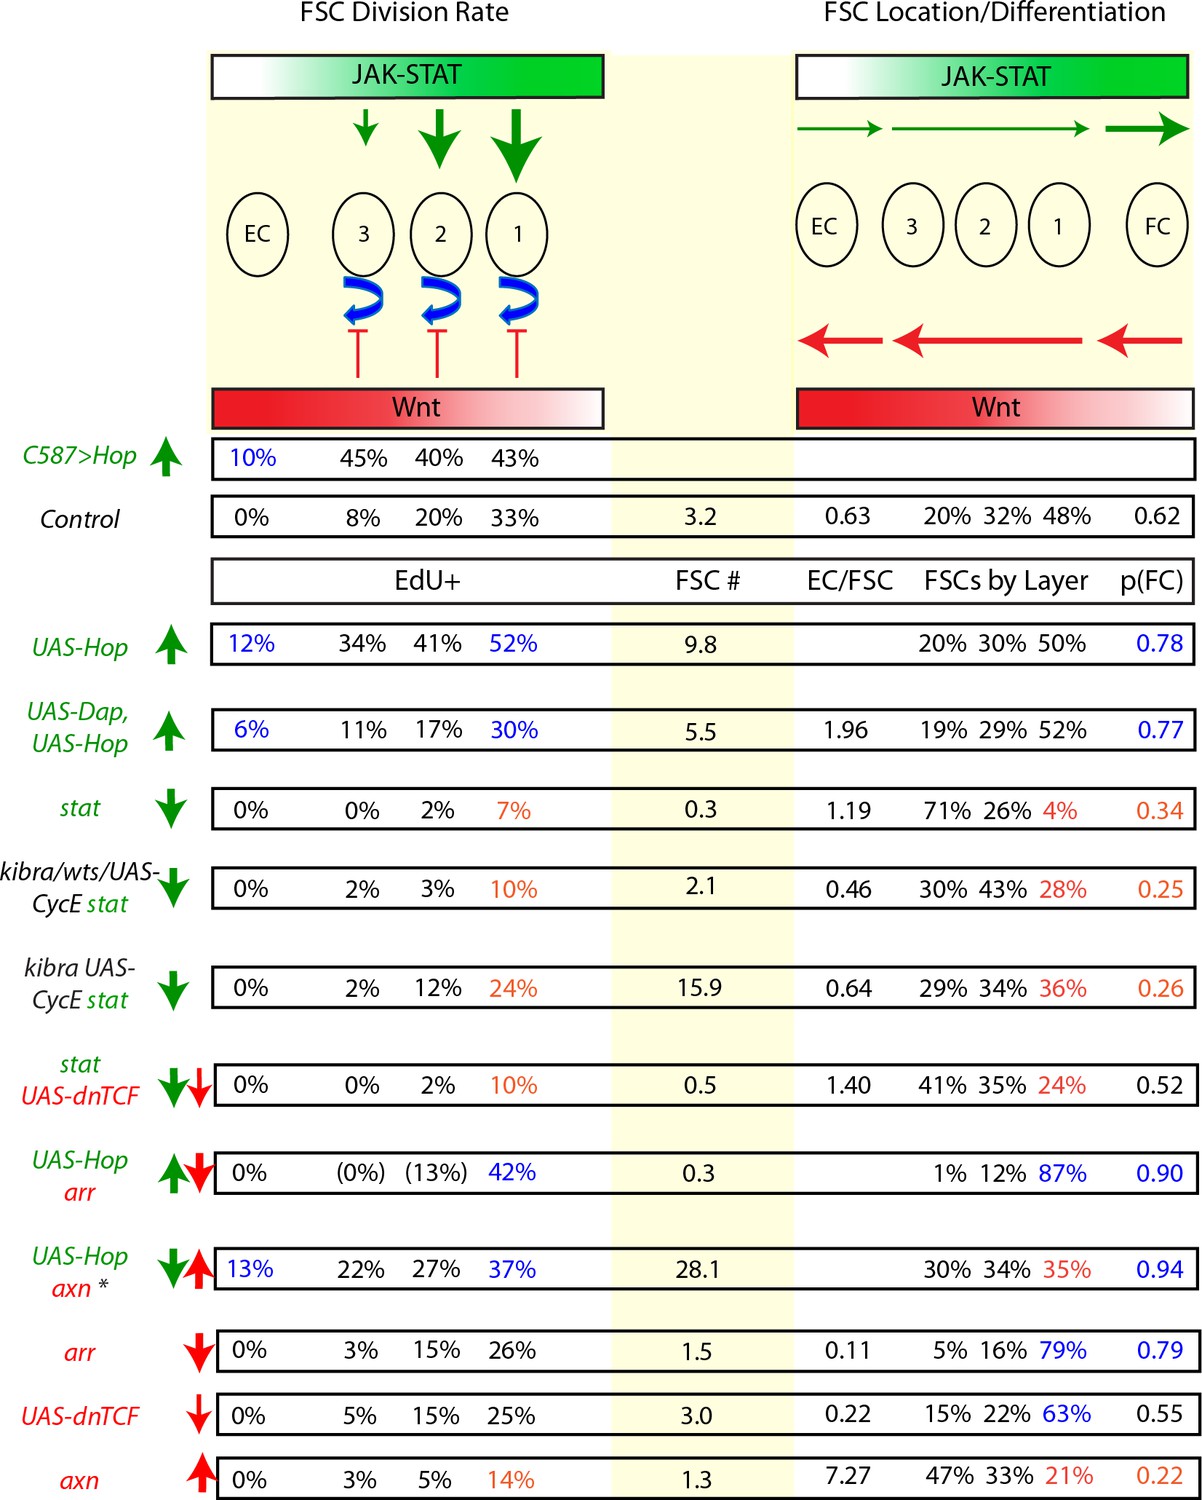
Summary of the cell autonomous influences of JAK-STAT and Wnt pathway magnitudes on FSC behavior.
Diagrammatic summary of key results supporting inferences of how graded JAK-STAT (green shading) and Wnt (red shading) pathways regulate the division rates of ECs and FSCs in layers 1–3 (left) and the location of FSCs among layers 1–3, the conversion of anterior FSCs to ECs and posterior FSCs to FCs (right). The central column shows the average number of marked FSCs per germarium at 12d in MARCM tests. Genotypes at the extreme left are paired with vertical arrows indicating the direction (up/down) and magnitude (thickness) of JAK-STAT (green) and Wnt (red) pathway alterations. For the C587>Hop experiment only division rates were measured as the fraction of all FSCs in a given layer, or all ECs, incorporating EdU. Other tabulated values report the properties of marked cells in MARCM clones. Asterisk for axn UAS-Hop indicates results are for the test at 22C. Measurements of division rate in the EC region or any layer 1 FSC behavior (division rate, proportion of all FSCs or conversion to FCs) are highlighted by colored text if there was a notable increase (blue) or decrease (orange). JAK-STAT signaling promotes FSC division in proportion to graded pathway activity (green vertical arrows, top), while Wnt pathway activity only inhibits division (red verticals) under artificial conditions of increased Wnt signaling or elimination of JAK-STAT pathway activity. FC production from posterior FSCs is promoted by JAK-STAT (horizontal green arrow) and by elimination of Wnt pathway activity (reverse horizontal red arrow). Consequently, stat mutant FSCs were maintained better than expected from their greatly reduced division rates but FSCs with high JAK-STAT activity and no Wnt pathway activity were rapidly drained despite high division rates. Increased Wnt pathway activity always favored more anterior FSC locations and EC production (12d EC/aFSC values are shown) from anterior FSCs (horizontal red arrows), and generally had a stronger influence than the opposing influence of JAK-STAT in anterior regions (thinner green reverse horizontal arrows). By contrast, increased JAK-STAT activity overcame the influence of increased Wnt pathway activity on conversion of FSCs to FCs at the posterior of the FSC domain. Values for EdU in parentheses for arr UAS-Hop indicate unreliable values because only a very low number of FSCs were present in those locations (n < 10).
Tables
Key resources table
| Reagent type (species) or resource | Designation | Source or reference | Identifiers | Additional information |
|---|---|---|---|---|
| Gene (D. melanogaster) | cycE | Flybase ID: FBgn0010382 | CG3938 | |
| Gene (D. melanogaster) | cutlet | Flybase ID: FBgn0015376 | CG33122 | |
| Gene (D. melanogaster) | hop | Flybase ID: FBgn0004864 | CG1594 | |
| Gene (D. melanogaster) | dap | Flybase ID: FBgn0010316 | CG1772 | |
| Gene (D. melanogaster) | pan (TCF) | Flybase ID: FBgn0085432 | CG34403 | |
| Gene (D. melanogaster) | sha | Flybase ID: FBgn0003382 | CG13209 | |
| Gene (D. melanogaster) | arr | Flybase ID: FBgn0000119 | CG5912 | |
| Gene (D. melanogaster) | stat | Flybase ID: FBgn0016917 | CG4257 | |
| Gene (D. melanogaster) | axn | Flybase ID: FBgn0026957 | CG7926 | |
| Gene (D. melanogaster) | apc1 | Flybase ID: FBgn0015589 | CG1451 | |
| Gene (D. melanogaster) | apc2 | Flybase ID: FBgn0026598 | CG6193 | |
| Gene (D. melanogaster) | kibra | Flybase ID: FBgn0262127 | CG33967 | |
| Gene (D. melanogaster) | wts | Flybase ID: FBgn0011739 | CG12072 | |
| Genetic Reagent (D. melanogaster) | hs-flp | PMID:7867064 | FBti0002738 | hsp70-driven Flp recombinase on X |
| Genetic Reagent (D. melanogaster) | NM FRT40A | BDSC BL-1835 | Control for MARCM clones | |
| Genetic Reagent (D. melanogaster) | FRT42D ubi-GFP | BDSC BL-5626 | Control for MARCM clones | |
| Genetic Reagent (D. melanogaster) | FRT82B NM | PMID:23079600 | Control for MARCM clones | |
| Genetic Reagent (D. melanogaster) | C587-GAL4 | BDSC BL-67747 | FBti0037960 | GAL4 expressed in ECs and FSCs |
| Genetic Reagent (D. melanogaster) | UAS-dnTCF | BDSC BL-4784 BDSC BL-4785 | FBtp0012500 | Dominant-negative TCF on 2nd (4784) and 3rd (4785) chromosome |
| Genetic Reagent (D. melanogaster) | UAS-dap | PMID:10790398 | FBtp0001369 | Inhibitor of CycE/Cdk2 |
| Genetic Reagent (D. melanogaster) | UAS-Hop3W | PMID:23079600 | Activated form of Hopscotch (JAK) | |
| Genetic Reagent (D. melanogaster) | UAS-DIAP1 | PMID:22473013 | Inhibitor of apoptosis (3rd chromosome) | |
| Genetic Reagent (D. melanogaster) | UAS-CycE | PMID:19966222 | GAL4-responsive CycE | |
| Genetic Reagent (D. melanogaster) | FRT42D tub-GAL80 | PMID:28414313 | For 2R MARCM clones | |
| Genetic Reagent (D. melanogaster) | FRT82B tub-GAL80 | BDSC BL-5135 | For 3R MARCM clones | |
| Genetic Reagent (D. melanogaster) | Fz3-RFP | PMID:28414313 | Wnt pathway activity reporter; used on 2nd and 3rd chromosome | |
| Genetic Reagent (D. melanogaster) | STAT-GFP | PMID:23079600 | JAK-STAT pathway reporter | |
| Genetic Reagent (D. melanogaster) | STAT-RFP | PMID:31140975 | JAK-STAT pathway reporter | |
| Genetic Reagent (D. melanogaster) | cycEWX | PMID:19966222 | FBal0241968 | hypomorphic allele |
| Genetic Reagent (D. melanogaster) | cutlet4.5.43 | PMID:22473013 | ||
| Genetic Reagent (D. melanogaster) | arr2 | PMID:23079600 | FBal0000724 | amorphic allele |
| Genetic Reagent (D. melanogaster) | stat85C9 | PMID:23079600 | FBal0130583 | amorphic allele |
| Genetic Reagent (D. melanogaster) | stat06346 | PMID:23079600 | FBal0009559 | amorphic allele |
| Genetic Reagent (D. melanogaster) | axnE77 | PMID:28414313 | FBal0121005 | Q406 stop codon, likely null |
| Genetic Reagent (D. melanogaster) | axnSO44320 | PMID:28414313 | FBal0097414 | enhancer trap null |
| Genetic Reagent (D. melanogaster) | apc1Q8 | PMID:28414313 | FBal0091898 | Q427 stop codon |
| Genetic Reagent (D. melanogaster) | apc2D40 | PMID:28414313 | FBal0137655 | hypomorphic allele |
| Genetic Reagent (D. melanogaster) | kibra32 | PMID:24798736 | FBal0244965 | deletion in 5’ UTR and first exon |
| Genetic Reagent (D. melanogaster) | kibradel | PMID:24798736 | FBal0244407 | amorphic allele |
| Genetic Reagent (D. melanogaster) | wtsx1 | PMID:24798736 | FBal0044527 | amorphic allele |
| Chemical compound, drug | Normal goat serum | Jackson ImmunoResearch Laboratories | 005-000-121 | 10% in PBS for blocking |
| Antibody | anti-GFP (rabbit polyclonal) | Molecular Probes | A6455 | (1:1000) |
| Antibody | anti-Fas3 (mouse monoclonal) | DSHB | 7G10 | (1:250) |
| Antibody | AlexaFluor 488, 546, 594, 647 | Thermofisher Scientific | (1:1000) | |
| Chemical compound, drug | DAPI Fluoromount-G | Southern Biotech | 0100–20 | Mount samples and stain for DAPI |
| Commercial assay or kit | Click-iT EdU Cell Proliferation Kit | ThermoFisher Scientific | C10086 | |
| Software, algorithm | ZEN Blue, ZEN Black, and ZEN Lite | Zeiss | For viewing Z-stack images and quantifying fluorescence |
Additional files
Download links
A two-part list of links to download the article, or parts of the article, in various formats.
Downloads (link to download the article as PDF)
Open citations (links to open the citations from this article in various online reference manager services)
Cite this article (links to download the citations from this article in formats compatible with various reference manager tools)
Opposing JAK-STAT and Wnt signaling gradients define a stem cell domain by regulating differentiation at two borders
eLife 9:e61204.
https://doi.org/10.7554/eLife.61204


