Single caudate neurons encode temporally discounted value for formulating motivation for action
- Department of Functional Brain Imaging, National Institutes for Quantum and Radiological Science and Technology, Japan
- Systems Neuroscience Section, Primate Research Institute, Kyoto University, Japan
- Laboratory of Neuropsychology, National Institute of Mental Health, National Institutes of Health, Department of Health and Human Services, United States
Figures
Figure 1 with 2 supplements
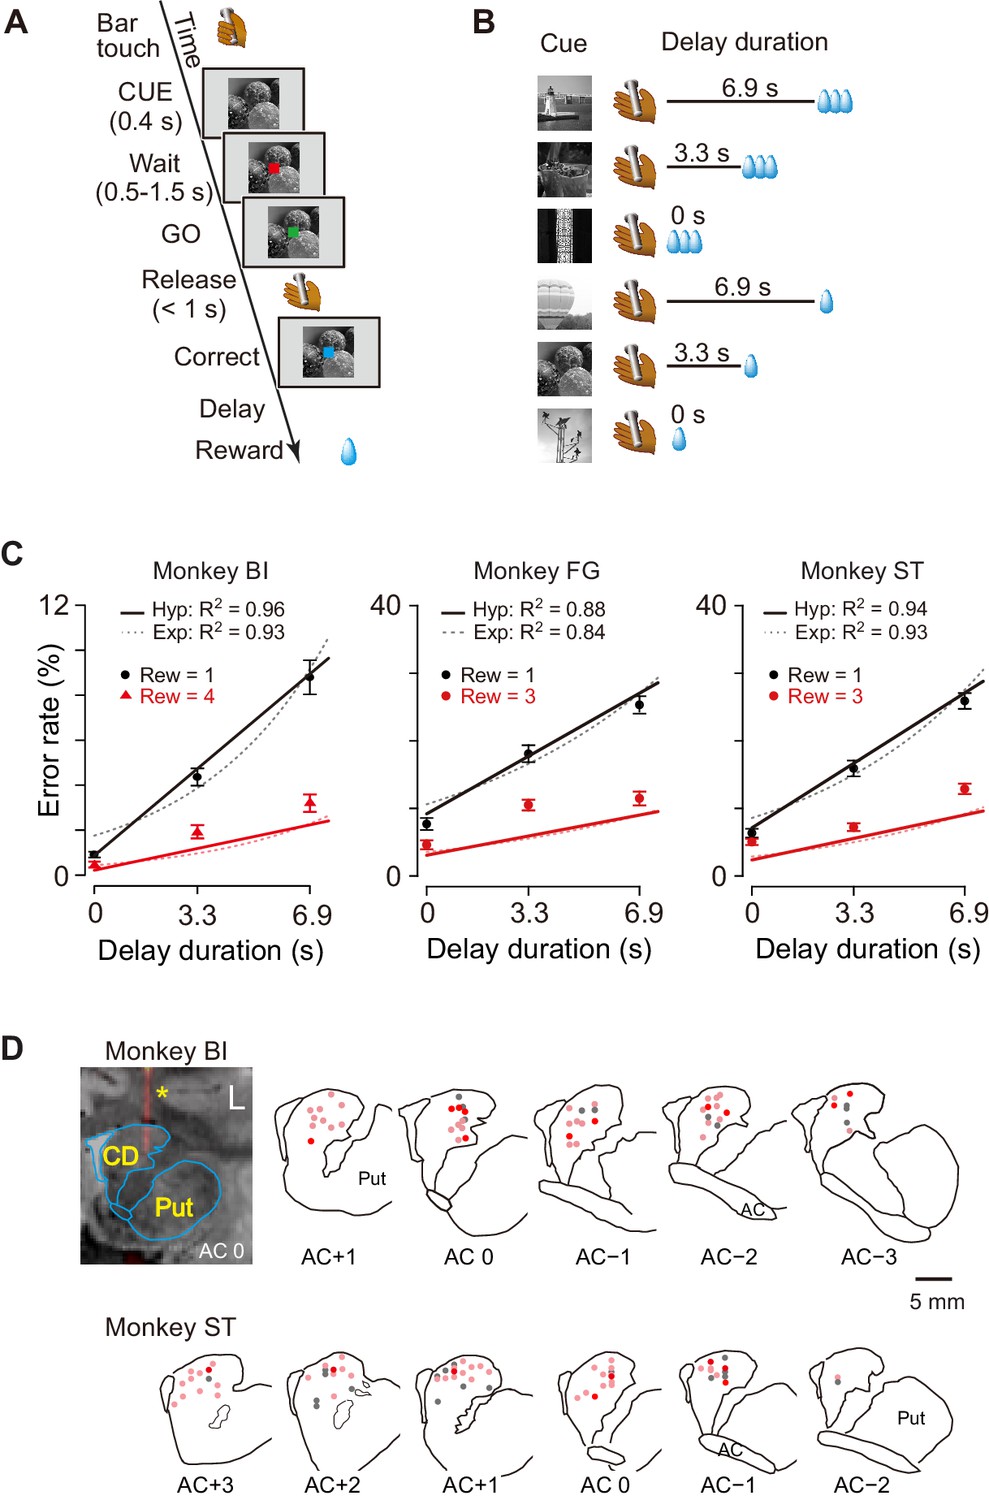
Task, behavioral performance, and recording sites.
(A) Sequence of events of behavioral tasks. (B) Example of relationship between cue and outcome in delayed reward task. (C) Ratio of error trials (mean ± sem) as a function of delay duration in monkeys BI, FG, and ST. Data of small (one drop) and large reward (three or four drops) trials are indicated by black and red, respectively. Solid lines and dotted curves are best fit of Equations 2 and 3, respectively. Note that since two straight lines were simultaneously fitted to the averaged data, the fitting was worse for the data of trials with larger rewards. (D) Series of coronal sections illustrating locations of recorded neurons plotted by dots. Anterior–posterior positions of sections (distance, in mm) are indicated by plus and minus numbers from anterior commissure (AC), respectively. Red, cue-responsive neurons with DV coding; pink, cue-responsive neurons without DV coding; gray, neurons without cue response. Coronal sections of CT-MR fusion image in top left visualize an electrode (*) in dCDh. CD, caudate nucleus; Put, putamen.
-
Figure 1—source data 1
Souce data of error rates as a function of delay duration and reward size.
- https://cdn.elifesciences.org/articles/61248/elife-61248-fig1-data1-v2.xls
Figure 1—figure supplement 1
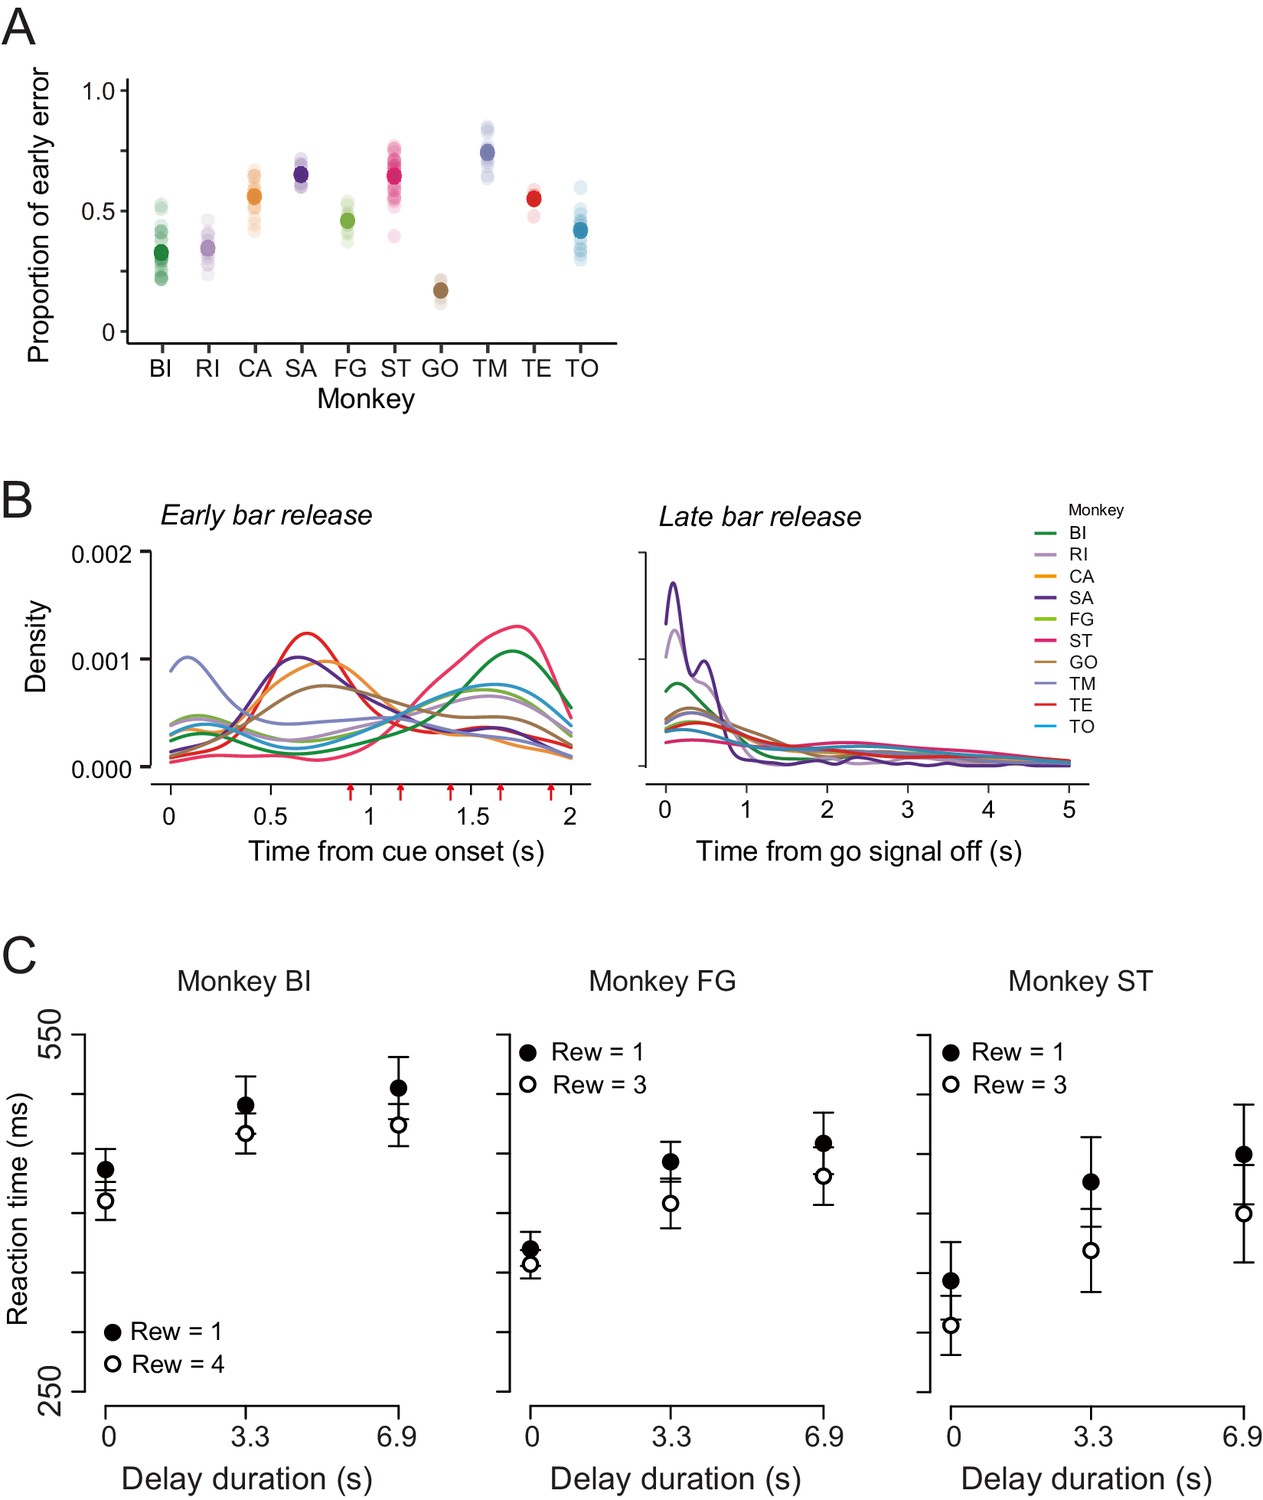
Error type and timing, and reaction time and eye position.
(A) Proportion of early error for each monkey. Thick and thin dots indicate mean and data of each session, respectively. (B) Distribution of timing for early and late bar release for each monkey. Red arrows indicate the timing of go. (C) Reaction time (mean ± SD) of delayed reward task as a function of delay duration in monkeys BI, FG, and ST. Black and white symbols indicate small (one drop) and large reward (three or four drops), respectively.
Figure 1—figure supplement 2

Eye position during cue period.
(A) Density plots of eye position during cue period of delayed reward task obtained from monkey RI. Colors indicate normalized looking-time. White squares indicate the frame of cue stimulus. (B) Time course of the proportion of eye position within the cue area aligned by CUE (left) and GO onset (right). Thick curves and shaded areas represent mean and SD, respectively. Colors represent rewarding condition.
Figure 2

Task-related responses of dCDh neurons.
(A) Example of a neuron that responded exclusively to cue. Rasters and spike density histograms for all trials are aligned at the cue signal (left), bar release (middle), and reward delivery (right). Rasters are shown in order of occurrence of trials from bottom to top. Shaded areas are time windows when discharge probability is significantly higher than baseline (p<0.05, χ2 test). (B) Example of a neuron that responded exclusively to reward delivery. (C) Example of a neuron that responded to cue, bar release and reward delivery. (D) Distribution of neurons that responded in three task phases shown in Venn diagram. Numbers in parentheses represent numbers of neurons showing significant response to each event. The proportions of responded neurons in each monkey are as follows: Cue, 88%, 88%, and 83%; Release, 37%, 42%, and 46%; Reward, 41%, 50%, 38%; for monkeys BI, FG, and ST, respectively.
Figure 3 with 2 supplements

Cue responses of temporally discounted value coding.
(A, B) Activity of example neurons during cue period. Rasters and spike density histograms are aligned at cue onset. The color corresponds to each reward condition. Rasters are shown in order of occurrence of trials from bottom to top in each condition. Shaded areas on rasters are time windows for evaluating the magnitude of cue response. (C, D) Relationship between firing rate (mean ± sem) and temporally discounted value (DV, Equation 1) for neuronal activities shown in (A) and (B), respectively.
Figure 3—figure supplement 1

Error trial analysis.
Table shows that the number of neurons whose activity is explained best by models 1–4. Note that linear mixed model (LMM) analysis was applied to 22 of 27 DV-coding neurons recorded in a session in which the monkeys made at least three error trials. fr, firing rate; dv, discounted value; trial, trial type (correct or error). Seventeen neurons were differently modulated by DV depending on whether the monkey perform correct or not, while remaining five were similarly modulated regardless of performance.
Figure 3—figure supplement 2
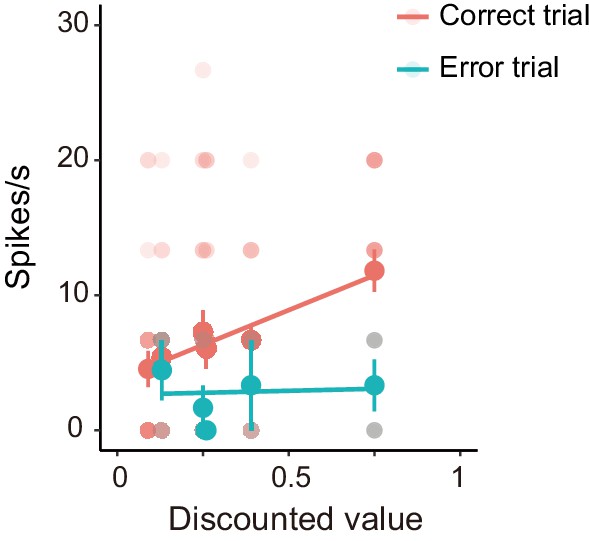
Error trial analysis.
Example of differential activity between error and correct trials of a DV-coding neuron. Thin and thick dots indicate relationship between firing rate and temporally discounted value (Equation 1) in individual trials and mean values for each rewarding condition, respectively. Color indicate correct (red) and error (green) trials, respectively. Thick lines indicate best-fit of LMM (model four in Figure 3—figure supplement 1).
Figure 4 with 1 supplement
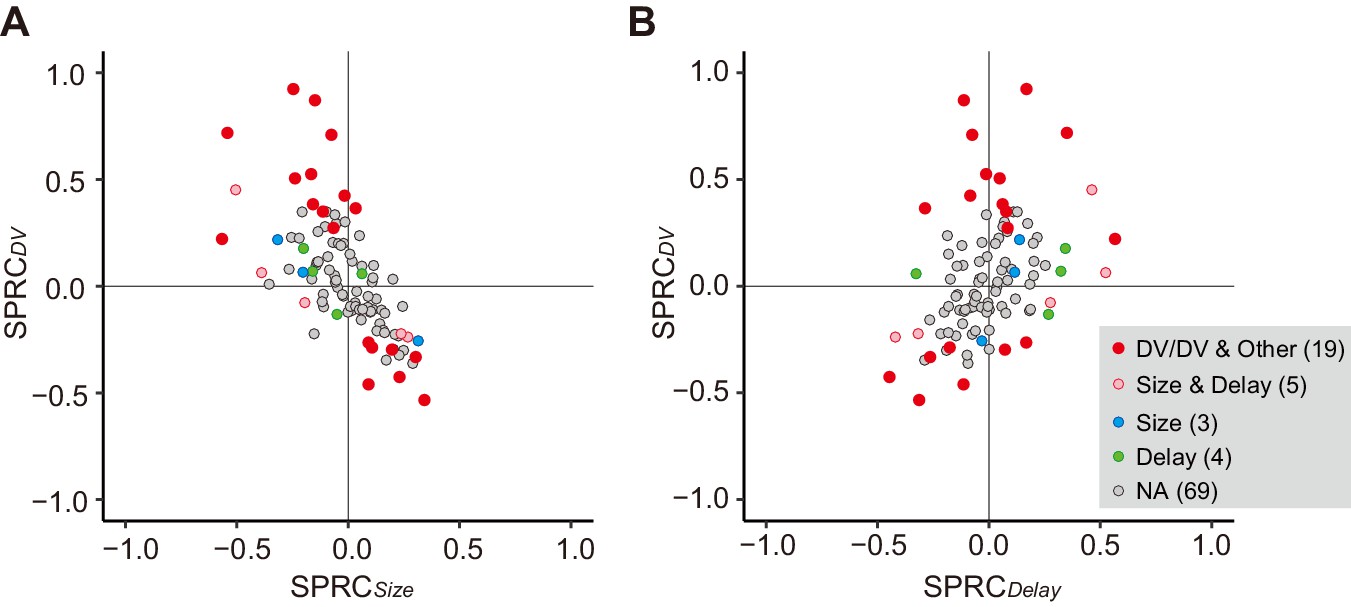
Impact of DV and comparison with delay and size on cue response.
(A, B) Scatterplots of standardized partial regression coefficients (SPRC) of DV (ordinate) against those for reward size or delay (abscissa) for discharge rates during cue period, respectively. Colored dots indicate neurons with significant (p<0.05) coefficient, while gray dots correspond to neurons without any significant effect (NA). DV/DV and Other, neurons with significant coefficient of DV; Size and Delay, those with both size and delay; Size, those exclusively with size; Delay, those exclusively with delay. Numbers in parentheses indicate number of neurons.
Figure 4—figure supplement 1

Impact of DV and comparison with delay and size on release and reward response.
(A) Scatterplot of standardized partial regression coefficients (SPRC) of DV (ordinate) against those of size and delay on release response, respectively (abscissa). (B) Same as (A), but for reward response. Colored dots indicate neurons with significant (p<0.05) coefficient, while gray dots correspond to neurons without any significant effect (NA). DV/DV and Other, neurons with significant coefficient of DV; Size and Delay, those with both size and delay; Size, those with size exclusively; Delay, those with delay exclusively. Numbers in parentheses indicate number of neurons.
Figure 5
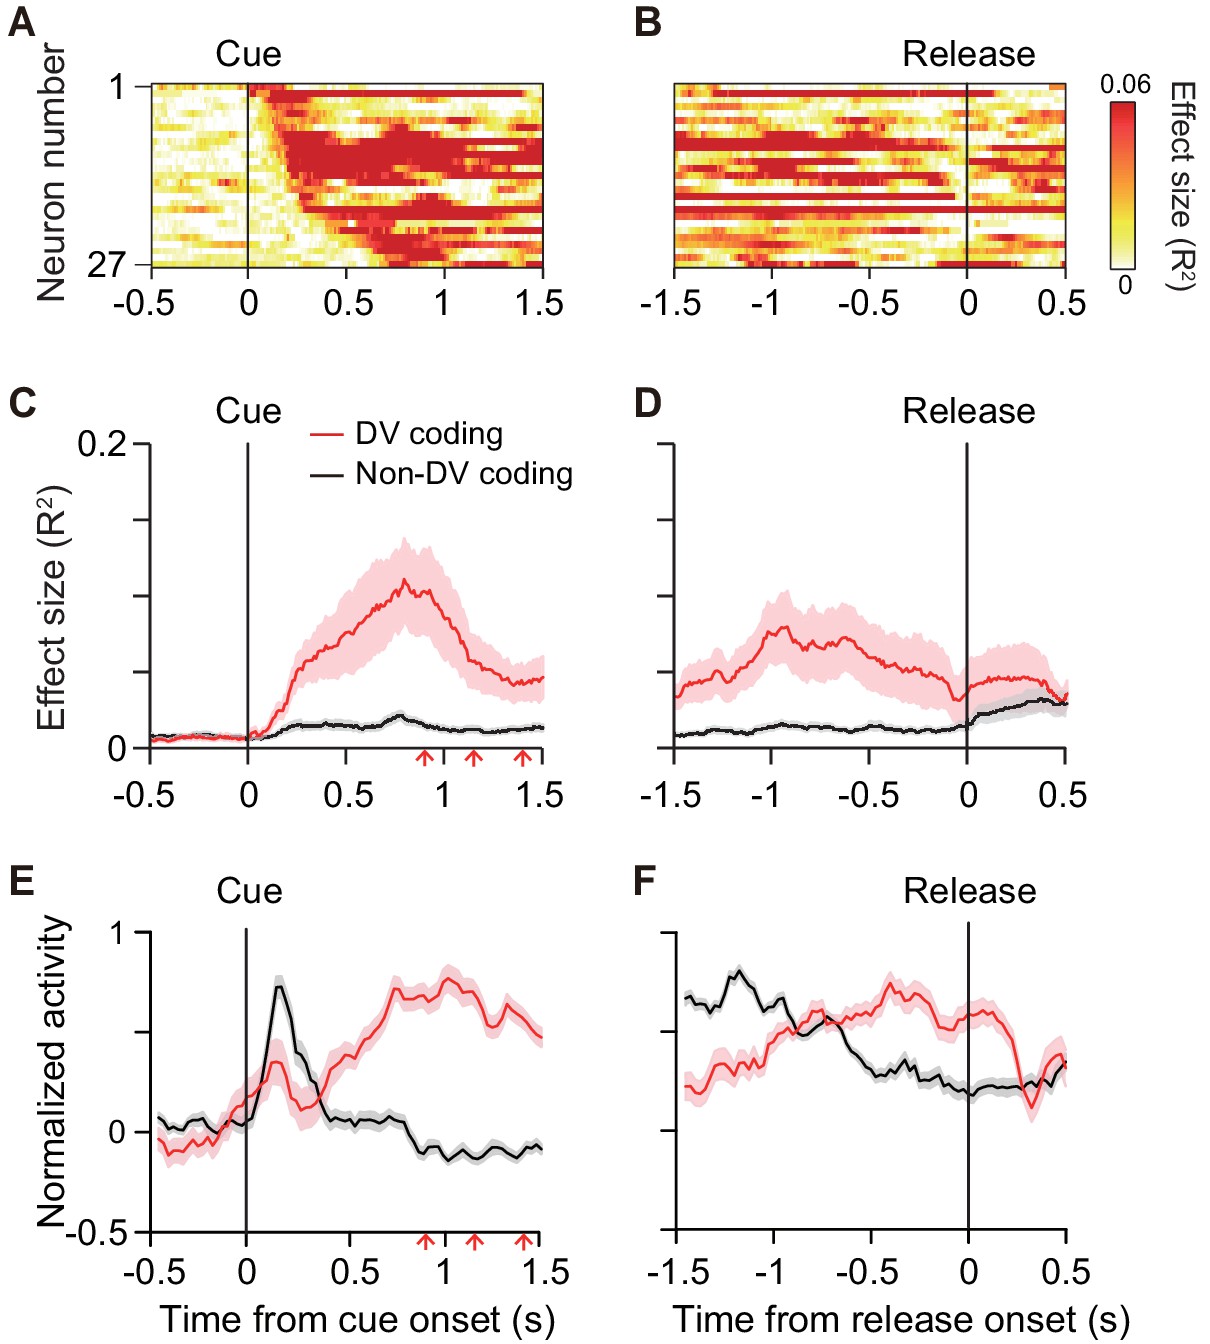
Time course of DV coding.
(A, B) Time-dependent change of DV coding. Each row represents color-coded effect size (R2) of DV for a single DV-coding neuron. Responses were aligned by cue onset and bar release, respectively. (C, D) Time-dependent change of effect size of DV for DV coding (red, n = 27) and non-DV-coding neurons (black, n = 73) aligned by cue onset and bar release, respectively. Thick curve and shaded areas indicate mean ± sem, respectively. Arrows indicate time of go signal (first 3 of 5 with variable interval). (E, F) Time course of normalized activity for DV coding (red, n = 27) and non-DV-coding neurons (black, n = 73) aligned by cue onset and bar release, respectively. Conventions are the same as (C, D).
-
Figure 5—source data 1
Source data of time-dependent change of DV coding in individual neurons.
- https://cdn.elifesciences.org/articles/61248/elife-61248-fig5-data1-v2.xls
Figure 6 with 1 supplement
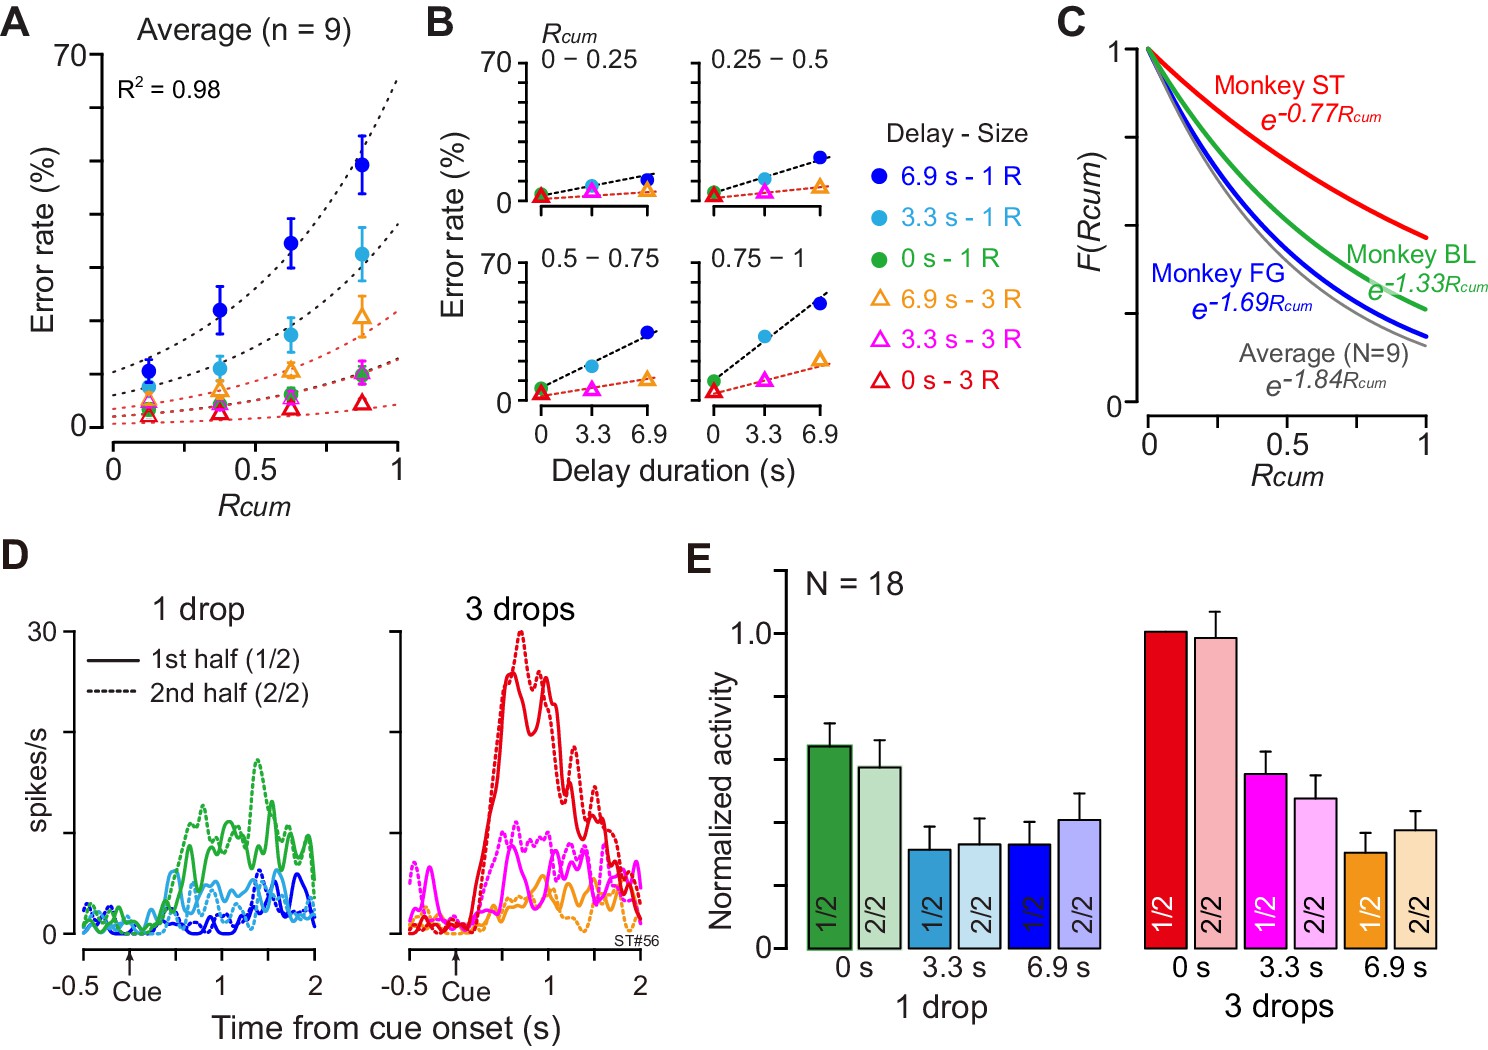
Negligible effect of satiation on DV-coding.
(A) Ratio of error trials (mean ± sem) as a function of normalized cumulative reward (Rcum) on average across nine monkeys. Dotted curves are the best fit of Equation 4 to the data. (B) Error rates (mean ± sem) as a function of delay duration for each quarter of Rcum. (C) Satiation function, F(Rcum), along with Rcum in three individual monkeys and average across nine monkeys. Since average total trials were 934, 512, and 493 in BI, FG, and ST, motivational value became 84%, 67%, and 83% through 120 trials (i.e., 16%, 33%, and 17% devalued), respectively. (D) Example of comparison of cue responses in first and second half of recording period for each reward condition in single dCDh neuron (monkey ST). Spike density histograms are aligned at cue onset; one and three drops in reward size, respectively. (E) Comparison of cue responses in first and second half of recording period for each trial type in positive DV-coding neurons (n = 18). Responses were normalized by firing rate of cue response in immediate large reward trials during first half of the period.
Figure 6—figure supplement 1

Impact of discounted value and satiation on cue response.
(A) Scatterplot of standardized regression coefficients (SRC) of discharge rates during cue period for DV (ordinate) against those for cumulative reward (abscissa). Red dots indicate DV-coding neurons. Red and blue, and purple circles indicate non-DV-coding neurons with significant (p<0.05) coefficient for DV and cumulative reward (CR), and both, respectively. Black circles correspond to neurons without any significant effect (NS). (B) Representative waveforms (mean ± SD) recorded from a CD neuron (Monkey ST #10) during first (purple) and last quartile (orange) of recording period. Changes in firing rate were not attributable to alteration in action potential isolation.
Figure 7 with 4 supplements
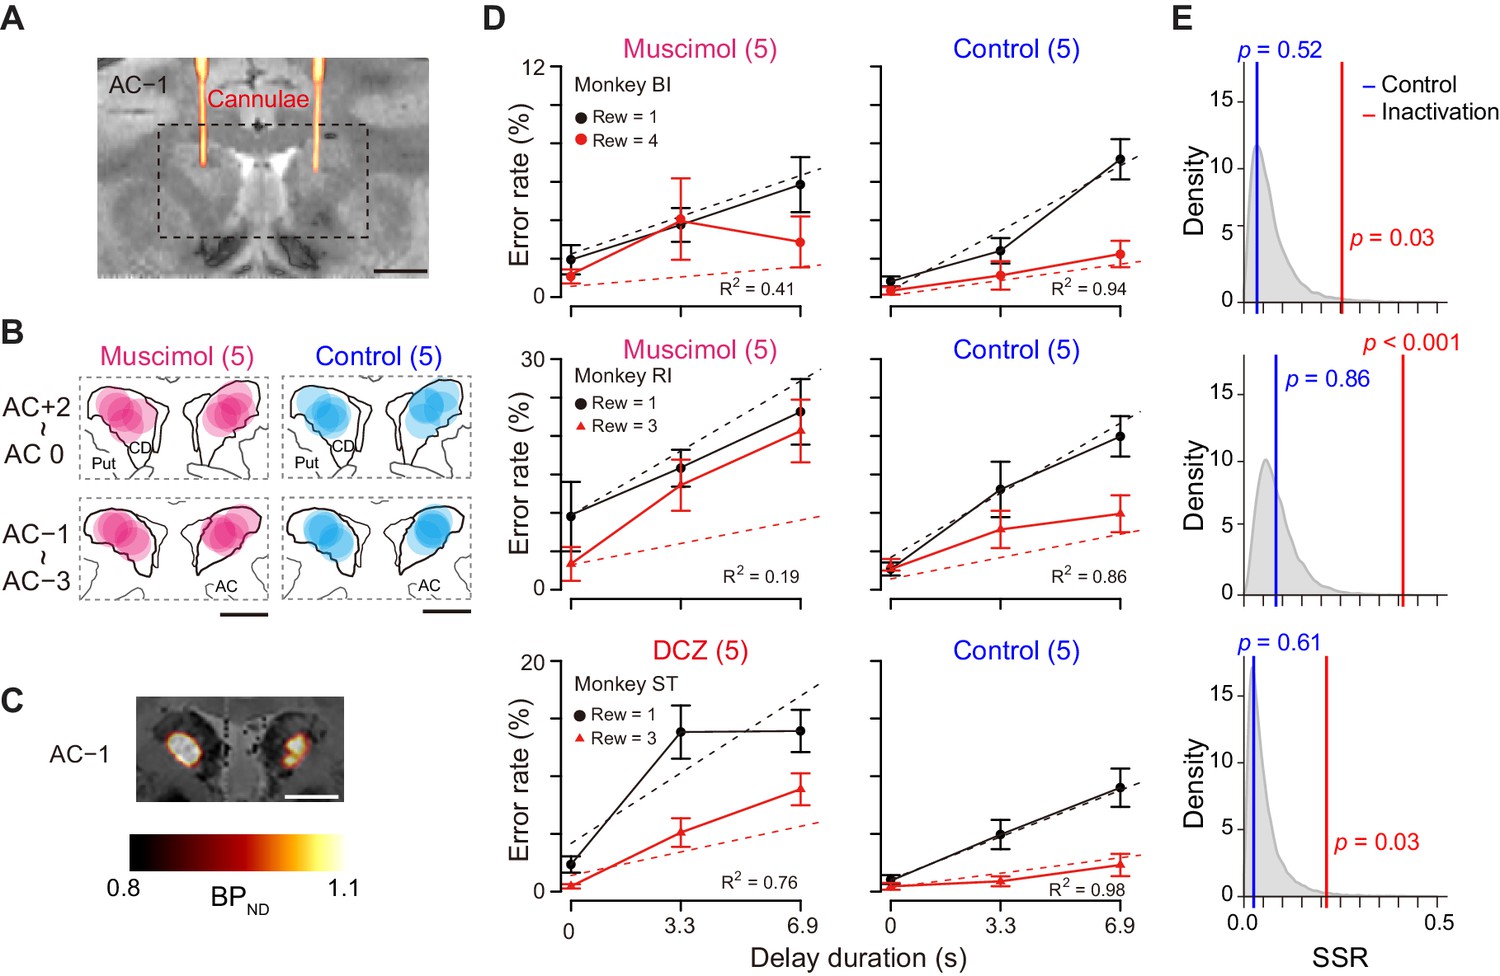
Bilateral inactivation of dCDh disrupted normal motivational performance based on size and delay.
(A) CT-based localization of muscimol injection sites. CT image visualizing injection cannulae targeting CD bilaterally (hot color) overlaid on MR image (gray scale) in monkey BI. Scale bar, 5 mm. (B) Muscimol (magenta) and saline injection sites (blue) are mapped by estimating diffusion (4 mm in diameter) from the tip of the cannula. The data of two subjects are overlaid and are separately mapped 3 mm anterior and 3 mm posterior to the anterior commissure (AC). (C) [11C]DCZ-PET visualizing hM4Di expression in vivo in monkey ST. Parametric image of specific binding (BPND) of [11C]DCZ-PET overlaying MR image. Scale bar, 5 mm. (D) Error rates (mean ± sem) as function of delay duration under inactivation (left) and control condition (right). Black and red symbols are low and high reward trials, respectively. Dotted lines represent best-fit function of hyperbolic temporal discounting (Equation 2). Number in parentheses indicates number of sessions tested. (E) Distribution of sum of squared residuals (SSR) of best-fit function (Equation 2) to averaged resample data obtained by bootstrap method (n = 20,000). Blue and red lines indicate SSR of best fit of Equation 2 to mean error rates in control and inactivation sessions, respectively.
-
Figure 7—source data 1
Source data of error rates in control and inactivation sessions.
- https://cdn.elifesciences.org/articles/61248/elife-61248-fig7-data1-v2.xls
Figure 7—figure supplement 1
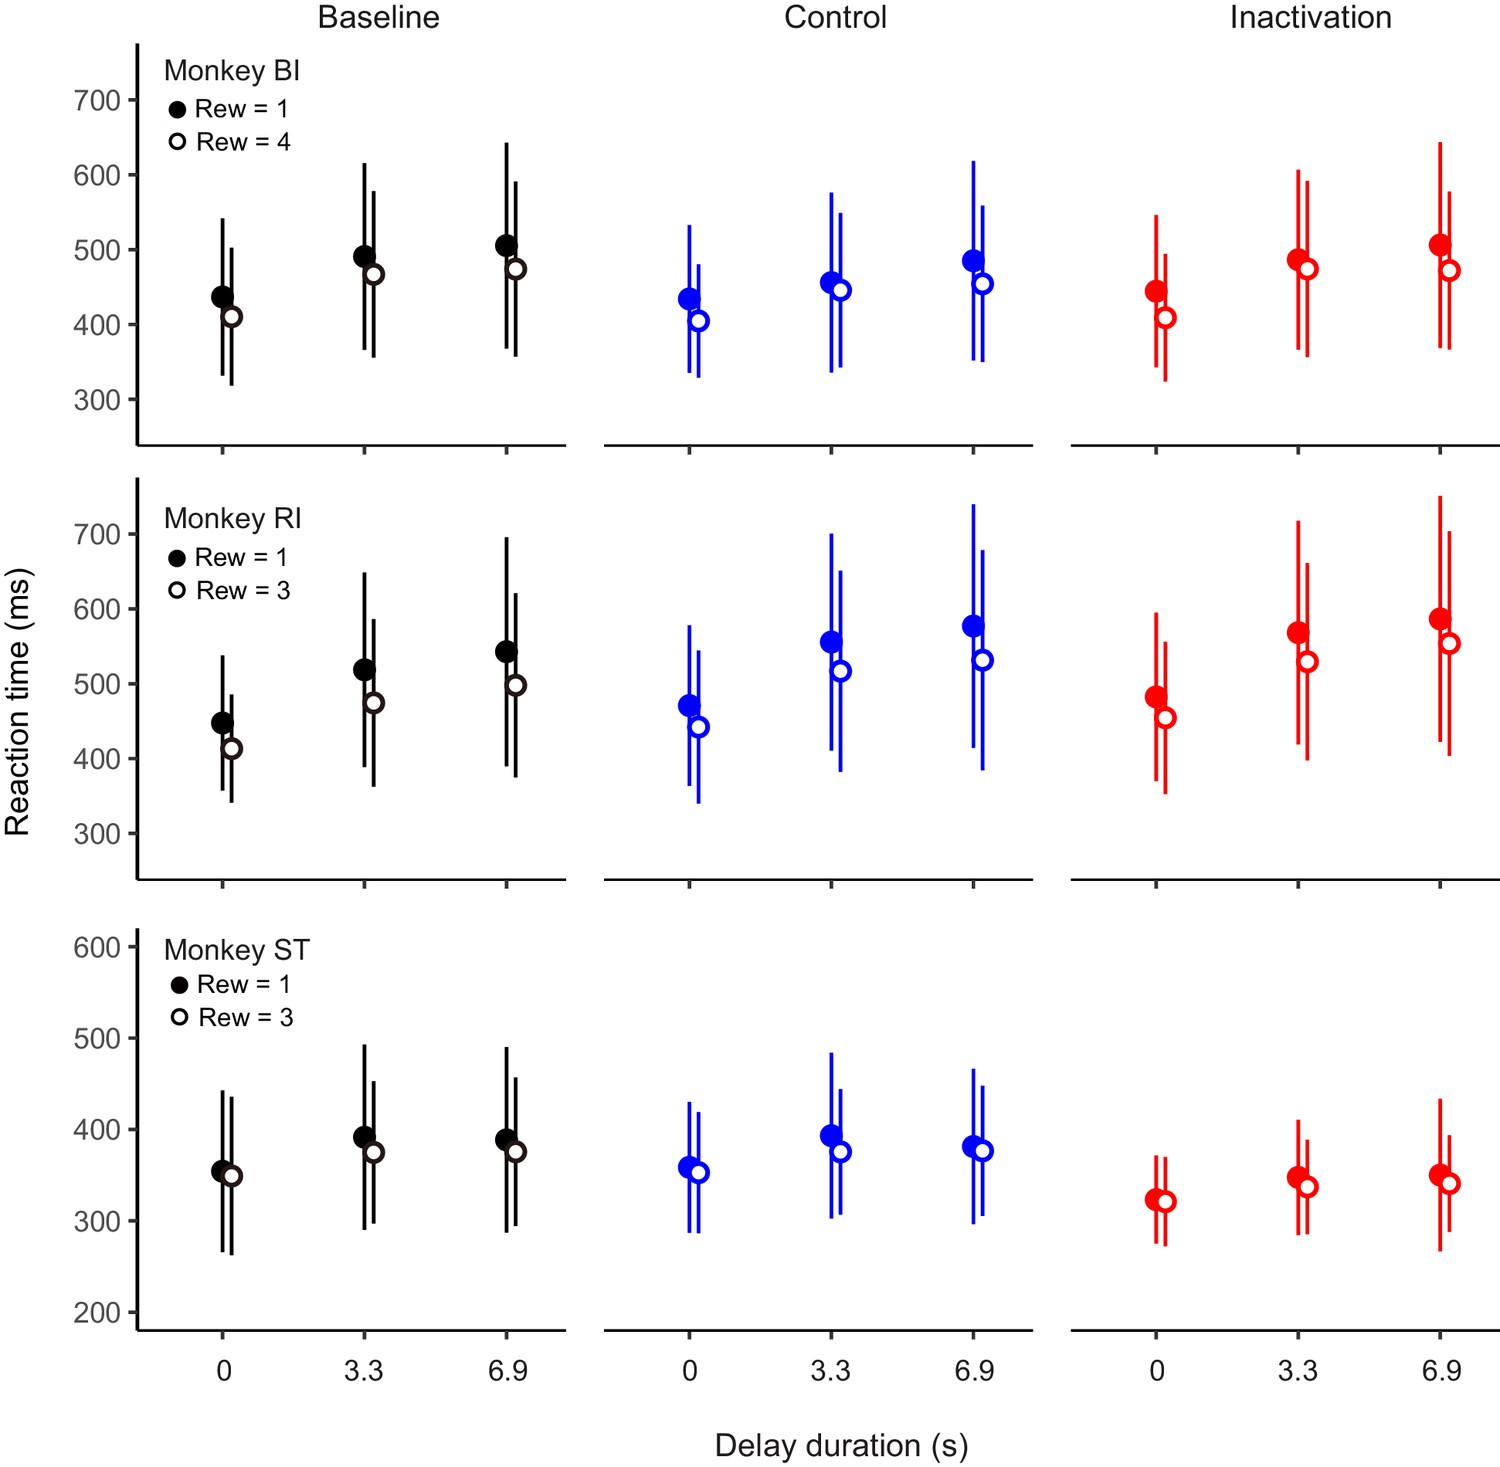
No significant effects of dCDh inactivation on reaction time in delayed reward task.
Comparison of reaction time (mean ± SD) between baseline, control, and inactivation session in monkeys BI, RI, and ST.
Figure 7—figure supplement 2

No effect of dCDh inactivation on eye position.
Density plots of eye position during cue period of delayed reward task obtained from monkey RI. Colors indicate normalized looking-time. Left and right panels for control and inactivation sessions, respectively. White squares indicate frame of cue stimulus.
Figure 7—figure supplement 3

Normalized error rates in baseline, control, and inactivation session of delayed reward task.
Symbols represent normalized error rates for each reward condition by maximum error rates in each session. Thick lines connect average error rates for three delay conditions in each reward size. Vertical lines indicate sem.
Figure 7—figure supplement 4

Effect of dCDh inactivation on satiation.
Error rates (mean ± sem) as a function of normalized cumulative reward (Rcum) in baseline, control, and inactivation session of delayed reward task. Dotted curves are the best fit of Equation 4 to the data. Note that the satiation effect was disrupted in the inactivation session in the monkey ST, but remained normal after inactivation in the reward-size task in the same monkey (see Figure 8C).
Figure 8 with 1 supplement
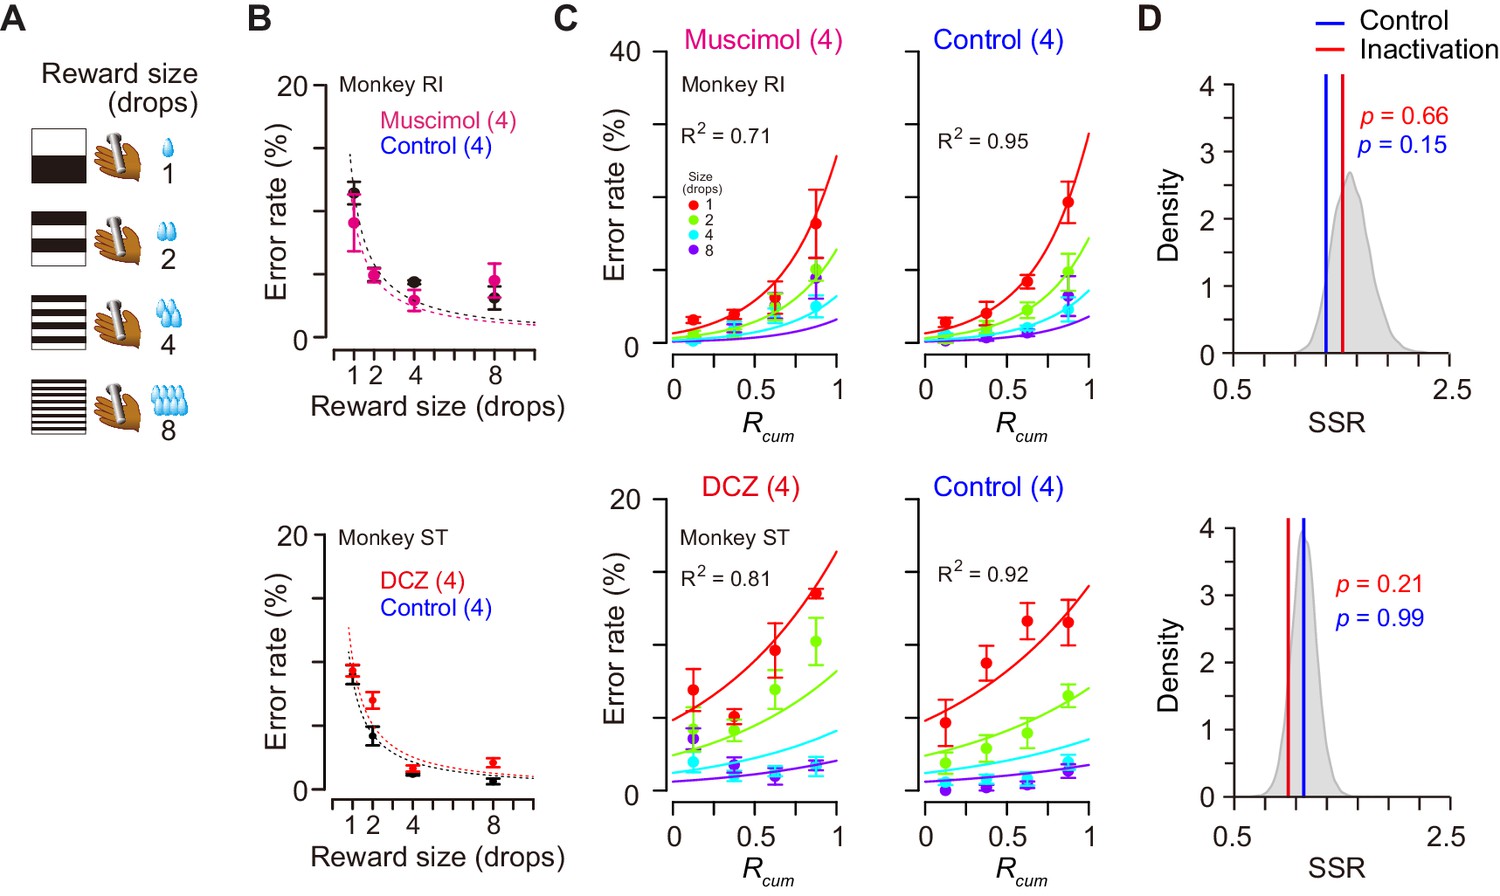
Reward-size task and behavioral performance.
(A) Cue stimuli used in reward-size task uniquely associated with forthcoming reward size (one, two, four, or eight drops). (B) Top: Error rates (mean ± sem) as function of reward size in muscimol treatment (magenta) and non-treatment control session (black) for monkey RI, respectively. Bottom: Error rates (mean ± sem) as function of reward size after DCZ treatment (red) and after vehicle treatment (black) for monkey ST, respectively. Dotted curves represent best-fit of inverse function. (C) Error rates (mean ± sem) as function of normalized cumulative reward (Rcum) for monkeys RI (top) and ST (bottom), respectively. Each reward size condition was shown in a different color. Number in parentheses indicates numbers of sessions tested. (D) Distribution of sum of squared residuals (SSR) of best-fit function (Equation 6) to averaged resample data obtained by bootstrap method (n=20,000). Blue and red lines indicate SSR of best-fit of Equation 6 to the mean error rates in control and inactivation sessions, respectively.
-
Figure 8—source data 1
Source data of error rates in reward size task.
- https://cdn.elifesciences.org/articles/61248/elife-61248-fig8-data1-v2.xls
Figure 8—figure supplement 1
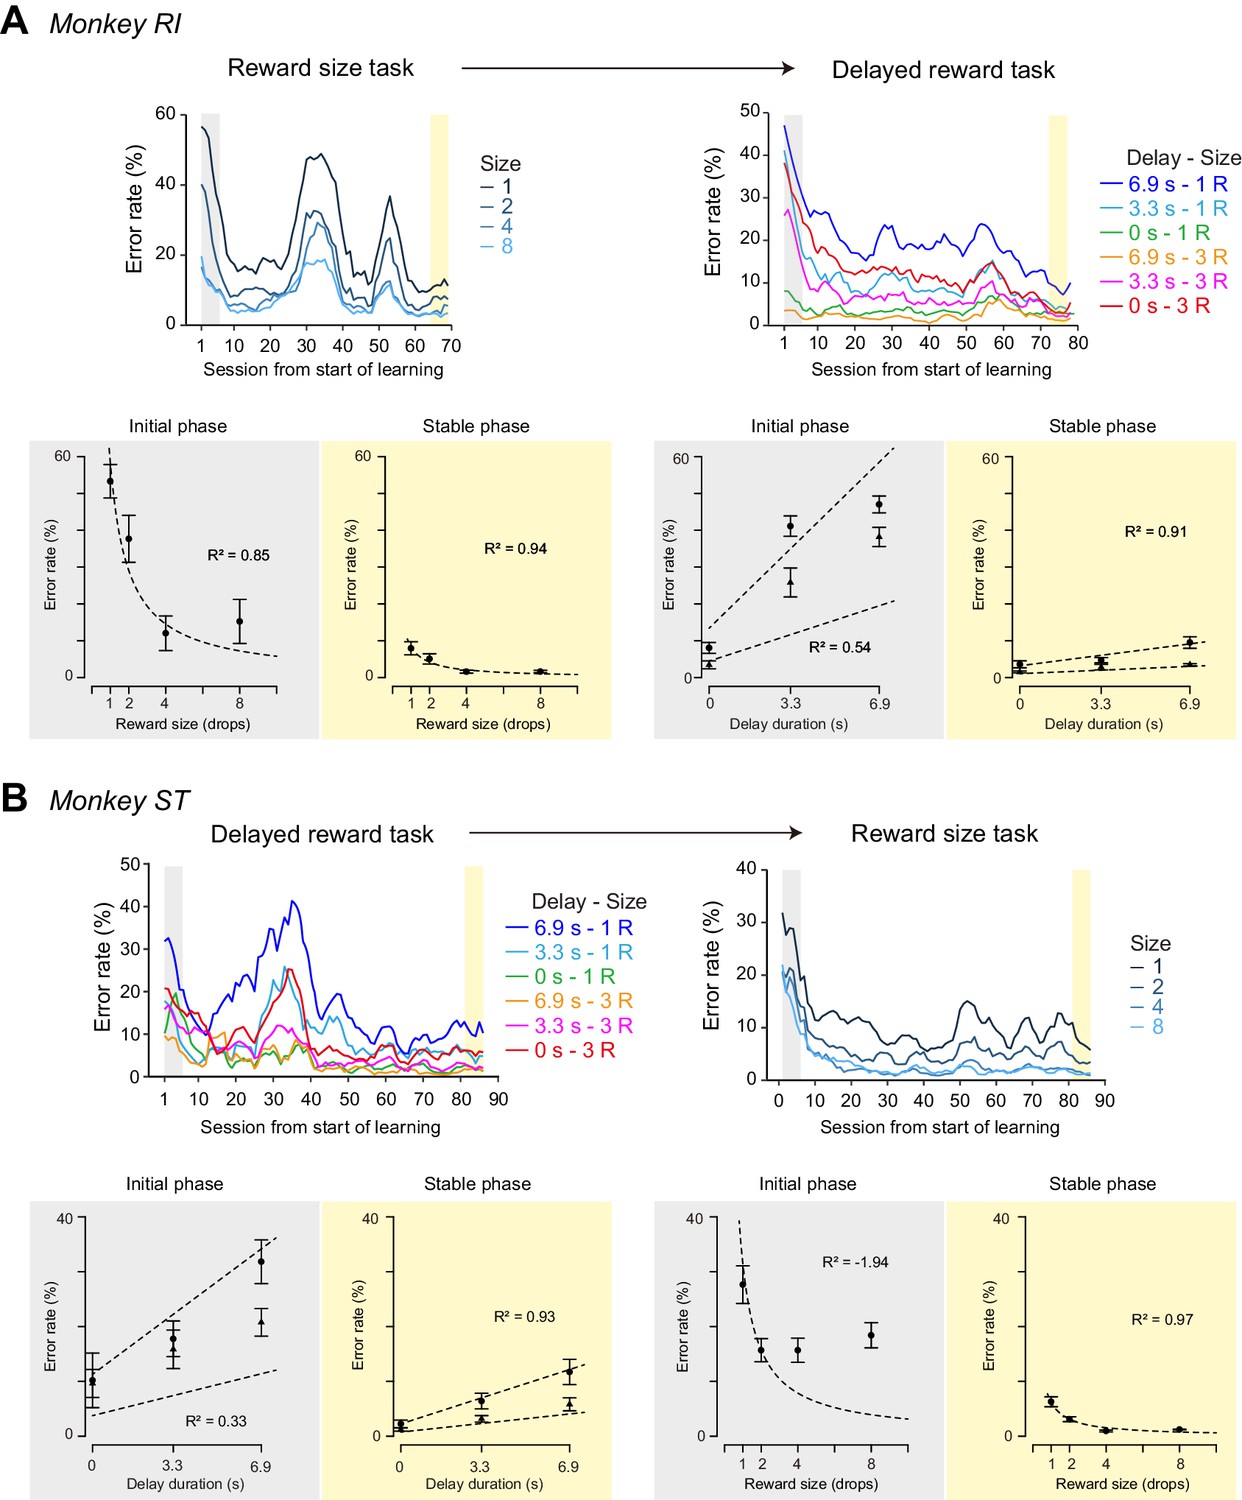
Comparison of learning in reward size and delayed reward task.
(A) Monkey RI was trained with reward-size task followed by delayed reward task. (Top) Error rates as a function of session were plotted for both tasks. (Bottom) Error rates as a function of reward size or delay duration during initial and stable phase were shown. (B) Monkey ST was trained with delayed reward task followed by reward-size task. Others are the same as (A).
Additional files
Download links
A two-part list of links to download the article, or parts of the article, in various formats.
Downloads (link to download the article as PDF)
Open citations (links to open the citations from this article in various online reference manager services)
Cite this article (links to download the citations from this article in formats compatible with various reference manager tools)
Single caudate neurons encode temporally discounted value for formulating motivation for action
eLife 10:e61248.
https://doi.org/10.7554/eLife.61248


