Evolutionary transcriptomics implicates HAND2 in the origins of implantation and regulation of gestation length
- Department of Human Genetics, University of Chicago, United States
- Department of Biological Sciences, University at Buffalo, United States
Figures
Figure 1 with 2 supplements
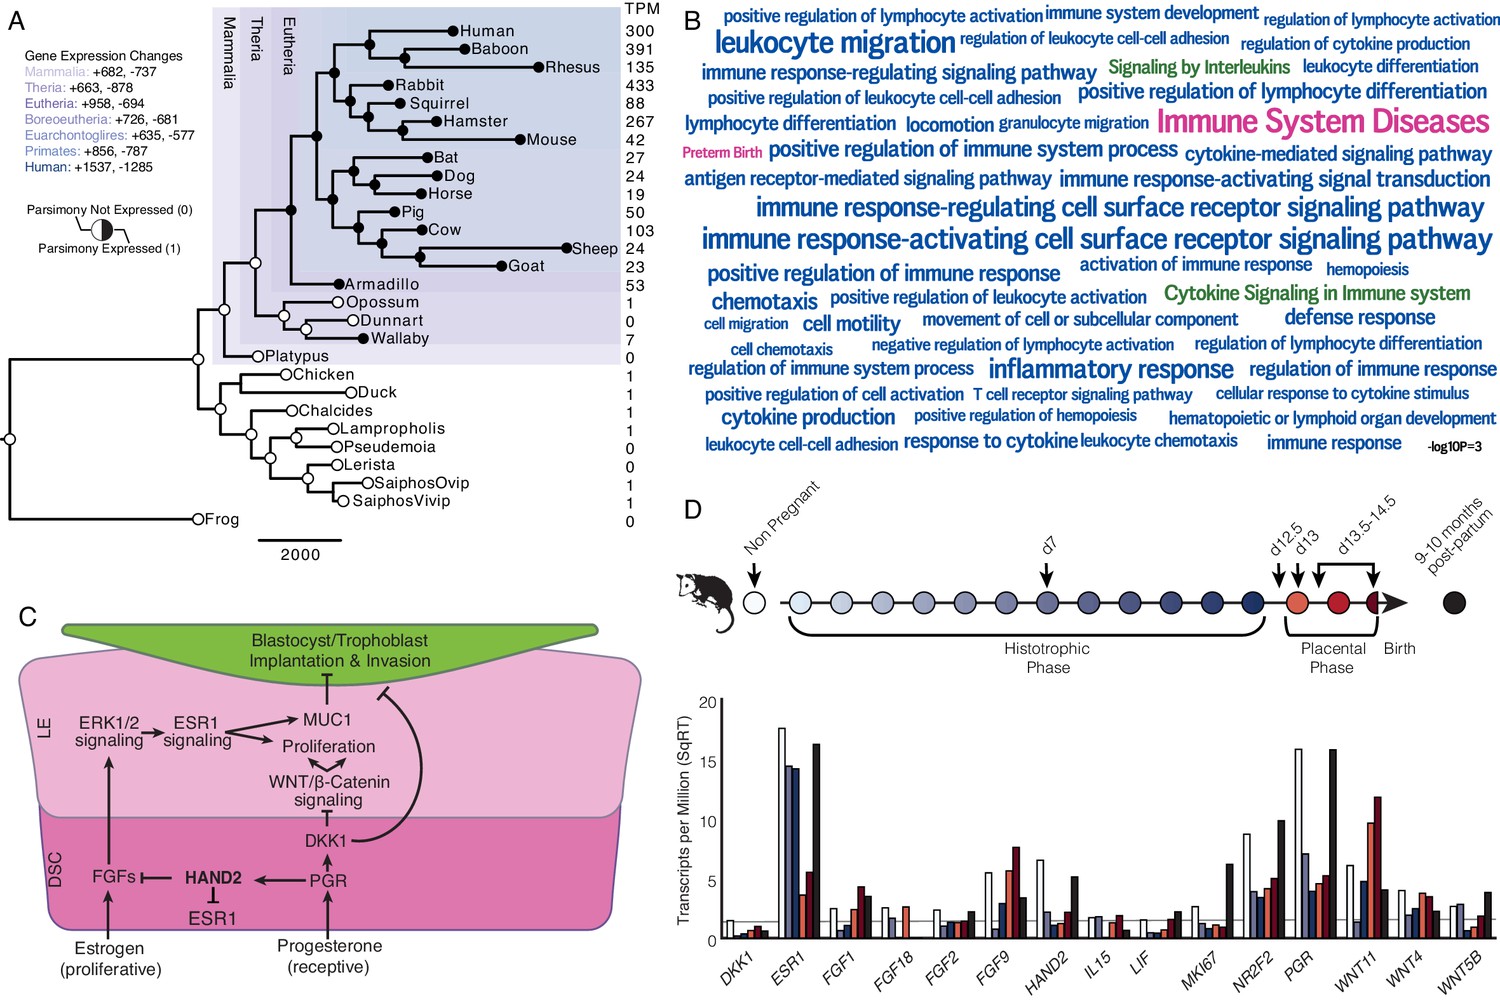
Recruitment of HAND2-mediated anti-estrogenic signaling in the Eutherian endometrium.
(A) Evolution of HAND2 expression at the maternal-fetal interface. Amniotes phylogeny with horizontal branch lengths drawn proportional to the number of gene expression changes inferred by parsimony (most parsimonious reconstruction). Circles indicate HAND2 expression in extant species and ancestral reconstructions. Black, expressed (state = 1). White, not expressed (state = 0). Inset legend shows the number of most gene expression changes from the root node to human (+ = gene expression gained; - = gene expression lost). Numbers to the right indicate HAND2 expression in TPM for each respective species. (B) WordCloud of biological pathways (green), human disease phenotypes (pink), and biological process gene ontology terms (blue) enriched among 149 unambiguously recruited genes in the Eutherian stem-lineage. Term size is shown scaled to -log10 p-value (see inset scale). (C) Cartoon model of estrogen signaling and HAND2-mediated anti-estrogenic signaling in the endometrium. The estrogen-mediated signaling network is suppressed by progesterone through the activation of HAND2 and antagonists of canonical WNT/β-catenin-mediated signaling pathways such as DKK1. In the proliferative phase of the reproductive cycle, estrogen acts through ESR1 in stromal cells to increase the production of fibroblast growth factors (FGFs), which serve as paracrine signals leading to sustained proliferation of epithelial cells. Active estrogen signaling maintains epithelial expression of Mucin 1 (MUC1), a cell surface glycoprotein that acts as a barrier to implantation. During the receptive phase of the cycle, however, progesterone induces HAND2 and DKK1 expression in the endometrial stroma, inhibiting production of FGFs, suppressing epithelial proliferation and antagonizing estrogen-mediated expression of MUC1, thereby promoting uterine receptivity to implantation. DSC = decidual stromal cells, LE = luminal epithelium. (D) Gene expression time course through opossum pregnancy. Upper, schematic of gestation length in Monodelphis domestica in which the histotrophic phase lasts from day 1 to day 12, hatching occurs on day 12.5, the placental phase lasts from day 13 to day 14.5, and birth occurs on day 14.5. Lower, data shown as square root (SqRT) transformed TPM. The TPM = 2 expression cutoff is shown as a horizontal gray line. M. domestica RNA-Seq data from Lynch et al., 2015; Hansen et al., 2016; Griffith et al., 2017; Griffith et al., 2019.
-
Figure 1—source data 1
Species and gene expression information.
- https://cdn.elifesciences.org/articles/61257/elife-61257-fig1-data1-v2.xlsx
-
Figure 1—source data 2
Binary encoded endometrial gene expression dataset.
- https://cdn.elifesciences.org/articles/61257/elife-61257-fig1-data2-v2.nex.txt
-
Figure 1—source data 3
Genes (HUGO gene names) that unambiguously evolved endometrial expression in the Eutherian stem-lineage (‘Recruited Genes’).
- https://cdn.elifesciences.org/articles/61257/elife-61257-fig1-data3-v2.xlsx
-
Figure 1—source data 4
Top 100 pathways (Wikipathway, Reactome, KEGG) in which Eutherian recruited genes are enriched.
- https://cdn.elifesciences.org/articles/61257/elife-61257-fig1-data4-v2.xlsx
-
Figure 1—source data 5
Top 100 human phenotype (disease) ontology terms in which Eutherian recruited genes are enriched.
- https://cdn.elifesciences.org/articles/61257/elife-61257-fig1-data5-v2.xlsx
-
Figure 1—source data 6
Top 100 biological process gene ontology (GO) terms in which Eutherian recruited genes are enriched.
- https://cdn.elifesciences.org/articles/61257/elife-61257-fig1-data6-v2.xlsx
-
Figure 1—source data 7
RNA-Seq data from opossum endometrial samples.
Gene expression in TPM. NP = non-pregnant; d7, d12.5, d13, d13.5–14.5 = day 7, 12.5, 13, 13.5–14.5 of pregnancy, respectively; N2_9mo, N3_10mo = non-pregnant endometrium 9 and 10 months after pregnancy, respectively.
- https://cdn.elifesciences.org/articles/61257/elife-61257-fig1-data7-v2.xlsx
-
Figure 1—source data 8
Database of genes implicated in preterm birth.
- https://cdn.elifesciences.org/articles/61257/elife-61257-fig1-data8-v2.gmt.txt
Figure 1—figure supplement 1
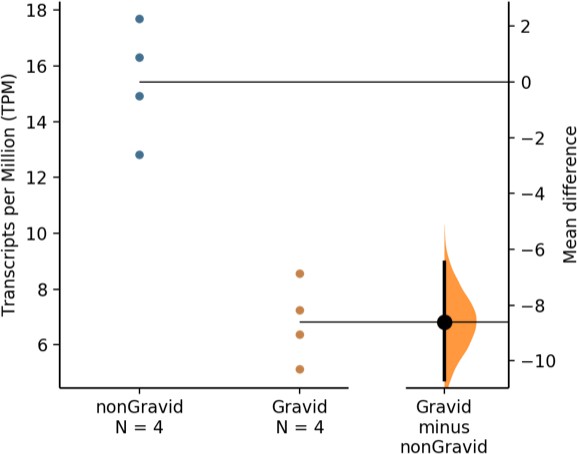
The unpaired mean difference in HAND2 expression between non-Gravid and Gravid wallaby samples is −8.6 [95.0% CI: −10.7 – −6.46].
The p-value of the two-sided permutation t-test is 0.02. The effect sizes and CIs are reported above as: effect size [CI width: lower bound – upper bound]; the confidence interval is bias-corrected and accelerated. The p-value reported is the likelihood of observing the effect size, if the null hypothesis of zero difference is true. For each permutation p-value, 5000 reshuffles of the control and test labels were performed.
-
Figure 1—figure supplement 1—source data 1
Uterine gene expression data (in TPM) from four Gravid (orange - Wal38, Wal40, Wal57, and Wal59) and four non-Gravid (blue - Wal39, Wal41, Wal58, and Wal60) tammar wallabies.
HAND2 expression numbers used to generate Figure 1—figure supplement 1 are highlighted in yellow.
- https://cdn.elifesciences.org/articles/61257/elife-61257-fig1-figsupp1-data1-v2.xlsx
Figure 1—figure supplement 2
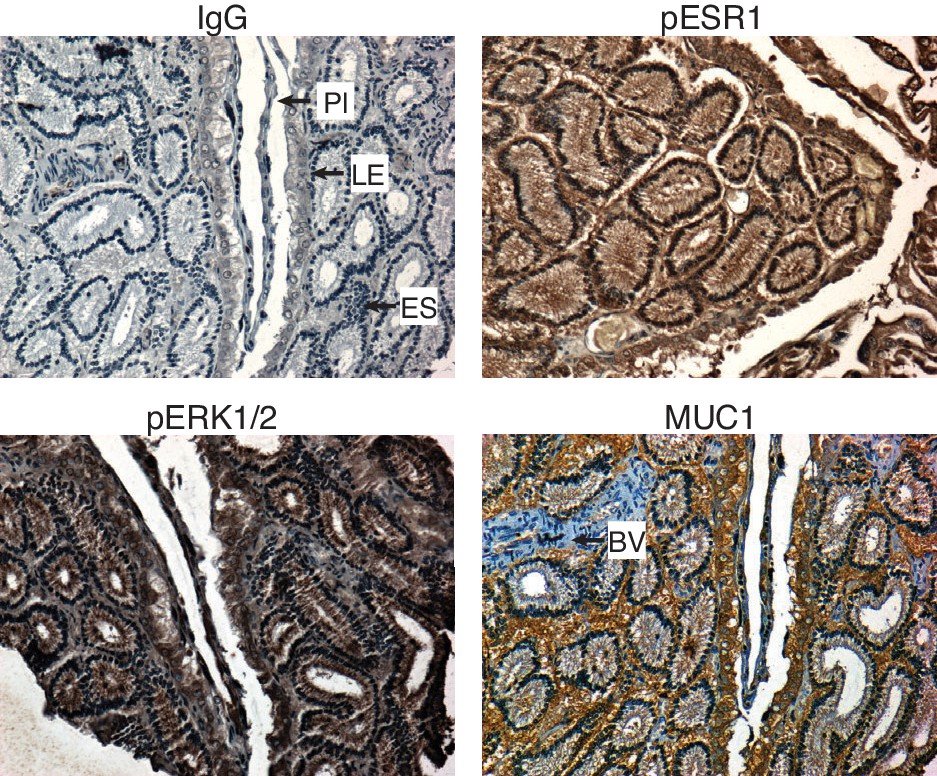
Immunohistochemistry showing phosphorylated ESR1 (pESR1), phosphorylated MAPK1/2 (pERK1/2) and MUC1 expression in paraffin-embedded 12.5d pregnant Monodelphis domestica endometrium compared to control (IgG).
Pl, placenta. LE, luminal epithelium. ES, endometrial stroma. BV, blood vessels.
Figure 2
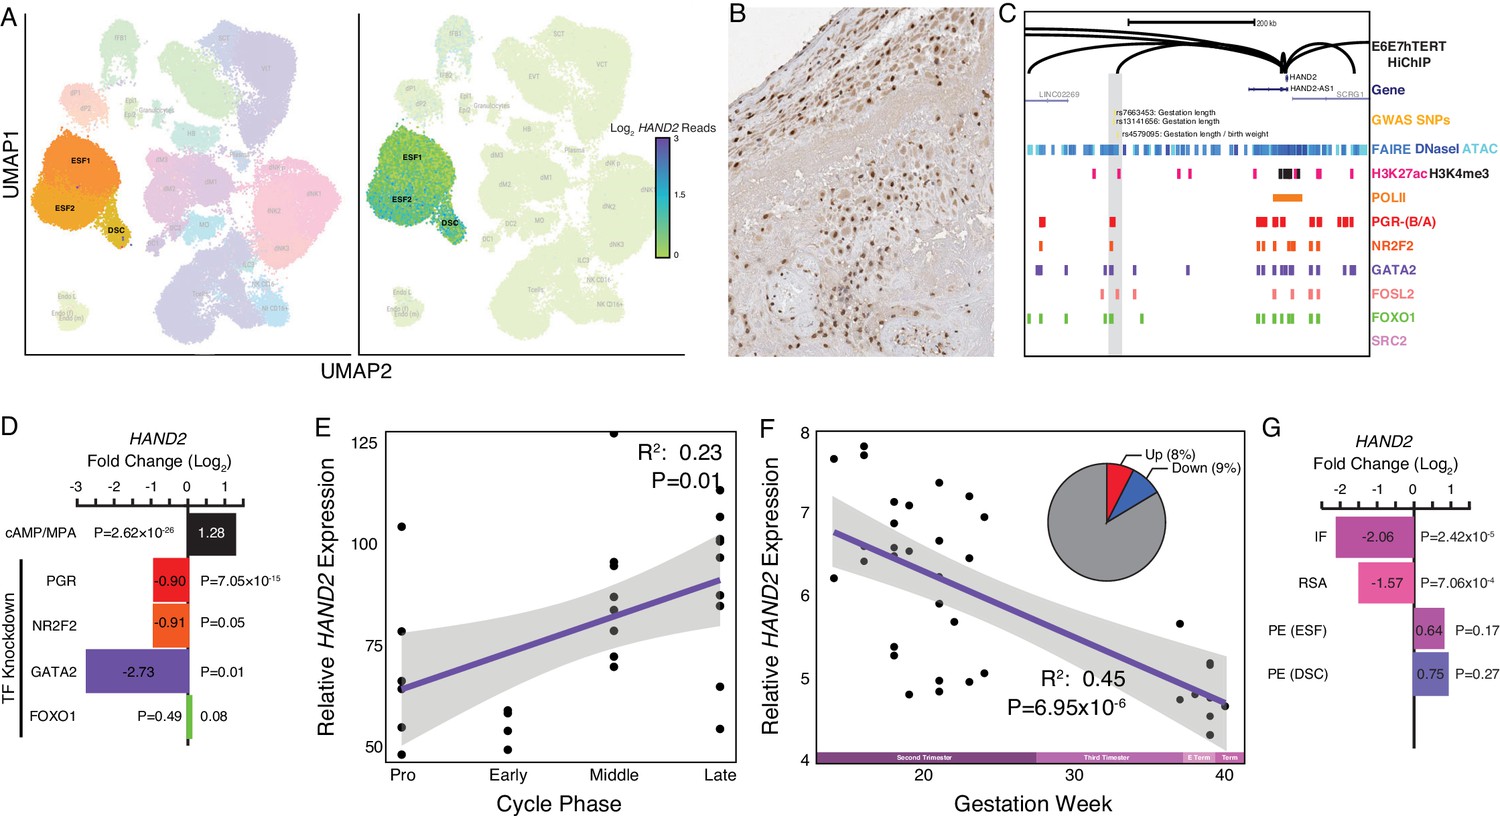
Expression of HAND2 at the maternal-fetal interface.
(A) UMAP clustering of scRNA-Seq data from human first trimester maternal-fetal interface. Left, clusters colored according to inferred cell type. The ESF1, ESF2, and DSC clusters are highlighted. Right, cells within clusters are colored according to HAND2 expression level. scRNA-Seq data from Vento-Tormo et al., 2018. (B) HAND2 protein expression in human pregnant decidua, with strong staining and localization in the nuclei of endometrial stromal cells. Image credit: Human Protein Atlas. (C) Regulatory landscape of the HAND2 locus. Chromatin loops inferred from H3K27ac HiChIP, regions of open chromatin inferred from FAIRE-, DNaseI, and ATAC-Seq, and the locations of histone modifications and transcription factor ChIP-Seq peaks are shown. The location of SNPs associated with gestation length / birth weight is also shown (highlighted in gray). Note that the HAND2 promoter forms a long-range loop to a region marked by H3K27ac and bound by PGR, NR2F2 (COUP-TFII), GATA2, FOSL2, and FOXO1. (D) HAND2 expression is up-regulated by in vitro decidualization of ESFs into DSC by cAMP/progesterone treatment, and down-regulated by siRNA-mediated knockdown of PGR and GATA2, but not NR2F2 or FOXO1. n = 3 per transcription factor knockdown. (E) Relative expression of HAND2 in the proliferative (n = 6), early (n = 4), middle (n = 9), and late (n = 8) secretory phases of the menstrual cycle. Note that outliers are excluded from the figure but not the regression; 95% CI is shown in gray. Gene expression data from Talbi et al., 2006. (F) Relative expression of HAND2 in the basal plate from mid-gestation to term (14–40 weeks, n = 36); 95% CI is shown in gray. Inset, percent of up- (Up) and down-regulated (Down) genes between weeks 14–19 and 37–40 of pregnancy (FDR ≤ 0.10). Gene expression data from Winn et al., 2007. (G) HAND2 expression is significantly down-regulated in the endometria of women with implantation failure (IF, n = 5) and recurrent spontaneous abortion (RSA, n = 5) compared to fertile controls (n = 5), but is not differentially expressed in ESFs or DSCs from women with preeclampsia (PE, n = 5) compared to healthy controls (n = 5). Gene expression data for RSA and IF from Lédée et al., 2011 and for PE from Garrido-Gomez et al., 2017.
© 2021, Human Protein Atlas. Figure 2B is adapted from the Human Protein Atlas (lower left part of top image cropped and rotated, image color auto adjusted). Published under a CC BY SA 3.0 unported license.
Figure 3
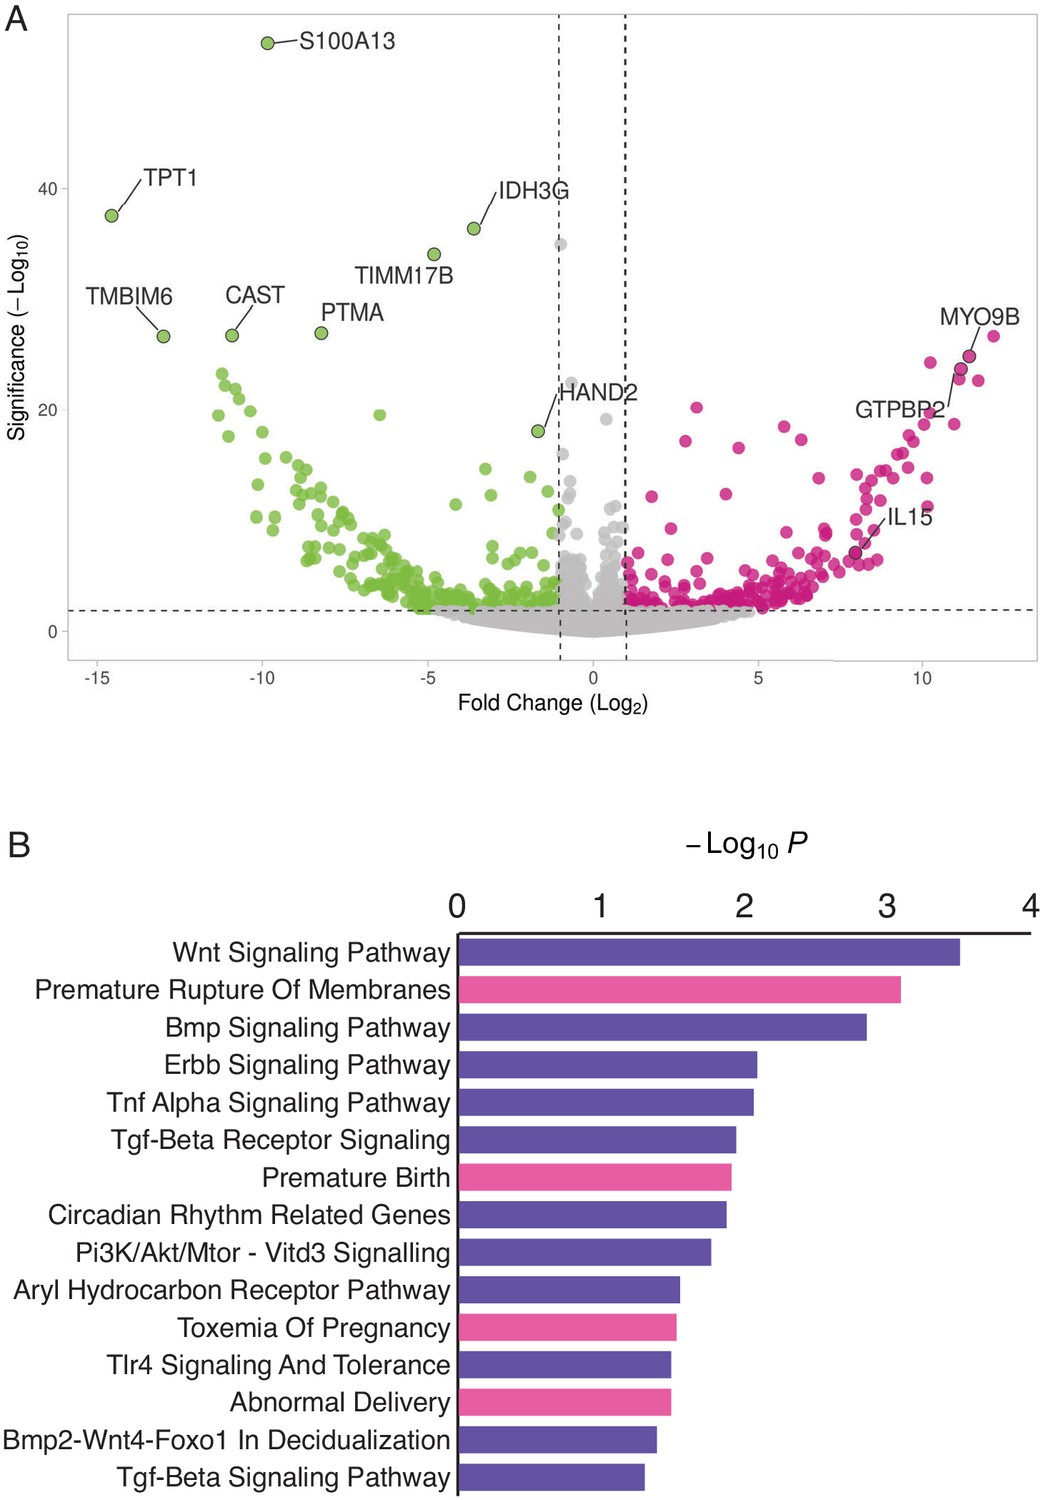
HAND2 regulates a distinct set of target genes, including IL15.
(A) Volcano plot of gene expression upon HAND2 knockdown. Only genes that are significantly differentially expressed (DE) with FDR ≤ 0.10 are colored. Genes with ≥ 1 fold changes in expression are shown in pink (up-regulated), green (down-regulated) or gray (not differentially expressed). X-axis shows log2 fold change, Y-axis shows Wald statistic p-value, horizontal dashed line indicates FDR = 0.10. Full list of DE genes can be found in Figure 3—source data 1. (B) Pathways (purple) and human phenotype ontologies (pink) in which genes dysregulated upon HAND2 knockdown are enriched. We used a hypergeometric p-value to determine enriched pathway and disease ontology terms. The Benjamini-Hochburg Adjusted p-value (FDR), Odds Ratio, Combined Score, and Genes associated with each term can be found in Figure 3—source data 2 and Figure 3—source data 3.
-
Figure 3—source data 1
Genes differentially expressed (DE) upon HAND2 knockdown.
RNA-Seq reads were mapped to hg38 using HISAT2, transcripts were assembled and quantified using StringTie, and DE genes were identified using DESeq2. The reference file for StringTie guided assembly was wgEncodeGencodeBasicV33. Columns indicate: Ensembl stable transcript IDs (A), HUGO gene names (B), Base mean expression level (C), Log2 fold change upon HAND2 knockdown (D), Standard Error of Log2 fold change (E), Walds-Statistic for differential expression (F), p-value of the Walds-Statitic (G), and Benjamini-Hochberg corrected p-values (H).
- https://cdn.elifesciences.org/articles/61257/elife-61257-fig3-data1-v2.xlsx
-
Figure 3—source data 2
Pathways (Wikipathway 2019) enriched among genes differentially expressed by HAND2 knockdown.
- https://cdn.elifesciences.org/articles/61257/elife-61257-fig3-data2-v2.xlsx
-
Figure 3—source data 3
Human phenotype (disease) ontology terms enriched among genes differentially expressed by HAND2 knockdown.
- https://cdn.elifesciences.org/articles/61257/elife-61257-fig3-data3-v2.xlsx
Figure 4
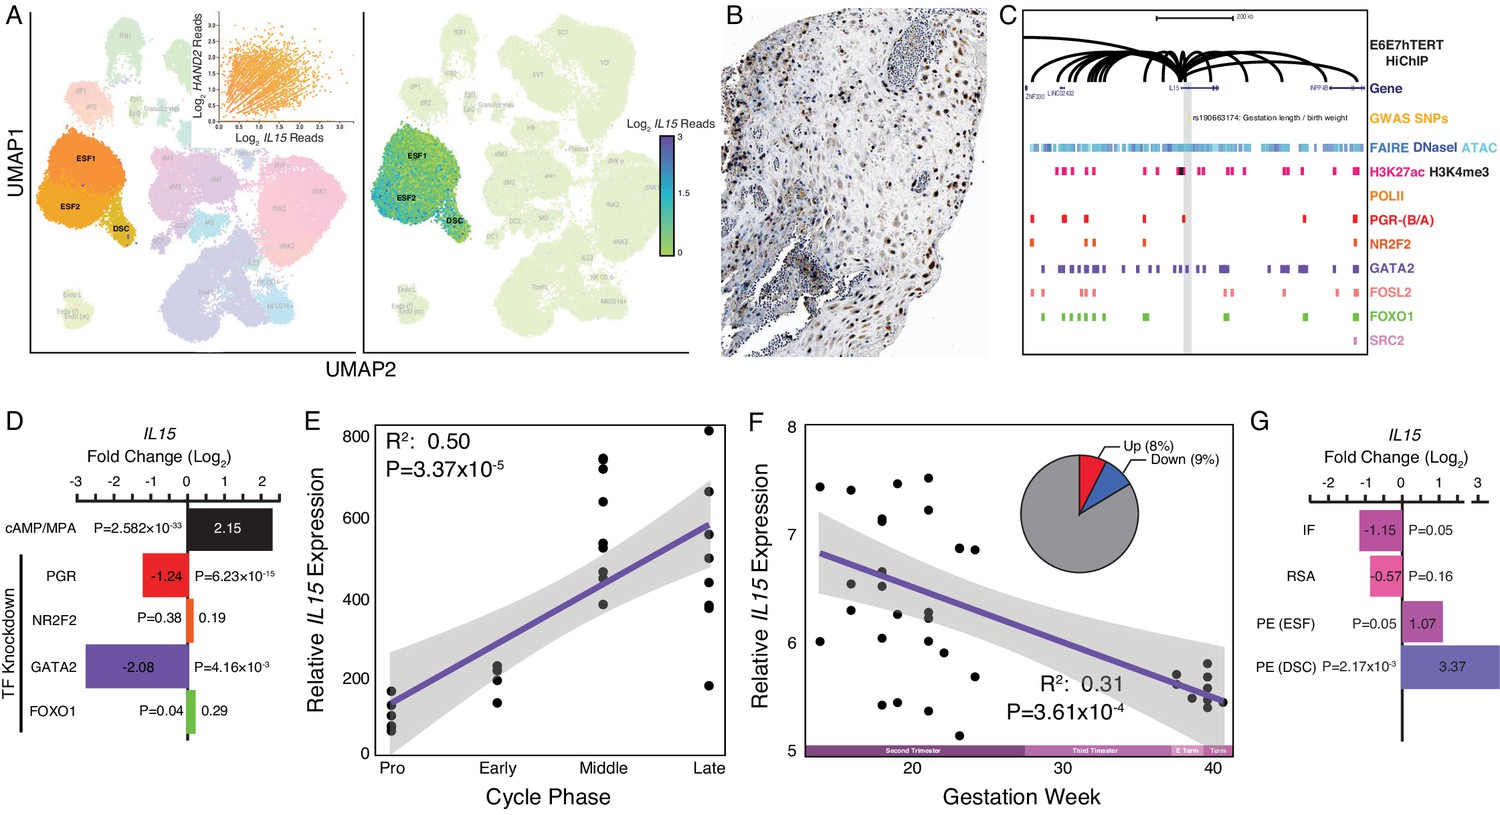
Expression of IL15 at the maternal-fetal interface.
(A) UMAP clustering of scRNA-Seq data from human first trimester maternal-fetal interface. Left, clusters colored according to inferred cell type. The ESF1, ESF2, and DSC clusters are highlighted. Inset, per cell expression of HAND2 and IL15 in ESF1s, ESF2s, and DSCs. Right, cells within clusters are colored according to IL15 expression level. scRNA-Seq data from Vento-Tormo et al., 2018. (B) IL15 protein expression in human pregnant decidua, with strong cytoplasmic staining in endometrial stromal cells. Image credit: Human Protein Atlas. (C) Regulatory landscape of the IL15 locus. Chromatin loops inferred from H3K27ac HiChIP, regions of open chromatin inferred from FAIRE-, DNaseI, and ATAC-Seq, and the locations of histone modifications and transcription factor ChIP-Seq peaks are shown. The location of an SNP associated with gestation length / birth weight is also shown (highlighted in gray). Note that the IL15 promoter forms many long-range loops to regions marked by H3K27ac and bound by PGR, NR2F2 (COUP-TFII), GATA2, FOSL2, FOXO1, and SRC2. (D) IL15 expression is upregulated by in vitro decidualization of ESFs into DSC by cAMP/progesterone treatment, and downregulated by siRNA-mediated knockdown of PGR and GATA2 but not NR2F2 or FOXO1. n = 3 per transcription factor knockdown. (E) Relative expression of IL15 in the proliferative (n = 6), early (n = 4), middle (n = 9), and late (n = 8) secretory phases of the menstrual cycle. Note that outliers are excluded from the figure but not the regression; 95% CI is shown in gray. Gene expression data from Talbi et al., 2006. (F) Relative expression of IL15 in the basal plate from mid-gestation to term (14–40 weeks, n = 36); 95% CI is shown in gray. Inset, percent of up- (Up) and downregulated (Down) genes between weeks 14–19 and 37–40 of pregnancy (FDR ≤ 0.10). Gene expression data from Winn et al., 2007. (G) IL15 expression is significantly upregulated in DSCs from women with preeclampsia (PE, n = 5) compared to healthy controls (n = 5), while it is only marginally upregulated in ESFs from the same patient group. It is also marginally downregulated in the endometria of women with implantation failure (IF, n = 5) and it is not differentially expressed in the endometria of women with recurrent spontaneous abortion (RSA, n = 5) compared to fertile controls (n = 5). Gene expression data for RSA and IF from Lédée et al., 2011 and for PE from Garrido-Gomez et al., 2017.
© 2021, Human Protein Atlas. Figure 4B is adapted from the Human Protein Atlas (top image cropped, image color auto adjusted). Published under a CC BY SA 3.0 unported license.
Figure 5

ESF-derived IL15 promotes NK and trophoblast migration in trans-well assays.
(A) Cartoon of trans-well migration assay comparisons. Cells that migrated to the lower chamber were quantified using the CellTiter-Glo luminescent cell viability assay after 8 hr. (B) Primary natural killer (NK) cells. Raw luminescence data (RLU) from cells in the lower chamber is shown in the upper panel, mean difference (effect size) in experiment minus control luminescence values are shown as dots with the 95% confidence interval indicated by vertical bars in the lower panel; distribution estimated from 5000 bootstrap replicates. The mean difference between Media and media supplemented with recombinant human IL15 (Media+rhIL15) is 0.432 [95.0% CI: 0.376–0.492]; p = 0.00. The mean difference between ESFs transiently transfected with non-targeting siRNA (NT siRNA) and HAND2-specific siRNAs (siHAND2) is 0.847 [95.0% CI: 0.774–0.936]; p = 0.00. The mean difference between ESFs transiently transfected with NT siRNA and IL15-specific siRNAs (siIL15) is −0.223 [95.0% CI: −0.256 – −0.192]; p = 0.00. The mean difference between ESF media neutralized with a non-specific antibody (IgG) or IL15-specific antibody (abIL15) is −0.106 [95.0% CI: −0.147 – −0.067]; p = 0.00. n = 12. (C) Extravillous trophoblast cell line HTR-8/SVneo. Raw luminescence data (RLU) from cells in the lower chamber is shown in the upper panel, mean difference (effect size) in experiment minus control luminescence values are shown as dots with the 95% confidence interval indicated by vertical bars in the lower panel; distribution estimated from 5000 bootstrap replicates. The mean difference between Media and Media+rhIL15 is 0.482 [95.0% CI: 0.193–0.701]; p = 0.002. The mean difference between ESFs transiently transfected with NT siRNA and siHAND2 is 0.463 [95.0% CI: 0.291–0.559]; p = 0.00. The mean difference between ESFs transiently transfected with NT siRNA and siIL15 is −0.598 [95.0% CI: −0.698–0.490]; p = 0.00. The mean difference between ESF media neutralized with IgG or abIL15 is −0.267 [95.0% CI: −0.442 – −0.151]; p = 0.0004. n = 12. (D) Model of HAND2 functions in the endometrium. During the proliferative phase HAND2 inhibits IL15, and thus the migration of uNK and trophoblast cells. In the receptive phase, HAND2 activates IL15, which promotes migration of uNK and trophoblast cells. In the receptive phase and early pregnancy (EP), HAND2 suppresses estrogen signaling by down-regulating FGFs and directly binding and inhibiting the ligand-dependent transcriptional activation function of ESR1. During late pregnancy/term (LP/Term), reduced HAND2 expression mitigates its anti-estrogenic functions. Parturition signal unknown (???). ESF = endometrial stromal fibroblasts (proliferative phase), DSC = decidual stromal cells (receptive phase), LE = luminal epithelium.
-
Figure 5—source data 1
Raw and log transformed luminescence data for NK trans-well migration assays.
- https://cdn.elifesciences.org/articles/61257/elife-61257-fig5-data1-v2.xlsx
-
Figure 5—source data 2
Raw and log transformed luminescence data for HTR-8 trans-well migration assays.
- https://cdn.elifesciences.org/articles/61257/elife-61257-fig5-data2-v2.xlsx
Author response image 1
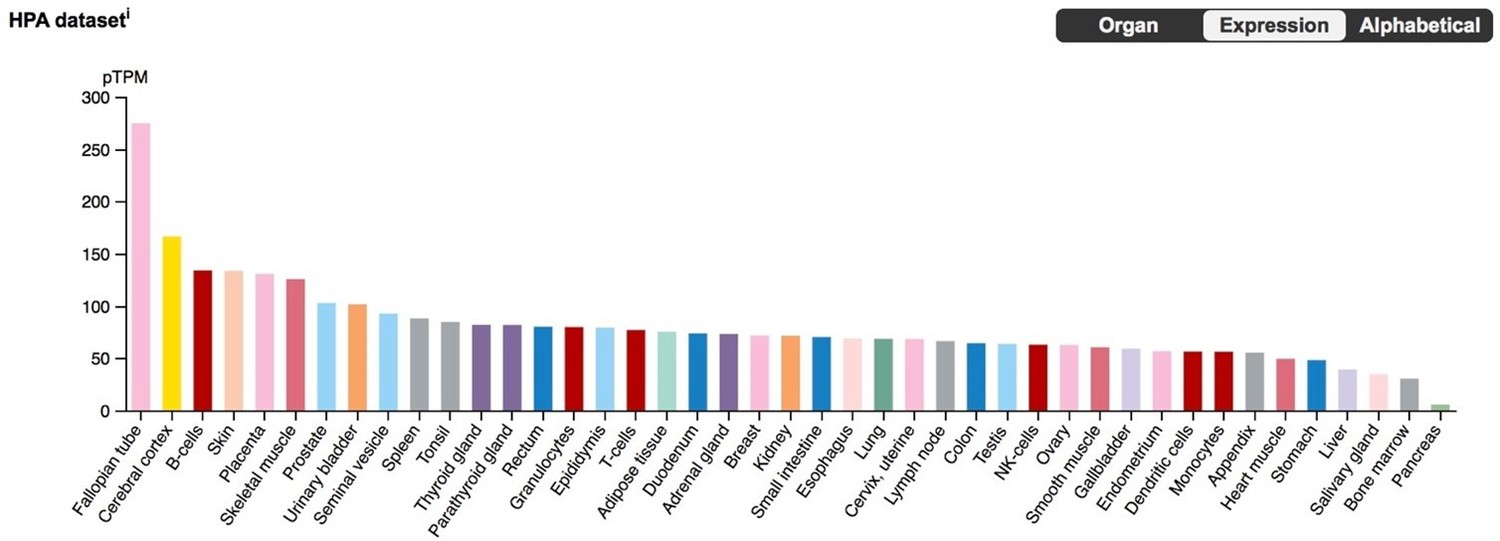
BLCAP expression in the Human Protein Atlas (HPA) RNA-Seq datasets, with tissues sorted by expression level.
Author response image 2

Tables
Table 1
Genes dysregulated by HAND2 knockdown are enriched in pathways relevant to endometrial stromal cells and pregnancy in general.
| Enriched pathway | Roles in ESFs and pregnancy | References |
|---|---|---|
| Wnt Signaling | Decidualization | Peng et al., 2008; Hayashi et al., 2009; Sonderegger et al., 2010; Franco et al., 2011; Wang et al., 2013 |
| BMP Signaling | Decidualization | Ying and Zhao, 2000; Lee et al., 2007; Li et al., 2007; Wetendorf and DeMayo, 2012 |
| ErbB Signaling | Decidualization | Lim et al., 1997; Klonisch et al., 2001; Large et al., 2014 |
| TGF-beta Receptor Signaling | Decidualization | Jones et al., 2006; Li, 2014; Ni and Li, 2017 |
| BMP2-WNT4-FOXO1 Pathway in Human Primary Endometrial Stromal Cell Differentiation | Decidualization | Gellersen and Brosens, 2003; Buzzio et al., 2006; Lee et al., 2007; Li et al., 2007; Brayer et al., 2011; Lynch et al., 2009; Kajihara et al., 2013 |
| AGE/RAGE Pathway | Placental bed development disorders Preeclampsia Induction of pro-inflammatory factors via nuclear factor-κB (NFκB) | Chekir et al., 2006; Lappas et al., 2007; Oliver et al., 2011; Guedes-Martins et al., 2013 |
| Aryl Hydrocarbon Receptor Pathway | Mediation of maternal immunotolerance to fetal allograft | Munn et al., 1998; Abbott et al., 1999; Funeshima et al., 2005; Hao et al., 2013 |
| Circadian Rhythm Related Genes | Implantation and parturition | Roizen et al., 2007; Olcese, 2012; Olcese et al., 2013; Greenhill, 2014; Menon et al., 2016 |
| RAC1/PAK1/p38/MMP2 Pathway | Decidual inflammation, senescence and parturition | Menon et al., 2016 |
Table 2
Exemplar genes differentially expressed in ESFs upon siRNA-mediated HAND2 knockdown.
Mean, base mean expression level. FC, log2 fold change. SE, standard error in log2 fold change. WS, Wald statistic. p-Value, Wald test p-value. Adj-p, Benjamini-Hochberg (BH) adjusted p-value. Function, function of gene inferred from Wikipathway 2019 human annotation. Association with preterm birth (PTB, HP:0001622) and premature rupture of membranes (PROM, HP:0001788) inferred from human phenotype ontology annotation*.
| Gene | Mean | FC | SE | WS | p-Value | Adj-p | Function |
|---|---|---|---|---|---|---|---|
| ARNT2 | 44.47 | 1.20 | 0.28 | 4.30 | 1.73E-05 | 1.89E-03 | AHR signaling / Circadian rhythm |
| ARNTL | 42.52 | −2.95 | 0.80 | −3.67 | 2.46E-04 | 1.79E-02 | AHR signaling / Circadian rhythm |
| IL15 | 63.31 | 7.98 | 1.49 | 5.37 | 7.91E-08 | 1.49E-05 | Cell migration |
| BMP4 | 58.10 | −8.34 | 1.25 | −6.66 | 2.75E-11 | 8.28E-09 | Decidualization |
| GSK3B | 69.23 | −5.53 | 1.48 | −3.73 | 1.94E-04 | 1.49E-02 | Decidualization |
| HAND2 | 136.06 | −1.63 | 0.18 | −8.85 | 9.10E-19 | 7.64E-16 | Knocked down gene |
| CHUK | 765.77 | 0.44 | 0.14 | 3.14 | 1.67E-03 | 7.94E-02 | NFκB pathway |
| IκBKE | 9.91 | −5.41 | 1.65 | −3.27 | 1.06E-03 | 5.72E-02 | NFκB pathway |
| MYD88 | 95.02 | −0.93 | 0.26 | −3.55 | 3.88E-04 | 2.59E-02 | NFκB pathway |
| NFκBIE | 106.63 | −0.78 | 0.25 | −3.08 | 2.10E-03 | 9.53E-02 | NFκB pathway |
| RTKN2 | 50.64 | 8.02 | 1.33 | 6.02 | 1.75E-09 | 4.05E-07 | NFκB pathway |
| CRKL | 1278.85 | −0.31 | 0.09 | −3.31 | 9.21E-04 | 5.10E-02 | PTB |
| EOGT | 233.65 | −2.77 | 0.80 | −3.45 | 5.63E-04 | 3.38E-02 | PTB |
| LMNA | 773.24 | 6.97 | 1.57 | 4.44 | 8.92E-06 | 1.06E-03 | PTB; PROM |
| PEX11B | 181.31 | 10.05 | 1.12 | 9.00 | 2.28E-19 | 2.06E-16 | PTB |
| SERPINH1 | 1654.90 | −6.01 | 1.31 | −4.59 | 4.40E-06 | 5.61E-04 | PROM |
| SLC17A5 | 826.28 | 0.76 | 0.13 | 5.81 | 6.34E-09 | 1.40E-06 | PTB |
| ZMPSTE24 | 2140.67 | −0.19 | 0.05 | −4.10 | 4.10E-05 | 3.92E-03 | PTB; PROM |
-
*Extended list of genes associated with the pathologies of pregnancy and their expression levels can be found in Table 2—source data 1 used to generate Figures 2G and 4G. (GSE26787 = recurrent spontaneous abortion [RSA] and implantation failure [IF]; GSE91077 = ESFs and DSCs from women with preeclampsia [PE]).
-
Table 2—source data 1
Differential expression of genes in RSA, IF and PE (in ESFs and DSCs) in relation to genes differentially expressed upon HAND2 knockdown in ESFs.
- https://cdn.elifesciences.org/articles/61257/elife-61257-table2-data1-v2.xlsx
Additional files
Download links
A two-part list of links to download the article, or parts of the article, in various formats.
Downloads (link to download the article as PDF)
Open citations (links to open the citations from this article in various online reference manager services)
Cite this article (links to download the citations from this article in formats compatible with various reference manager tools)
Evolutionary transcriptomics implicates HAND2 in the origins of implantation and regulation of gestation length
eLife 10:e61257.
https://doi.org/10.7554/eLife.61257


