Single-cell transcriptomics of the Drosophila wing disc reveals instructive epithelium-to-myoblast interactions
- Department of Molecular and Cell Biology, University of California, Berkeley, United States
- Department of Electrical Engineering & Computer Science, Center for Computational Biology, UC Berkeley, University of California, Berkeley, United States
Figures
Figure 1 with 6 supplements
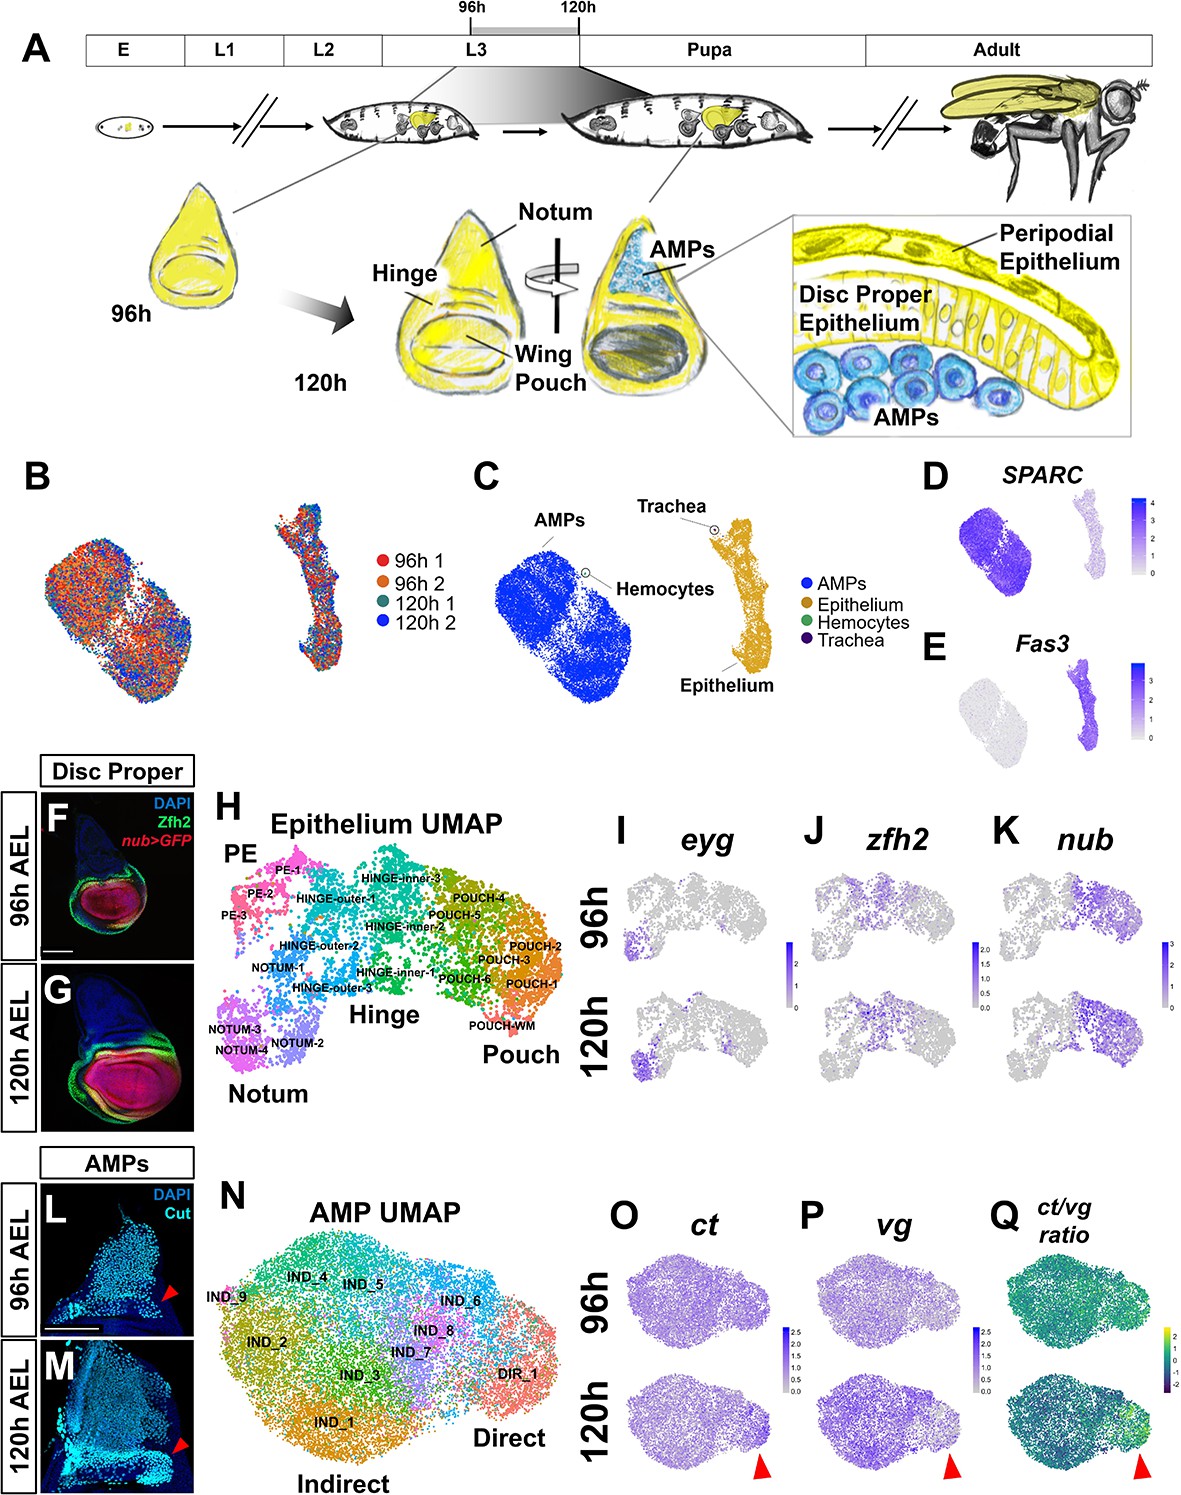
Temporal cell atlas of the developing wing-imaginal disc.
(A) Timeline of Drosophila development: embryo (E), larval phases (L1–L3), pupa, and adult. Diagram of the wing-imaginal disc within the third larval instar (L3) from mid (96 hr) and late (120 hr) time points after egg lay (AEL). The epithelial cells of the wing disc become the adult wing blade, hinge, and the majority of the dorsal thorax (shown in yellow). The myoblasts associated with the basal surface of the disc proper epithelium are the adult muscle precursors (AMPs) (shown in blue), which generate the adult flight muscles. (B, C) UMAP of harmonized single-cell datasets with cells colored by batch (two time points with biological replicates) (B) and by major cell type (C). The AMPs and epithelial cells are distinguished by expression of SPARC (D) and Fas3 (E), respectively. (F, G) Mid and late third instar wing-imaginal discs with the pouch marked by nub-GAL4 driving the expression of GFP (red) and the hinge marked with anti-Zfh2 (green). DAPI (blue) stains all nuclei. (H) UMAP of harmonized epithelium cells, colored by unsupervised clustering identities and manually labeled by the expression of marker genes. (I–K) UMAPs with cells colored by their expression levels of eyg (I), zfh2 (J), and nub (K) at both developmental time points. (L, M) Wing discs from 96 hr (L) and 120 hr (M) AEL, stained with anti-Cut to visualize the AMPs. Red arrowheads indicate location of direct AMPs, identifiable at 120 hr by higher anti-Cut staining and inferred by location at 96 hr. (N) UMAP of harmonized AMPs, colored by unsupervised clustering after cell cycle and cell sex stratification correction (see Figure 1—figure supplements 4 and 5). Cell clusters were classified as direct (DIR_1) or indirect AMPs (IND_1–9) based on marker gene expression (see Figure 1—figure supplement 5E, F). (O–Q) UMAPs separated by developmental time points showing the expression of canonical markers of direct and indirect AMPs, ct (O) and vg (P), and the ratio of these two genes within cells (Q). Red arrowheads highlight differential expression of these genes in the direct AMPs at 120 hr. Color scales for UMAPs correspond to normalized (by total unique molecular identifiers [UMIs]) counts on a natural-log scale. Microscopy scale bars = 100 μm.
Figure 1—figure supplement 1
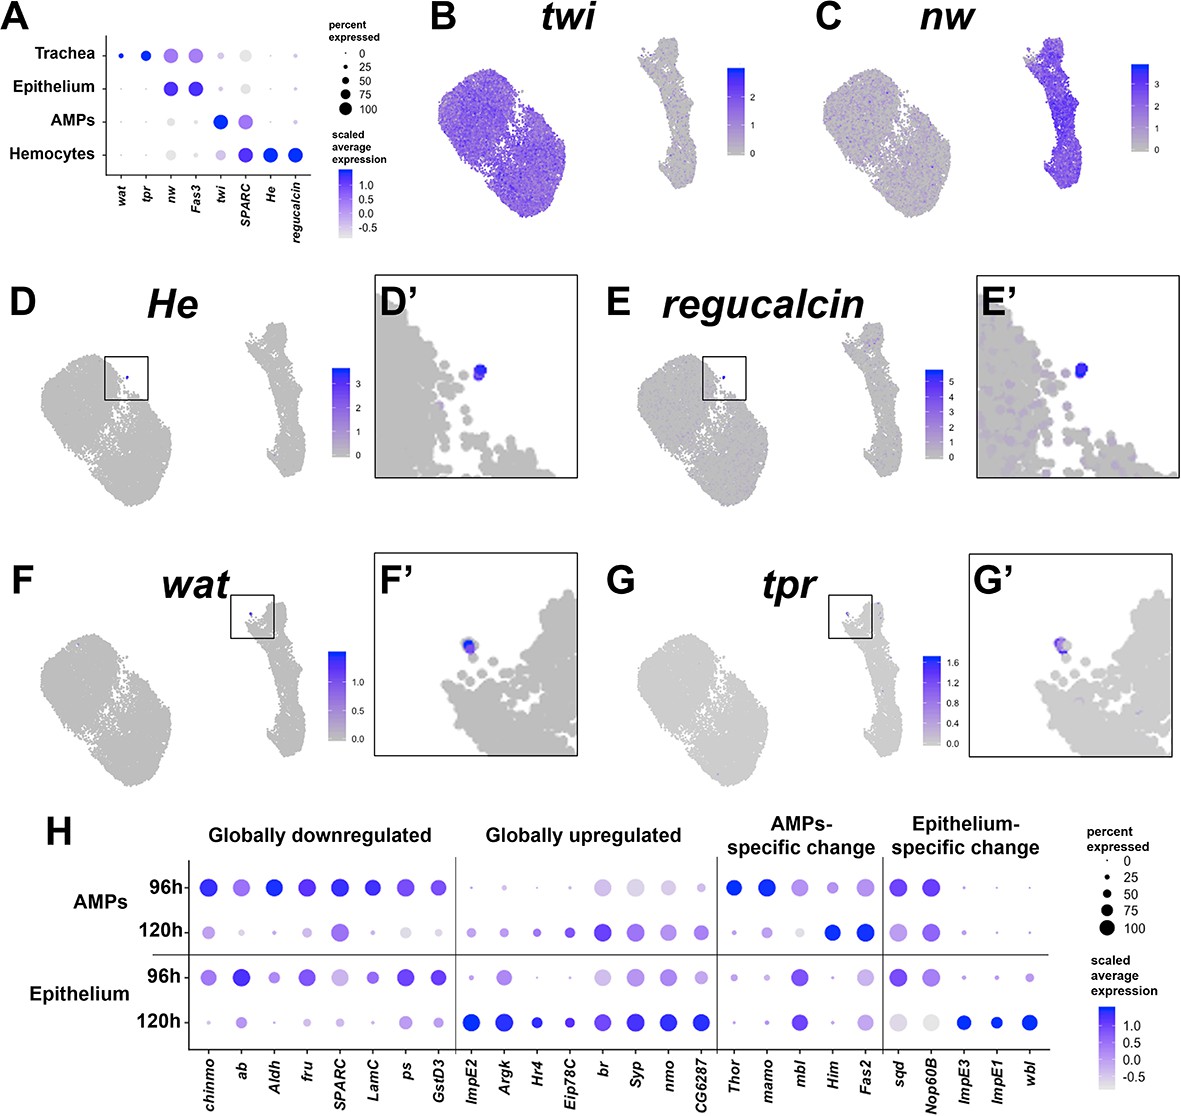
Cell-type identification and temporal changes within major cell types.
(A) Dot plot summarizing gene expression for known markers of each of the identified cell types. For a gene of interest, the size of the dot indicates the percent of cells that express the gene and the color of the dot indicates the relative gene expression level (see Materials and methods). (B–G') UMAPs of full dataset showing expression levels for the following genes: adult muscle precursor (AMP) cell marker twist (twi) (B), epithelial cell marker narrow wing (nw) (C), hemocyte markers Hemese (He) (D, D') and regucalcin (E, E'), and tracheal cell markers waterproof (wat) (F, F') and tracheal-prostasin (tpr) (G, G'). Boxes in (D’), (E’), (F’), and (G’) are magnifications of indicated regions of the UMAP to show the cells that express the given marker gene. Color scales for UMAPs correspond to normalized (by total UMI) counts on a natural-log scale. (H) Dot plot summarizing gene expression changes from 96 to 120 hr, which were observed within both the epithelium and AMPs (‘globally downregulated/upregulated’) or mostly within a single cell type (‘AMP-specific/epithelium-specific changes’). Genes shown are differentially expressed between the two time points in the indicated populations (false discovery rate < 0.05 for all pairwise comparisons).
Figure 1—figure supplement 2
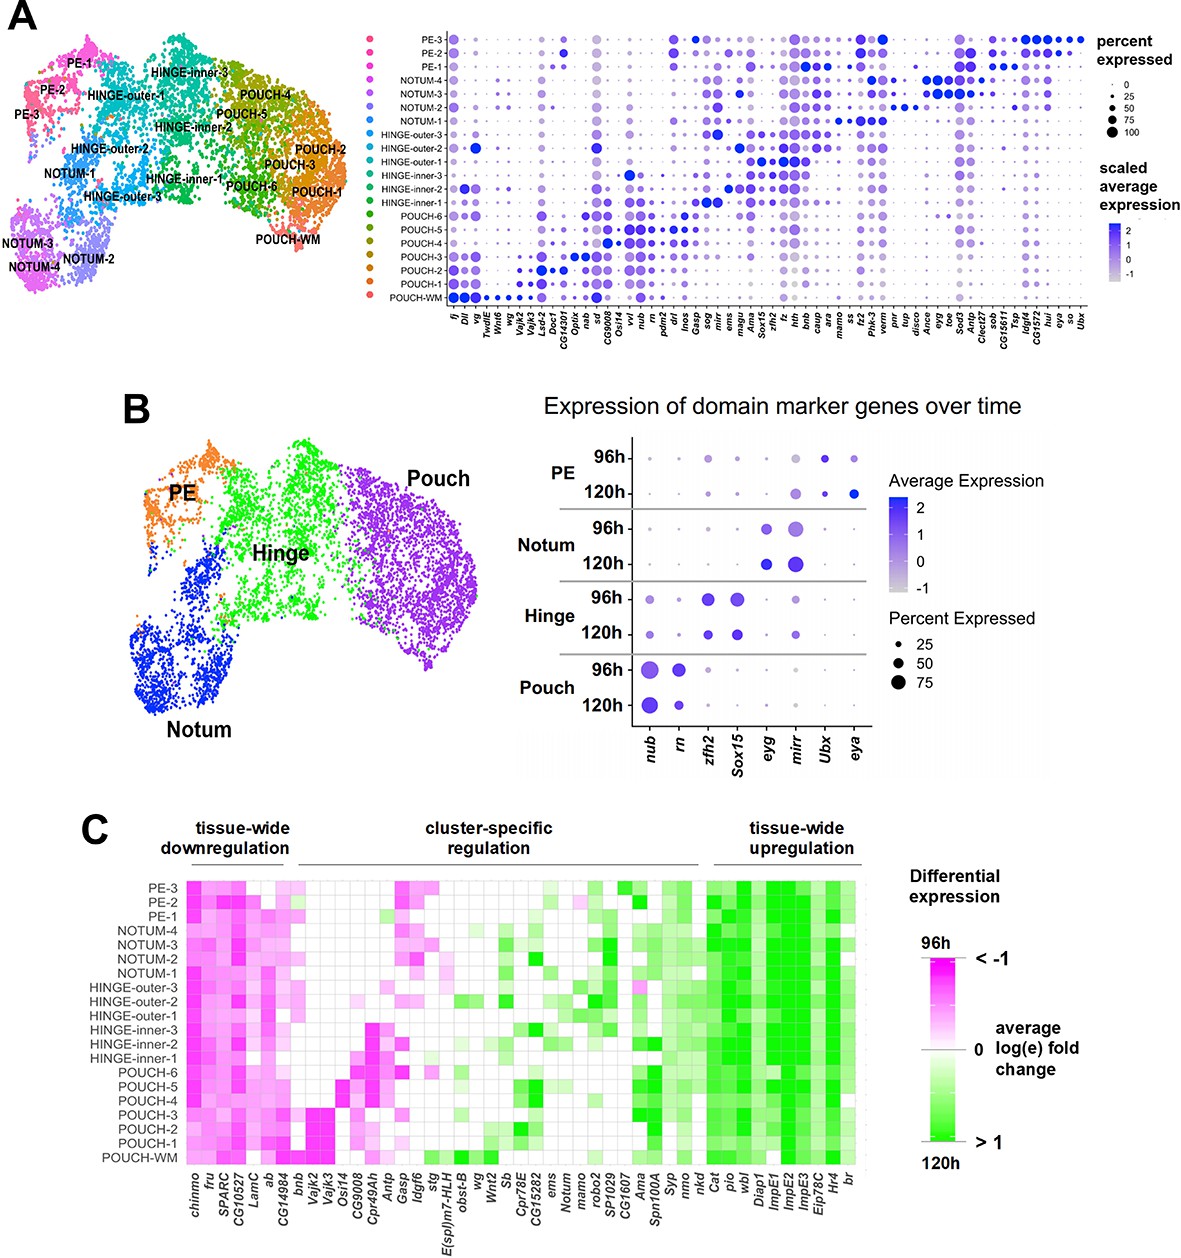
Temporal cell atlas of the wing disc epithelium.
(A) UMAP of epithelium cells, colored by cluster identities (same as in Figure 1H). Dot plot showing the level and percent of differentially-expressed (false discovery rate [FDR] < 0.05) marker gene expression for the cell clusters. Note that there are many genes that are expressed in a gradient. (B) UMAP of epithelium cells, where cell clusters have been merged into the major domains (pouch, hinge, notum, and peripodial epithelium [PE]). Dot plot summarizing the expression over time of marker genes for the major domains of the disc epithelium. Note that the expression of these marker genes remains relatively constant over this developmental window. (C) Plot showing differential gene expression for developmentally regulated genes for the epithelium cell clusters. All genes shown were differentially expressed between time points in at least once cluster (FDR < 0.05 for all pairwise comparisons, see Materials and methods). Non-significant fold-changes were set to have a value of zero within the plot. Natural-log fold-change of expression was calculated for each of the cell clusters between cells of 96 and 120 hr and is capped at ±1 for better visualization. Genes were selected to highlight different expression dynamics as either changing throughout most of the clusters (‘tissue-wide downregulation/upregulation’) or only having cluster-specific changes (‘cluster-specific regulation’).
Figure 1—figure supplement 3
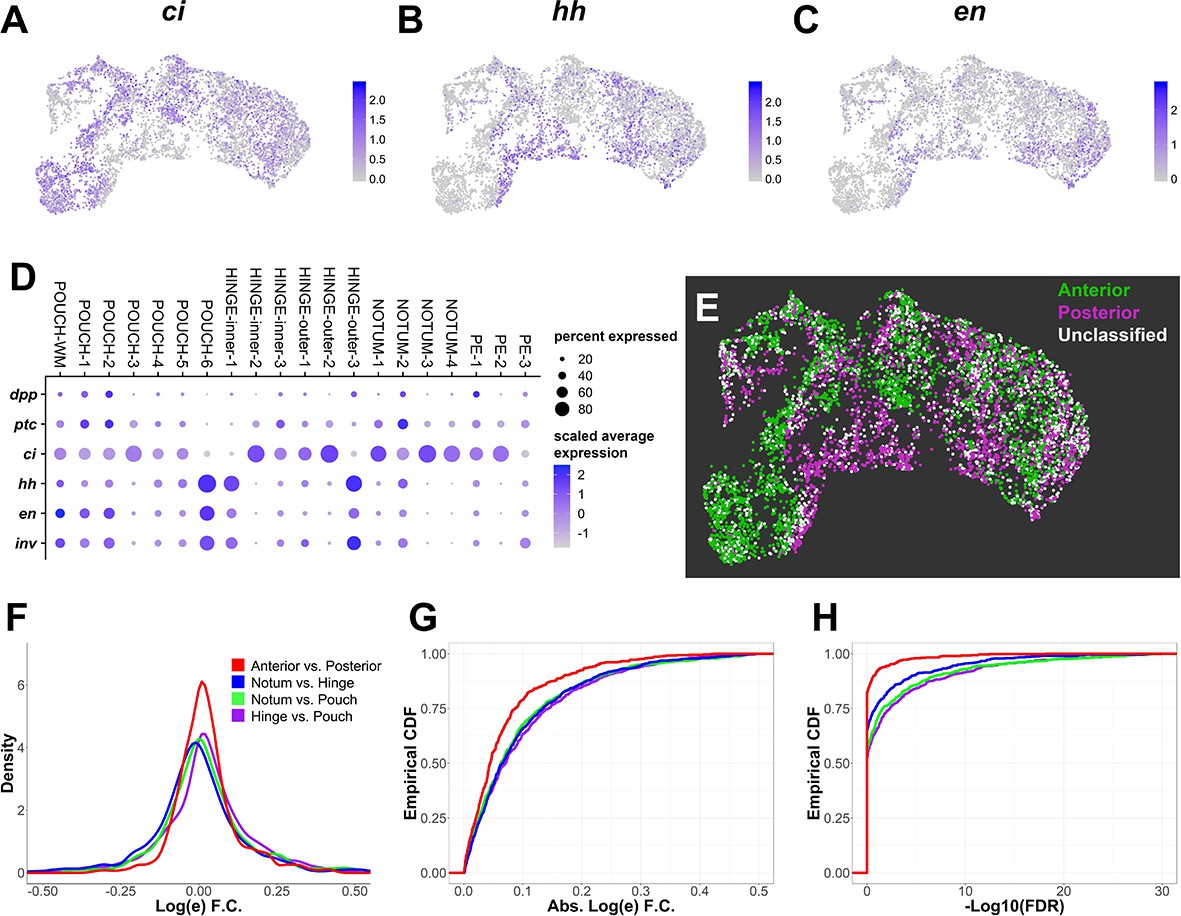
Proximodistal axis stratifies the data more than anteroposterior axis.
(A–C) UMAPs of disc epithelium single-cell data showing expression levels of anterior compartment marker ci (A) and posterior compartment markers hh (B) and en (C). (D) Dot plot summarizing expression of known anterior and posterior markers within the unsupervised clusters of the disc epithelium data. Note that most clusters express both anterior and posterior markers, except for NOTUM-3, NOTUM-4, and HINGE-inner-2, which are primarily anterior, and POUCH-6 and HINGE-inner-1, which are primarily posterior (see also Figure 2—figure supplement 1). (E) UMAP of anterior–posterior cell classification of disc epithelium data. Anterior cells have at least one transcript of anterior-compartment marker ci, whereas posterior cells have at least one transcript of posterior-compartment markers hh, en, or inv. Cells with transcripts for markers of both compartments or cells that lacked markers for either compartment were labeled as ‘unclassified’. (F–H) Distributions of log fold-changes (F, G) and false discovery rate (FDR) values (H) of differential gene expression between regions of the disc epithelium. Differential expression was limited to variable genes within the disc epithelium. (F) displays the density (or distribution) of log fold-changes of variable genes between regions of the epithelium. (G) and (H) display the empirical cumulative distribution function (ECDF) of log fold-changes (G) and FDR (H) of variable genes between regions of the epithelium. These ECDF plots are calculated as the percentage of variable genes (y-axis) below a particular log-fold-change magnitude (G) or FDR threshold (H). Note that differential gene expression between anterior and posterior cells is less dramatic than all other comparisons; log fold-changes of variable genes between anterior and posterior cells are less extreme (the density is heavier around 0 in F and the ECDF has a steeper rise in G), and the associated FDR values are less significant (the ECDF in H has a steeper rise). UMAP color scales correspond to normalized (by total UMI) counts on a natural-log scale.
Figure 1—figure supplement 4
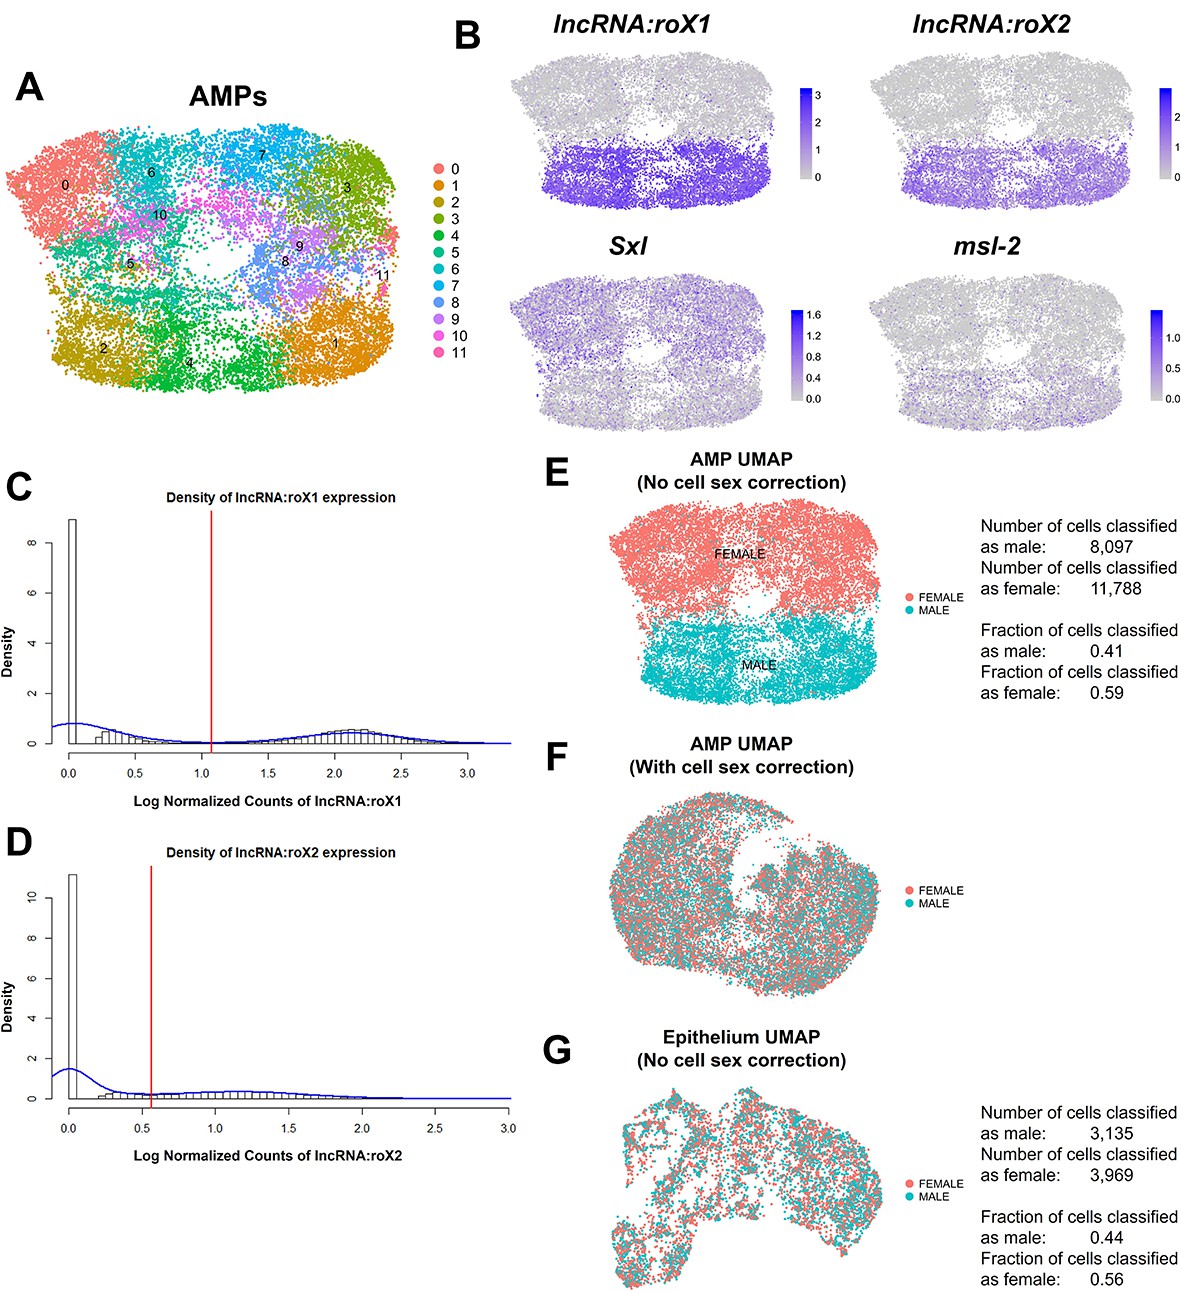
Correction of cell sex stratification within adult muscle precursor (AMP) scRNAseq data.
(A) UMAP of AMP single-cell data, as processed by our standard computational pipeline (without correction for cell sex or cell cycle). Colors correspond to 12 computational cell clusters as determined by unbiased clustering. (B) UMAPs showing expression of sex-specific genes lncRNA:roX1, lncRNA:roX2, Sex lethal (Sxl), and male-specific lethal 2 (msl-2). Note that the UMAPs show significant stratification based on the expression of these sex markers. (C, D) Probability histogram plots of the natural-log normalized expression counts for lncRNA:roX1 (C) and lncRNA:roX2 (D) within all cells. Density curves for the data are shown in blue. Red lines are drawn on the first local minima within the density of the data and serve as a cutoff for classifying cells as having either high or low expression of either gene. Cells with high expression of either lncRNA:roX1 or lncRNA:roX2 were classified as male-originating; otherwise, cells were designated as female-originating. (E) Classification of cell sex shown on our standard analysis UMAP of AMPs. (F) Classification of cell sex shown via UMAP after computationally correcting for cell sex stratification. Correction was performed by treating cell sex as a batch effect during data processing. Note that compared to (E) male-originating and female-originated cells are now interspersed within the UMAP. (G) Classification of cell sex shown on our standard analysis UMAP of epithelial cells. Note that male-originating and female-originated cells are interspersed within the UMAP without need for correction. Quantifications for the male–female classification within AMPs and epithelial cells are provided next to the UMAPs in (E) and (G), respectively. UMAP color scales correspond to normalized (by total UMI) counts on a natural-log scale.
Figure 1—figure supplement 5
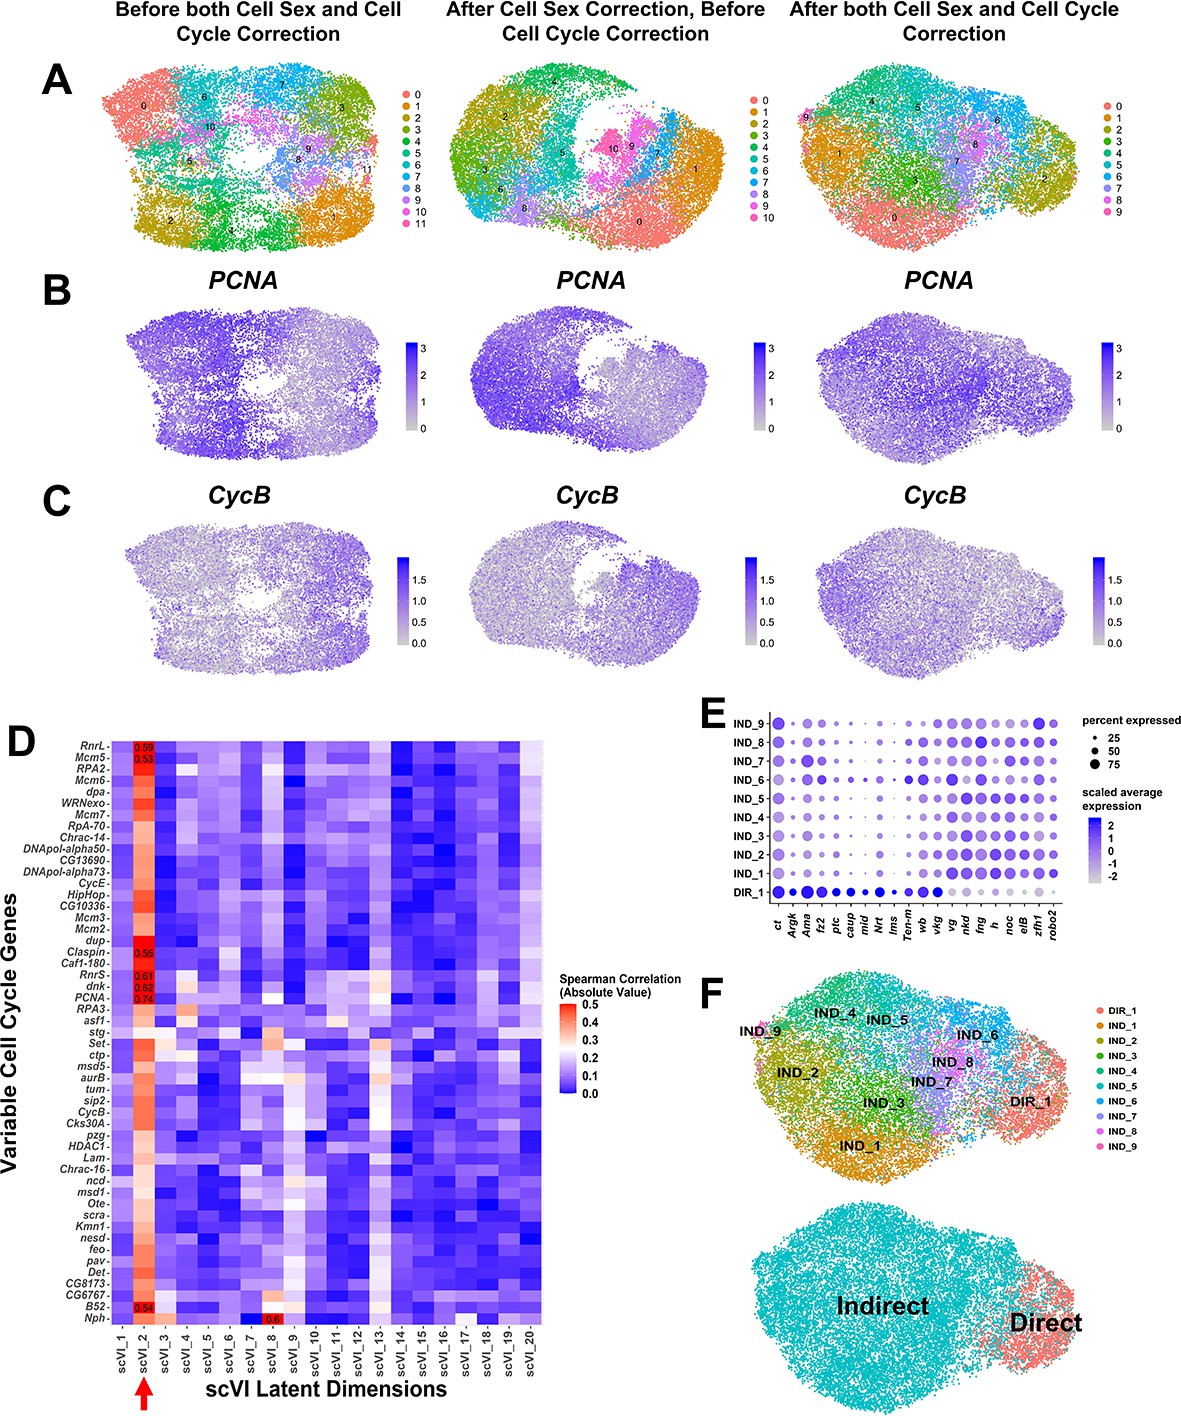
Correction of cell cycle stratification within adult muscle precursor (AMP) scRNAseq data.
(A–C) UMAPs of AMP single-cell data without any data correction (first column), after cell sex correction only (second column) (see Materials and methods and Figure 1—figure supplement 4 for details), and after both cell sex and cell cycle correction (third column). Cell cycle correction was performed by removing latent dimension scVI_2, which showed high-correlation magnitude with variable cell cycle genes, from downstream analysis (e.g., data clustering and visualization) (see D and Materials and methods for details). Cell colors correspond to unbiased clustering identities (A), or expression levels of cell cycle genes Proliferating cell nuclear antigen (PCNA) (B) or Cyclin B (CycB) (C). Note that after we correct for cell cycle stratification we observe better mixing of cell cycle markers PCNA and CycB throughout the data. (D) Magnitude of Spearman correlation between the scVI latent dimensions and the expression of variable cell cycle genes within the data. Color scale for correlation magnitude is capped at 0.5 for better visualization; correlation magnitudes that exceed 0.5 are written in the corresponding box. Note that scVI_2 (indicated on the x-axis by the red arrow) displays noticeably high-correlation magnitude with many variable cell cycle genes, highlighting that it is capturing most cell cycle variation within the data. (E, F) Classification of unsupervised clusters into direct and indirect identities. (E) Dot plot that summarizes the expression of canonical marker genes ct and vg in all clusters, in addition to other genes that displayed differential expression between cluster DIR_1 and all other clusters (false discovery rate [FDR] < 0.05, see Materials and methods). Note the higher expression of ct and lower expression of vg in DIR_1 compared to other clusters. After data correction, we identify one cluster as representing direct AMPs (DIR_1), whereas all other clusters are classified as indirect AMPs (IND_1–9). When performing differential expression analysis on DIR_1 vs. all other clusters, there was a natural-log fold-change of 0.28 and −0.49 for ct and vg, respectively (FDR < 0.05 for both genes; positive natural-log fold-changes indicate higher expression in DIR_1, negative values indicate higher expression in all other clusters). (F) UMAPs of AMP single-cell data with cells colored by unsupervised clustering (as in Figure 1N) and by our classification into putative precursors of direct or indirect adult flight muscles. UMAP color scales correspond to normalized (by total UMI) counts on a natural-log scale.
Figure 1—figure supplement 6
Temporal changes within the direct and indirect adult muscle precursors (AMPs).
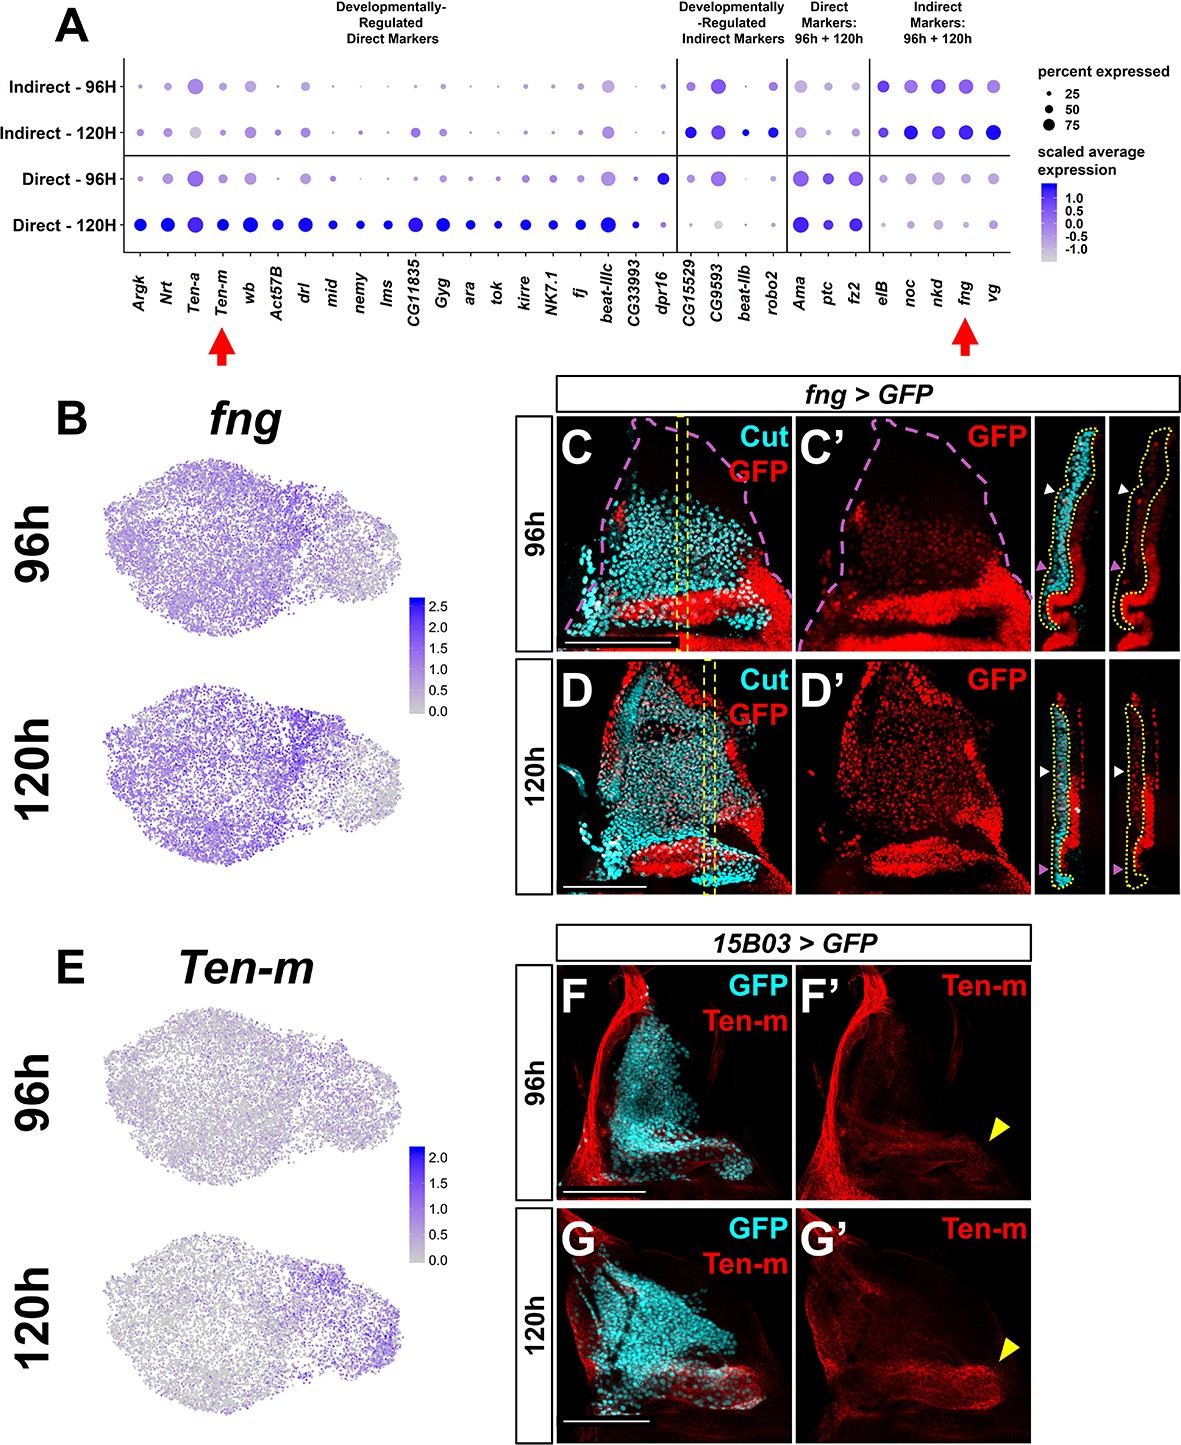
(A) Dot plot summarizing expression over time of genes that are differentially expressed within direct- or indirect-flight muscle precursors. Genes are grouped in the following manner: (1) genes that are differentially expressed at higher levels within direct AMPs only at one time point (‘developmentally regulated direct markers’), (2) genes that are differentially expressed at higher levels within indirect AMPs only at one time point (‘developmentally regulated indirect markers’), (3) genes that are differentially expressed at higher levels within direct AMPs at both time points (‘direct markers: 96 hr + 120 hr’), and (4) genes that are differentially expressed at higher levels within indirect AMPs at both time points (‘indirect markers: 96 hr + 120 hr’). Arrows highlight fng and Ten-m, which are investigated in the following panels. (B, E) UMAPs of fng (B) and Ten-m (E) expression at 96 and 120 hr within AMPs. (C–D') Wing discs with GFP expression driven by fng-Gal4 transgene at 96 hr (C, C') and 120 hr (D, D'). AMPs are visualized with anti-Cut. Magenta dashed lines in (C) and (C’) provide an outline of the wing disc. Orthogonal sections correspond to orthogonal max projections within the yellow dashed boxes in (C) and (D). Yellow dotted lines within the orthogonal sections (apical is left, basal is right) outline the AMPs. White and magenta arrowheads indicate regions of high and low GFP fluorescence, respectively. Note the higher levels of GFP in more dorsal AMPs (white arrowheads) compared to more ventral AMPs (magenta arrowheads) at both time points. (F–G') Wing discs stained for anti-Ten-m at 96 hr (F, F’) and 120 hr (G, G’). AMPs are visualized by expression of GFP via 15B03-Gal4 driver (see Figure 3I). Yellow arrowheads indicate regions of higher anti-Ten-m staining in direct AMPs. Note the increased levels of staining at 120 hr as compared to 96 hr. UMAP color scales correspond to normalized (by total UMI) counts on a natural-log scale. Frontal images shown in (C–D') are single image slices containing AMPs, whereas images shown in (F-G') are max projections across image slices containing AMPs. Microscopy scale bars = 100 μm.
Figure 2 with 1 supplement
Spatial mapping of single-cell data to a virtual wing disc and analysis of receptor–ligand expression.
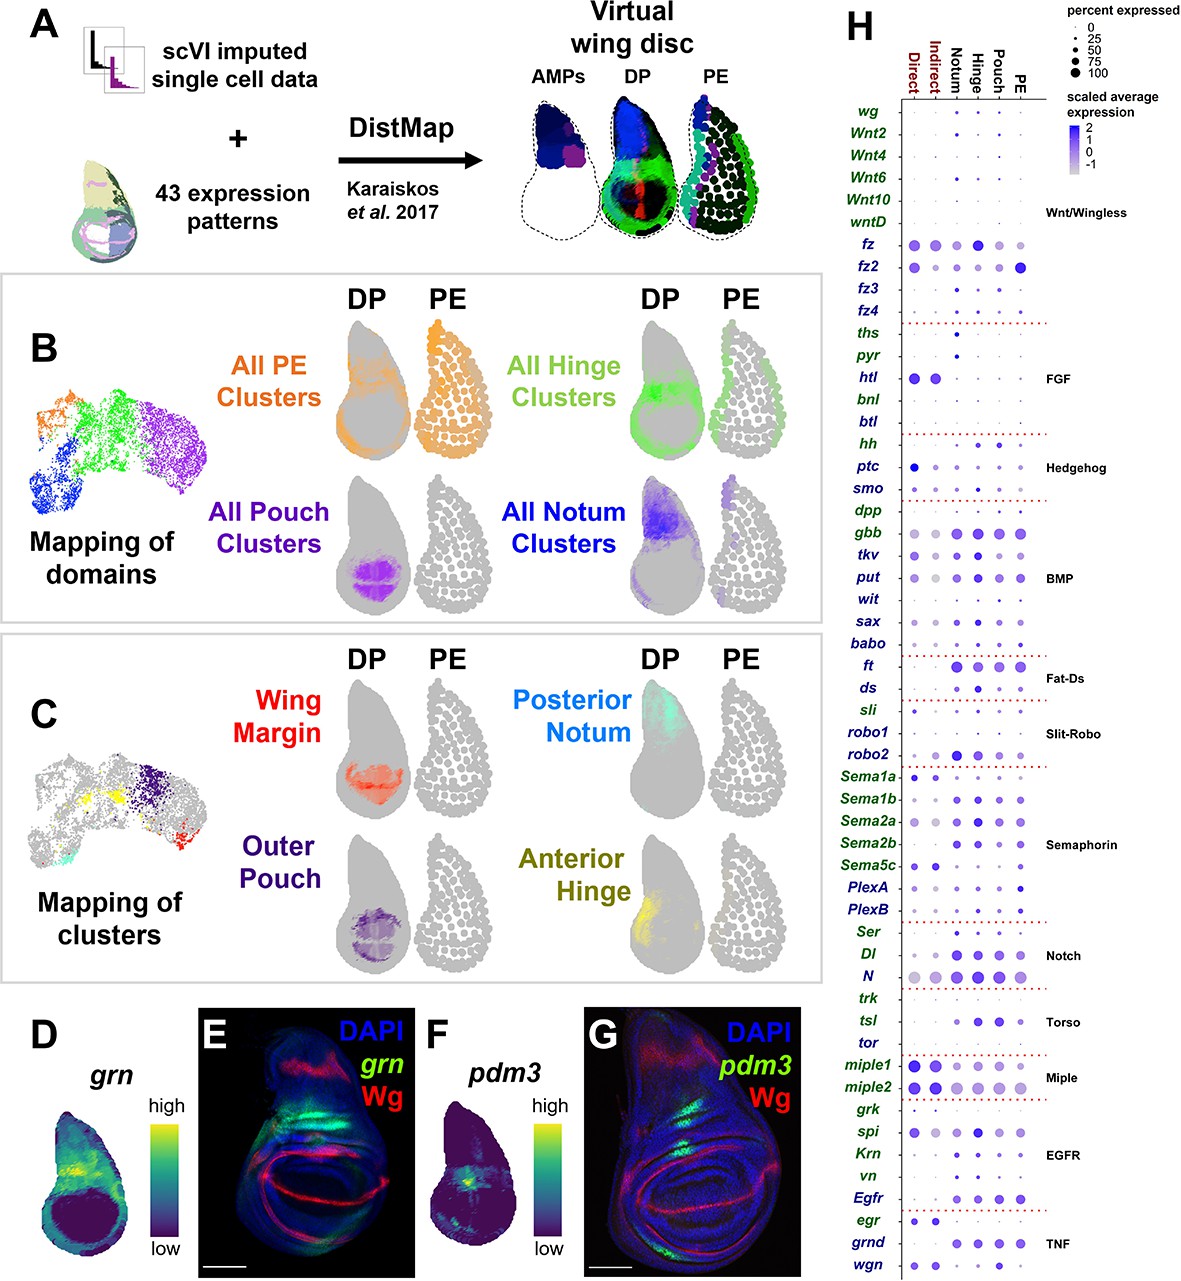
(A) Schematic describing the creation of a three-layered virtual wing disc (adult muscle precursors [AMPs], disc proper [DP], and the peripodial epithelium [PE]) using DistMap (Karaiskos et al., 2017) (see Materials and methods). In contrast to the columnar cells of the DP, much of the PE is composed of squamous cells with flattened nuclei, and it is therefore represented as an outline that contains large dots. The virtual wing disc can be used to predict gene expression patterns (or virtual in situs), as shown for three example genes (ptc in red, zfh2 in green, and eyg in blue). (B, C) Cells from the epithelial domains (B) and particular sub-regions (C) are shown both on the UMAP and mapped onto the DP and PE virtual wing disc. Stronger colors indicate higher predicted mapping; gray indicates low predicted mapping for cells (see Figure 2—figure supplement 1A, B for mappings of all cell clusters). (D, F) Predicted gene expression patterns of grn (D) and pdm3 (F) in the epithelium disc proper, neither of which were used in building the virtual model. Yellow and dark purple correspond to high and low predicted expression, respectively. (E, G) Late third instar wing-imaginal disc with transcriptional reporters for the genes grn (E) and pdm3 (G). Note the relative similarity between the predicted expression and transcriptional reporters. (H) Dot plot summarizing the expression of genes encoding receptors and ligands from pathways that were differentially expressed in at least one cell type. Dot size indicates the percent of cells that express the gene, and the dot color indicates the relative gene expression level within each of the cell groups. X-axis: cell groups. Disc epithelium cell types are in black font, and AMP cell types are in red font. Y-axis: genes are either in blue or green font depending on their annotation as encoding for a receptor or ligand, respectively. Microscopy scale bars = 100 μm.
Figure 2—figure supplement 1
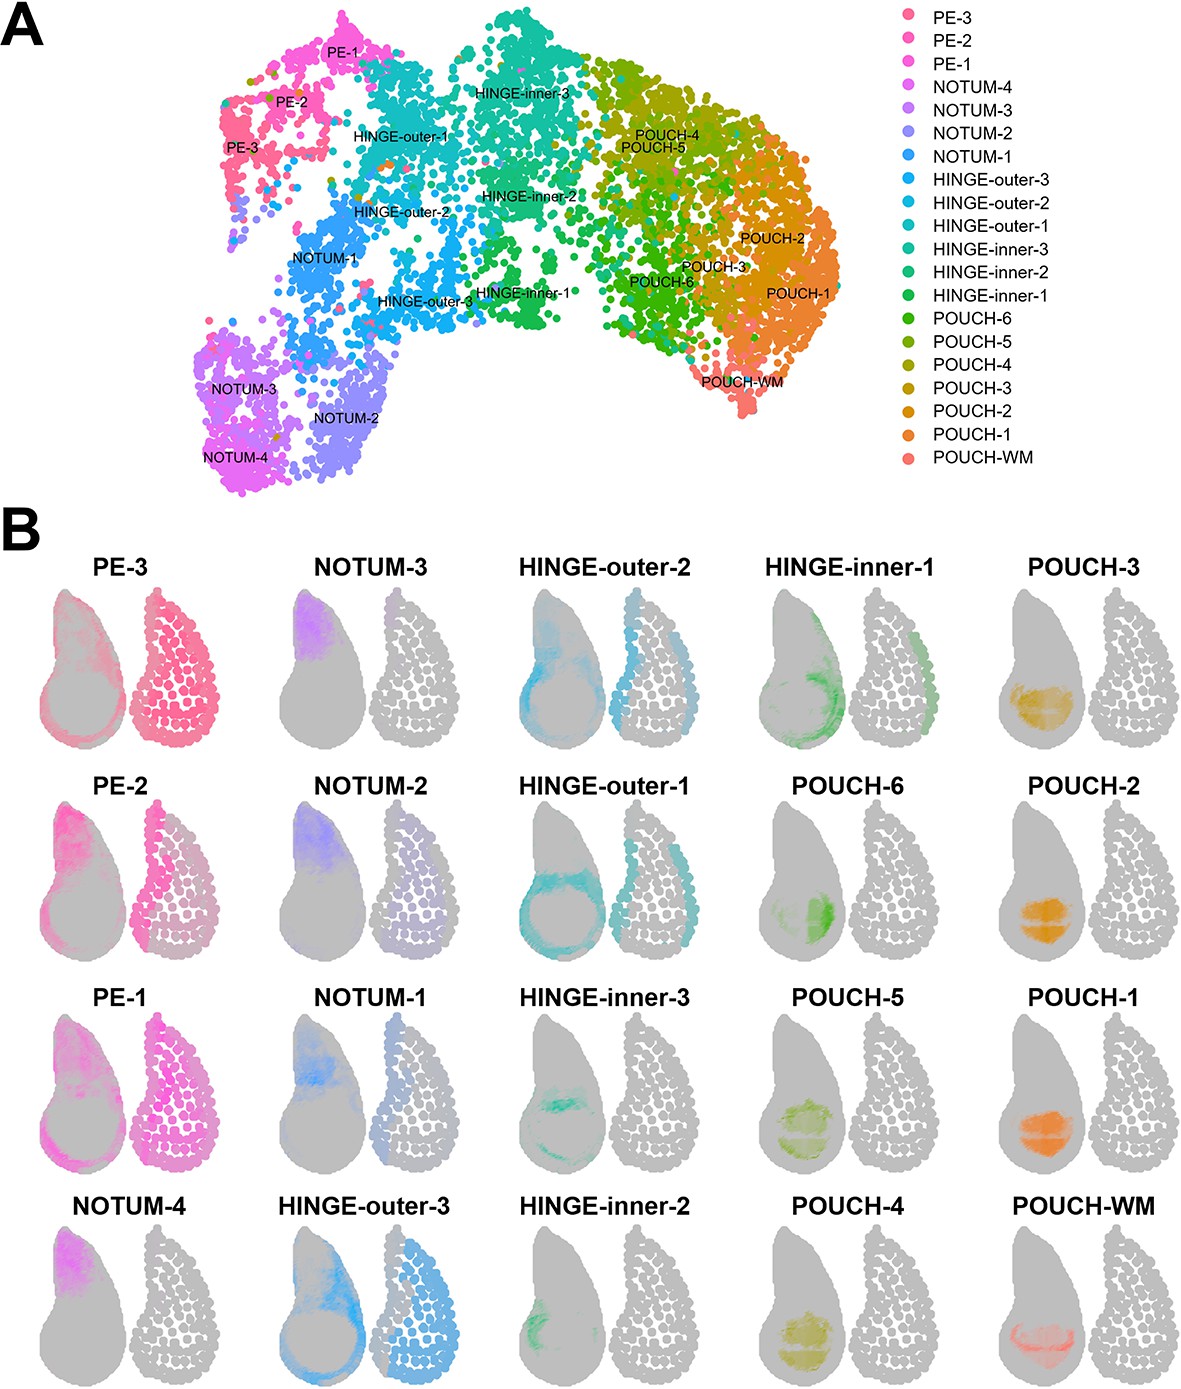
Mapping of epithelium cell clusters to the virtual wing disc.
(A) UMAP of epithelium cell clusters (same as the UMAP in Figure 1H). (B) Visualization of where epithelium cell clusters best map to the reference model for the disc proper layer (on left) and the peripodial epithelium layer (on right). Gray regions indicate low predicted mapping, whereas regions with darker color shades indicate higher predicted mapping. The mapping colors in (B) match the cluster colors in (A).
Figure 3
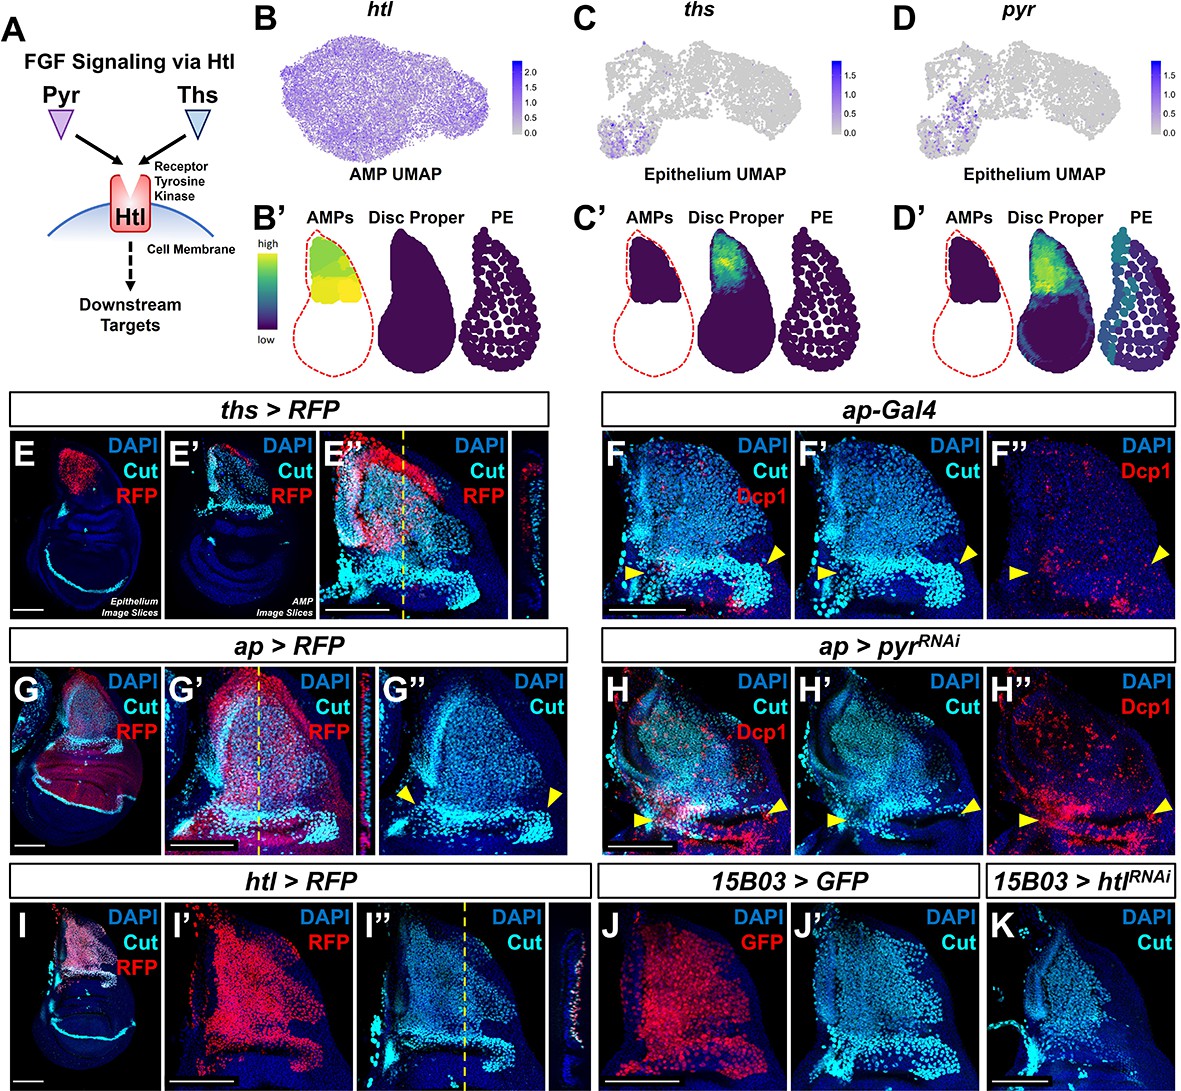
Fibroblast growth factor (FGF) signaling between adult muscle precursors (AMPs) and epithelium is critical for AMP viability and numbers.
(A) FGF signaling pathway diagram. FGF ligands (Pyr and Ths) signal through the FGFR (Htl). (B–D') Expression of htl (B, B'), ths (C, C'), and pyr (D, D') in the single-cell data. (B), (C), and (D) show UMAPs of these genes, in either the AMPs (for htl) or disc epithelium (for ths and pyr). (B’), (C’), and (D’) show virtual disc map predictions for the expression of these genes in the AMPs, disc proper, and peripodial epithelium. (E–E'') ths expression domain (as shown by ths-Gal4 driving the expression of RFP) in the wing disc. (E), (E’), and (E’’) are max projections over image slices of the disc epithelium, images slices of the AMPs, and all image slices (both epithelium and AMPs), respectively. AMPs are visualized with anti-Cut (cyan). Orthogonal section (apical is left, basal is right) corresponds to the dashed yellow line in (E’’). Note that ths reporter expression is specific to the notum epithelium and absent from the AMPs. (F–H'') Notum regions of wing discs with ap-Gal4 transgene alone (F–F'') or ap-Gal4 transgene driving expression of either >RFP (G–G'') or >pyrRNAi (H–H''). AMPs are visualized by anti-Cut staining (cyan), shown in (F, F', G–H'); cell death is visualized by anti-Dcp1 staining (red), shown in (F, F'', H, H''). RFP (red fluorescent protein) expression shown in (G, G'') indicates that the domain of ap-Gal4 covers the entire epithelium adjacent to the AMPs. Dashed yellow line in (G’) corresponds to the adjacent orthogonal section. Yellow arrowheads indicate expected location of direct AMPs. Note the loss of ventral- and posterior-localized AMPs following pyr knockdown, with increased anti-Dcp1 staining (H–H''). (I–I'') htl expression domain (as shown htl-Gal4 driving the expression of RFP) in the wing disc. (I') and (I'') show DAPI and either RFP or anti-Cut staining, respectively. Orthogonal section corresponds to the dashed yellow line in (I’’) (contrast with the orthogonal section in E''). Note that the htl reporter is expressed by the AMPs, which are visualized by anti-Cut staining (cyan). (J–K) The notum regions from wing discs with AMP-specific 15B03-Gal4 driving the expression of >GFP (J, J') and >htlRNAi (K). AMPs visualized with anti-Cut. Note the reduction of AMPs, especially of the direct AMPs. UMAP color scales correspond to normalized counts on a natural-log scale. All notum images are max projections across image slices. Microscopy scale bars = 100 μm.
Figure 4 with 1 supplement
Fibroblast growth factor (FGF) from disc epithelium controls adult muscle precursor (AMP) localization.
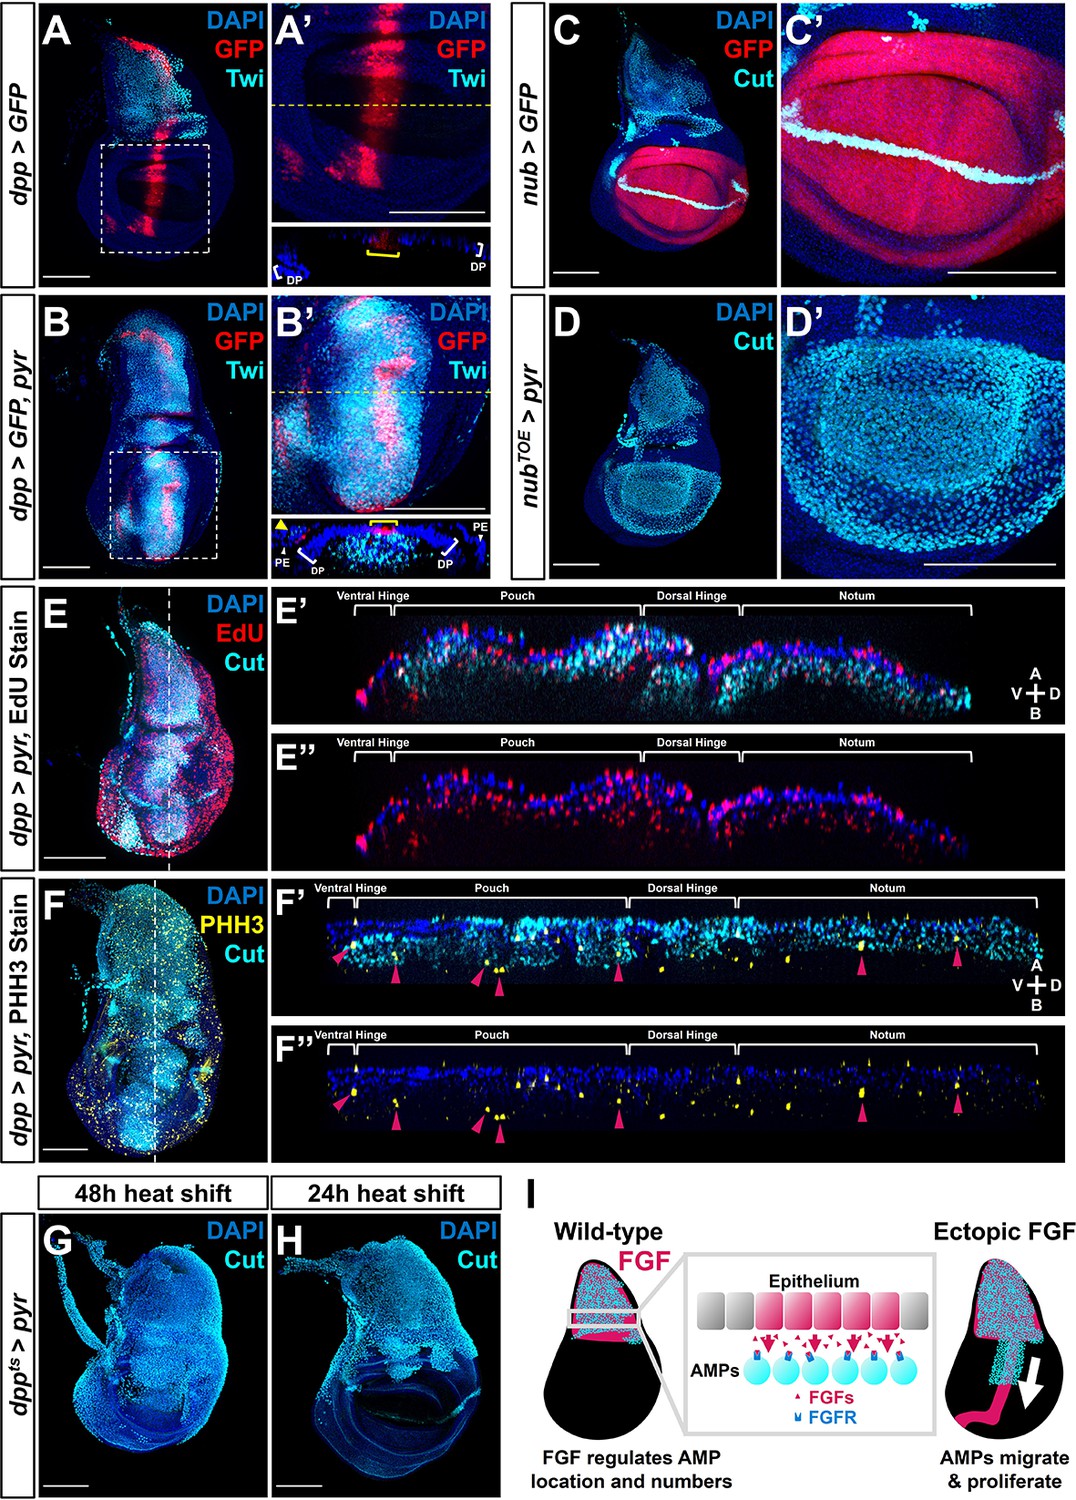
(A-B') Wing discs with dpp-Gal4 driving the expression of >GFP alone (A, A') or >GFP together with >pyr (B, B'), stained with anti-Twi (cyan) to visualize the AMPs. (A’) and (B’) correspond to white dashed boxes in (A) and (B), respectively. Orthogonal sections (apical is top, basal is bottom, relative to disc proper) correspond to dashed yellow lines in (A’) and (B’). Yellow brackets in orthogonal sections indicate dpp-Gal4 expression in disc proper. Yellow arrowhead in the orthogonal of (B') indicates dpp-Gal4 expression in the peripodial epithelium (PE), which recruits AMP expansion to the PE surface when expressing >pyr. (C–D') Wing discs with nub-Gal4 driving the expression of >GFP (C, C') or >dCas9VPR (D, D'), the latter being used in conjunction with a guide RNA targeting an upstream sequence of the pyr transcriptional start site (pyrTOE.GS00085) to drive the overexpression of pyr in the wing pouch. Discs are stained with anti-Cut to visualize AMPs. Note that Cut is also expressed in the future wing margin of the disc epithelium (seen as a band through the wing pouch in C and C’). (E–F'') Discs overexpressing pyr via dpp > pyr, stained for Cut (cyan) and either EdU incorporation (red) (E–E'') or phosphohistone H3 (PHH3) (yellow) (F–F'') to assess the ability of AMPs to replicate DNA and undergo mitosis. Magenta arrowheads in (F’) and (F’’) highlight some AMPs that stain for PHH3. White brackets denote approximate domains of the disc proper. Note that ectopic AMPs stain for both EdU incorporation and PHH3, indicating that these cells are viable and proliferating outside of the endogenous AMP niche. A: apical; B: basal; V: ventral; D: dorsal, relative to disc proper. (G, H) Temperature-controlled expression of >pyr within the dpp domain, initiated at either mid L3 (G) or late L3 (H) (48 or 24 hr prior to pupariation, respectively). Note that even at these developmental stages we observed ectopic AMPs that appear to be emigrating ventrally from the notum. (I) Model for the effects of FGF overexpression on AMP growth. FGF/FGFR interactions between the disc epithelium and adjacent AMPs are necessary for AMP viability, and ectopic expression of FGF ligands induces emigration of AMPs from the notum to a domain that broadly matches the pattern of FGF ligand expression. All wing disc images are max projections across all image slices. Microscopy scale bars = 100 μm.
Figure 4—figure supplement 1
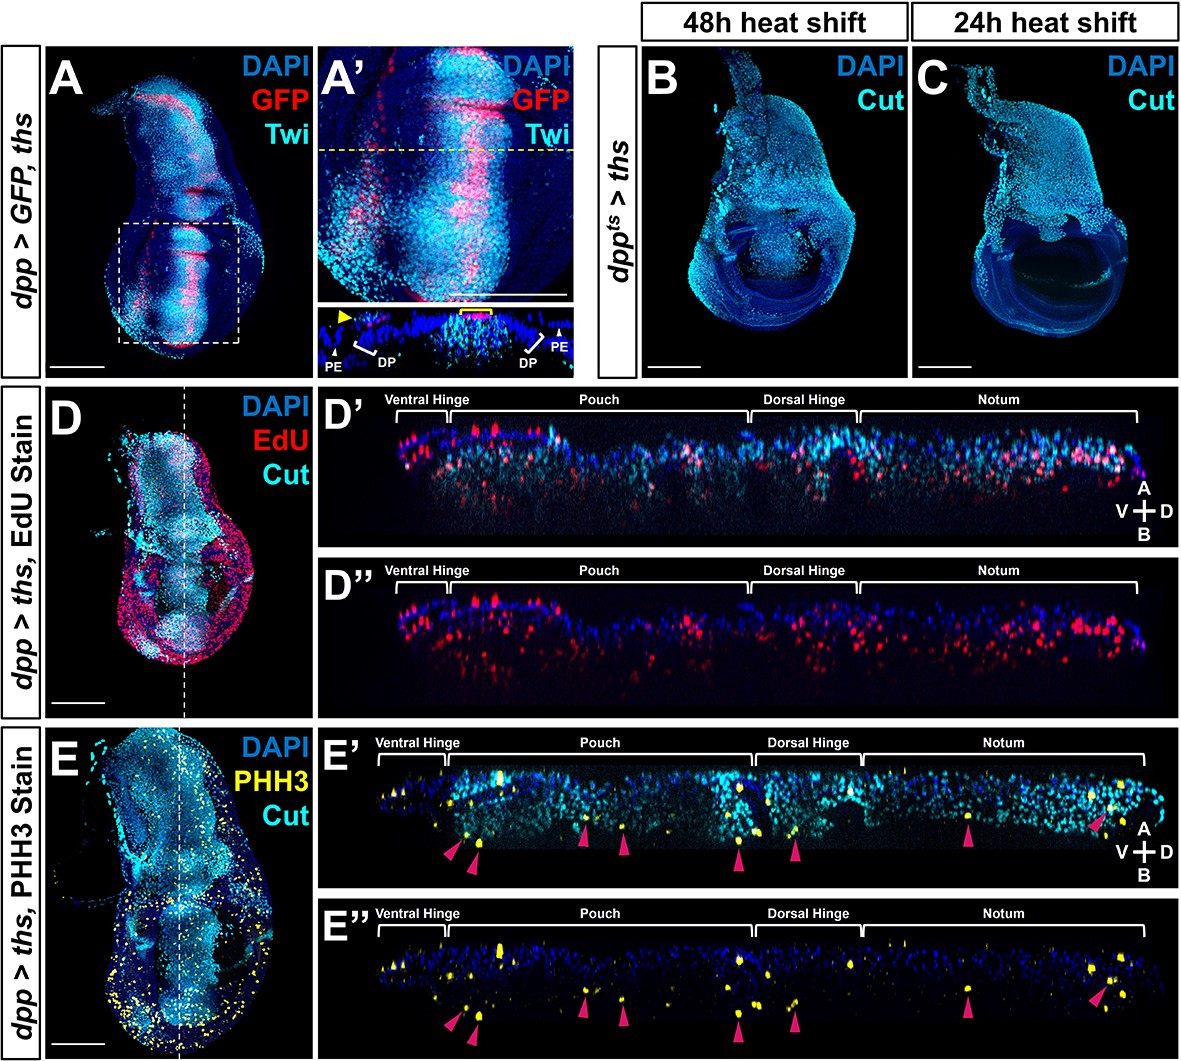
Ectopic Ths expression increases adult muscle precursor (AMP) number and migration.
(A, A') Wing discs with dpp-Gal4 driving the expression of both >GFP and >ths, stained with anti-Twi to visualize the AMPs. (A’) corresponds to the white dashed boxes in (A). Orthogonal section (apical is top, basal is bottom, relative to disc proper) corresponds to dashed yellow lines in (A’). Yellow arrowhead in the orthogonal of (A’ ) indicates dpp-Gal4 expression in the peripodial epithelium (PE), which recruits AMP expansion to the PE surface when expressing >ths. (B, C) Temperature-controlled expression of >ths within the dpp domain, initiated at either mid L3 (B) or late L3 (C) (48 or 24 hr prior to pupariation, respectively). Note that even at these developmental stages we observed ectopic AMPs that appear to be emigrating ventrally from the notum, similar to our results obtained with >pyr expression (see Figure 4G, H). (D–E'') Discs overexpressing ths via dpp > ths, stained for Cut (cyan) and either EdU incorporation (red) (D–D'') or phosphohistone H3 (PHH3) (yellow) (E–E'') to assess the ability of AMPs to replicate DNA and undergo mitosis. Magenta arrowheads in (E’) and (E’’) highlight some AMPs that stain for PHH3. White brackets denote approximate domains of the disc proper. Note that ectopic AMPs stain for both EdU incorporation and PHH3, indicating that these cells are viable and proliferating outside of the endogenous AMP niche. A: apical; B: basal; V: ventral; D: dorsal, relative to disc proper.
Figure 5 with 2 supplements
Hh signal from the disc epithelium patterns a subset of adult muscle precursors (AMPs).
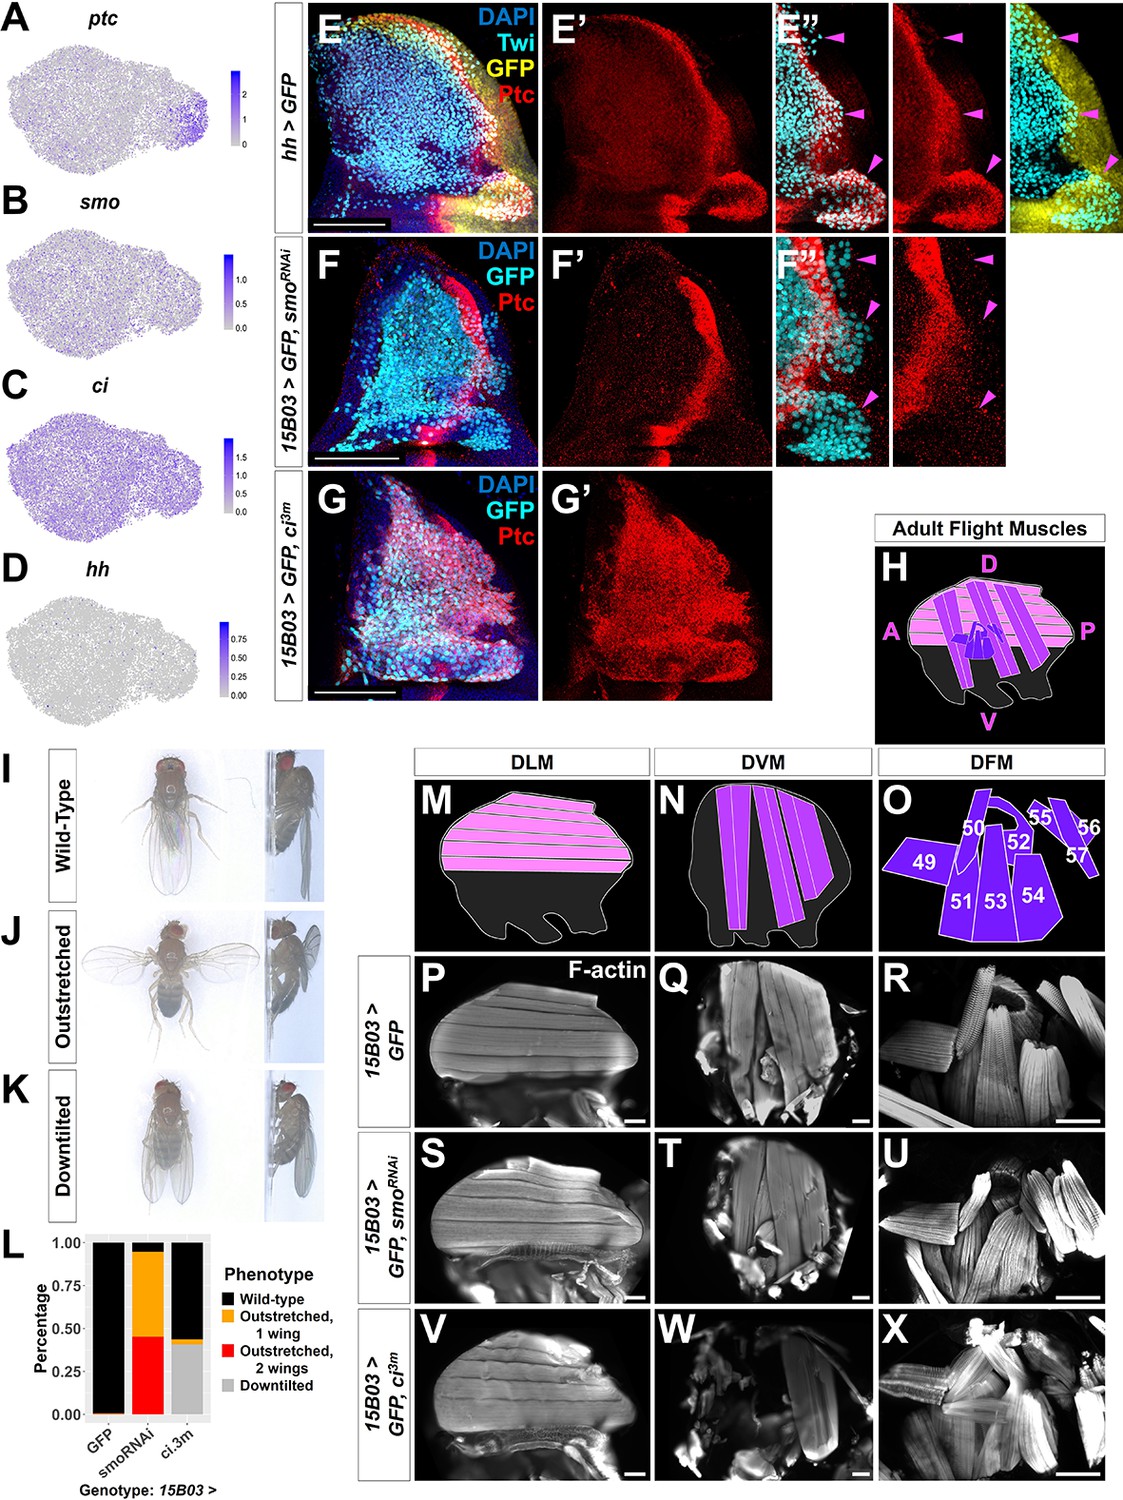
(A–D) UMAPs of ptc (A), smo (B), ci (C), and hh (D) expression in AMPs. (E–E'') Notum of wing discs stained for anti-Ptc (red) with the hh-expressing epithelium cells marked by hh-Gal4 driving >GFP (yellow). AMPs visualized by anti-Twi stain (cyan). Note Ptc expression in the posterior-localized AMPs, to the right of the epithelium Ptc stripe and in close proximity to the hh-expressing epithelium (magenta arrowheads) (E’’) (see Figure 5—figure supplement 1). (F–G') Notum of wing discs stained for anti-Ptc (red) with 15B03-Gal4 driving >GFP together with either >smoRNAi (BL43134) to reduce Hh signaling within the AMPs (F–F'') or >ci3m to mimic activated Hh signaling within the AMPs (G, G'). Ptc expression is significantly reduced in the posterior-localized AMPs after smo knockdown (magenta arrowheads) without disrupting the stripe of Ptc expression in the epithelium (F’’). Note that Ptc is expressed in all of the AMPs following >ci3m expression (G’). (H) Schematic of adult flight muscle fibers within the thorax where the muscle subtypes are differentially shaded: dorsal longitudinal muscles (DLMs) in pink, dorsoventral muscles (DVMs) in purple, and direct flight muscles (DFMs) in dark purple. (I–K) Wing posture phenotypes observed following Hh-signaling perturbations. Adults were imaged live, not anesthetized. (I) Wild-type posture, with wing blades folded along their dorsum. (J) Outstretched wing posture, where either one or both wings were always held perpendicular to the body axis. (K) Downtilted wing posture, with adults that hold their wings farther apart along their dorsum and tilted laterally downward. (L) Quantification of wing posture after Hh-signaling perturbation within AMPs (driven by 15B03-Gal4). The number of adults assayed: >GFP=341, >smoRNAi (BL43134) = 283, and >ci3m = 366. These smoRNAi results were replicable with multiple RNAi lines (Figure 5—figure supplement 2A). (M–O) Separate schematics of expected DLMs (M), DVMs (N), and DFMs (O) morphology. Numbers on DFMs represent the canonical labels for the different fibers. (P–X) Adult flight muscles (visualized with F-actin staining) from animals with 15B03-Gal4 driving >GFP alone (P–R), or >GFP together with either >smoRNAi (S–U) or >ci3m (V–X). DLMs are shown in (P), (S), and (V); DVMs are shown in (Q), (T), and (W); DFMs are shown in (R), (U), and (X). Adult flight muscles in >GFP flies had similar morphology in all adults examined (23 DLMs, 15 DVMs, and 12 DFMs). Adult flight muscles in >smoRNAi (BL43134) animals displayed abnormal DFMs (11/11 had muscles 53 and 54 misaligned, and 7/11 had muscles 55, 56, and 57 malformed) (U), while DLMs (n = 21/22) and DVMs (n = 10/10) had relatively normal morphology (S, T). Adult flight muscles in >ci3m animals had normal DLMs morphology (n = 7) (V), whereas the DVMs were either missing or severely disconnected (n = 7) (W) and the DFMs appeared abnormal (n = 4) (X). UMAP color scales correspond to normalized counts on a natural-log scale. All notum images are max projections across image slices containing AMPs. Microscopy scale bars = 100 μm.
Figure 5—figure supplement 1
Ptc-expressing adult muscle precursors (AMPs) are neighboring the Hh-producing posterior compartment of the disc proper.
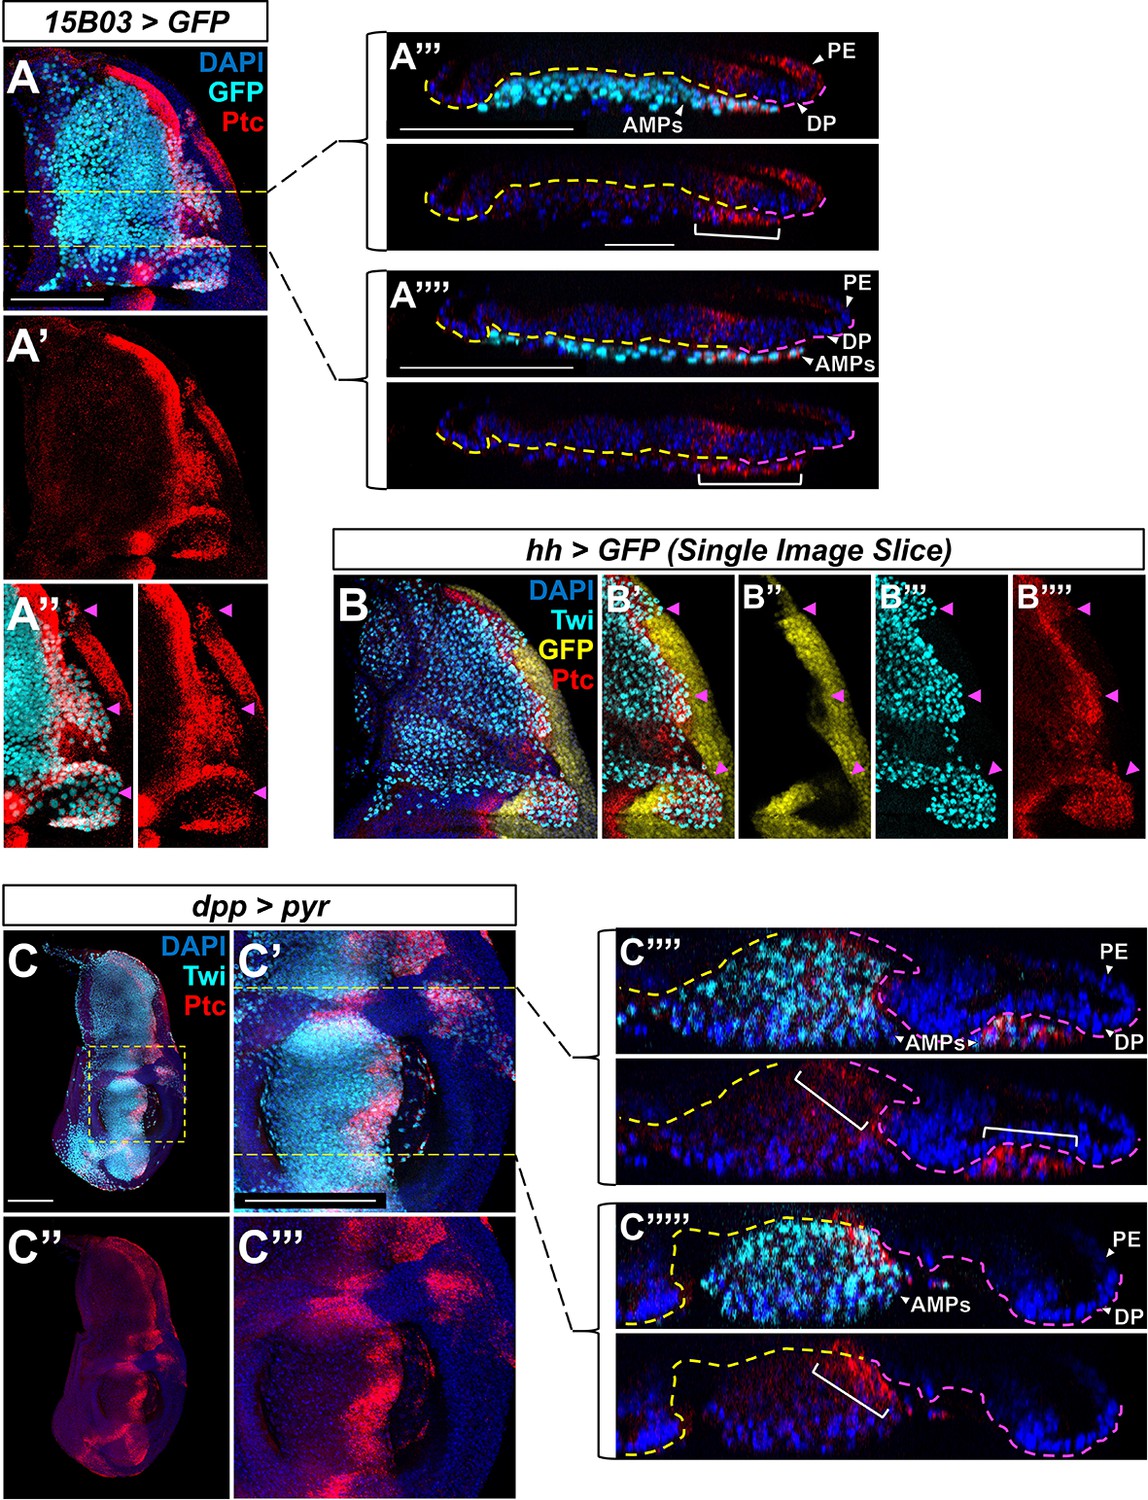
(A–A'''') Notum of wing discs stained for anti-Ptc (red) with 15B03-Gal4 driving >GFP. Magenta arrowheads in (A’’) indicate posterior-localized AMPs that display high Ptc expression. Orthogonal sections (A’’’) and (A’’’’) correspond to yellow dashed lines in (A). In these orthogonal sections, the interface between the AMPs and disc proper (DP) is outlined by a yellow and magenta dashed line (yellow = interface with anterior DP compartment, magenta = interface with posterior DP compartment). Note that in both (A’’’) and (A’’’’) we observe high Ptc expression in AMPs underneath the posterior compartment, extending a short distance underneath the anterior compartment (indicated by a white bracket). We estimate a distance of approximately 20–40 μm between the Hh-producing posterior compartment of the disc epithelium and the anterior-most AMP with high Ptc expression. (B–B'''') Notum of wing discs stained for anti-Ptc (red) and anti-Twi (cyan), with the hh-expressing epithelium cells marked by hh-Gal4, >GFP (yellow). A single image slice (rather than a max projection of all image slices, as in Figure 5E) is used to illustrate that the posterior-localized AMPs (indicated by magenta arrowheads) do not produce Hh ligand themselves, but are surrounded by Hh-producing epithelial cells. (C–C''''') Wing discs with dpp-Gal4 driving the expression of >pyr, stained with both anti-Ptc (red) and anti-Twi (cyan). (C’) and (C’’’) correspond to the dashed yellow box in (C), and orthogonal sections (C’’’’) and (C’’’’’) correspond to yellow dashed lines in (C’). In (C’’’’) and (C’’’’’), the interface between the AMPs and DP is outlined by a yellow and magenta dashed line (yellow = interface with anterior DP compartment, magenta = interface with posterior DP compartment). Note that even in these ectopic AMPs we only observe high levels of Ptc in AMPs in close proximity to the Hh-secreting posterior compartment of the DP (such AMPs are indicated by white brackets).
Figure 5—figure supplement 2
Adult wing-posture phenotypes and morphology of individual muscle fibers after Hh-signaling perturbation.
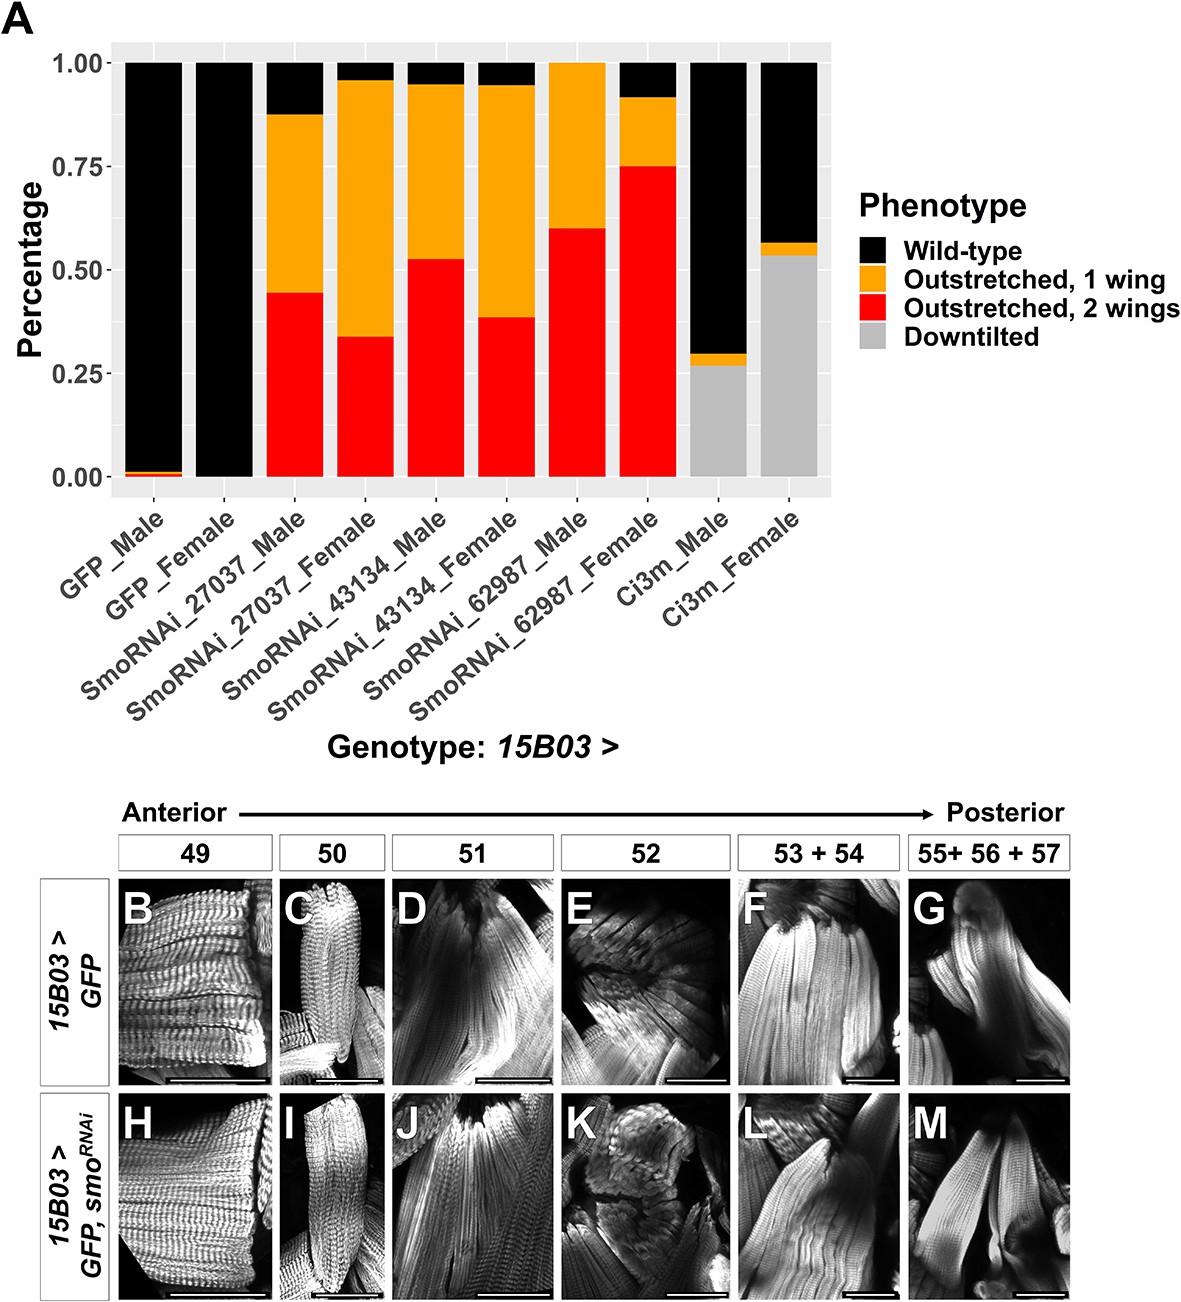
(A) Quantification of observed wing posture phenotypes under conditions of Hh-signaling perturbation within AMPs (for description of wing posture phenotypes, see Figure 5). All UAS lines are driven by 15B03-Gal4. Data are presented for three different UAS-smoRNAi lines and separated by sex. Wing posture phenotypes were fairly consistent between males and females. Number of flies examined: GFP: 164 (male) and 179 (female), smoRNAi BL27037: 72 (male) and 71 (female), smoRNAi BL43134: 135 (male) and 148 (female), smoRNAi BL62987: 20 (male) and 12 (female), and ci3m: 175 (male) and 191 (female) (B–M) Direct flight muscles in adults where 15B03-Gal4 drives >GFP alone (B–G) or >GFP together with >smoRNAi (H–M). Muscle fibers are shown in the order of relative anterior–posterior positioning within the thorax, with numbering nomenclature as described in Figure 5O. Note that in >smoRNAi flies the posterior edge of muscle 52 appears to be truncated (compare K with E); muscles 53 and 54 are indistinguishable and both project to the dorsal attachment site of muscle 54 (compare L with F); and muscles 55, 56, and 57 are disorganized (compare M with G). Microscopy scale bars = 50 μm.
Figure 6 with 1 supplement
Nrt and Mid are novel downstream Hh-pathway targets in the adult muscle precursors (AMPs).
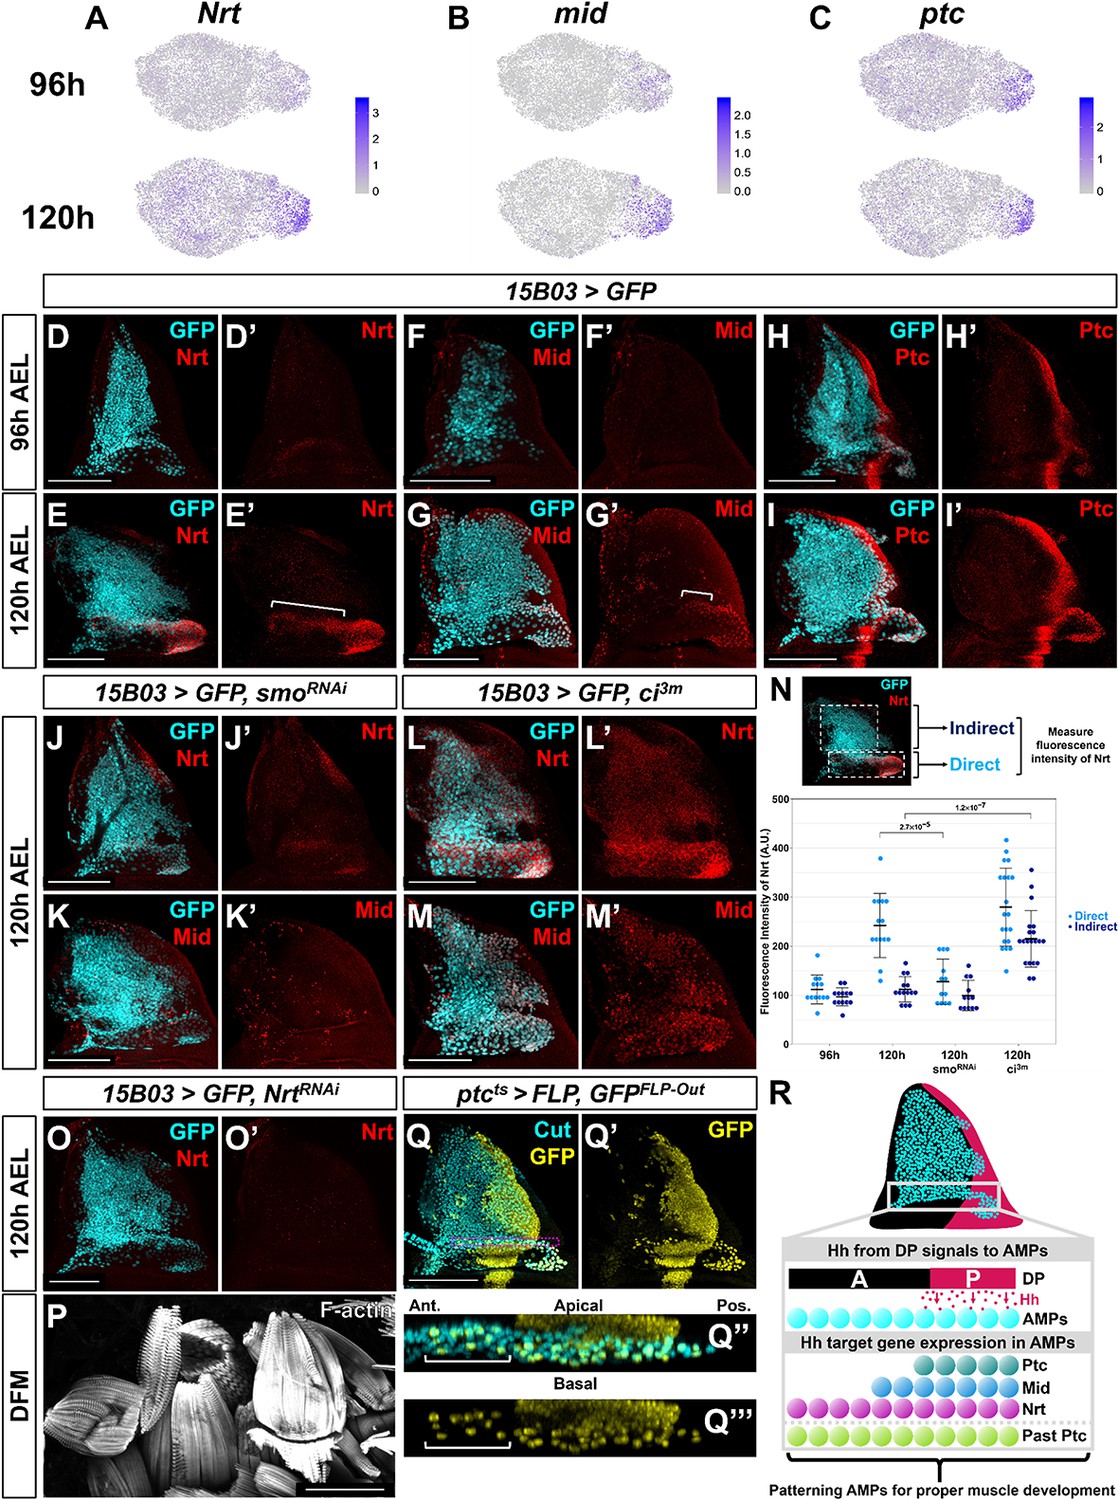
(A–C) UMAPs of Nrt (A), mid (B), and ptc (C) expression at 96 and 120 hr in AMPs. Note the increase in expression for Nrt and mid from 96 to 120 hr, whereas ptc expression is relatively unchanged. (D–I') Wing discs stained with anti-Nrt at 96 hr (D, D') and 120 hr (E, E'), anti-Mid at 96 hr (F, F') and 120 hr (G, G'), and anti-Ptc at 96 hr (H, H') and at 120 hr (I, I'). AMPs are visualized by expression of GFP (cyan) via 15B03-Gal4 driver. Note the negligible staining of anti-Nrt and anti-Mid in AMPs at 96 hr, matching the scRNAseq expression data. (J–M') Wing discs expressing either >smoRNAi to reduce Hh signaling within the AMPs (J–K') or >ci3m to activate Hh signaling within the AMPs (L–M') via 15B03-Gal4 driver, along with >GFP to visualize AMPs (cyan). Discs are either stained with anti-Nrt (J, J', L, L') or anti-Mid (K, K', M, M'). Note that the knockdown of smo prevents the expression of Nrt and Mid in the direct AMPs and that the overexpression of ci3m leads to ectopic expression in the indirect AMPs. (N) Quantification of anti-Nrt staining within direct and indirect AMPs. The graph shows binned values of average fluorescent intensity. p-Values were calculated from unpaired t-tests, and error bars indicate standard deviation. Note that smo knockdown prevents Nrt expression within the direct AMPs at 120 hr, and the expression of activated ci increases Nrt expression in both the direct and indirect AMPs. (O, O') Wing disc expressing >NrtRNAi in AMPs via 15B03-Gal4 driver, stained with anti-Nrt at 120 hr. Note that the knockdown of Nrt eliminates Nrt staining in the AMPs (O’). (P) Direct flight muscles (DFMs) in adults where 15B03-Gal4 drives >NrtRNAi. Note the enlarged posterior DFMs, specifically muscles 55, 56, and 57 (similar phenotypes were observed in all five flies examined) (compare to the control in Figure 5R). (Q–Q''') Lineage tracing of AMPs that have previously expressed ptc earlier in development; genotype: ptc-Gal4, tub-Gal80ts, >FLP, Ubi-FRT-stop-FRT-GFP (ptcts>FLP, GFPFLP-Out). Cells that expressed ptc-Gal4 when larva are shifted to higher temperature (non-permissive temperature for Gal80ts) and their progeny will be permanently labeled by GFP expression. The temperature shift from 18°C to 30°C was done at 5 days after egg lay for 24 hr, larvae were dissected at late third instar. AMPs were visualized with anti-Cut staining. Orthogonal max projection is shown in (Q’’) and (Q’’’), corresponding to the dashed purple box in (Q). Note that a subset of the anterior labeled AMPs (indicated by white bracket) expresses GFP. (R) Model explaining the protein expression of Hh-signaling targets in AMPs. Posterior-localized AMPs receive Hh from the disc proper, activating expression of Hh-signaling targets Ptc, Nrt, and Mid (the latter two being AMP-specific targets). These AMPs migrate anteriorly, either a result of active cell movement or due to displacement caused by proliferation. Anterior-localized AMPs quickly degrade Ptc protein, but Nrt and Mid perdure longer. Microscopy scale bars = 100 μm.
Figure 6—figure supplement 1
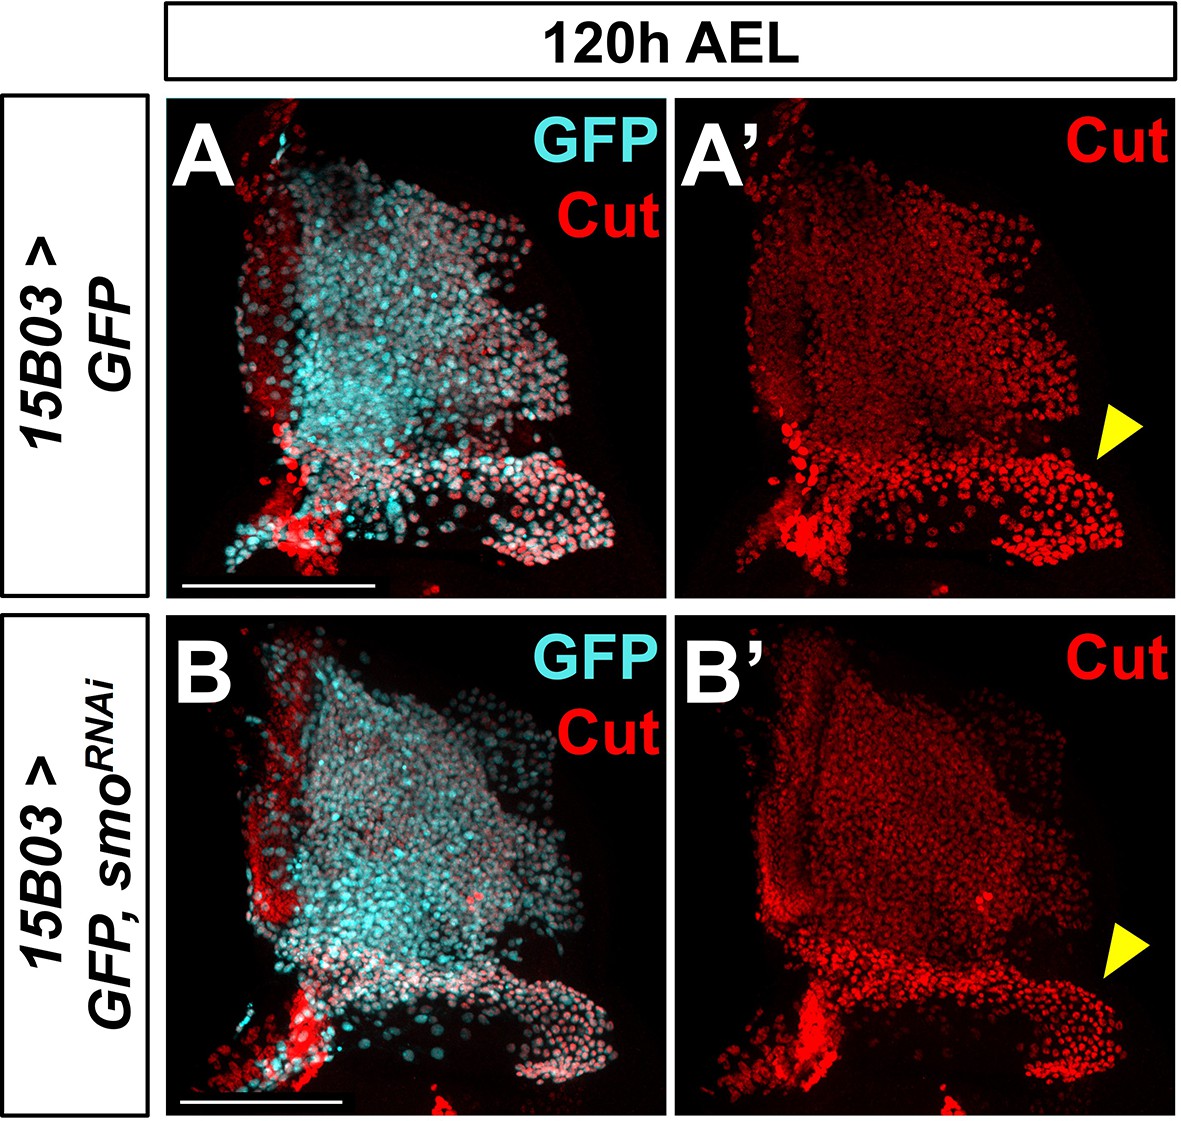
Knockdown of smo does not affect Ct protein levels in adult muscle precursors (AMPs).
(A–B') Notum of wing discs stained for anti-Cut (red) with 15B03-Gal4 driving >GFP alone (A, A') or >GFP with >smoRNAi (B, B'). Yellow arrowheads indicate higher levels of Ct staining in direct AMPs. Note that Ct staining in direct AMPs is unaffected by smoRNAi expression. Microscopy scale bars = 100 μm.
Author response image 1
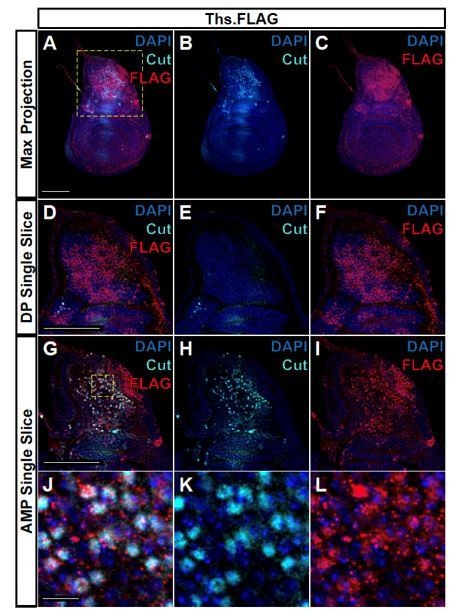
FLAG-tagged Ths ligand is observed in both the epithelium notum and underlying AMPs.
(A-C) Max projections over all images slices (epithelium + AMPs) from wing discs with FLAG tag inserted at the N-terminus of Ths (Bl. 77476). Single image slice of the disc proper (DP) notum (D-F) or underlying AMPs (G-I), corresponding to the region within the yellow dashed box in A. (J-L) Close up of AMPs within the dashed yellow box in G. In all images, FLAG is visualized with anti-FLAG antibody (red), and AMPs are visualized with anti-Cut antibody (cyan). Anti-Cut antibody imperfectly stains AMPs, due to the use of saponin to optimize the visualization of anti-FLAG staining. Note the puncta stained by anti-FLAG antibody within the AMPs. Microscopy scale bars = 100 μm in A-I, and 10 μm in J-L.
Additional files
-
Supplementary file 1
Genes with differential expression between 96and 120 hr within the epithelium and adult muscle precursors (AMPs).
Genes were selected based on being significantly and consistently upregulated or downregulated between the two time points in either the disc epithelium and/or the AMPs. The average gene expression within cells (natural-log scale), fraction of cells expressing a given gene, fold-change between time points (natural-log scale), and false discovery rate (FDR) for differential expression significance are reported. These gene expression, detection, and fold-change calculations are averaged across each of the pairwise comparisons performed, and the max FDR value is shown (see Materials and methods for details on differential expression between time points). Negative fold-change values indicate higher expression at 96 hr and are colored magenta. Positive fold-change values indicate higher expression at 120 hr and are colored green. N.R.: not replicable; calculations in which the fold-change direction differed between pairwise comparisons.
- https://cdn.elifesciences.org/articles/61276/elife-61276-supp1-v2.xlsx
-
Supplementary file 2
Genes with differential expression between 96 and 120 hr within the epithelial cell clusters.
Genes were selected based on being significantly and consistently upregulated or downregulated between the two time points in at least one epithelial cluster. The natural-log of the fold-change between 96 and 120 hr is reported, averaged across each of the pairwise comparisons performed (see Materials and methods for details on differential expression between time points). Negative values indicate higher expression at 96 hr and are colored magenta. Positive values indicate higher expression at 120 hr and are colored green. Values that were not significant (based on max false discovery rate) are reported with a ‘-'.
- https://cdn.elifesciences.org/articles/61276/elife-61276-supp2-v2.xlsx
-
Supplementary file 3
Genes with differential expression between 96 and 120 hr within the direct and indirect adult muscle precursors (AMPs).
Genes were selected based on being significantly and consistently upregulated or downregulated between the two time points in either the direct and/or the indirect AMPs. The average gene expression within cells (natural-log scale), fraction of cells expressing a given gene, fold-change between time points (natural-log scale), and false discovery rate (FDR) for differential expression significance are reported. These gene expression, detection, and fold-change calculations are averaged across each of the pairwise comparisons performed, and the max FDR value is shown (see Materials and methods for details on differential expression between time points). Negative fold-change values indicate higher expression at 96 hr and are colored magenta. Positive fold-change values indicate higher expression at 120 hr and are colored green. N.R.: not replicable; calculations in which the fold-change direction differed between pairwise comparisons.
- https://cdn.elifesciences.org/articles/61276/elife-61276-supp3-v2.xlsx
-
Supplementary file 4
Geometry of disc model.
CSV file of the X, Y, Z geometry used in reference gene expression patterns (Supplementary file 5). Formatted as used in DistMap to generate virtual wing disc.
- https://cdn.elifesciences.org/articles/61276/elife-61276-supp4-v2.csv
-
Supplementary file 5
Reference gene expression patterns.
CSV file of the binarized reference gene expression patterns (along with geometry in Supplementary file 4). Formatted as used in DistMap to generate virtual wing disc.
- https://cdn.elifesciences.org/articles/61276/elife-61276-supp5-v2.csv
-
Transparent reporting form
- https://cdn.elifesciences.org/articles/61276/elife-61276-transrepform-v2.pdf
Download links
A two-part list of links to download the article, or parts of the article, in various formats.
Downloads (link to download the article as PDF)
Open citations (links to open the citations from this article in various online reference manager services)
Cite this article (links to download the citations from this article in formats compatible with various reference manager tools)
Single-cell transcriptomics of the Drosophila wing disc reveals instructive epithelium-to-myoblast interactions
eLife 10:e61276.
https://doi.org/10.7554/eLife.61276


