Cerebral blood flow and cerebrovascular reactivity are preserved in a mouse model of cerebral microvascular amyloidosis
- Department of Radiology, Leiden University Medical Center, Netherlands
- Department of Human Genetics, Leiden University Medical Center, Netherlands
- Princess Máxima Center for Pediatric Oncology, Netherlands
- Department of Radiotherapy, University Medical Center Utrecht, Netherlands
- Institut de Mathématiques de Bordeaux, Université Bordeaux/CNRS UMR 5251/INRIA, France
Figures
Figure 1
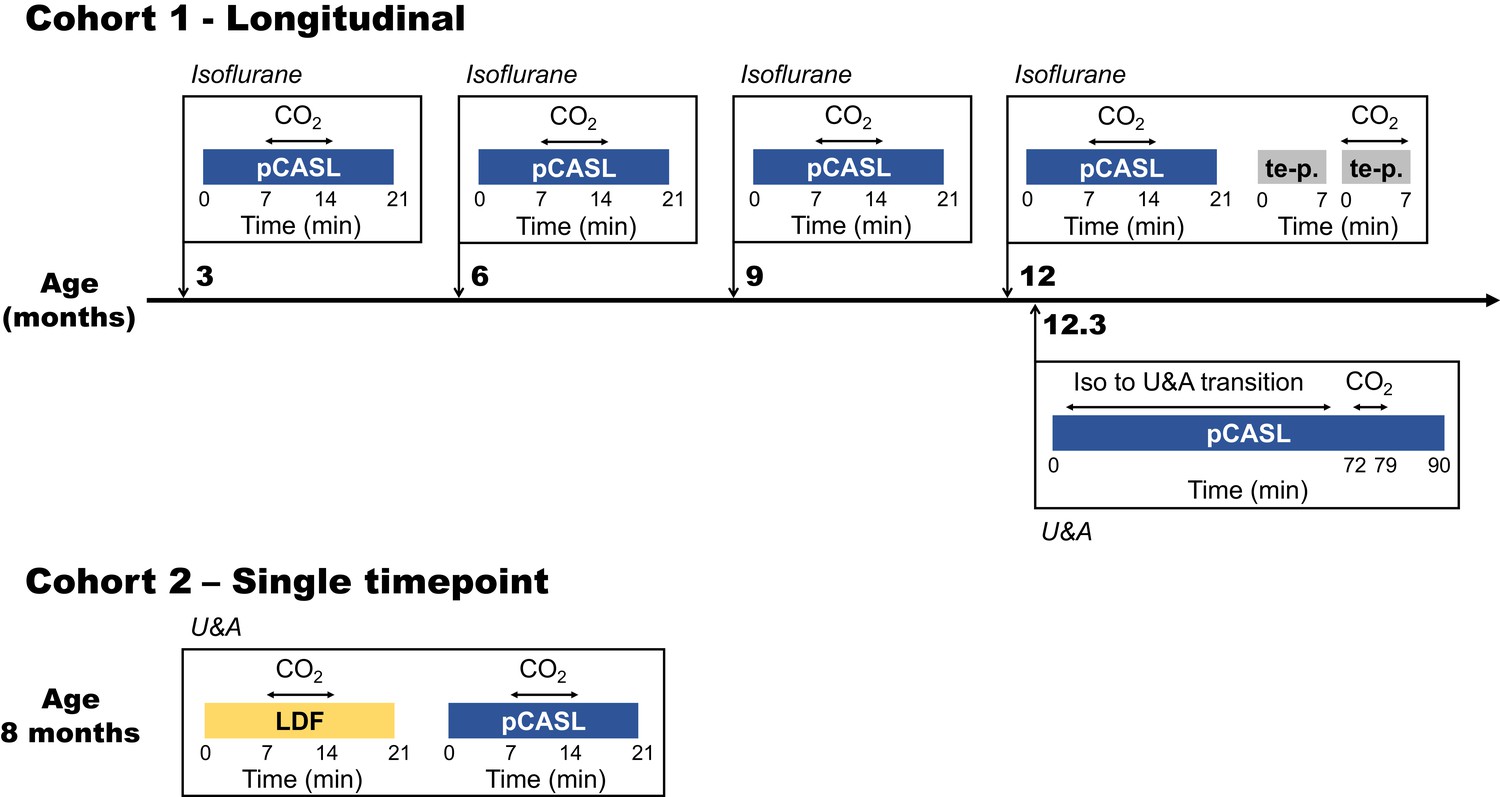
Study design.
Two different cohorts were used in this study, of which the first was followed longitudinally. The timeline of the first cohort is illustrated in the upper part of the figure, with scan moments indicated with orthogonal arrows projected onto the time line. The most relevant scans performed at these moments are indicated within the boxes adjoined to the orthogonal arrows and the type of anesthesia used is indicated in italics on top of the boxes. The lower part of the figure illustrates the single time point measurements performed in cohort 2. pCASL = pseudo-continuous arterial spin labeling; te p. = time-encoded pseudo-continuous arterial spin labeling; U and A = urethane and α-chloralose; LDF = laser Doppler flowmetry.
Figure 2
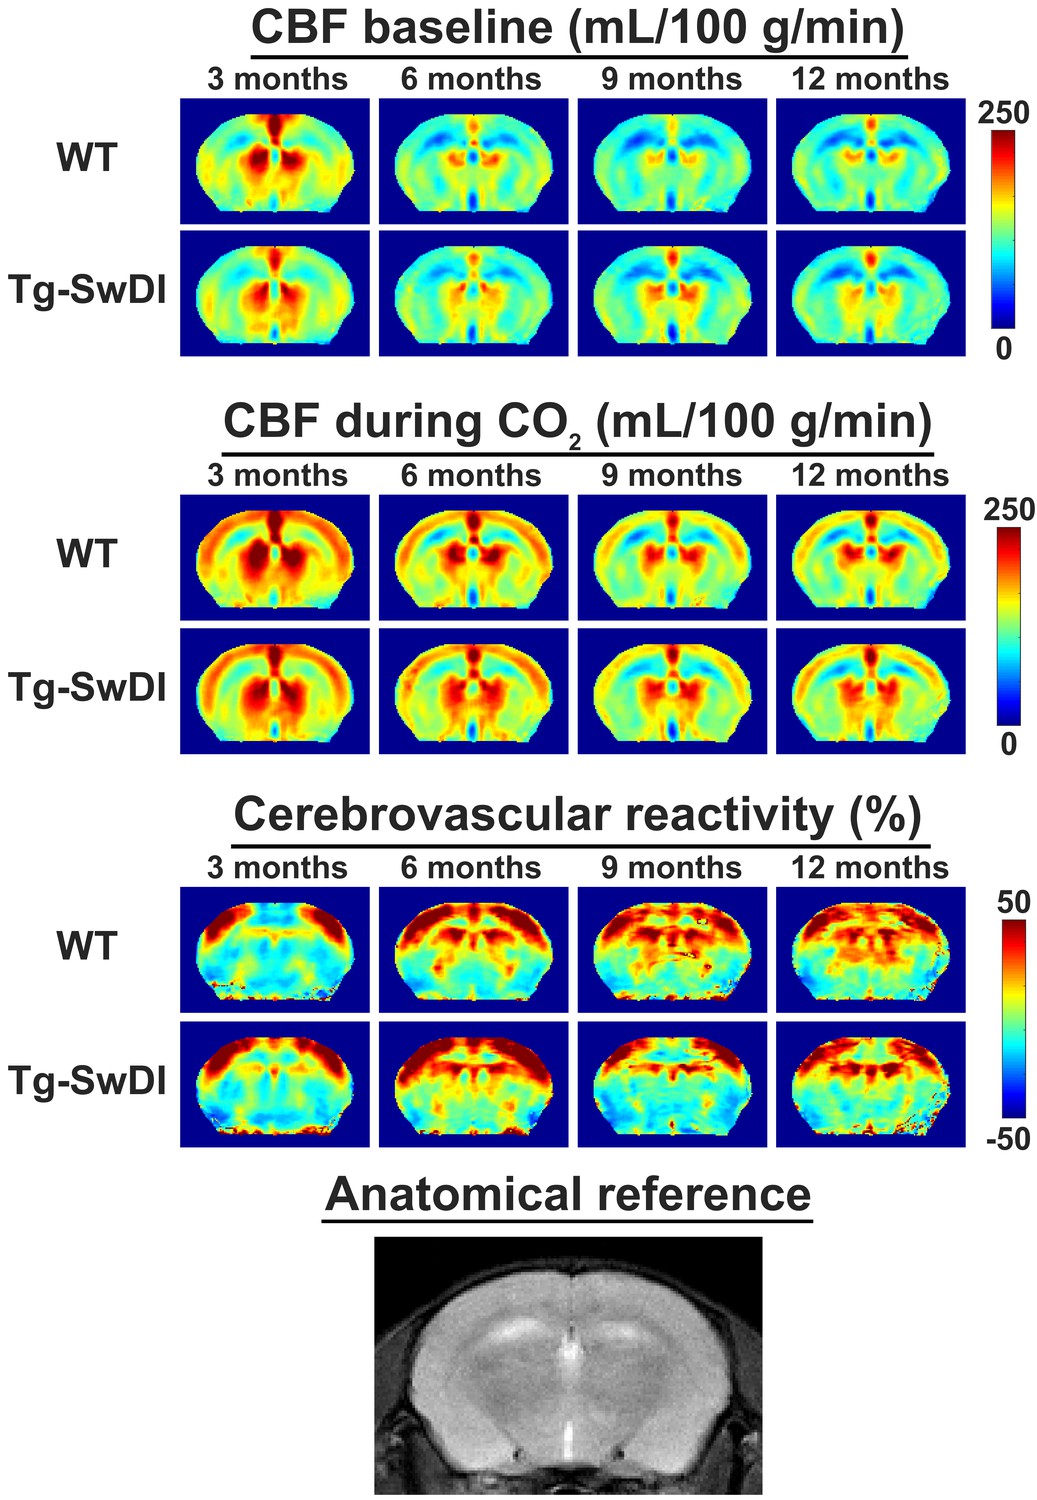
Average mid-brain cerebral blood flow (CBF) and cerebrovascular reactivity (CVR) maps for wild-type (WT) and transgenic Swedish Dutch Iowa (Tg-SwDI) mice in cohort 1.
From left to right, the different ages are displayed. From top to bottom, respectively CBF maps at baseline, CBF maps during CO2, and CVR maps are displayed, with WT and Tg-SwDI mice alternating per row. On the bottom row, an anatomical magnetic resonance imaging (MRI) scan of the same brain slice is shown. Note that the CBF increase during the CO2 challenge is most profound in the cortex, and that the WT and Tg-SwDI mice show similar CBF and CVR maps.
Figure 3 with 4 supplements
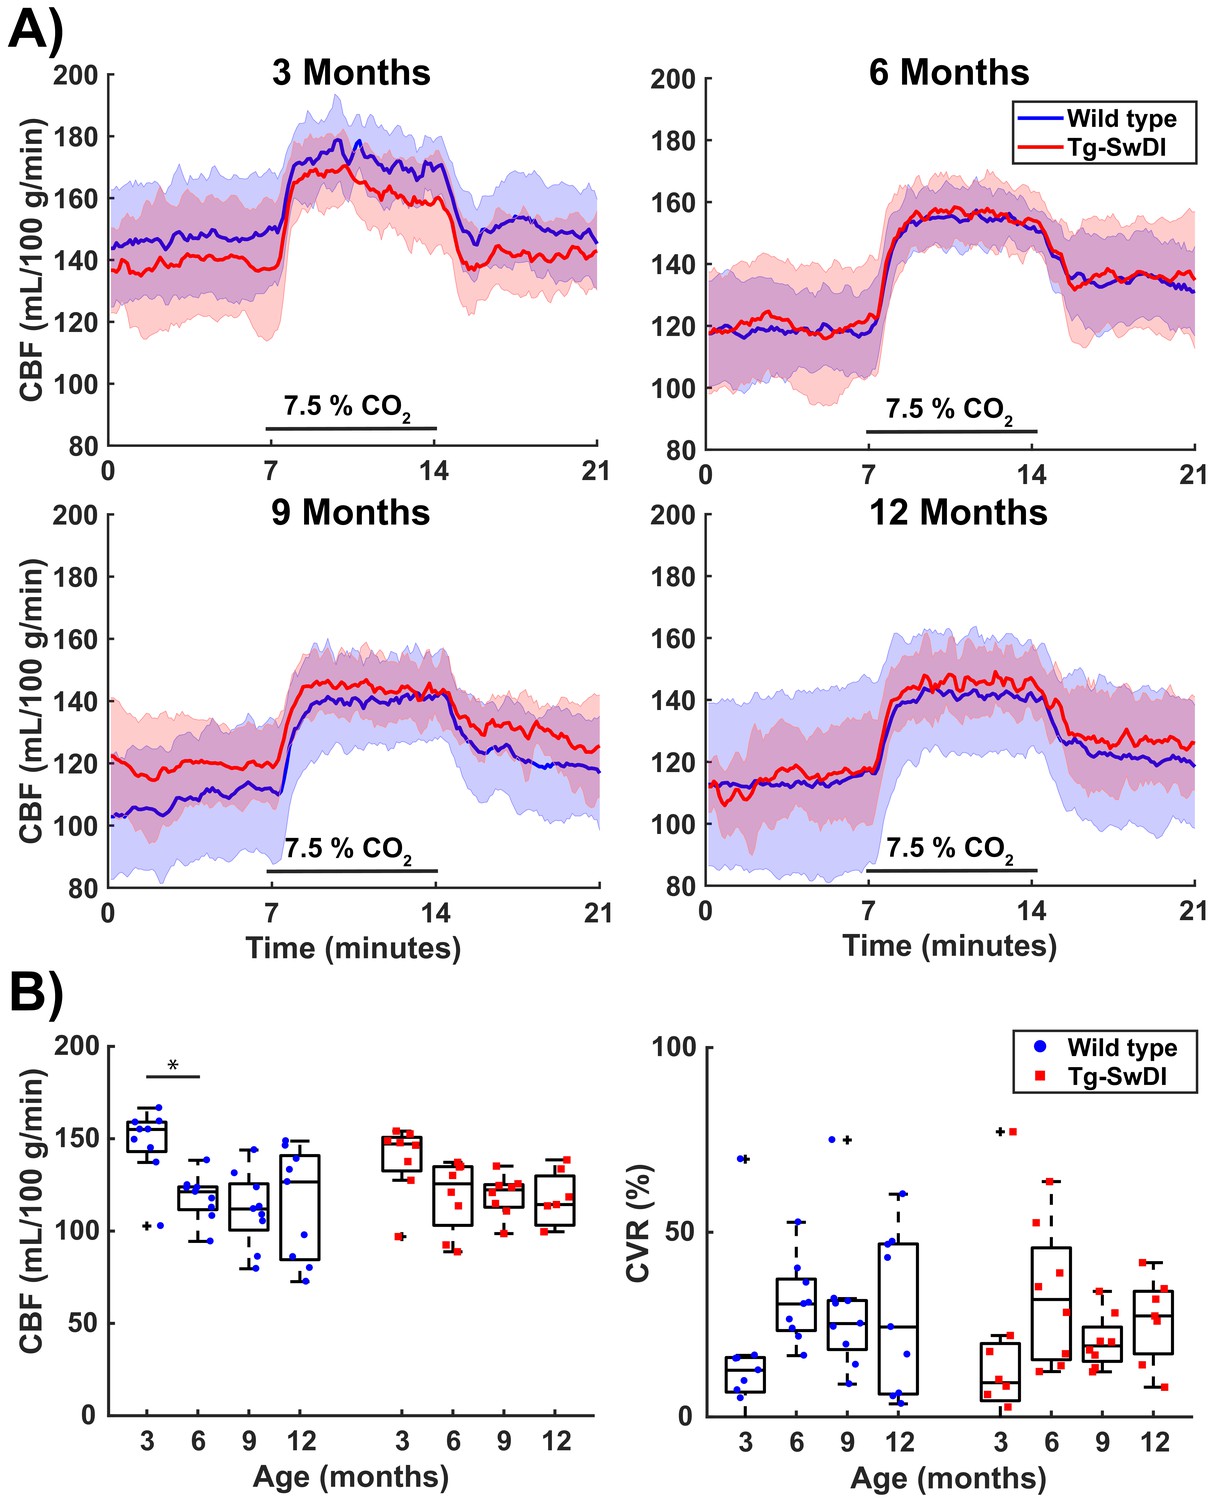
Cerebral blood flow (CBF) and cerebrovascular reactivity (CVR) values acquired in the mid-brain in cohort 1.
(A) 21-min CBF time profiles (mean ± standard deviation) that were retrieved in a full mid-brain slice at the ages of 3, 6, 9, and 12 months old shows for wild-type (WT) and transgenic Swedish Dutch Iowa (Tg-SwDI) mice. CO2 was administered between minutes 7 and 14. (B) Boxplot representations of baseline CBF (average of the last 2.3 min before the start of CO2 administration) and CVR (ratio of average of the last 2.3 min during CO2 to baseline CBF). Circles and squares represent individual mice. No significant differences were observed between the two genotypes, but there was a significant effect of age (Friedman test, p=0.005 for CBF in WT, p=0.037 for CBF in TG, p=0.040 for CVR in WT). From the post hoc analysis, only the drop in CBF in WT mice between 3 and 6 months old (p=0.008) reached the Bonferroni-corrected significance threshold (p=0.017).
Figure 3—figure supplement 1

Animal-by-animal cerebral blood flow (CBF), cerebrovascular reactivity (CVR), brain volume, and body weight progression with increasing age.
On the top row, CBF trends are displayed, on the second row CVR trends, on the third row brain volume, and on the last row body weight. The left column shows wild-type (WT) mice, and the right column transgenic Swedish Dutch Iowa (Tg-SwDI) mice. Every animal is represented with the same line color in the four graphs. The black dashed line represents the group mean.
Figure 3—figure supplement 2
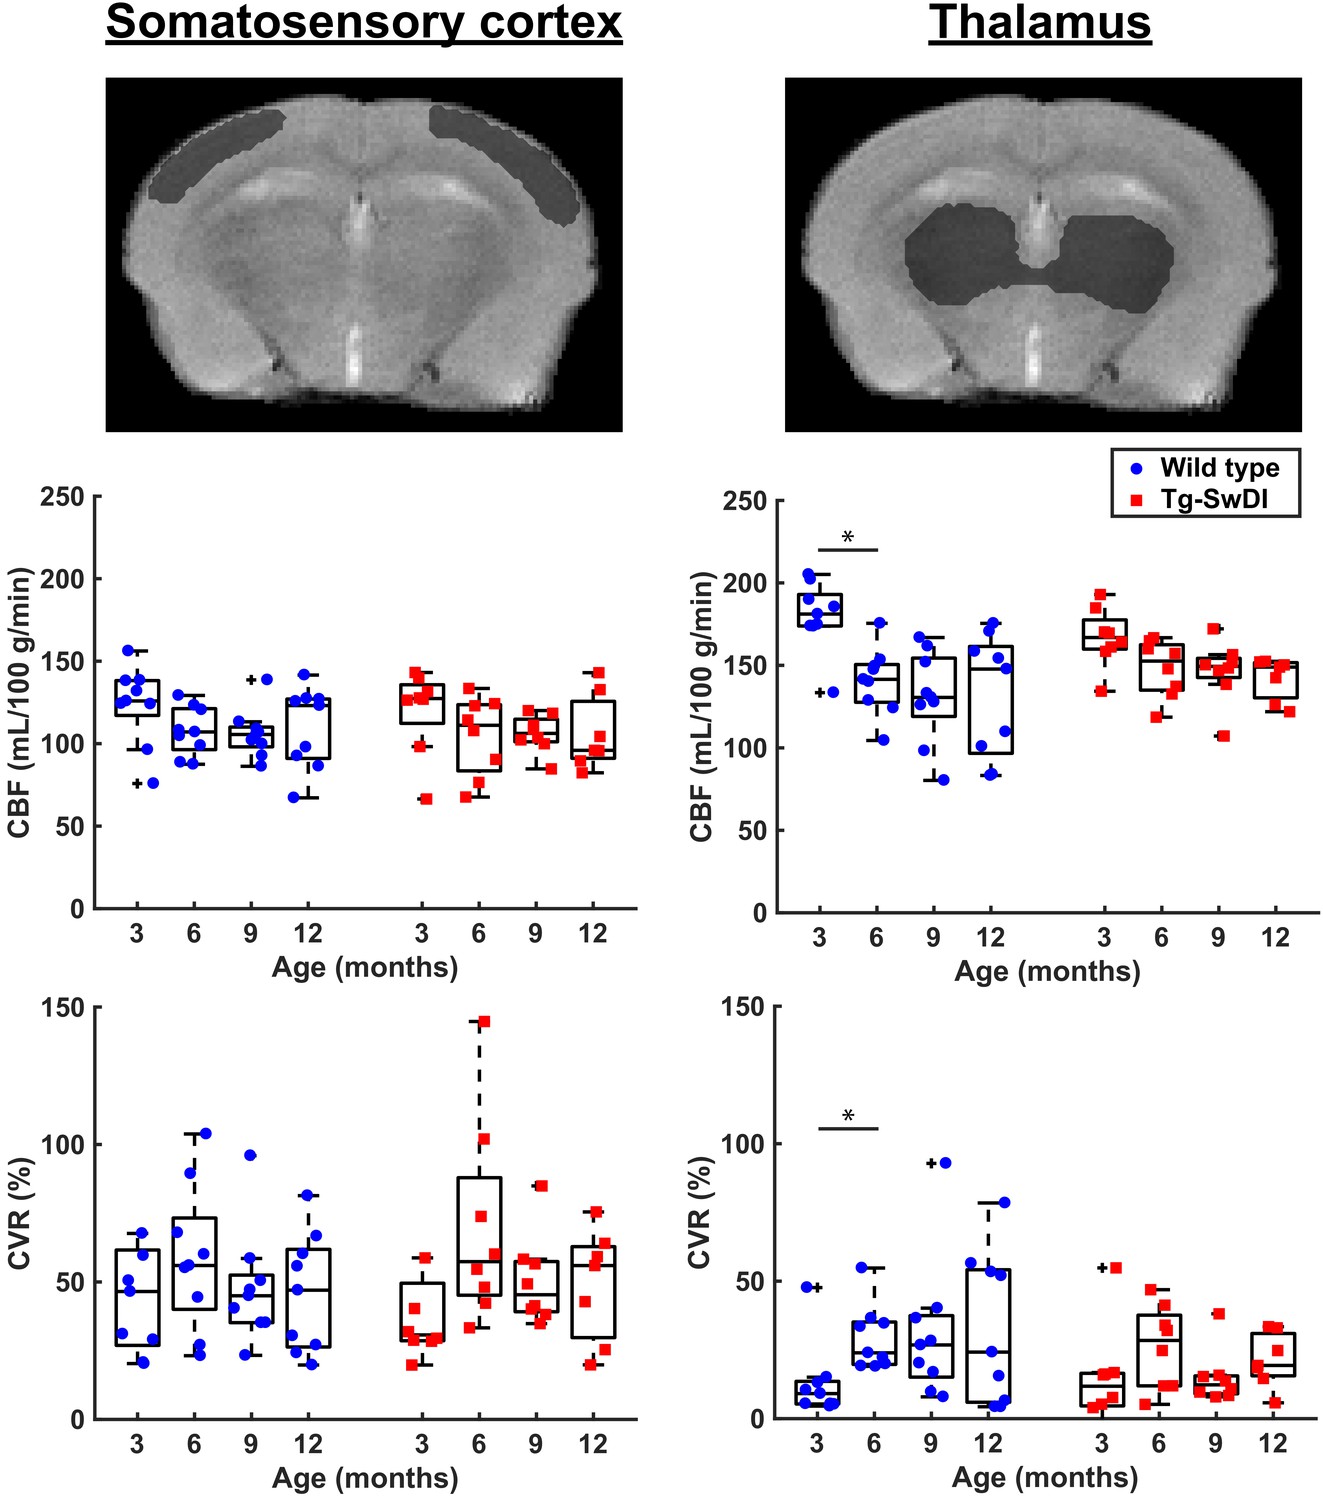
Cerebral blood flow (CBF) measurements in cortical (left) and thalamic (right) ROIs.
On the top row, representative T2 weighted images are shown with overlaying areas (in gray) representing the brain regions that were analyzed. The middle row shows boxplot representations of baseline CBF (average of the last 2.3 min before the start of CO2 administration) and bottom row shows cerebrovascular reactivity (CVR; ratio of average of the last 2.3 min during CO2 to baseline CBF). Circles and squares represent individual mice.
Figure 3—figure supplement 3
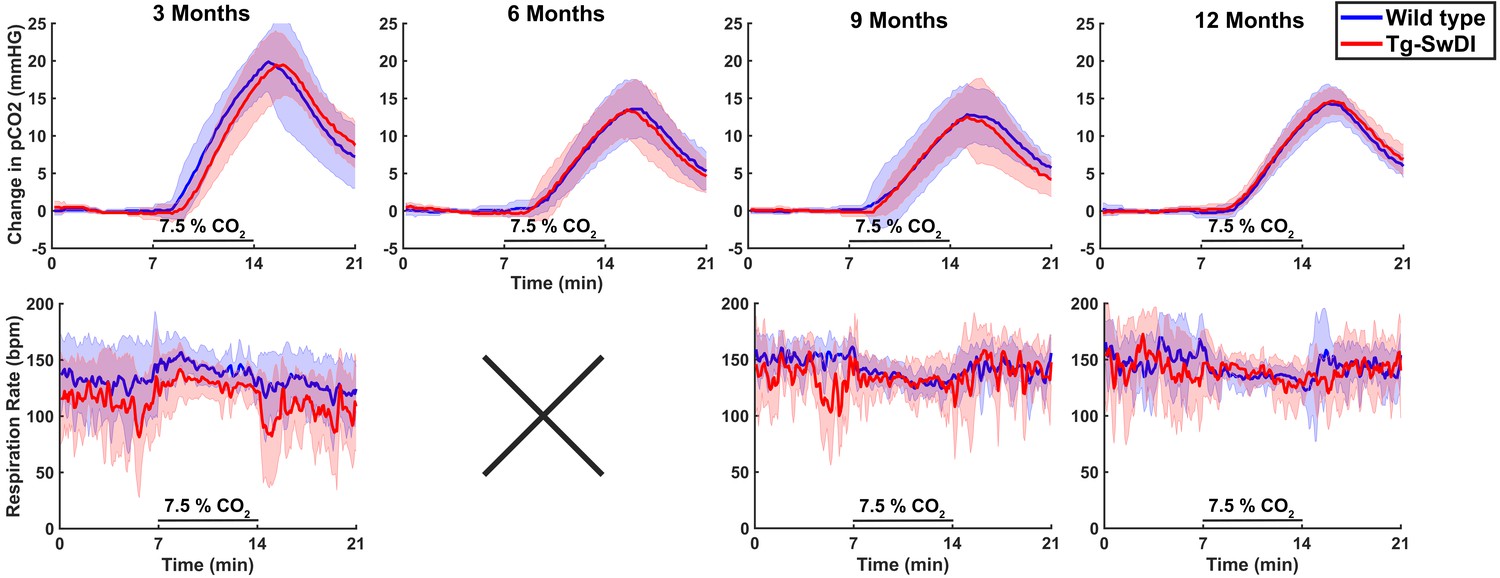
Change in transcutaneously measured pCO2 and respiration profiles during the pseudo-continuous arterial spin labeling (pCASL) measurements.
On the first row, the pCO2 time profiles (mean ± standard deviation) acquired during the pCASL scans in cohort 1 for both wild types (WT) and transgenic Swedish Dutch Iowa (Tg-SwDI) are displayed. On the second row, the respiration profiles (mean ± standard deviation) are displayed. Note that the respiration profiles were not captured during the second time point due to technical difficulties.
Figure 3—figure supplement 4
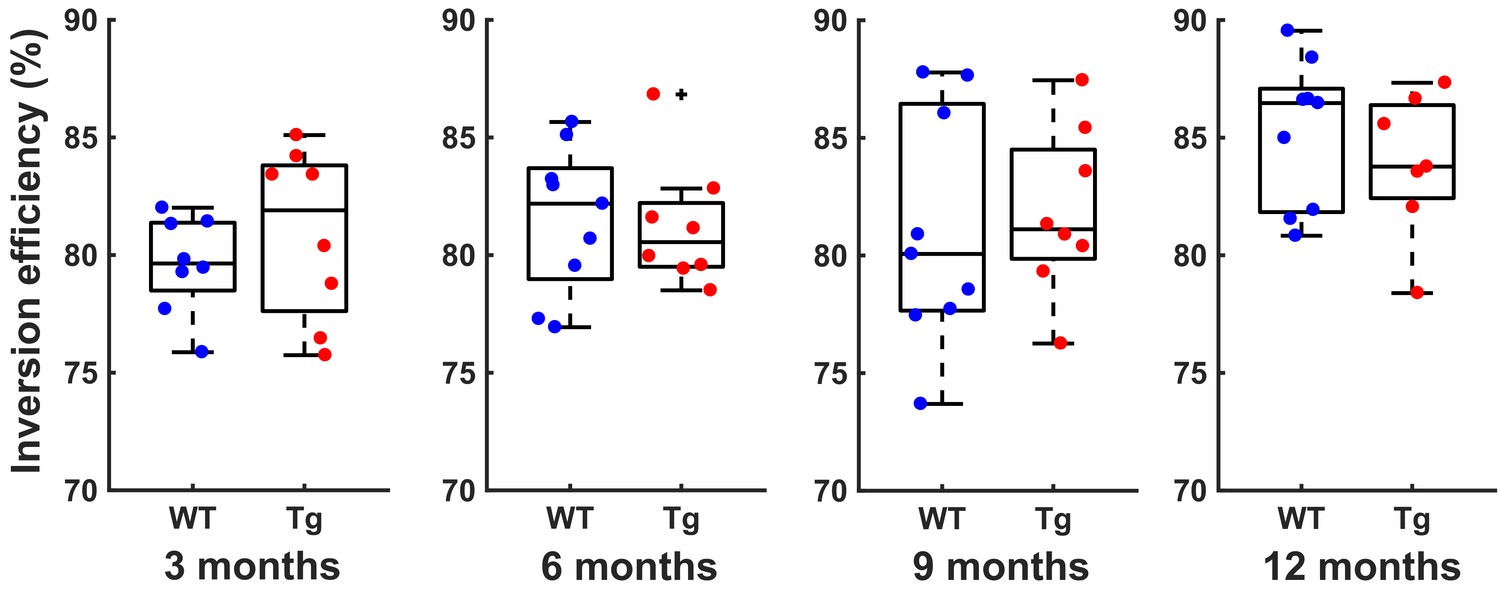
Inversion efficiency values measured at the different time points in cohort 1.
In the graphs from left to right, increasing ages are shown. Within each graph, wild types (WT) and transgenic Swedish Dutch Iowa (Tg-SwDI) mice are displayed.
Figure 4
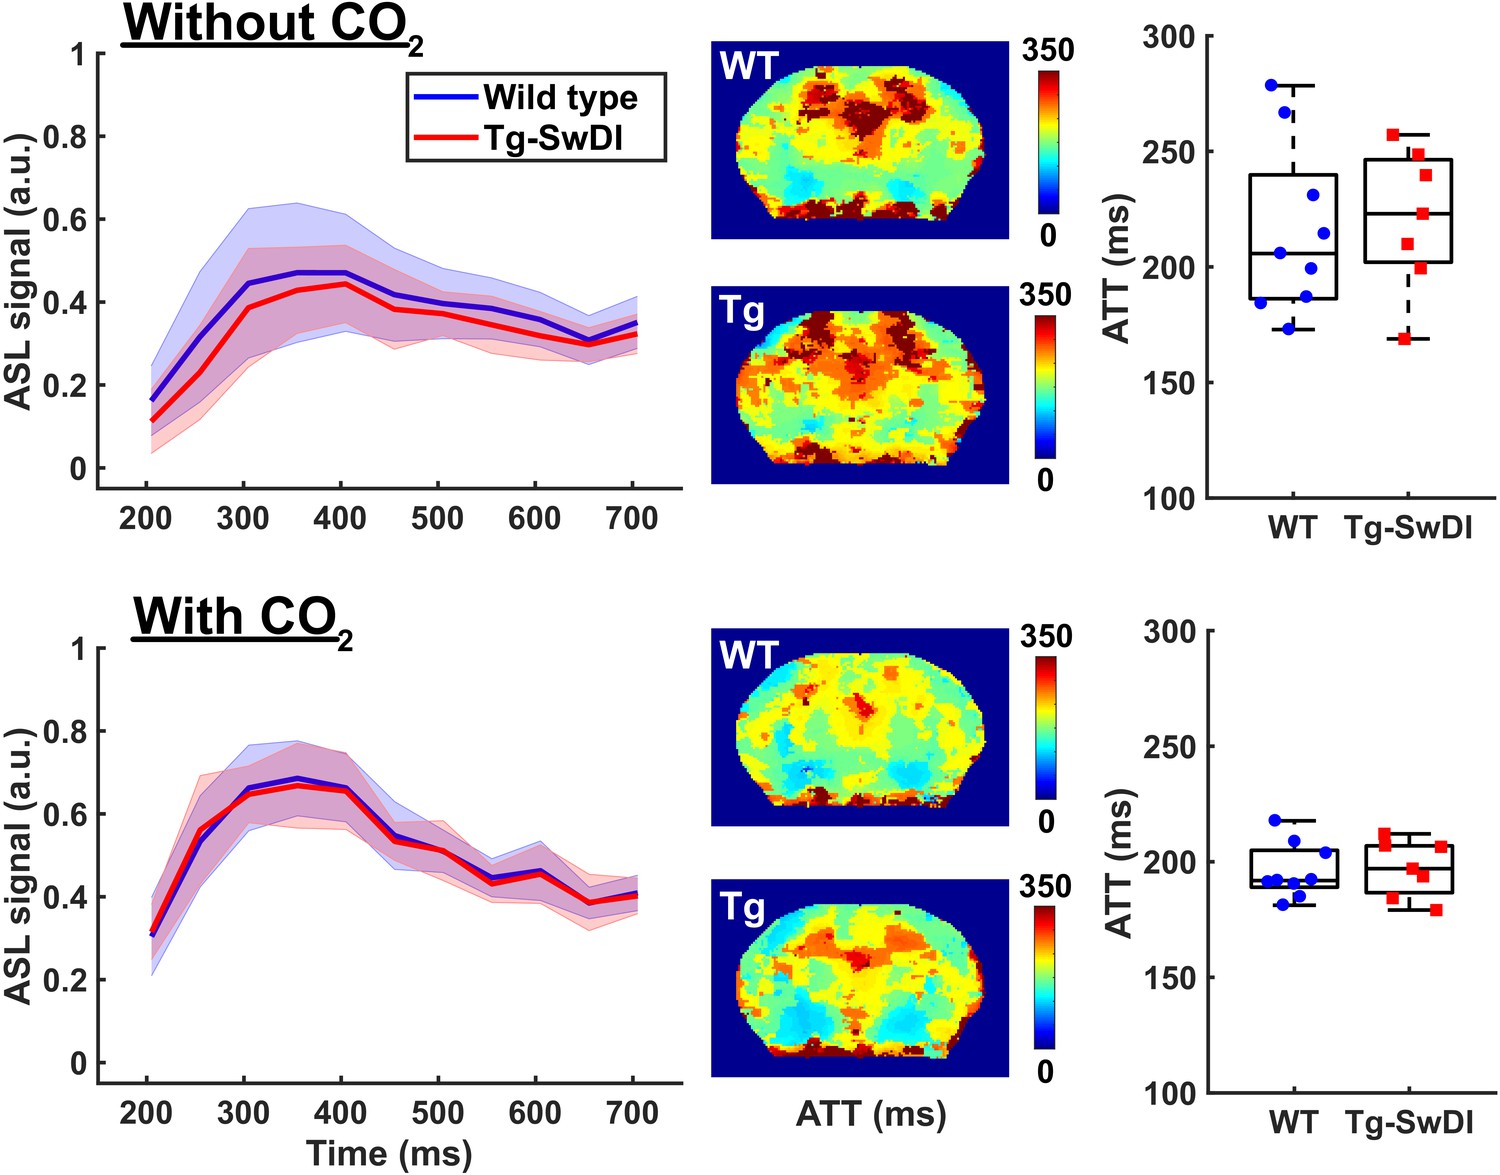
Arterial transit time (ATT) measurements acquired in the mid-brain of 12 months old wild-type (WT) and transgenic Swedish Dutch Iowa (Tg-SwDI) mice.
On the top row, measurements acquired at baseline are displayed, on the bottom row measurements acquired while administering 7.5% CO2. On the left column, graphs display the measured arterial spin labeling (ASL) signal (mean ± standard deviation) plotted against increasing post-label delay times. In the middle, maps are displayed that show averaged arrival times of the ASL signal. The maps were acquired in a mid-brain slice and are averaged for WT (top) and Tg-SwDI mouse (bottom). On the right, boxplot representations of the ATT values obtained in all mice are displayed, where circles and squares represent individual mice.
Figure 5 with 2 supplements

Cerebral blood flow (CBF) and cerebrovascular reactivity (CVR) acquired during isoflurane anesthesia and urethane and α-chloralose (U and A) anesthesia.
(A) 21-min CBF time profiles acquired in the mid-brain in wild-type (WT) and transgenic Swedish Dutch Iowa (Tg-SwDI) mice under either isoflurane anesthesia (left, 12 months old) or U and A anesthesia (right, 10 days later in the same mice). CO2 was administered between minutes 7 and 14. (B) Mid-brain CBF and CVR maps averaged for WT (top) and Tg-SwDI (bottom) mice. Note that the CVR maps during U and A anesthesia are scaled differently than the CVR maps under isoflurane due to the marked difference in CVR. (C) Boxplot representations of the baseline CBF and CVR group values, where dots and circles represent individual mice.
Figure 5—figure supplement 1
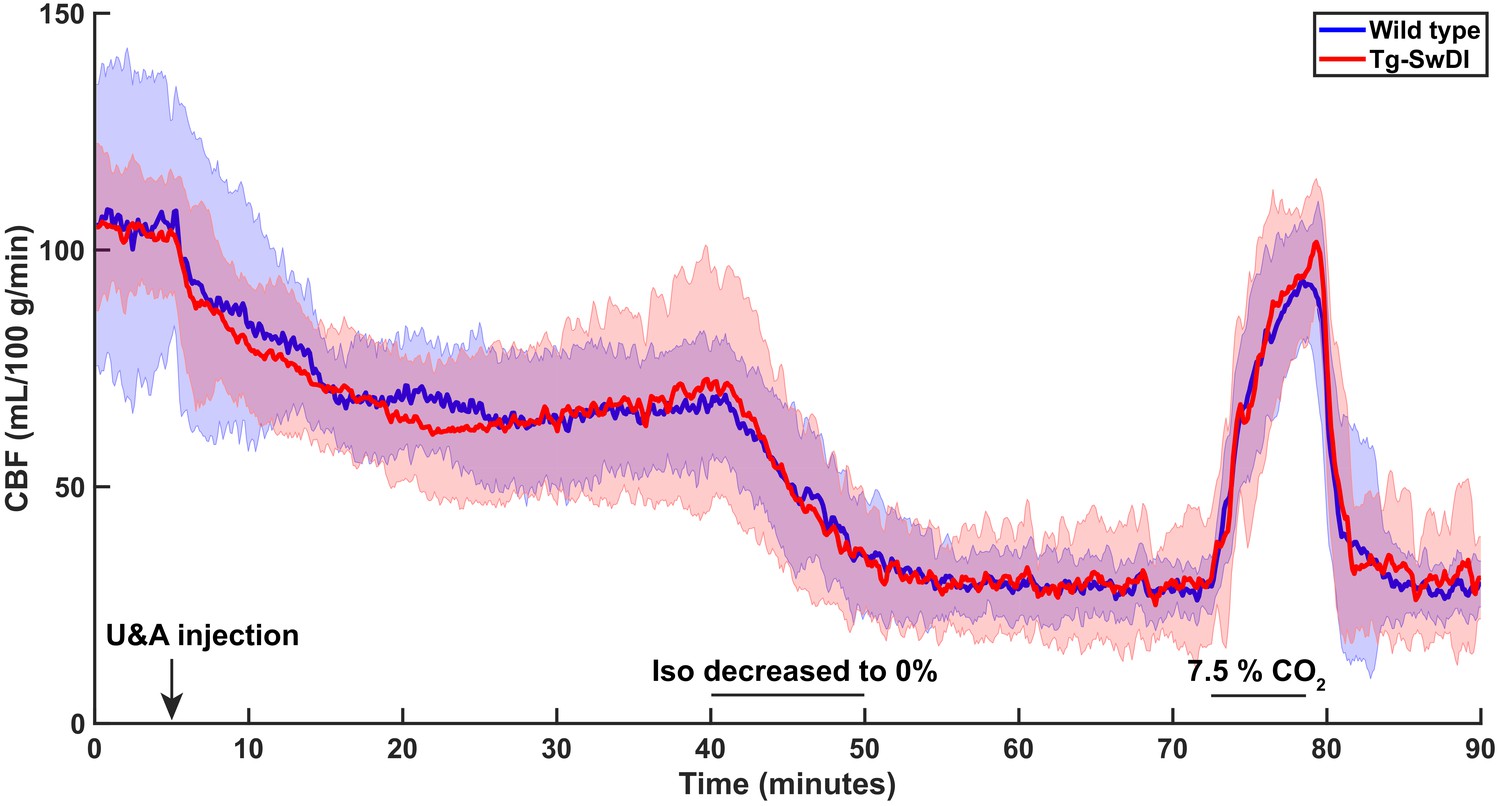
Cerebral blood flow (CBF) change observed during switching from isoflurane anesthesia to urethane and α-chloralose (U and A).
90-min CBF time profiles (mean ± standard deviation) are displayed that are acquired in cohort 1 for wild-type and transgenic Swedish Dutch Iowa (Tg-SwDI) mice at an age of 12.3 months. U and A was injected 5 min after the start of the arterial spin labeling-magnetic resonance imaging (MRI) scan. Isoflurane (iso) was decreased between minutes 40 and 50. CO2 was administered between minutes 72 and 79.
Figure 5—figure supplement 2
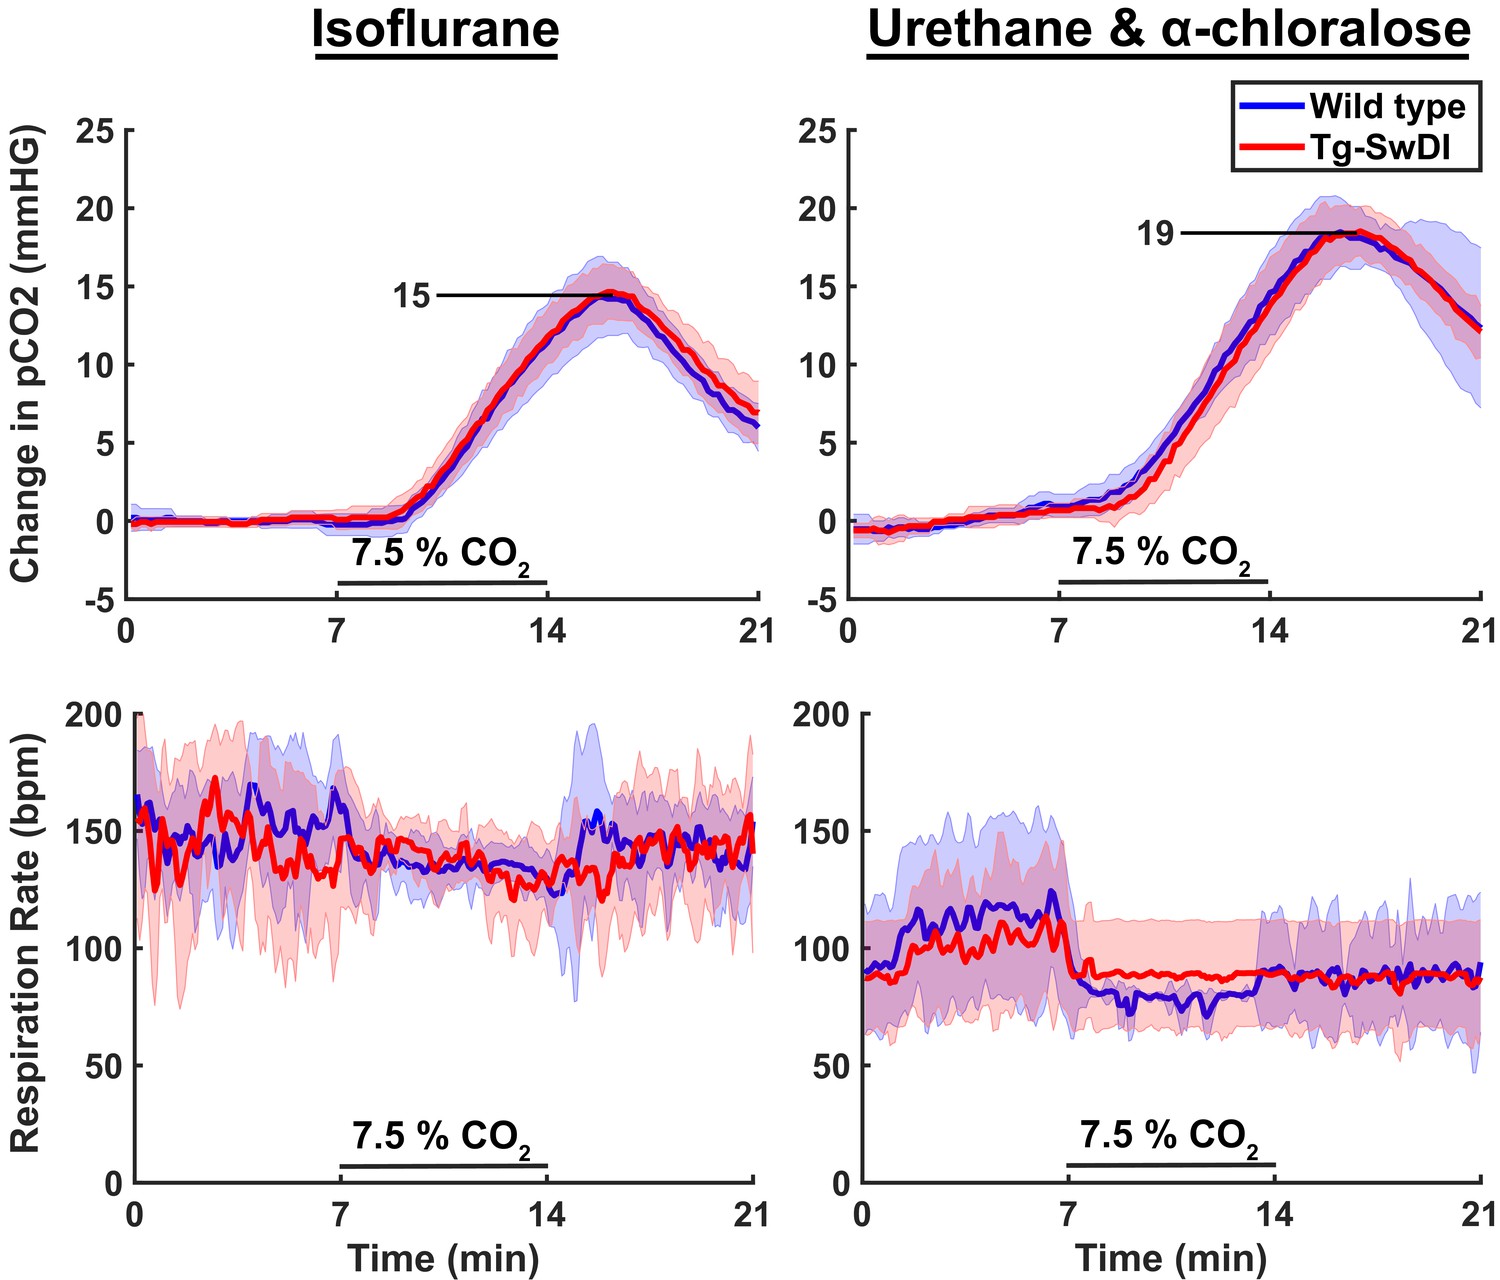
Change in transcutaneously measured pCO2 and respiration profiles under different anesthesia protocols.
On the first row, the pCO2 time profiles (mean ± standard deviation) acquired during the pseudo-continuous arterial spin labeling (pCASL) scans are displayed for both wild-type (WT) and transgenic Swedish Dutch Iowa (Tg‑SwDI) mice in the last two time-points of cohort 1, with the acquisition under isoflurane on the left, the acquisition under urethane and α-chloralose on the right. On the second row, the respiration profiles (mean ± standard deviation) for the same time-points are displayed.
Figure 6 with 1 supplement
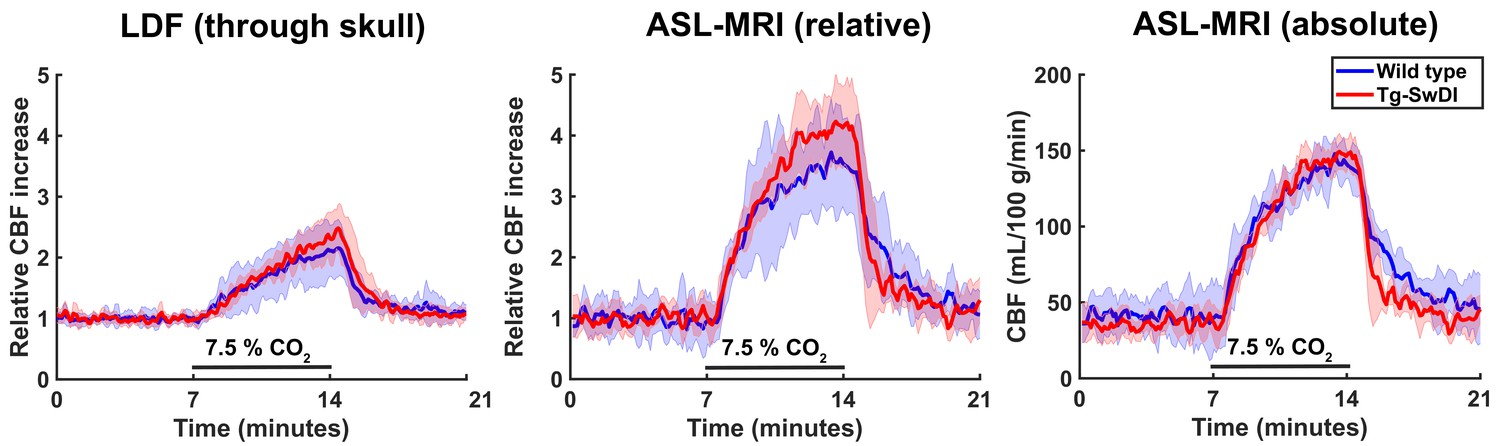
Cerebral blood flow (CBF) time profiles acquired with laser Doppler flowmetry (LDF) and arterial spin labeling (ASL)-magnetic resonance imaging (MRI).
On the left, 21-min CBF time profiles acquired with LDF in the somatosensory cortex are displayed for wild-type (WT) and transgenic Swedish Dutch Iowa (Tg-SwDI) mice. In the middle, 21-min CBF time profiles are displayed that are acquired with ASL-MRI in the left somatosensory cortex, after baseline correction, so the profiles can be compared to the LDF time profiles. On the right are the same profiles as in the middle, without baseline correction.
Figure 6—figure supplement 1
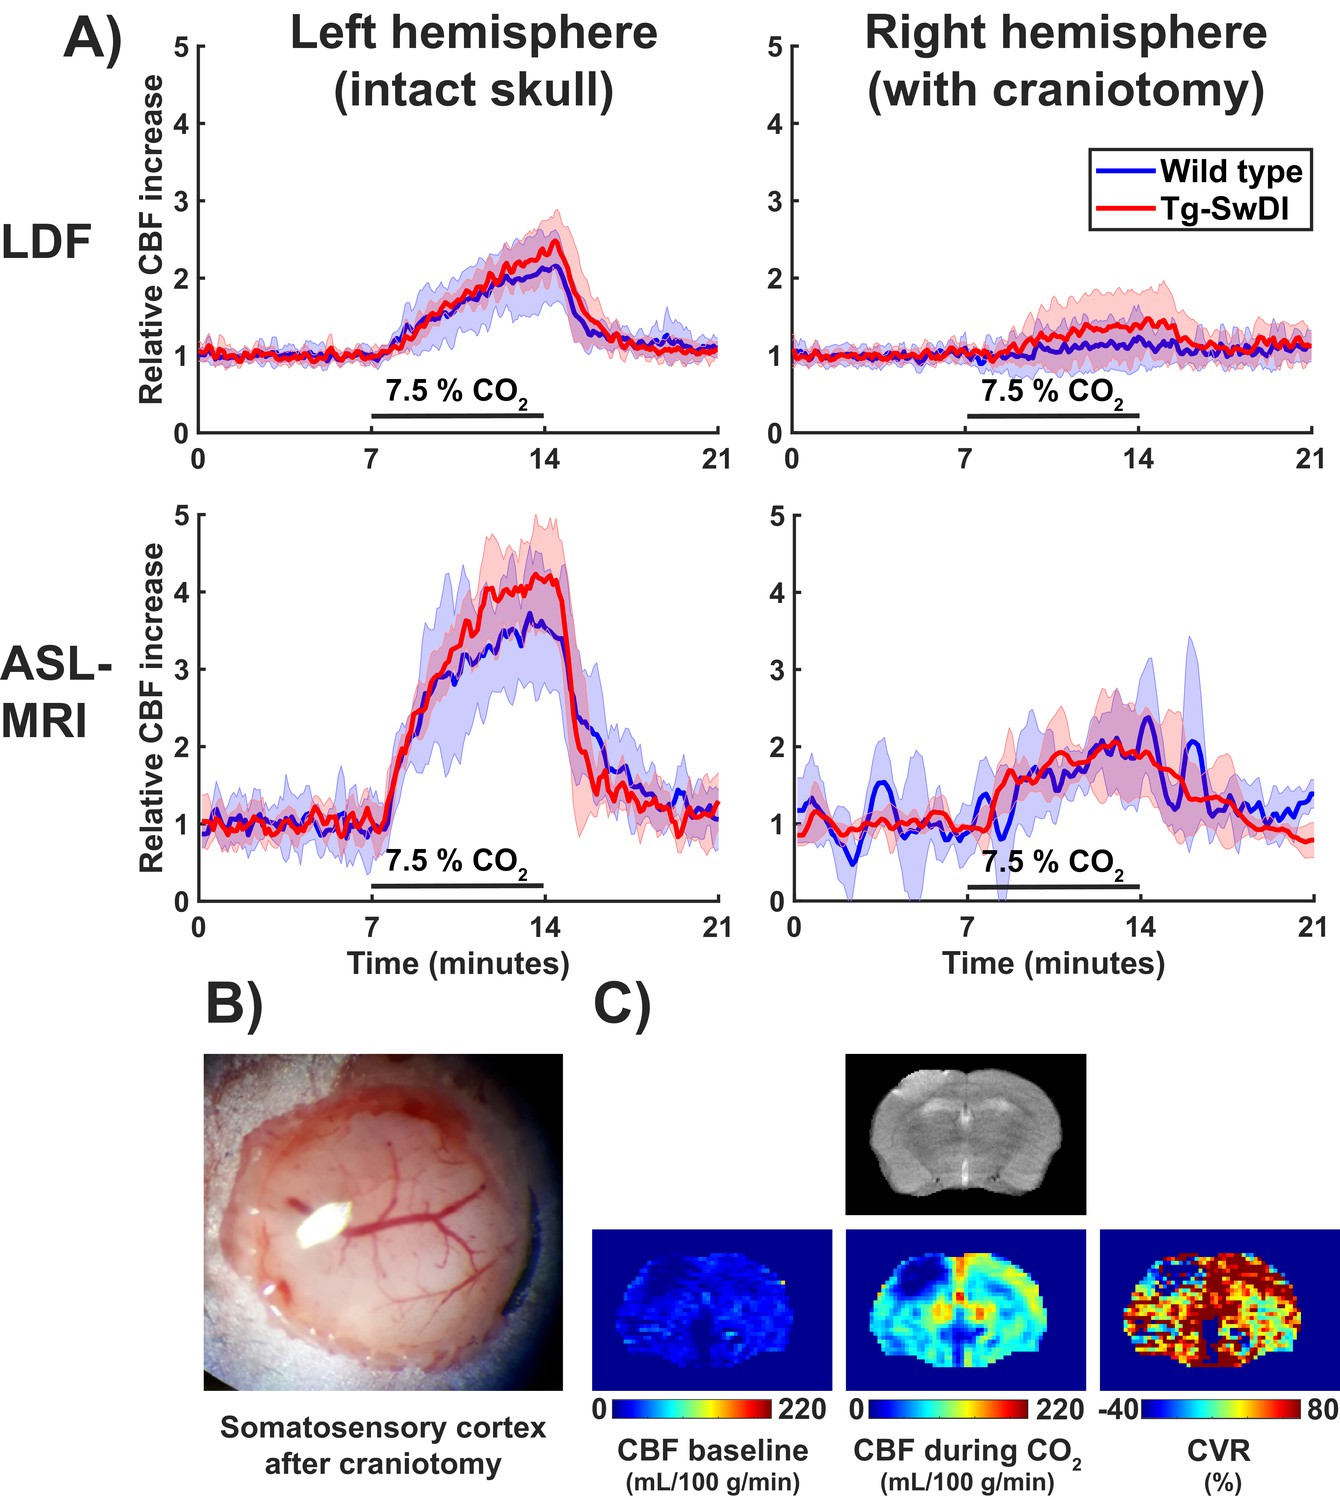
Cerebrovascular reactivity (CVR) measurements with laser Doppler flowmetry (LDF) and arterial spin labeling-magnetic resonance imaging (ASL-MRI) with and without skull removal.
(A) CVR time profiles acquired either with LDF (top row) or ASL-MRI (bottom row). The left column shows the CVR time profiles from the intact, left hemisphere, the right column the profiles from the right hemisphere after craniotomy. (B) A photograph of the somatosensory cortex of a representative mouse after craniotomy. (C) On the top row, a T2 weighted image that was acquired with MRI after craniotomy. On the bottom row, cerebral blood flow (CBF) and CVR images that were acquired in the same scan session. Note that the left hemisphere is displayed on the right, according to radiological convention.
Figure 7

Amyloid-β histology.
Shown are representative stainings of wild-type (WT) and transgenic Swedish Dutch Iowa (Tg-SwDI) mice of 12.3 months old. The upper row is an overview image, and the other rows are zoomed in regions from the overview image.
Author response image 1
Tables
Key resources table
| Reagent type (species) or resource | Designation | Source or reference | Identifiers | Additional information |
|---|---|---|---|---|
| Strain, strain background (Mus musculus) | C57Bl/6J (WT) | Jackson lab | RRID:IMSR_JAX:000664 | |
| Strain, strain background (Mus musculus) | C57BL/6-Tg(Thy1-APPSwDutIowa)-BWevn/Mmjax (Tg-SwDI) | Jackson lab | MMRRC Stock No: 34843-JAX | |
| Antibody | Anti-beta amyloid antibody (rabbit polyclonal) | Abcam | ab2539 RRID:AB_303141 | ‘(1:1000)’ dilution |
| Antibody | Anti-rabbit IgG antibody (pig polyclonal) | Dako | E0431 | ‘(1:300)’ dilution |
| Ahemical compound, drug | α-Chloralose | Sigma-Aldrich | C0128 | 50 mg/kg |
| Chemical compound, drug | Urethane | Sigma-Aldrich | U2500 | 750 mg/kg |
| Software, algorithm | DASYLab | National Instruments | https://www.mccdaq.com/DASYLab-Resources.aspx | Version 13 |
| Software, algorithm | MATLAB | Mathworks | RRID:SCR_001622 | |
| Software, algorithm | SPSS | IBM | RRID:SCR_002865 | Version 26 |
| Software, algorithm | EVolution | Denis de Senneville et al. | Phys Med Biol 2016 | |
| Software, algorithm | MIA / MP3 | Brossard et al. | Front Neuroinform 2020 | |
| Software, algorithm | G*Power | Faul et al. | Behav Res Methods 2007 | |
| Other | Avidin-Biotin Complex kit | Vector Laboratories | Vectastain |
Additional files
-
Supplementary file 1
In this table, the outcomes of the statistical tests are detailed.
The tests are grouped per effect measured, that is, genotype effects on tab 1, age effects on tab 2, anesthesia effects on tab 3, and CO2 effects on tab 4. Tests that returned significant effects are highlighted in green.
- https://cdn.elifesciences.org/articles/61279/elife-61279-supp1-v1.xlsx
-
Transparent reporting form
- https://cdn.elifesciences.org/articles/61279/elife-61279-transrepform-v1.docx
Download links
A two-part list of links to download the article, or parts of the article, in various formats.
Downloads (link to download the article as PDF)
Open citations (links to open the citations from this article in various online reference manager services)
Cite this article (links to download the citations from this article in formats compatible with various reference manager tools)
Cerebral blood flow and cerebrovascular reactivity are preserved in a mouse model of cerebral microvascular amyloidosis
eLife 10:e61279.
https://doi.org/10.7554/eLife.61279


