The SWELL1-LRRC8 complex regulates endothelial AKT-eNOS signaling and vascular function
- Department of Internal Medicine, Cardiovascular Division, Washington University School of Medicine, United States
- Eastern Region, King Abdullah International Medical Research Center, King Saud bin Abdulaziz University for Health Sciences, Saudi Arabia
- Department of Cell Biology and Physiology, Washington University in St. Louis, School of Medicine, United States
- Department of Internal Medicine, Cardiovascular Division, University of Iowa, United States
- Department of Ophthalmology, University of Iowa, Carver College of Medicine, United States
- Center for Cardiovascular Research, Washington University, United States
Figures
Figure 1
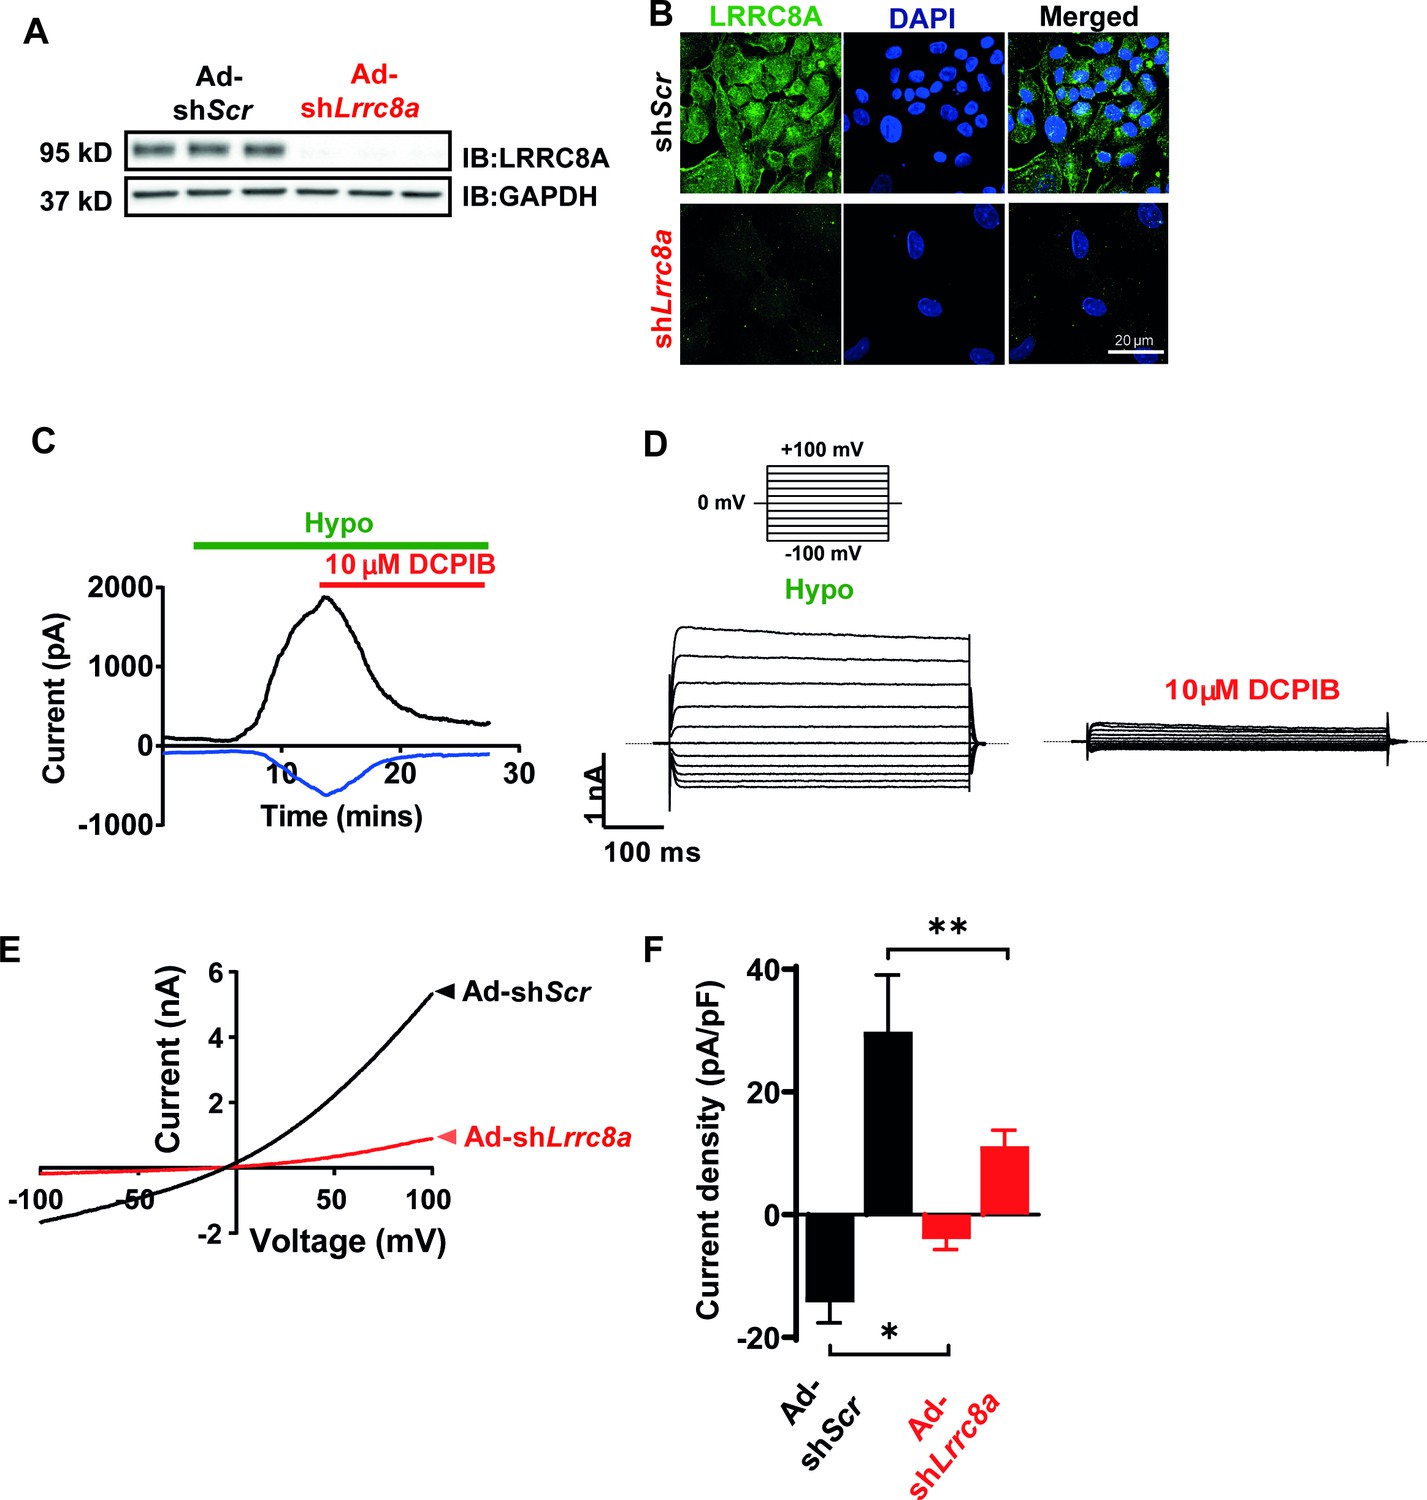
Leucine-rich repeat-containing protein 8a (LRRC8A) mediates volume-regulated anion channel (VRAC) currents in human umbilical vein endothelial cells (HUVECs).
(A) LRRC8A Western blot in HUVECs transduced with adenovirus expressing a short-hairpin RNA directed to LRRC8A (Ad-shLrrc8a) compared to control scrambled short-hairpin RNA (Ad-shScr). GAPDH is used as loading control. (B) Immunofluorescence staining of the HUVECs transduced with Ad-shLrrc8a and Ad-shScr. (C) Current-time relationship of VRAC current (hypotonic, 210 mOsm) in Ad-shScr transduced HUVEC and co-application of 10 µM 4-(2-butyl-6,7-dichloro-2-cyclopentyl-indan-1-on-5-yl) oxobutyric acid (DCPIB). (D) Representative current traces upon hypotonic activation (left) during voltage steps (from -100 to +100 mV, shown in inset) and inhibition by DCPIB (right). (E) Current-voltage relationship of VRAC during voltage ramps from -100 mV to +100 mV after hypotonic swelling in HUVECs transduced with Ad-shScr and Ad-shLrrc8a. (F) Mean current outward and inward densities at +100 and -100 mV (n,shSCR=4 cells; n,shLrrc8a=6 cells). Data are shown as mean ± s.e.m. *p<0.05; **p<0.01; unpaired t-test for (F).
-
Figure 1—source data 1
Source data for Figure 1F.
- https://cdn.elifesciences.org/articles/61313/elife-61313-fig1-data1-v2.xlsx
Figure 2 with 1 supplement
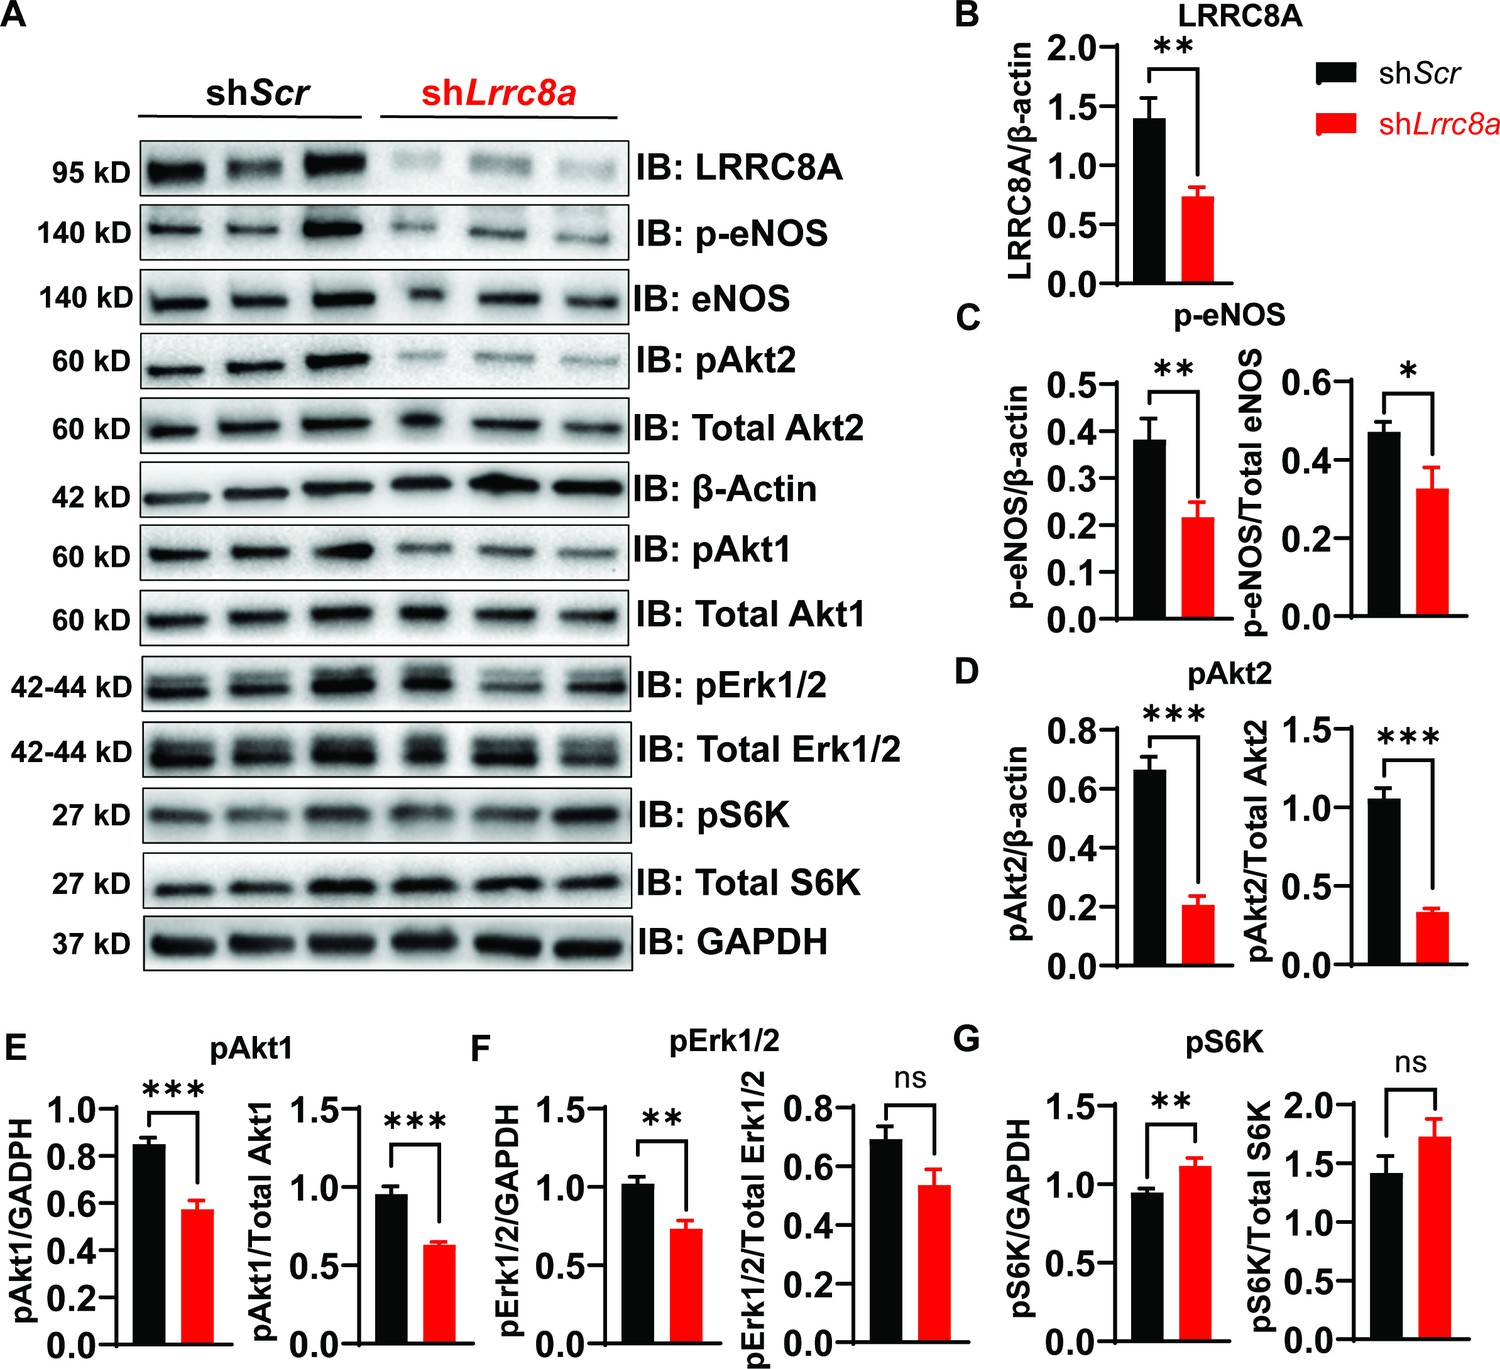
Leucine-rich repeat-containing protein 8a (LRRC8A) regulates PI3K-AKT-endothelial nitric oxide synthase (eNOS), ERK signaling in endothelium.
(A) Western blots of LRRC8A, pAkt2, pAkt1, Akt2, Akt1, pErk1/2, Erk1/2, phosphorylated eNOS (p-eNOS), eNOS, pS6K ribosomal protein, S6K ribosomal protein, GAPDH, and ß-actin in Ad-shScr and Ad-shLrrc8a transduced human umbilical vein endothelial cells (HUVECs) under basal conditions. Quantification of LRRC8A/ß-actin (B), p-eNOS/ß-actin, p-eNOS/total eNOS (C), pAkt2/ß-actin, pAkt2/total Akt2 (D), pAkt1/GAPDH, pAkt1/total Akt1 (E), pERK1/2/GAPDH, pErk1/2/total Erk1/2 (F), pS6 ribosomal protein/GAPDH, and pS6K ribosomal protein/total S6K ribosomal protein (G). N = 6 independent experiments. Significance between the indicated groups in all blots was calculated using a two-tailed unpaired Student’s t-test. Data are shown as mean ± s.e.m. *p<0.05; **p<0.01; ***p<0.001.
-
Figure 2—source data 1
Source data for Figure 2.
- https://cdn.elifesciences.org/articles/61313/elife-61313-fig2-data1-v2.xlsx
Figure 2—figure supplement 1

Leucine-rich repeat-containing protein 8a (LRRC8A) regulates PI3K-AKT-endothelial nitric oxide synthase (eNOS) and ERK signaling in endothelium.
(A) Western blots of LRRC8A, pAkt2, pAkt1, Akt, pErk1/2, Erk1/2, phosphorylated eNOS (p-eNOS), eNOS, pS6K ribosomal protein, S6K ribosomal protein, and ß-actin in si-SCR and si-LRRC8A transfected human umbilical vein endothelial cells (HUVECs) under basal conditions. Quantification of LRRC8A/ß-actin (B), p-eNOS/ß-actin, p-eNOS/total eNOS (C), pAkt2/ß-actin, pAkt2/total Akt (D), pAkt1/ß-actin, pAkt1/total Akt (E), pERK1/2 /ß-actin, pErk1/2/total Erk1/2 (F), pS6 ribosomal protein/ß-actin, and pS6K ribosomal protein/total S6K ribosomal protein (G). N = 6 independent experiments. Significance between the indicated groups in all blots was calculated using a two-tailed Student’s t-test. Error bars represent mean ± s.e.m. *p<0.05; **p<0.01; ***p<0.001.
-
Figure 2—figure supplement 1—source data 1
Source data for Figure 2—figure supplement 1.
- https://cdn.elifesciences.org/articles/61313/elife-61313-fig2-figsupp1-data1-v2.xlsx
Figure 3 with 1 supplement
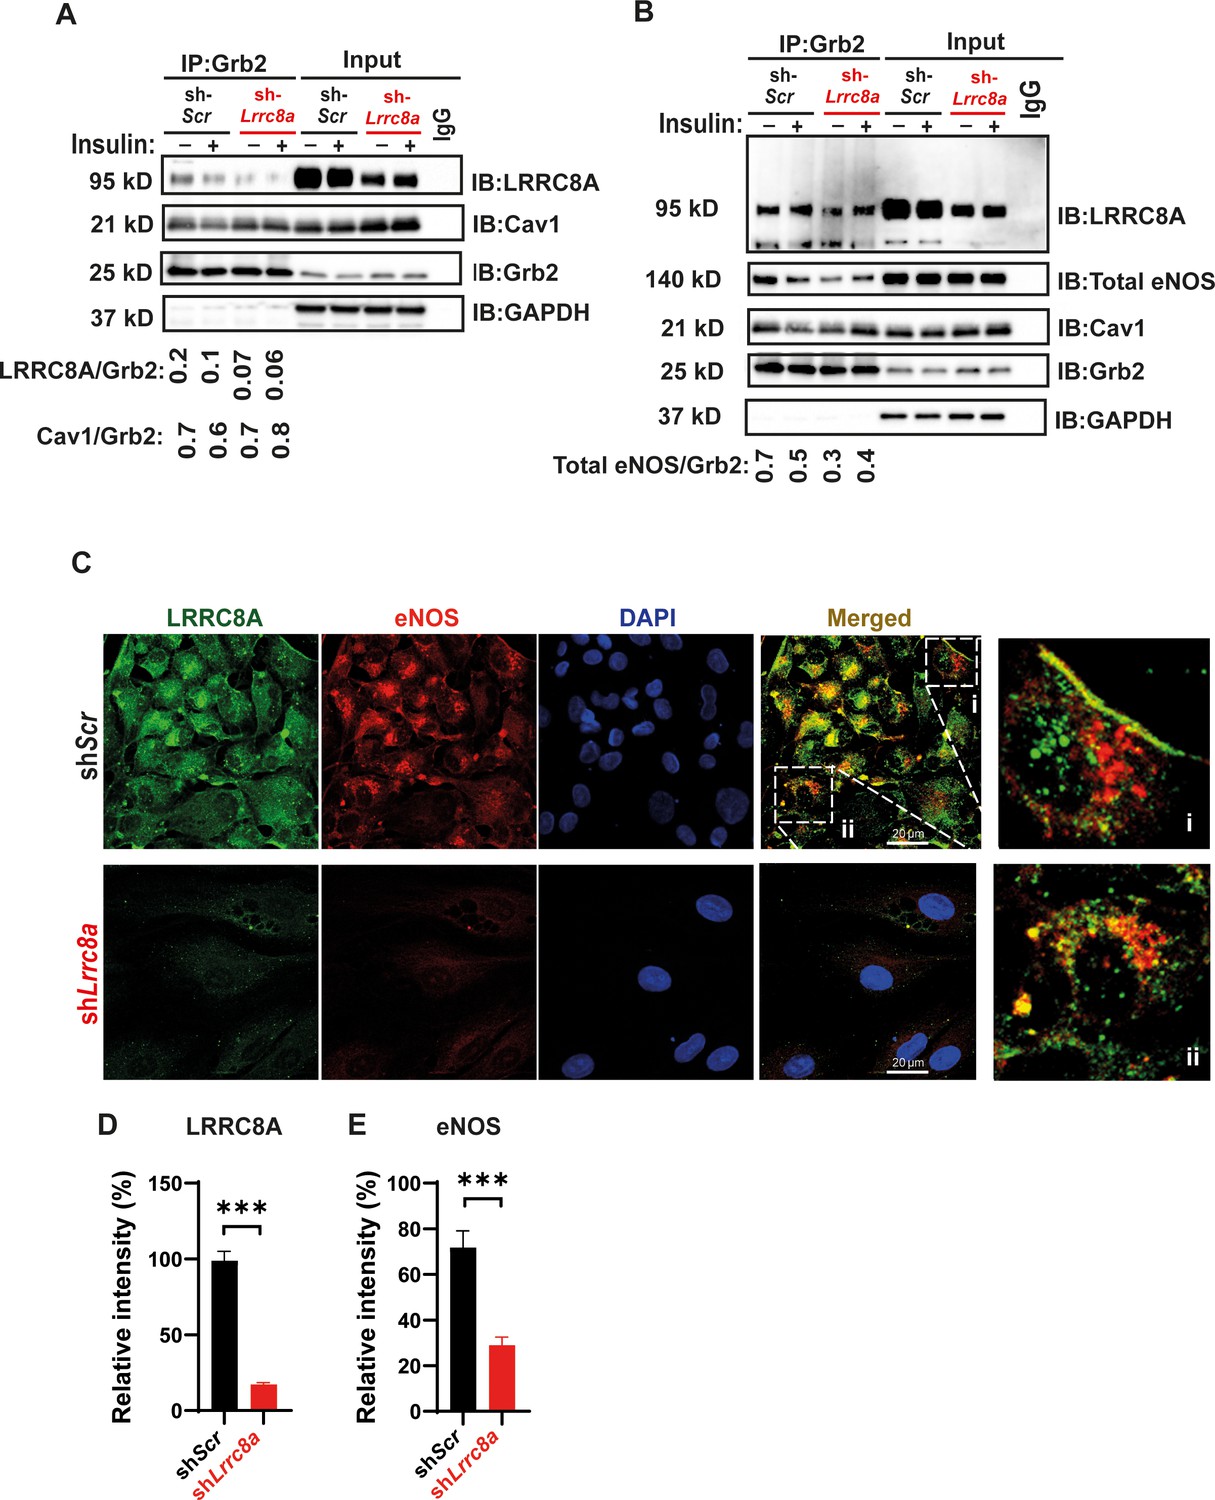
Leucine-rich repeat-containing protein 8A (LRRC8A) interacts with Grb2, Cav1, and endothelial nitric oxide synthase (eNOS) in human endothelium.
(A) GRB2 immunoprecipitation from Ad-shScr and Ad-shLrrc8a transduced human umbilical vein endothelial cells (HUVECs) and immunoblot with LRRC8A, Cav1, and GRB2 antibodies. Densitometry values for GRB2 co-immunoprecipitated LRRC8A (LRRC8A/GRB2) and GRB2 co-immunoprecipitated Cav1 (Cav1/GRB2). GAPDH serves as loading control for input samples. (B) GRB2 immunoprecipitation from Ad-shScr and Ad-shLrrc8a transduced HUVECs and immunoblot with LRRC8A, eNOS, Cav1, and GRB2 antibodies. Insulin stimulation: 100 nM insulin for 10 min. Densitometry values for GRB2 co-immunoprecipitated eNOS (eNOS/GRB2). Representative blots from three independent experiments. (C) Representative endogenous LRRC8A and eNOS immunofluorescence staining in Ad-shScr and Ad-shLrrc8a transduced HUVECs. Representative image from six independent experiments. (D–E) Quantification of LRRC8A (D, n = 6) and eNOS (E, n = 6) immunofluorescence staining upon LRRC8A knock-down (KD). Evidence of LRRC8A-eNOS co-localization (C, insets) in plasma membrane (i) and perinuclear regions (ii). Significance between the indicated groups is calculated using an unpaired two-tailed Student’s t-test. p-Values are indicated on figures. Data are shown as mean ± s.e.m. ***p<0.001.
-
Figure 3—source data 1
Source data for Figure 3D.
- https://cdn.elifesciences.org/articles/61313/elife-61313-fig3-data1-v2.xlsx
-
Figure 3—source data 2
Source data for Figure 3E.
- https://cdn.elifesciences.org/articles/61313/elife-61313-fig3-data2-v2.xlsx
Figure 3—figure supplement 1
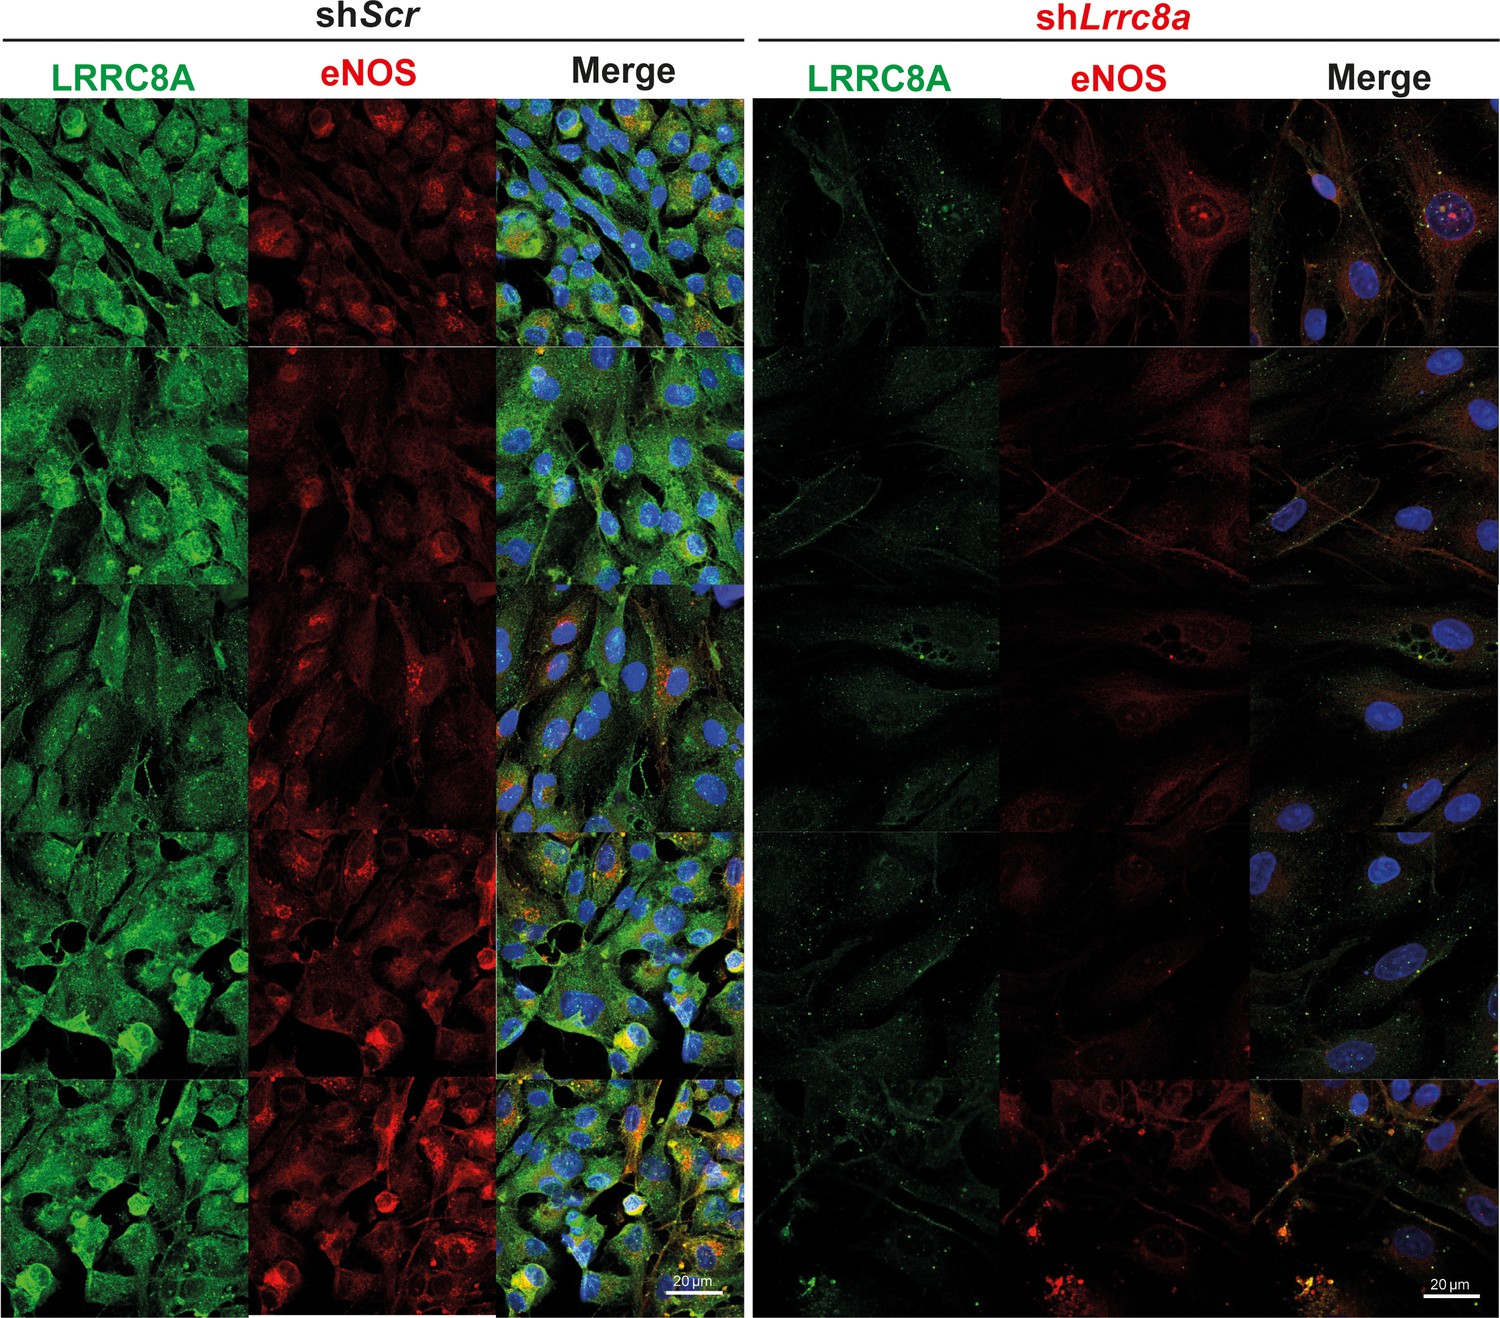
Leucine-rich repeat-containing protein 8a (LRRC8A) co-localizes with endothelial nitric oxide synthase (eNOS) and regulates eNOS expression.
LRRC8A (green) and eNOS (red) immunofluorescence staining of human umbilical vein endothelial cell (HUVEC) transduced with either Ad-shScr (left) or Ad-shLrrc8a (right). Scale bar is 20 µm. DAPI (blue) labels nuclei.
Figure 4
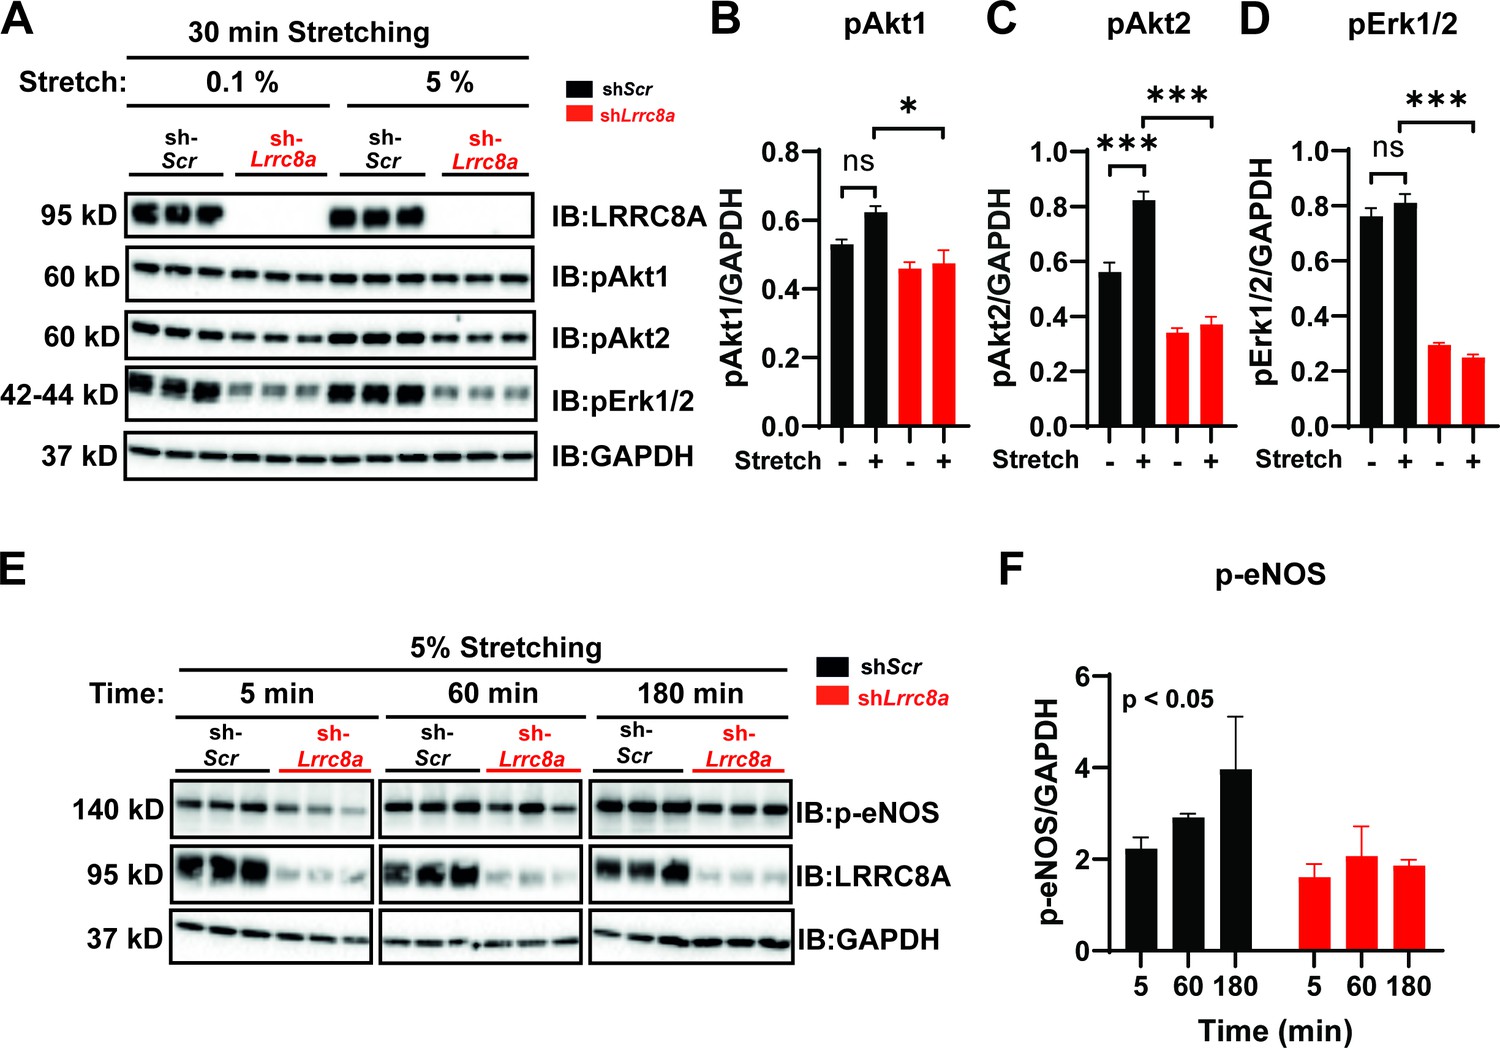
Leucine-rich repeat-containing protein 8a (LRRC8A) is required for intact stretch-induced AKT-endothelial nitric oxide synthase (eNOS) signaling.
(A) Western blot of LRRC8A, pAKT1, pAKT2, pERK1/2 in response to 30 min of 0.1% and 5% static stretch in Ad-shScr (n = 3) and Ad-shLrrc8a (n = 3) transduced human umbilical vein endothelial cells (HUVECs). GAPDH is used as a loading control. (B–D) Densitometry quantification from A of pAKT1 (B), pAKT2 (C), and pErk1/2 (D). (E) Western blot of peNOS, LRRC8A, in response to 5% static stretching for 5, 60, and 180 min in Ad-shScr (n = 3) and Ad-shLrrc8a (n = 3) transduced HUVECs. (F) Densitometry quantification from E of eNOS. GAPDH is used as a loading control. Statistical significance between the indicated group is calculated using one-way analysis of variance (ANOVA), Tukey's multiple comparisons test for (B–D), and two-way ANOVA for (F) with p-value in upper left corner. Data are shown as mean ± s.e.m. *p<0.05; **p<0.01; ***p<0.001.
-
Figure 4—source data 1
Source data for Figure 4F.
- https://cdn.elifesciences.org/articles/61313/elife-61313-fig4-data1-v2.xlsx
-
Figure 4—source data 2
Source data for Figure 4B,C, D.
- https://cdn.elifesciences.org/articles/61313/elife-61313-fig4-data2-v2.xlsx
Figure 5 with 5 supplements
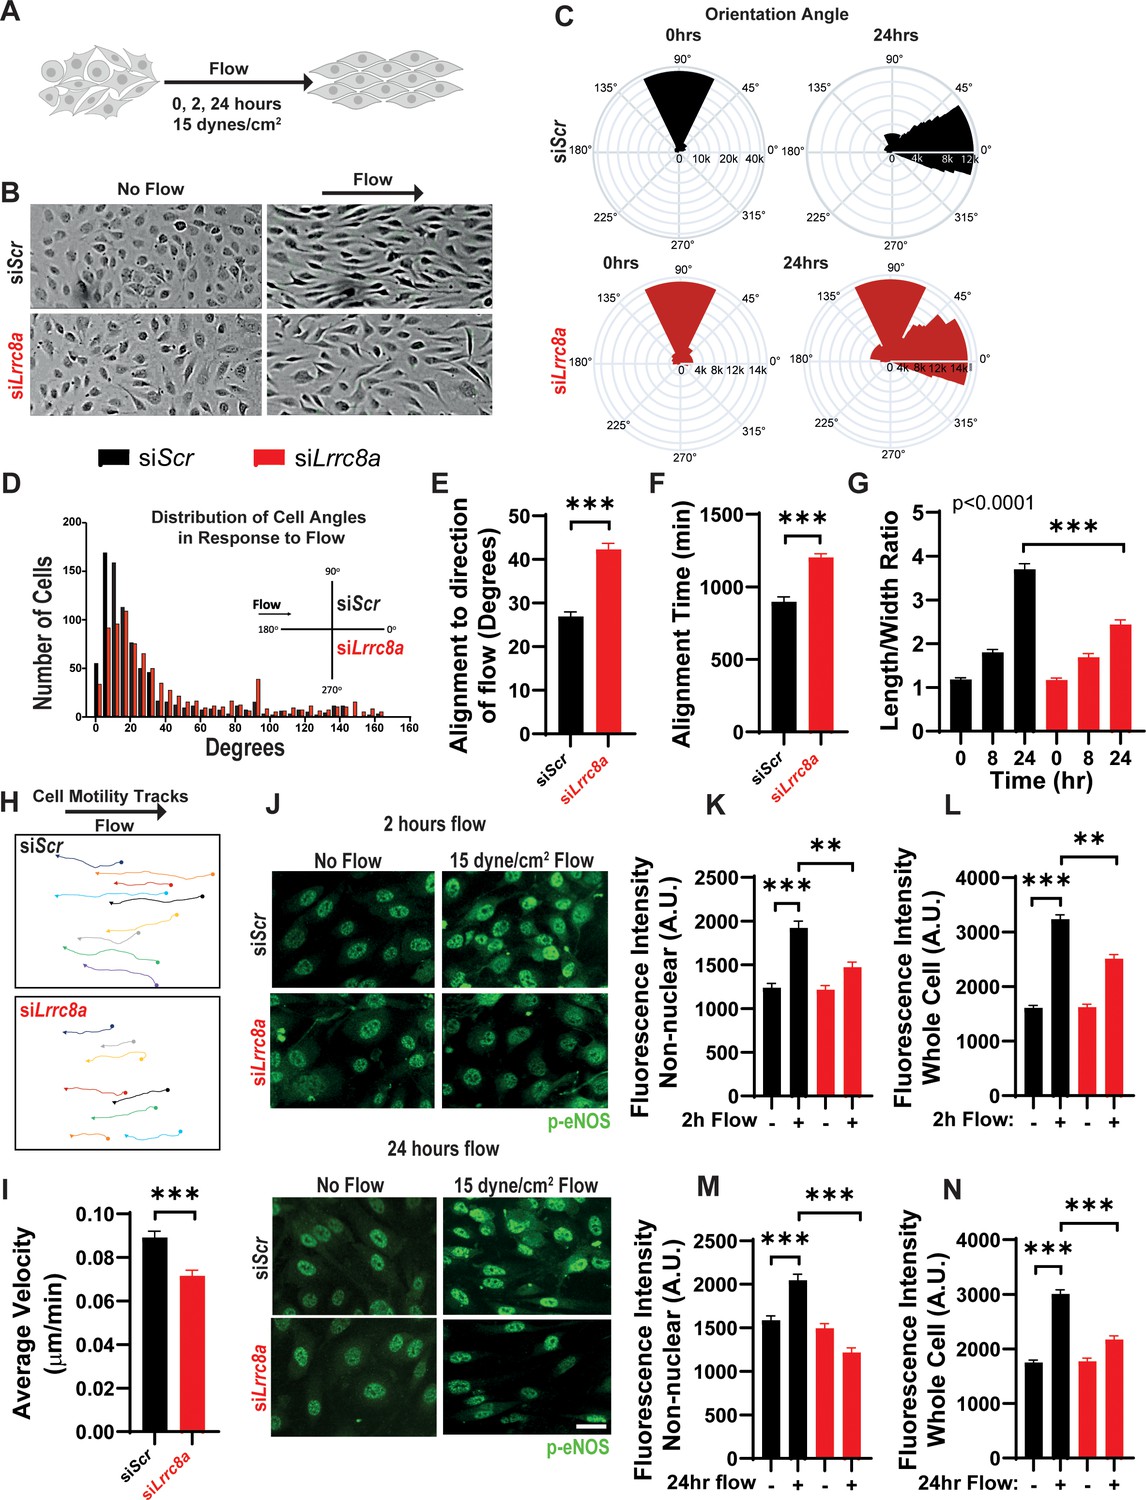
Leucine-rich repeat-containing protein 8a (LRRC8A) depletion impairs human umbilical vein endothelial cell (HUVEC) alignment to the direction of shear flow.
(A) Cartoon of depicting the laminar shear flow applied to HUVEC at 15 dyne/cm2 for 0, 2, and 24 hr. (B) Bright field image of HUVECs transfected with siScr (top) and siLrrc8a (bottom) with no flow (left) and after 24 hr of flow (right). (C) Distributions of angle of HUVEC orientation relative to the direction of flow at 0 hr and after 24 hr of laminar shear flow in siScr-treated cells (top, 0 hr: n = 800; 24 hr: n = 800) and siLrrc8a treated cells (bottom, 0 hr: n = 600; 24 hr: 800). Cuboidal or symmetrical cells at 0 hr were measured as 90o to the direction of flow. (D) Distributions of angle of HUVEC orientation relative to the direction of flow at 24 hr siScr (black, n = 803) and siLrrc8a treated cells (red, n = 803). (E) Mean alignment to direction of flow of siScr (black, n = 803) and siLrrc8a treated cells (red, n = 803). (F) Mean time required for HUVEC to align to within 20o of the direction of shear flow in siScr (black, n = 110) and siLrrc8a treated cells (red, n = 110). (G) Mean HUVEC length-width ratio over time upon stimulation with shear flow in siScr (black, n = 157) and siLrrc8a treated cells (red, n = 157). (H) Representative HUVEC real-time cell tracking during the 24 hr period of shear flow. Arrow heads represent the direction of travel against the direction of shear flow. (I) Average velocity calculated from the mean distance traveled over the 24 hr period of shear flow (nsiScr = 77; nsiLrrc8a = 78). (J) Representative phosphorylated endothelial nitric oxide synthase (p-eNOS) immunofluoresence (green) under conditions of no flow (n = 100), 2 hr (n = 100, top) and no flow (n = 110), 24 hr flow (n = 110, bottom). (K–L) Quantification of non-nuclear p-eNOS immunofluoresence (K) and whole-cell p-eNOS (L) under conditions of no flow (n = 100) and 2 hr flow (n = 100). (M–N) Quantification of non-nuclear p-eNOS immunofluoresence (M) and whole-cell p-eNOS (N) under conditions of no flow (n = 110) and 24 hr flow (n = 110). Statistical significance between the indicated values is calculated using a two-tailed Student’s t-test for (E), (F), and (I), using one-way analysis of variance (ANOVA), Tukey's multiple comparisons test for (K), (L), (M), and (N), and using two-way ANOVA with Bonferroni multiple comparison test in (G). In (G), p<0.001 for the time dependence of siScr versus siLrrc8a treated cells, and p<0.001 for the 24 hr timepoint. Error bars represent mean ± s.e.m. n = 3, independent experiments. **p<0.01 and ***p<0.001.
-
Figure 5—source data 1
Source data for Figure 5E.
- https://cdn.elifesciences.org/articles/61313/elife-61313-fig5-data1-v2.xlsx
-
Figure 5—source data 2
Source data for Figure 5F.
- https://cdn.elifesciences.org/articles/61313/elife-61313-fig5-data2-v2.xlsx
-
Figure 5—source data 3
Source data for Figure 5G.
- https://cdn.elifesciences.org/articles/61313/elife-61313-fig5-data3-v2.xlsx
-
Figure 5—source data 4
Source data for Figure 5I.
- https://cdn.elifesciences.org/articles/61313/elife-61313-fig5-data4-v2.xlsx
-
Figure 5—source data 5
Source data for Figure 5K.
- https://cdn.elifesciences.org/articles/61313/elife-61313-fig5-data5-v2.xlsx
-
Figure 5—source data 6
Source data for Figure 5L.
- https://cdn.elifesciences.org/articles/61313/elife-61313-fig5-data6-v2.xlsx
-
Figure 5—source data 7
Source data for Figure 5M.
- https://cdn.elifesciences.org/articles/61313/elife-61313-fig5-data7-v2.xlsx
-
Figure 5—source data 8
Source data for Figure 5N.
- https://cdn.elifesciences.org/articles/61313/elife-61313-fig5-data8-v2.xlsx
Figure 5—figure supplement 1
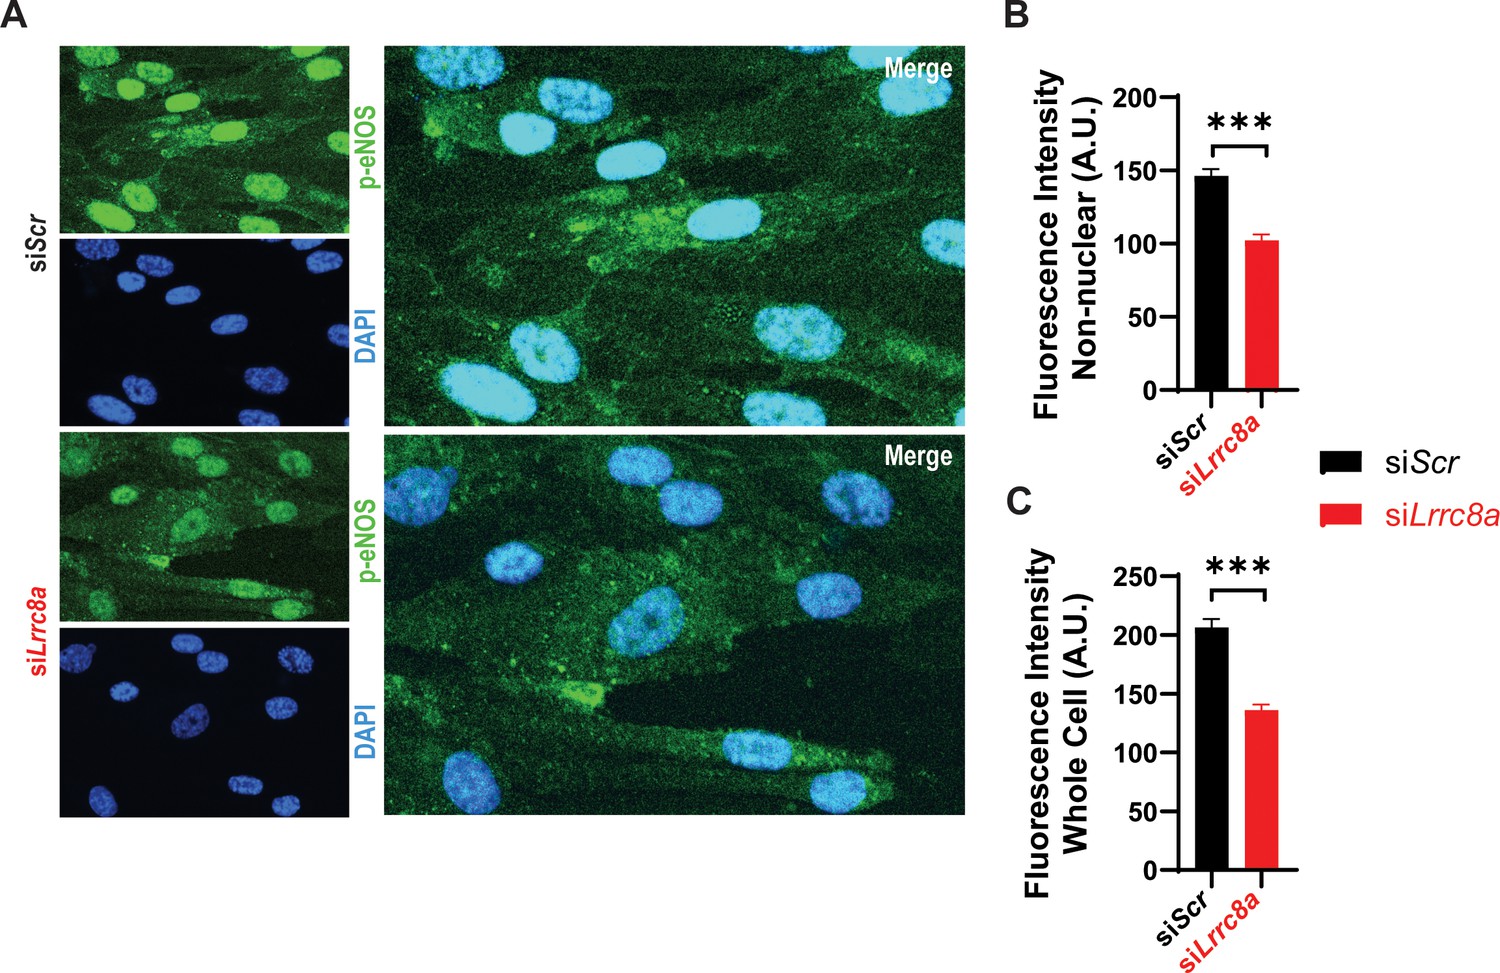
Leucine-rich repeat-containing protein 8a (LRRC8A) knock-down abrogates shear-flow stimulated phosphorylated endothelial nitric oxide synthase (p-eNOS) in human umbilical vein endothelial cells (HUVECs).
(A) Representative p-eNOS immunofluorescence image of siScr and siLrrc8a transfected HUVEC after 24 hr of shear-flow stimulation, using anti-p-eNOS antibody (Cat#9571, from Cell Signaling). (B-C) Quantification of p-eNOS immunofluorescence intensity from non-nuclear regions (B) and from the entire cell (C). Significance between the indicated groups was calculated using a two-tailed Student’s t-test. Error bars represent mean ± s.e.m. *p<0.05; **p<0.01; ***p<0.001.
-
Figure 5—figure supplement 1—source data 1
Source data for Figure 5—figure supplement 1B.
- https://cdn.elifesciences.org/articles/61313/elife-61313-fig5-figsupp1-data1-v2.xlsx
-
Figure 5—figure supplement 1—source data 2
Source data for Figure 5—figure supplement 1C.
- https://cdn.elifesciences.org/articles/61313/elife-61313-fig5-figsupp1-data2-v2.xlsx
Figure 5—video 1
Bright field time-lapse video of siScr transfected human umbilical vein endothelial cell (HUVEC) responding to shear flow (direction of flow from left to right) over a 24 hr period.
Figure 5—video 2
Bright field time-lapse video of siScr transfected human umbilical vein endothelial cell (HUVEC) responding to shear flow (direction of flow from left to right) over a 24 hr period.
Figure 5—video 3
Bright field time-lapse video of siLrrc8a transfected human umbilical vein endothelial cell (HUVEC) responding to shear flow (direction of flow from left to right) over a 24 hr period.
Figure 5—video 4
Bright field time-lapse video of siLrrc8a transfected human umbilical vein endothelial cell (HUVEC) responding to shear flow (direction of flow from left to right) over a 24 hr period.
Figure 6
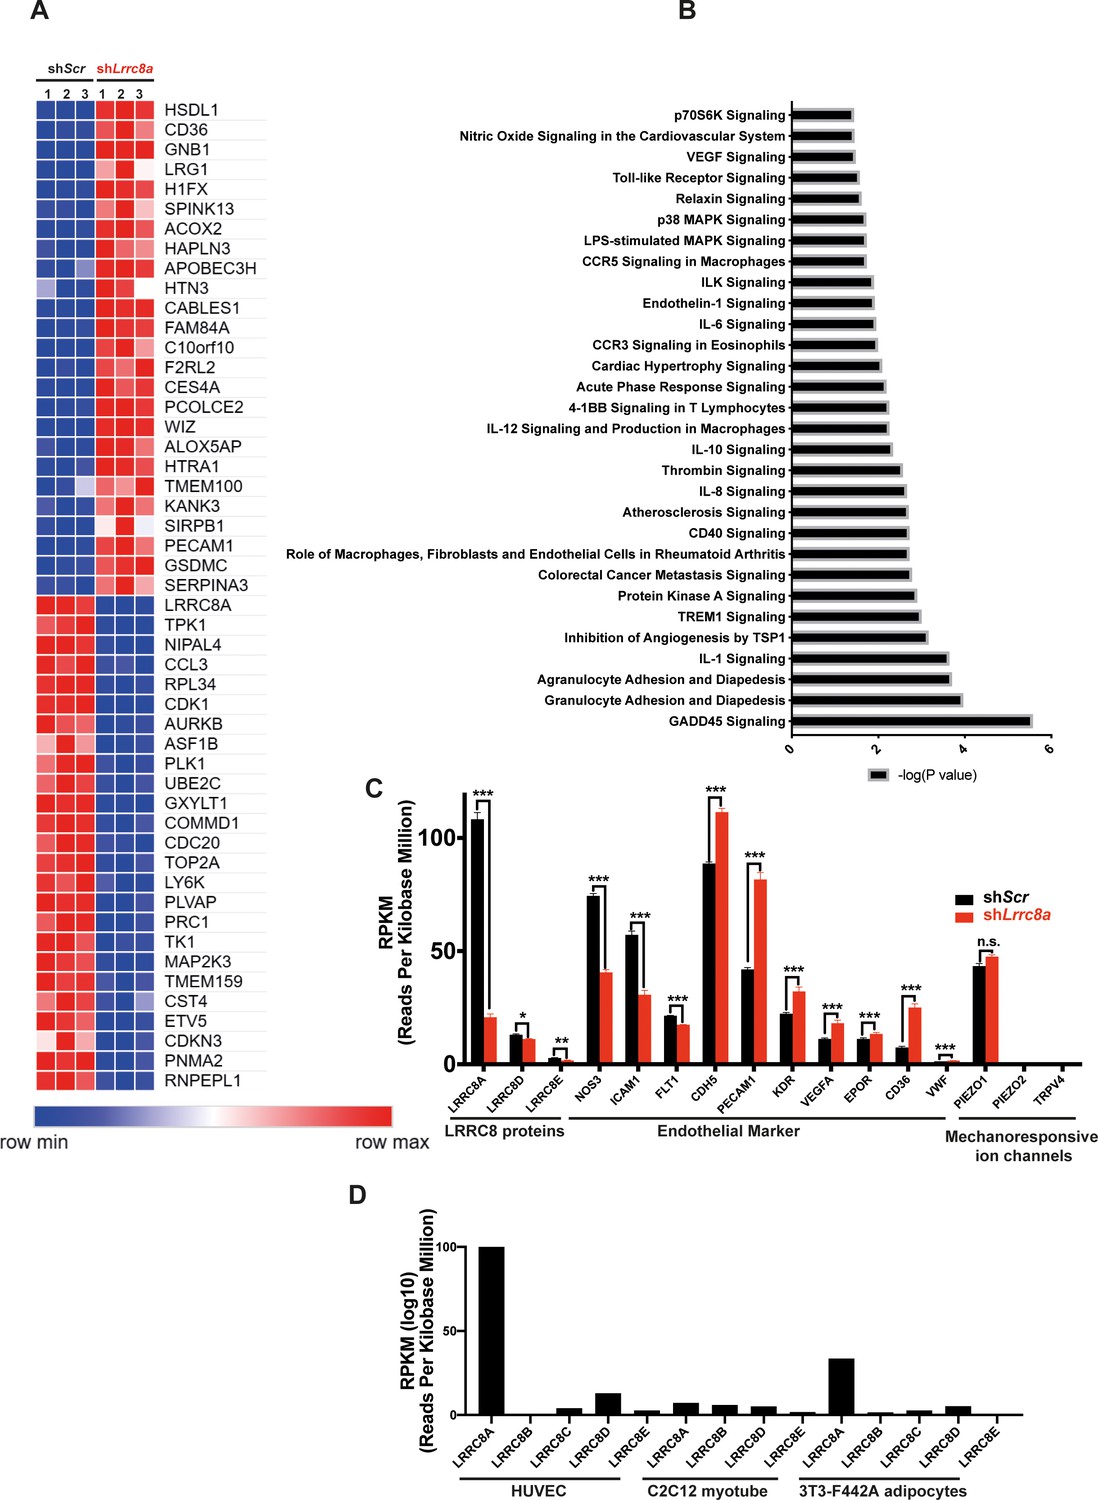
RNA sequencing of Ad-shScr and Ad-shLrrc8a transduced human umbilical vein endothelial cells (HUVECs).
(A) Heatmap analysis displaying top 25 upregulated or 25 downregulated genes between shScr and shLrrc8a. (B) IPA canonical pathway analysis of genes significantly regulated by shLrrc8a in comparison to shScr n = 3 for each group. For analysis with Ingenuity Pathway Analysis (IPA), Fragments Per Kilobase of transcripts per Million mapped reads (FPKM) cutoffs of 1.5, fold change of 1.5, and false discovery rate <0.05 were utilized for significantly differentially regulated genes. (C) Expression levels of select LRRC8 mRNA, classic endothelial markers, and mechanoresponsive ion channels in shScr and shLrrc8a-treated HUVECs. (D) Expression levels LRRC8a-e mRNA in HUVECs compared to data previously published from C2C12 myotubes (Kumar et al., 2020) and differentiated 3T3-F442A adipocytes (Zhang et al., 2017). For (C), statistical significance between the indicated values was calculated using an unpaired two-tailed Student’s t-test. Error bars represent mean ± s.e.m. n = 3, independent experiments. *p<0.05; **p<0.01; ***p<0.001.
-
Figure 6—source data 1
Source data for Figure 6C.
- https://cdn.elifesciences.org/articles/61313/elife-61313-fig6-data1-v2.xlsx
-
Figure 6—source data 2
Source data for Figure 6D.
- https://cdn.elifesciences.org/articles/61313/elife-61313-fig6-data2-v2.xlsx
Figure 7
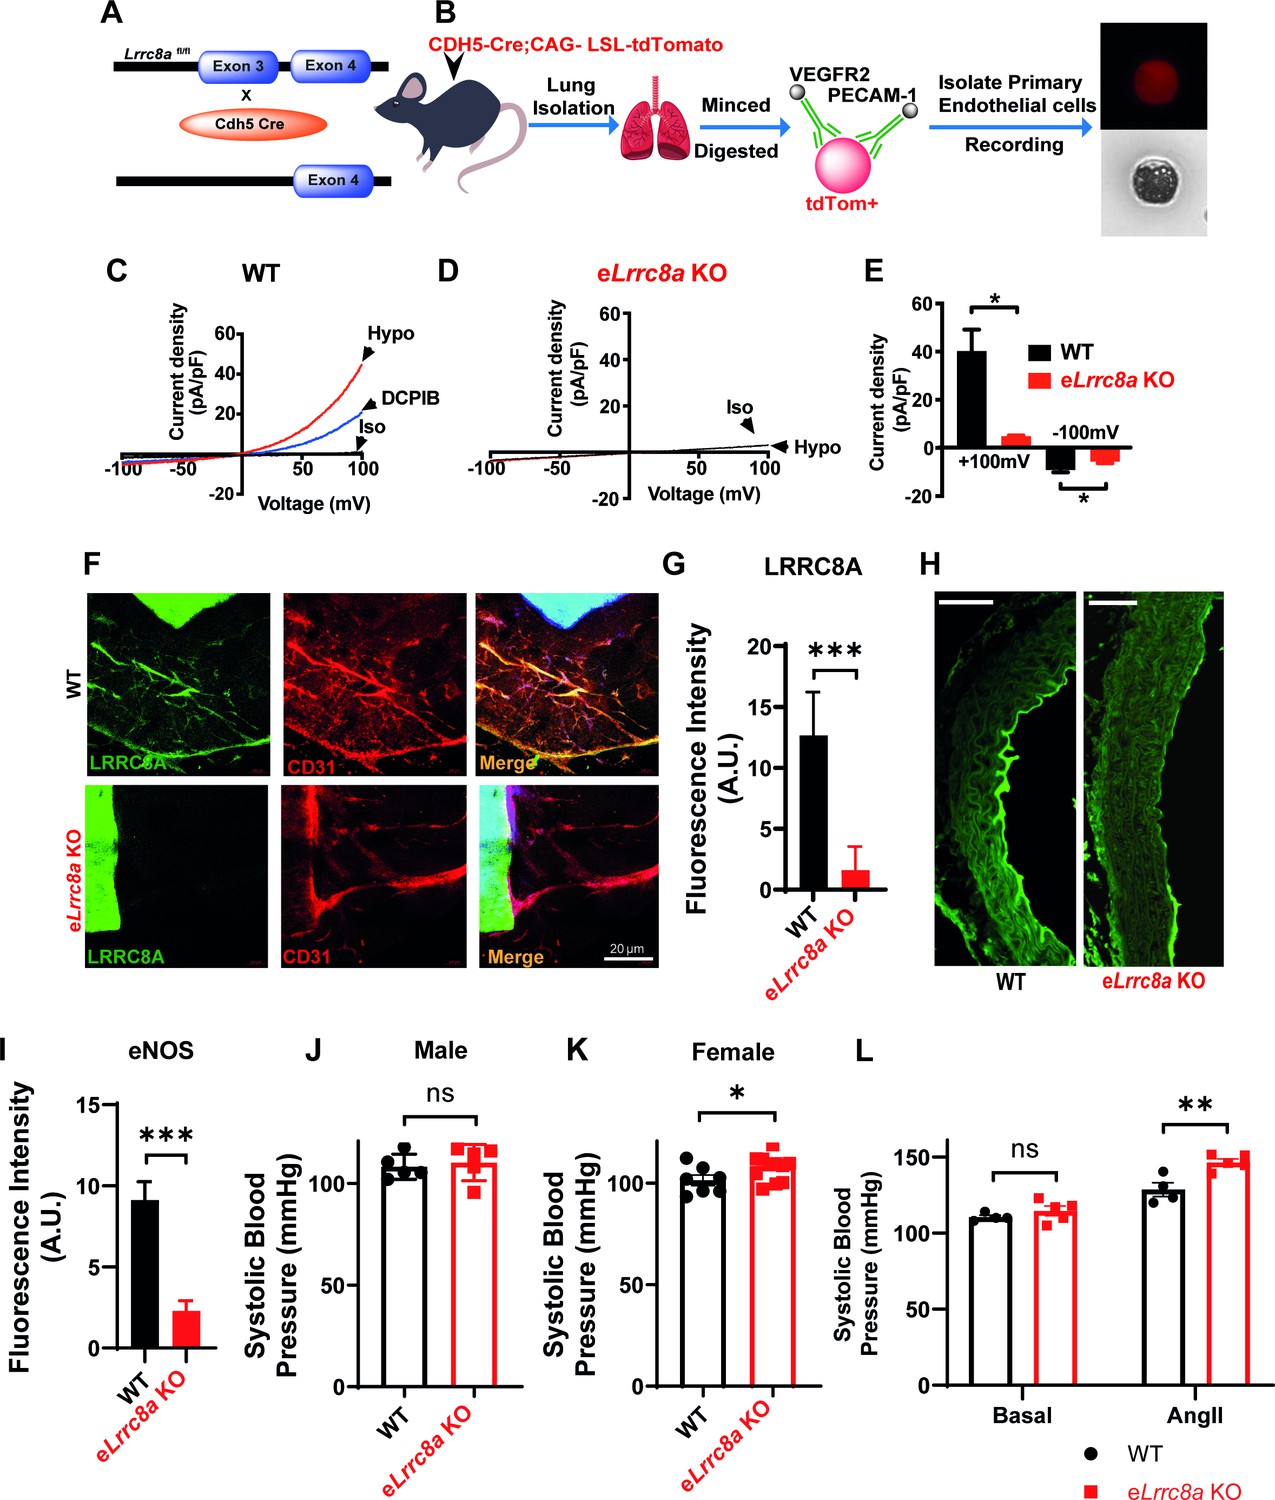
Endothelial-targeted Lrrc8a KO mice exhibit reduced phosphorylated endothelial nitric oxide synthase (p-eNOS) and mild angiotensin-II stimulated hypertension.
(A) Strategy for endothelium targeted Lrrc8a ablation to generate eLrrc8a KO. (B) Isolation of murine primary endothelial cells from WT and eLrrc8a KO using tdTomato reporter mice. (C–D) Current-voltage relationships of volume-regulatory anion channel (VRAC) current in isotonic (Iso, 300 mOsM) and hypotonic (Hypo, 210 mOsm) solution in response to voltage ramps from -100 to +100 mV over 500 ms in WT (C) and KO (D) primary murine endothelial cells. DCPIB (10 µM) inhibition in C (WT). (E) Mean outward (+100 mV) and inward (-100 mV) currents from WT (n = 3 cells) and eLrrc8a KO (n = 3 cells). (F) Ex vivo aorta sprouting assay performed in aortic rings isolated from WT and eLrrc8a KO mice and cultured in FGM media for 3 days at 37°C. Immunofluorescence staining with antibodies to LRRC8A (green), CD31 (red), LRRC8A+CD31+ (Merge) demonstrating endothelial-targeted Lrrc8a deletion. (G) Quantification of LRRC8A immunofluorescence staining in WT (n = 15) and eLrrc8a KO (n = 15) endothelial cell tubes. (H–I) Representative images of aortic sections from WT (n = 3) and eLrrc8a KO (n = 3) mice immunostained with p-eNOS (H, green), and immunofluorescence quantification of regions of WT (n = 5) and eLrrc8a KO (n = 5) endothelium (I). Scale bar in (H) is 50 μm. (J–L) Tail-cuff systolic blood pressures of male (J) and female (K) WT (n = 5 males and 7 females) and eLrrc8a KO (n = 5 males and 12 females) mice, and systolic blood pressures of male WT (n = 4) and eLrrc8a KO (n = 5) mice under basal conditions and after 4 weeks of chronic angiotensin-II infusion (L). Statistical significance between the indicated values is calculated using a two-tailed unpaired Student’s t-test. Error bars represent mean ± s.e.m. *p<0.05; **p<0.01; ***p<0.001.
-
Figure 7—source data 1
Source data for Figure 7E.
- https://cdn.elifesciences.org/articles/61313/elife-61313-fig7-data1-v2.xlsx
-
Figure 7—source data 2
Source data for Figure 7I.
- https://cdn.elifesciences.org/articles/61313/elife-61313-fig7-data2-v2.xlsx
-
Figure 7—source data 3
Source data for Figure 7J.
- https://cdn.elifesciences.org/articles/61313/elife-61313-fig7-data3-v2.xlsx
-
Figure 7—source data 4
Source data for Figure 7K.
- https://cdn.elifesciences.org/articles/61313/elife-61313-fig7-data4-v2.xlsx
-
Figure 7—source data 5
Source data for Figure 7l.
- https://cdn.elifesciences.org/articles/61313/elife-61313-fig7-data5-v2.xlsx
Figure 8 with 5 supplements
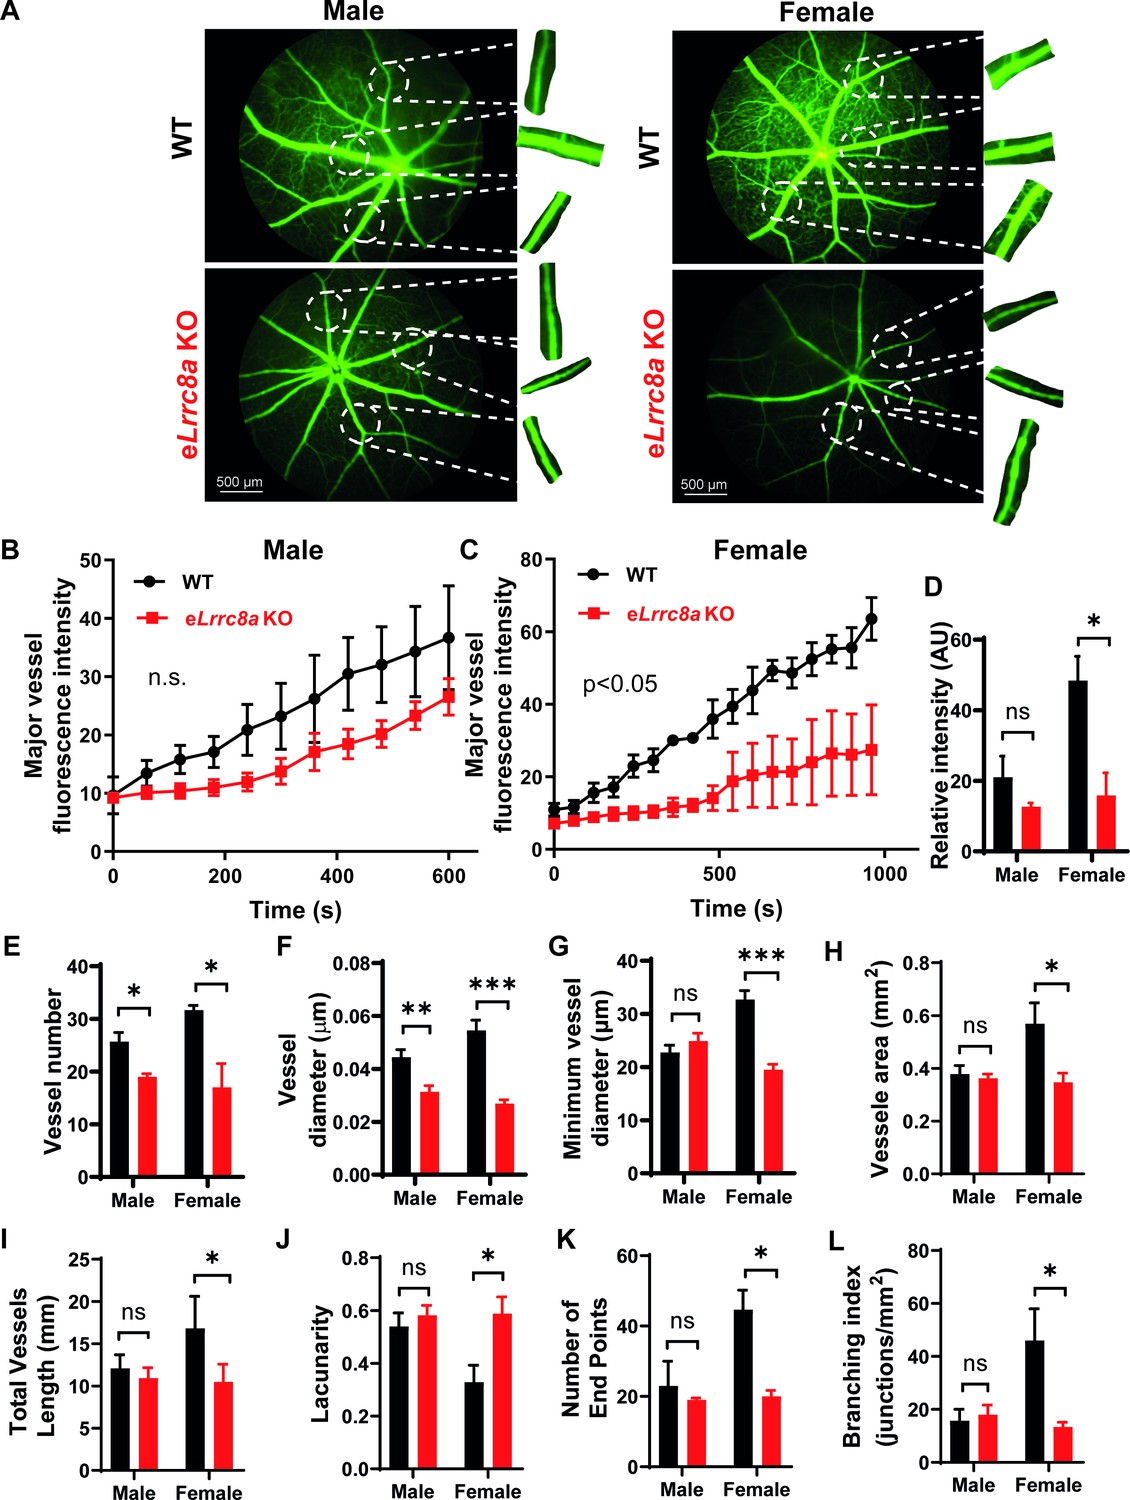
Endothelium-specific Lrrc8a KO mice exhibit exacerbated impairments retinal microvascular disease in the setting of type 2 diabetes.
(A) Representative fluorescein retinal angiograms of WT (top) and eLrrc8a KO (bottom) male (left) and female (right) mice raised on a high-fat high-sucrose (HFHS) diet. Inset shows magnified view of retinal vessels. Quantification of major vessel fluorescence intensity over time after intraperitoneal (i.p.) fluorescein injection in (B) male (n = 3) and (C) female (n = 3) WT and eLrrc8a KO mice. (D–K) Quantification of total retinal vessel intensity (D), total vessel number (E), vessel diameter (F), minimum vessel diameter (G), vessel area (H), total vessel length (I), lacunarity (J), number of end points (K), and branching index (L) of retinal vessels in WT and eLrrc8a KO mice. Statistical significance between the indicated values for B and C was calculated using two-way analysis of variance (ANOVA) and (D–L) using a two-tailed unpaired Student’s t-test. Error bars represent mean ± s.e.m. *p<0.05; **p<0.01; ***p<0.001.
-
Figure 8—source data 1
Source data for Figure 8B.
- https://cdn.elifesciences.org/articles/61313/elife-61313-fig8-data1-v2.xlsx
-
Figure 8—source data 2
Source data for Figure 8C.
- https://cdn.elifesciences.org/articles/61313/elife-61313-fig8-data2-v2.xlsx
-
Figure 8—source data 3
Source data for Figure 8D.
- https://cdn.elifesciences.org/articles/61313/elife-61313-fig8-data3-v2.xlsx
-
Figure 8—source data 4
Source data for Figure 8E.
- https://cdn.elifesciences.org/articles/61313/elife-61313-fig8-data4-v2.xlsx
-
Figure 8—source data 5
Source data for Figure 8F.
- https://cdn.elifesciences.org/articles/61313/elife-61313-fig8-data5-v2.xlsx
-
Figure 8—source data 6
Source data for Figure 8G.
- https://cdn.elifesciences.org/articles/61313/elife-61313-fig8-data6-v2.xlsx
-
Figure 8—source data 7
Source data for Figure 8H.
- https://cdn.elifesciences.org/articles/61313/elife-61313-fig8-data7-v2.xlsx
-
Figure 8—source data 8
Source data for Figure 8I.
- https://cdn.elifesciences.org/articles/61313/elife-61313-fig8-data8-v2.xlsx
-
Figure 8—source data 9
Source data for Figure 8J.
- https://cdn.elifesciences.org/articles/61313/elife-61313-fig8-data9-v2.xlsx
-
Figure 8—source data 10
Source data for Figure 8K.
- https://cdn.elifesciences.org/articles/61313/elife-61313-fig8-data10-v2.xlsx
-
Figure 8—source data 11
Source data for Figure 8L.
- https://cdn.elifesciences.org/articles/61313/elife-61313-fig8-data11-v2.xlsx
Figure 8—figure supplement 1
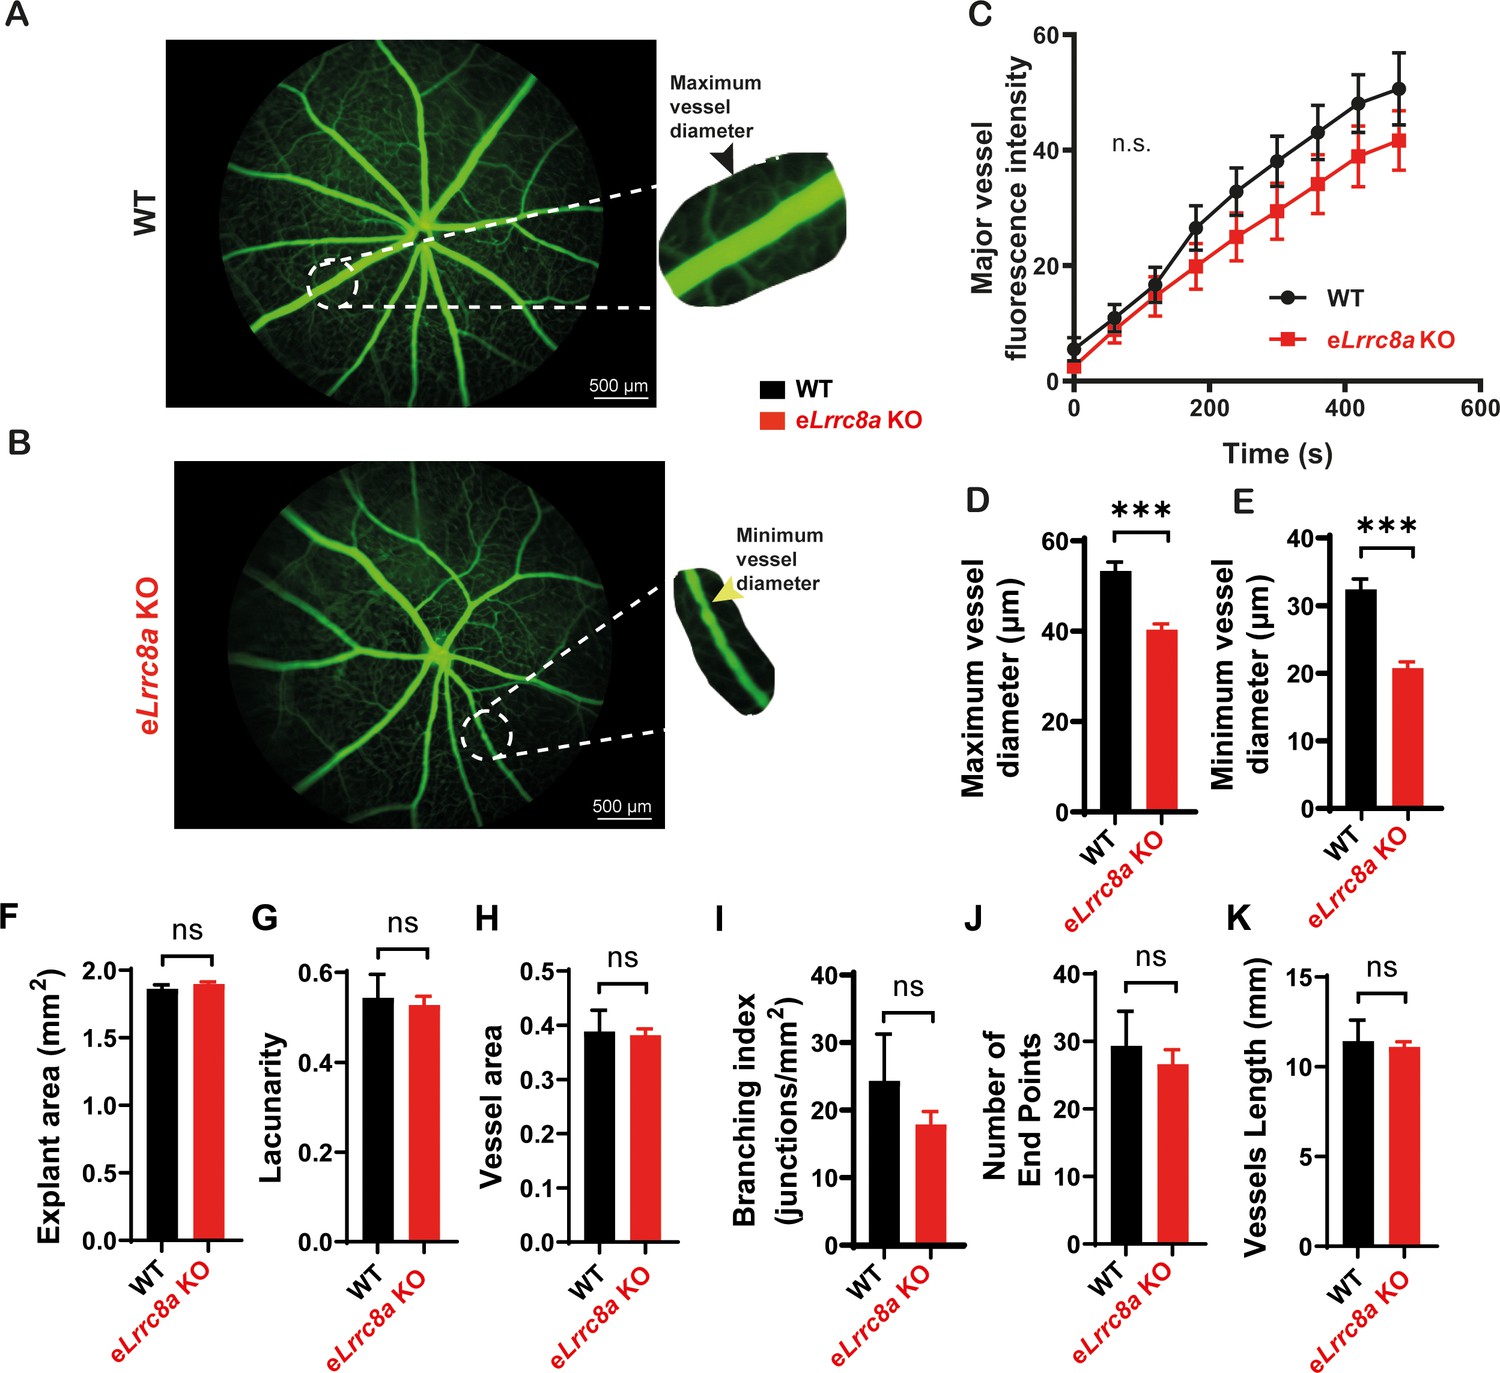
Endothelium-specific Lrrc8a KO mice exhibit mild retinal microvascular disease at baseline.
Representative fluorescein retinal angiograms of 13 week old WT (A) and eLrrc8a KO (B) mice raised on a regular diet. Inset shows magnified view of retinal vessels. (C–E) Quantification of major vessel fluorescence intensity over time after intraperitoenal (i.p.) fluorescein injection (C), maximum vessel diameter (D), and minimum vessel diameter (E) in WT (n = 11 mice) and eLrrc8a KO (n = 11 mice). (F–K) Quantification of explant area (F), lacunarity (G), vessel area (H), branching index (I), number of end points (J), and vessel length (K) in WT and eLrrc8a KO mice. Significance between the indicated groups was calculated using a two-way analysis of variance (ANOVA) in (C) and a two-tailed Student’s t-test in (D–K). Error bars represent mean ± s.e.m. ***p<0.001. Scale bar is 500 µm.
-
Figure 8—figure supplement 1—source data 1
Source data for Figure 8—figure supplement 1C.
- https://cdn.elifesciences.org/articles/61313/elife-61313-fig8-figsupp1-data1-v2.xlsx
-
Figure 8—figure supplement 1—source data 2
Source data for Figure 8—figure supplement 1D.
- https://cdn.elifesciences.org/articles/61313/elife-61313-fig8-figsupp1-data2-v2.xlsx
-
Figure 8—figure supplement 1—source data 3
Source data for Figure 8—figure supplement 1E.
- https://cdn.elifesciences.org/articles/61313/elife-61313-fig8-figsupp1-data3-v2.xlsx
-
Figure 8—figure supplement 1—source data 4
Source data for Figure 8—figure supplement 1F.
- https://cdn.elifesciences.org/articles/61313/elife-61313-fig8-figsupp1-data4-v2.xlsx
-
Figure 8—figure supplement 1—source data 5
Source data for Figure 8—figure supplement 1G.
- https://cdn.elifesciences.org/articles/61313/elife-61313-fig8-figsupp1-data5-v2.xlsx
-
Figure 8—figure supplement 1—source data 6
Source data for Figure 8—figure supplement 1H.
- https://cdn.elifesciences.org/articles/61313/elife-61313-fig8-figsupp1-data6-v2.xlsx
-
Figure 8—figure supplement 1—source data 7
Source data for Figure 8—figure supplement 1I.
- https://cdn.elifesciences.org/articles/61313/elife-61313-fig8-figsupp1-data7-v2.xlsx
-
Figure 8—figure supplement 1—source data 8
Source data for Figure 8—figure supplement 1J.
- https://cdn.elifesciences.org/articles/61313/elife-61313-fig8-figsupp1-data8-v2.xlsx
-
Figure 8—figure supplement 1—source data 9
Source data for Figure 8—figure supplement 1K.
- https://cdn.elifesciences.org/articles/61313/elife-61313-fig8-figsupp1-data9-v2.xlsx
Figure 8—figure supplement 2
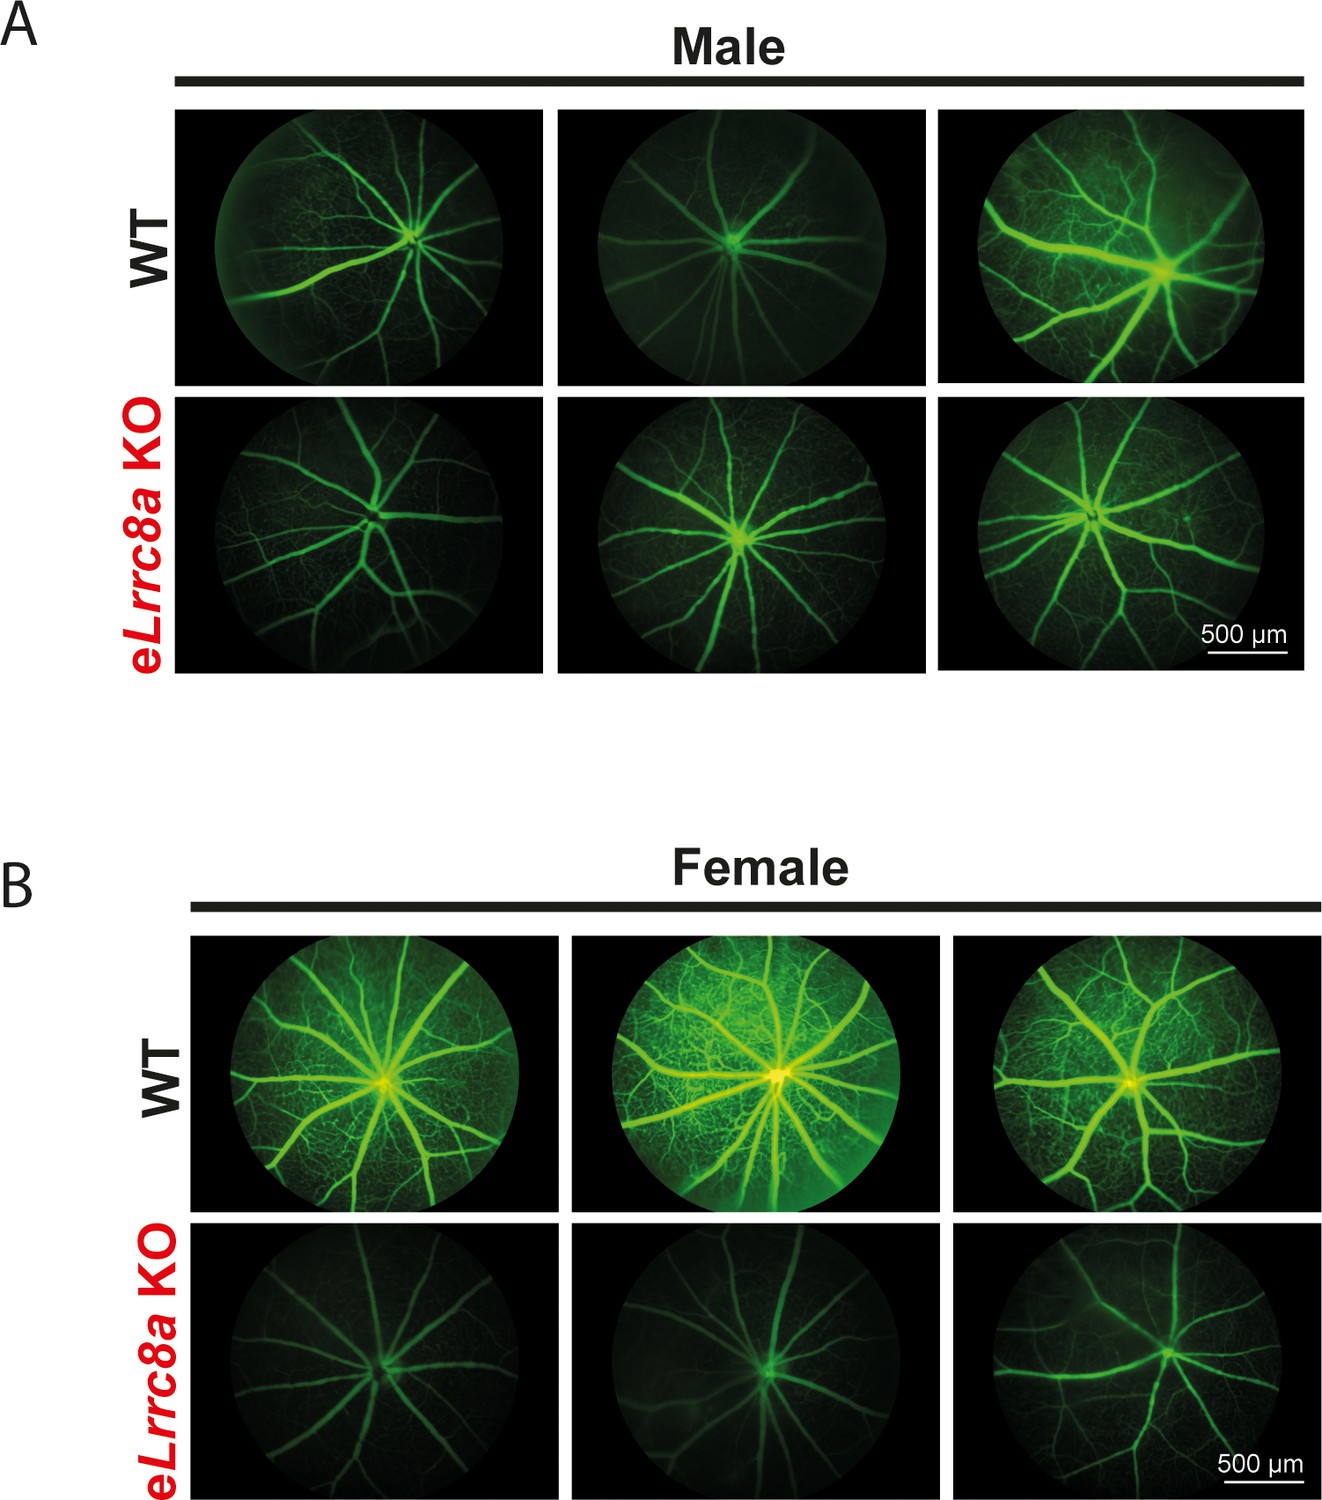
Endothelium-specific Lrrc8a KO mice exhibit exacerbated impairments retinal microvascular disease in the setting of type 2 diabetes.
Three representative fluorescein retinal angiograms of WT and eLrrc8a KO from male (A) and female (B) mice raised on a high-fat high-sucrose (HFHS) diet for 10 months. Scale bar is 500 µm.
Figure 8—figure supplement 3

Glucose tolerance (GTT) and insulin tolerance (ITT) are not altered in endothelium-specific Lrrc8a KO mice (n = 13) compared to WT mice (n = 8) raised on a high-fat high-sucrose diet for 10 months.
Significance between the indicated groups was calculated using a two-way analysis of variance (ANOVA).
-
Figure 8—figure supplement 3—source data 1
Source data for Figure 8—figure supplement 3.
- https://cdn.elifesciences.org/articles/61313/elife-61313-fig8-figsupp3-data1-v2.xlsx
Figure 8—figure supplement 4
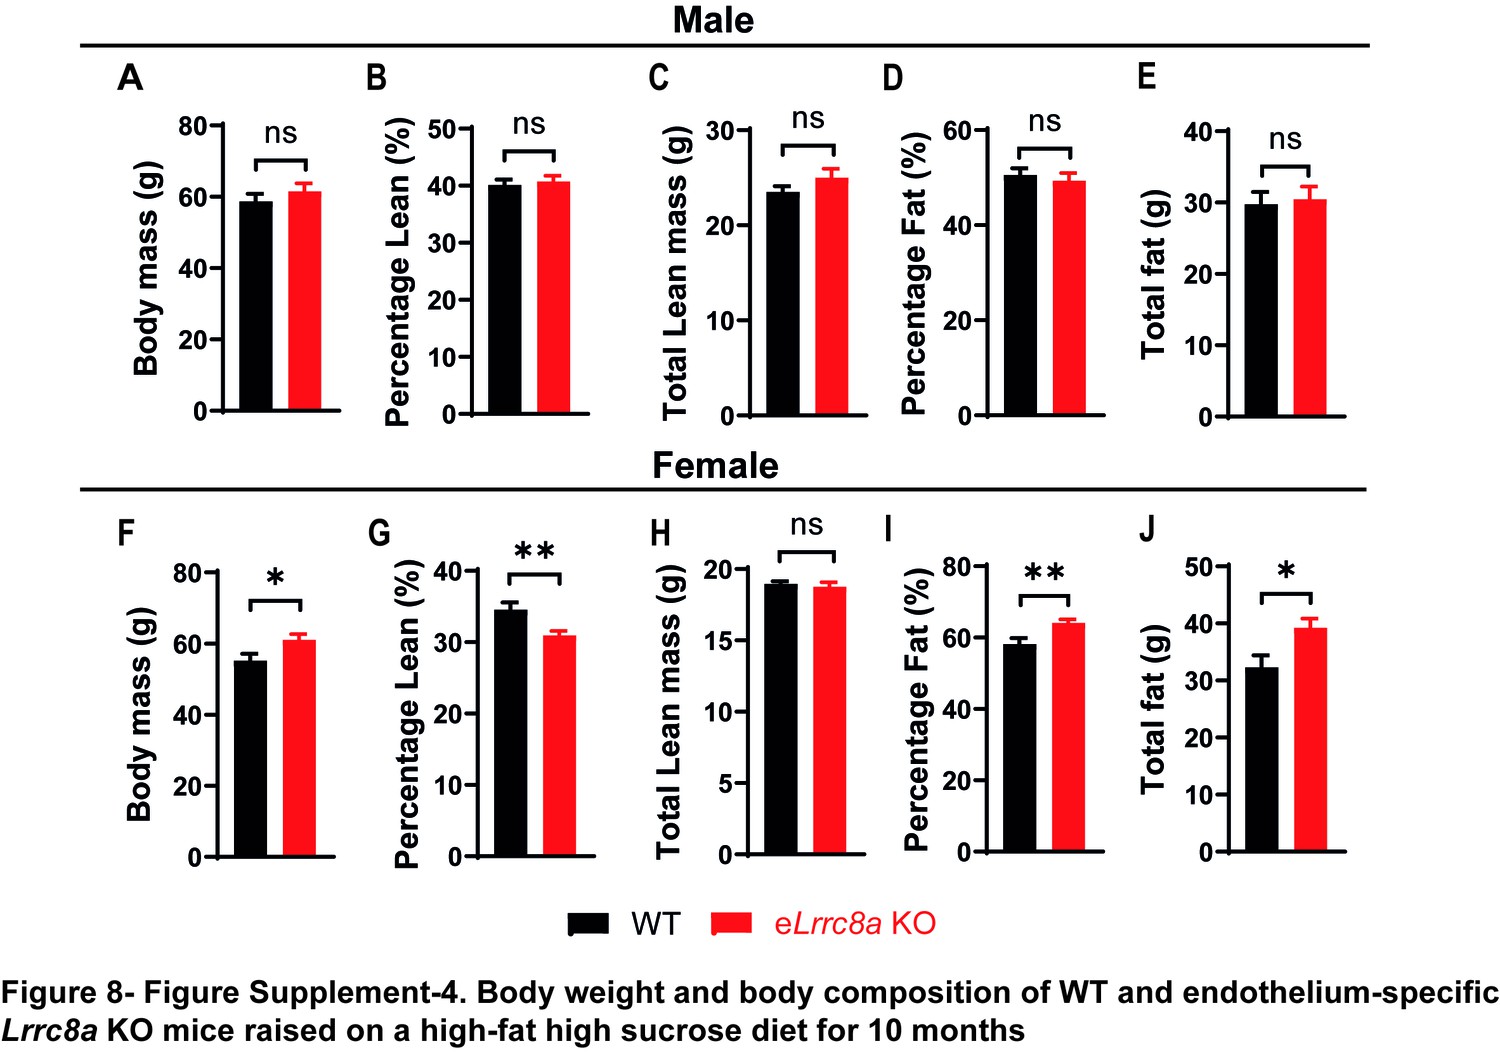
Body weight and body composition of WT and endothelium-specific Lrrc8a KO mice raised on a high-fat high-sucrose diet for 10 months.
(A–E) Male WT (n = 6) and eLrrc8a KO (n = 7) mice body weight (A), %Lean mass (B), total lean mass (C), %Fat mass (D), total fat mass (E). (F–J) Female WT (n = 7) and eLRRC8A KO (n = 13) mice body weight (F), %Lean mass (G), total lean mass (H), %Fat mass (I), total fat mass (J). Significance between the indicated groups was calculated using a two-tailed Student’s t-test. Error bars represent mean ± s.e.m. *p<0.05; **p<0.01.
-
Figure 8—figure supplement 4—source data 1
Source data for Figure 8—figure supplement 4.
- https://cdn.elifesciences.org/articles/61313/elife-61313-fig8-figsupp4-data1-v2.xlsx
Figure 8—video 1
Retinal angiograms of WT (left) and eLrrc8a KO (right) upon fluorescein injection intraperitoneally.
Tables
Key resources table
| Reagent type (species) or resource | Designation | Source or reference | Identifiers | Additional information |
|---|---|---|---|---|
| Genetic reagent (Mus musculus) | eLrrc8a KO (Lrrc8afl/fl) | This paper | Sah lab | SWELL1 is a regulator of adipocyte size, insulin signaling, and glucose homeostasis (Zhang et al., 2017) |
| Strain, strain background (Mus musculus) | CDH5-Cre | Gift from Dr. Kaikobad Irani | Vikram, A, Nature Communications 2016 | |
| Strain, strain background (Mus musculus) | Rosa26-tdTomato | Jackson lab | Jax 007914 RRID:IMSR_JAX:007914 | |
| Other | HUVECs | ATCC | Cat#CRL-2922 RRID:CVCL_3901 | Human primary cells |
| Biological sample (Mus musculus) | Endothelial primary cell | Lrrc8afl/fl | Freshly isolated from Lrrc8afl/fl mice | |
| Antibody | Anti-ß-actin (rabbit monoclonal) | Cell Signaling | Cat#8457s, RRID:AB_10950489 | WB (1:2000) |
| Antibody | Anti-total Akt (rabbit monoclonal) | Cell Signaling | Cat#4685s, RRID:AB_2225340 | WB (1:1000) |
| Antibody | Anti-Akt1 (rabbit monoclonal) | Cell Signaling | Cat#2938s, RRID:AB_915788 | WB (1:1000) |
| Antibody | Anti-p-eNOS (rabbit monoclonal) | Cell Signaling | Cat#9571, RRID:AB_329837 | WB (1:1000) IF (1:200) |
| Antibody | Anti-p-eNOS (rabbit polyclonal) | Invitrogen | Cat#PA5-104858, RRID: AB_2816331 | IF (1:200) |
| Antibody | Anti-Akt2 (rabbit monoclonal) | Cell Signaling | Cat#3063s, RRID:AB_2225186 | WB (1:1000) |
| Antibody | Anti-p-AS160 (rabbit polyclonal) | Cell Signaling | Cat#4288s, RRID:AB_10545274 | WB (1:1000) |
| Antibody | Anti-total eNOS (rabbit polyclonal) | Cell Signaling | Cat#32027, RRID:AB_2728756 | WB (1:1000) |
| Antibody | Anti-PECAM (rabbit monoclonal) | Sigma | Cat#SAB4502167 RRID:AB_10762600 | WB (1:1000) |
| Antibody | Anti-VEGFR2 (goat polyclonal) | R and D Systems | Cat#BAF357 RRID:AB_356414 | WB (1:1000) |
| Antibody | Anti- pS6 ribosomal (rabbit monoclonal) | Cell Signaling | Cat#5364s, RRID:AB_10694233 | WB (1:2000) |
| Antibody | Anti- GAPDH (rabbit monoclonal) | Cell Signaling | Cat#5174s, RRID:AB_1062202 | WB (1:2000) |
| Antibody | Anti-pErk1/2 (rabbit polyclonal) | Cell Signaling | Cat#9101s, RRID:AB_331772 | WB (1:1000) |
| Antibody | Anti-Total Erk1/2 (rabbit polyclonal) | Cell Signaling | Cat#9102s, RRID:AB_330744 | WB (1:1000) |
| Antibody | Anti-Grb2 (mouse monoclonal) | BD | Cat#610111s, RRID:AB_397517 | WB (1:1000) |
| Antibody | Anti-Grb2 (rabbit monoclonal) | Santa Cruz | Cat#sc-255, RRID:AB_631602 | WB (1:1000) |
| Antibody | Anti-LRRC8A (rabbit polyclonal) | Pacific antibodies | Custom made | Epitope: QRTKSRIEQGIVDRSE, WB (1:1000), LRRC8A is a glucose sensor regulating ß-cell excitability and systemic glycemia (Kang et al., 2018) |
| Antibody | Anti-CD31 (rabbit polyclonal) | Thermo Fisher | Cat#MA3105, RRID:AB_223592 | IF (1:100) |
| Antibody | Anti-IgG (normal mouse IgG) | Santa Cruz | Cat#sc-2027, RRID:AB_737197 | WB (1:1000) |
| Antibody | Anti-rabbit-HRP | BioRad | Cat#170–6515, RRID:AB_11125142 | WB (1:10,000) |
| Antibody | Anti-mouse-HRP | BioRad | Cat#170–5047, RRID:AB_11125753 | WB (1:10,000) |
| Transfected construct (human) | siLrrc8a | Invitrogen | Cat#4392420 | Assay ID: s32107 Transfected construct human |
| Transfected construct (human) | Non-targeting control | Invitrogen | Cat#4390846 | Transfected construct human |
| Transfected construct (human) | siPORTamine | Invitrogen | Cat#AM4503 | |
| Transfected construct (human) | Opti-MEM | Invitrogen | Cat#11058–021 | |
| Recombinant DNA reagent | Ad5-U6-hLrrc8a-shRNA-mCherry | Vector biolabs | shADV- 653 214592 | |
| Recombinant DNA reagent | Ad5-U6-Scr-shRNA-mCherry | Vector biolabs | 3086 | |
| Commercial assay or kit | RNA isolation (PureLink RNA mini kit) | Invitrogen | 12183018A | |
| Software, algorithm | GraphPad Prism8 | La Jolla California USA, http://www.graphpad.com’ RRID:SCR_002798 | ||
| Software, algorithm | Fiji, ImageJ | Schindelin et al., 2012 (PMID:22743772) | RRID:SCR_002285 | |
| Other | DAPI stain | Thermofisher | Cat#T3605 | 1:10,000 |
Additional files
-
Supplementary file 1
RNA sequencing data of human umbilical vein endothelial cell (HUVEC) treated with Ad-shScr and Ad-shLrrc8a.
- https://cdn.elifesciences.org/articles/61313/elife-61313-supp1-v2.xlsx
-
Supplementary file 2
Ingenuity pathway analysis.
- https://cdn.elifesciences.org/articles/61313/elife-61313-supp2-v2.xls
-
Transparent reporting form
- https://cdn.elifesciences.org/articles/61313/elife-61313-transrepform-v2.pdf
Download links
A two-part list of links to download the article, or parts of the article, in various formats.
Downloads (link to download the article as PDF)
Open citations (links to open the citations from this article in various online reference manager services)
Cite this article (links to download the citations from this article in formats compatible with various reference manager tools)
The SWELL1-LRRC8 complex regulates endothelial AKT-eNOS signaling and vascular function
eLife 10:e61313.
https://doi.org/10.7554/eLife.61313


