DrosophilaSSS p53 isoforms have overlapping and distinct functions in germline genome integrity and oocyte quality control
- Department of Biology, Indiana University, United States
Figures
Figure 1 with 2 supplements

The p53B protein isoform is expressed in the germline where it colocalizes with p53A in nuclear bodies.
(A) Drosophila p53 mRNA and protein isoforms. Left: The four p53 mRNA isoforms with introns as lines, translated regions of exons as orange boxes, and 5’ and 3’ untranslated regions as black boxes. Right: The p53 protein isoforms encoded by those four mRNA isoforms. Numbers indicate amino acid coordinates of transactivation domain (TAD) (green), DNA-binding domain (black) and oligomerization domain (white). p53A and p53C mRNAs encode the same protein. (B) Drosophila oogenesis: One ovariole with germarium at anterior (left) and egg chambers migrating posteriorly (to right) as they mature. Arrows indicate germline nurse cells and oocyte and epithelium of somatic follicle cells (pink) in one egg. (C-D’) Immunofluorescent detection of GFP-p53A (C, C’) or mCh-p53B (D, D’) expression in stage seven egg chambers, with DNA counterstained with DAPI (blue). Follicle cells (red arrow), nurse cells (white arrow), oocyte (blue arrow). Scale bar 10 μm (E-E”) Colocalization of GFP-p53A and mCh-p53B in subnuclear foci of nurse cells. Scale bars 5μm. (F) Quantification of GFP-p53A and mCh-p53B fluorescence along the 6 μm line shown in E”. (G-G”) Colocalization of GFP-p53A and mCh-p53B in subnuclear foci of an oocyte. Scale bars 1 μm. (H) Quantification of GFP-p53A and mCh-p53B fluorescence along the 6 μm line shown in G”.
Figure 1—figure supplement 1
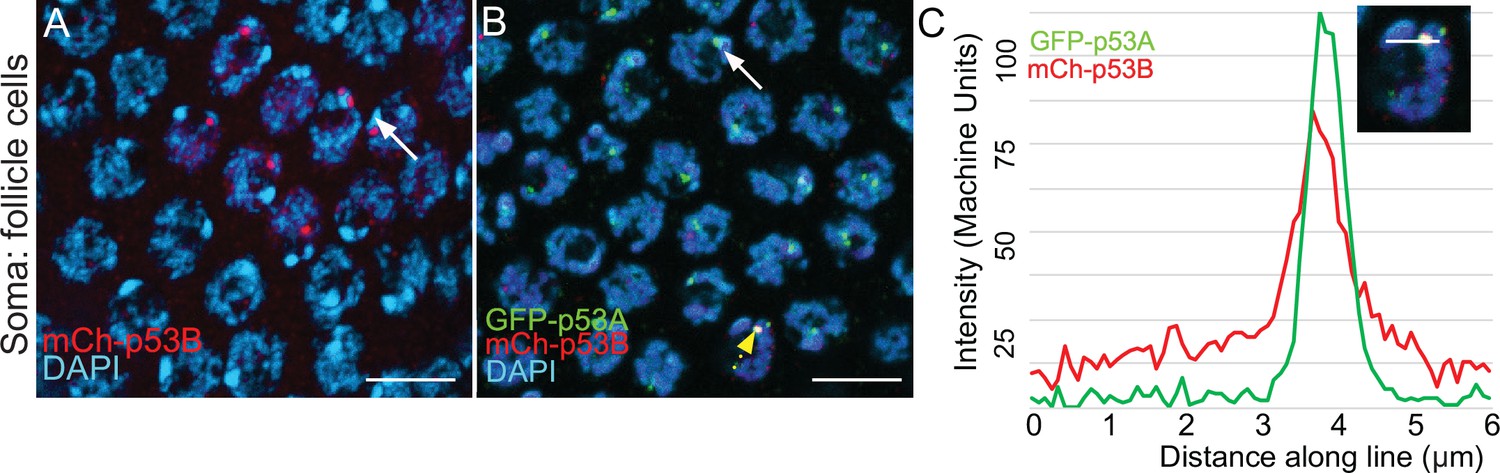
Rare mCh-p53B expression in somatic follicle cells.
(A, B) mCh-p53B in nuclear bodies in a small group of follicle cells in a mCh-p53B female (A), and colocalization with GFP-p53A in follicle cells in a mCh-p53B / GFP-p53A female (B). White arrows indicate two examples of DAPI-bright pericentric heterochromatin, near which p53 bodies are often located. (C) Quantification of GFP-p53A and mCh-p53B labeling in one nuclear body in (B) (dotted yellow arrow), measured along a 6 μm line (inset). Scale bar is 10 μm.
Figure 1—figure supplement 2
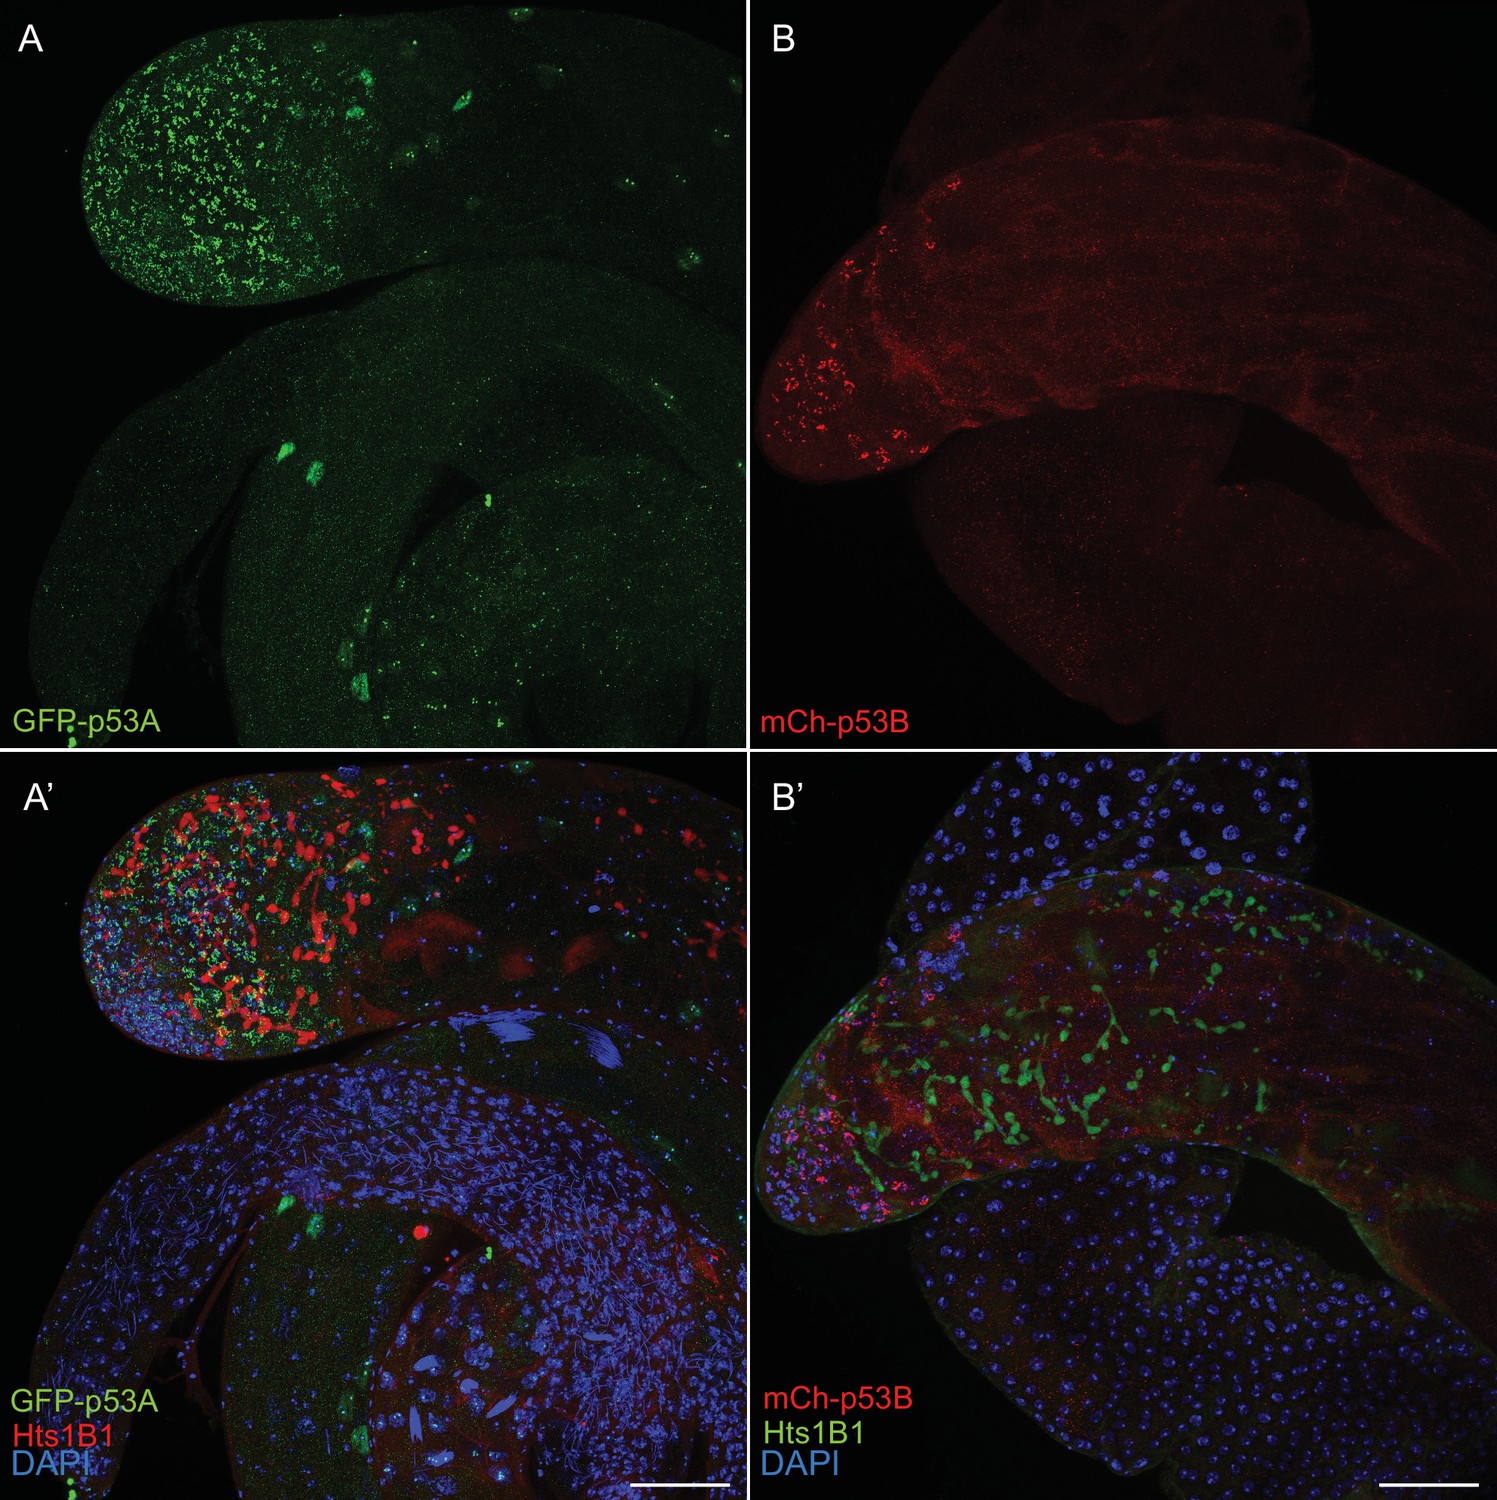
p53A and p53B are expressed in the male germline.
A testis expressing GFP-p53A (A, A’) or mCh-p53B (B, B’), with labeling with anti-Hts (germline fusomes) and DAPI (blue) shown in A’, B’. Scale bar is 20 μm.
Figure 2 with 1 supplement
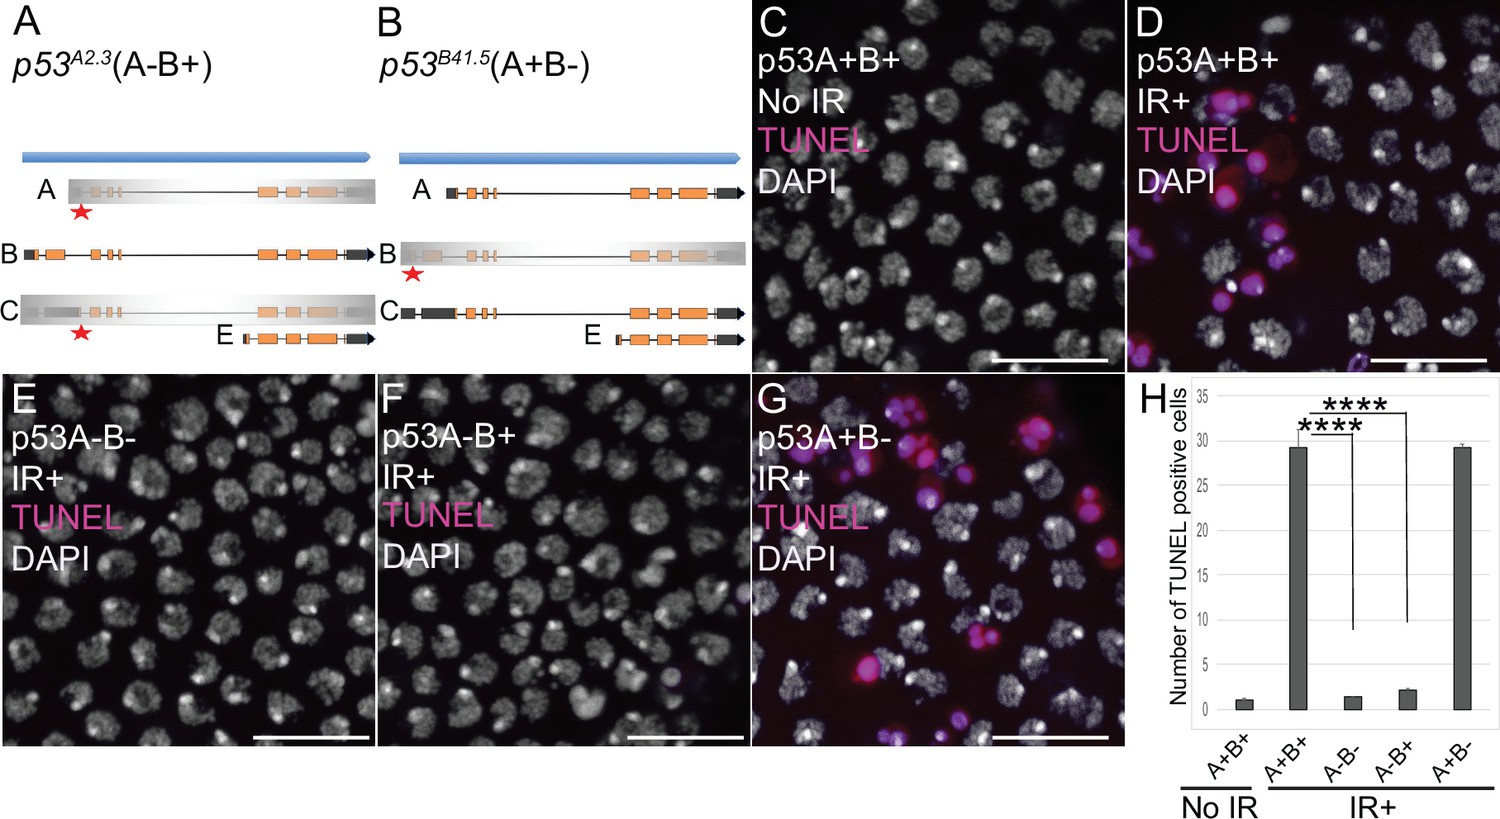
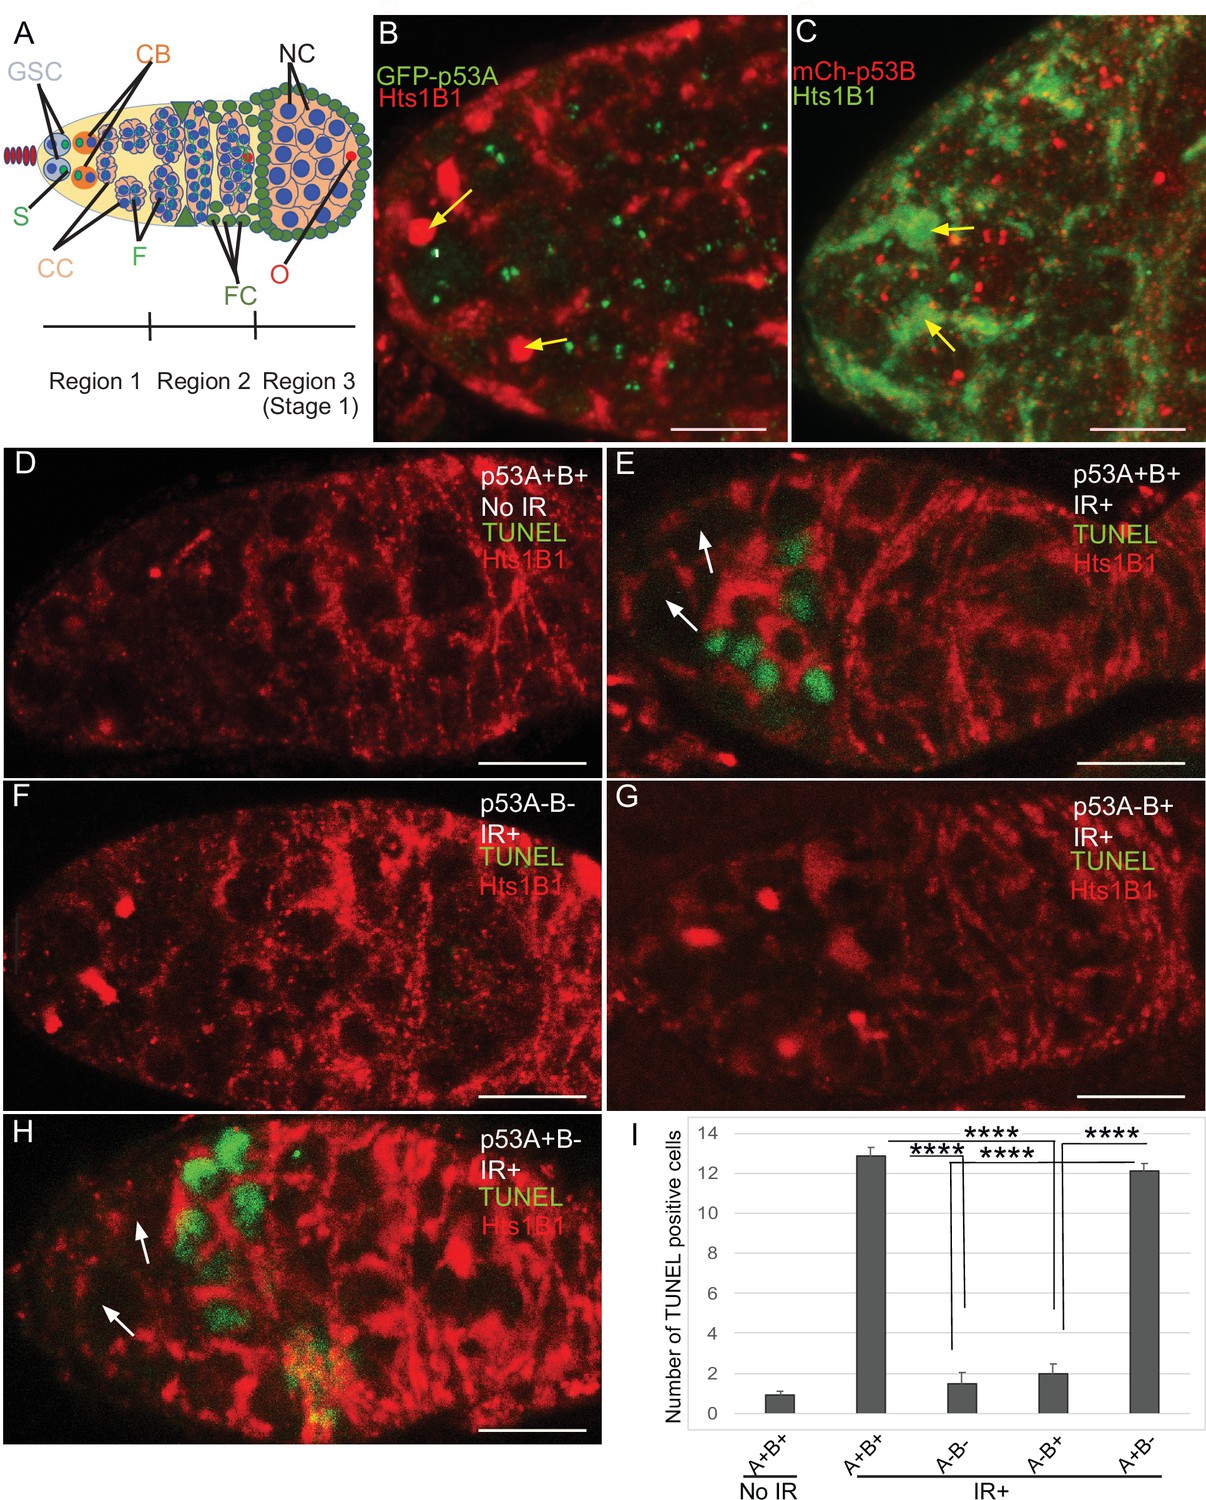
p53A is necessary and sufficient for IR-induced apoptosis in the soma.
(A–B) The p53 isoform-specific mutants created at the endogenous p53 locus with CRISPR / Cas9. Each allele is a small deletion (red asterisk) in the unique 5’ coding exon of p53A (A) and p53B (B) mRNAs. The p53A2.3 (A-B+) mutant impairs expression of isoforms p53A and p53C (gray shading) but not p53B, whereas the p53B41.5 (A+B-) mutant eliminates expression of p53B (gray shading) but not p53A (see Figure 2—figure supplement 1). (C–H) Apoptotic response to IR of stage six somatic follicle cells, assayed by TUNEL (red), with DNA stained with DAPI (gray). (C–D) TUNEL-labeled follicle cells from a p53+ (A+B+) wild type female without (C) or 4 hr after IR (D). (E–G) TUNEL labeling of follicle cells after IR from p535A-1-4 (A-B-) null (E), p53A2.3 (A-B+) (F), and p53B41.5 (A+B-) (G) mutant females. Scale bars are 10 μm. (H) Quantification of the average number of TUNEL-labeled follicle cells in stage six egg chambers for the genotypes and treatments shown in (C–G). Averages are based on 10 egg chambers per genotype with two biological replicates. Error bars are S.E.M. ****: p < 0.0001 by unpaired Student’s t test.
-
Figure 2—source data 1
Counts of TUNEL-positive follicle cells for Figure 2.
- https://cdn.elifesciences.org/articles/61389/elife-61389-fig2-data1-v1.xlsx
Figure 2—figure supplement 1
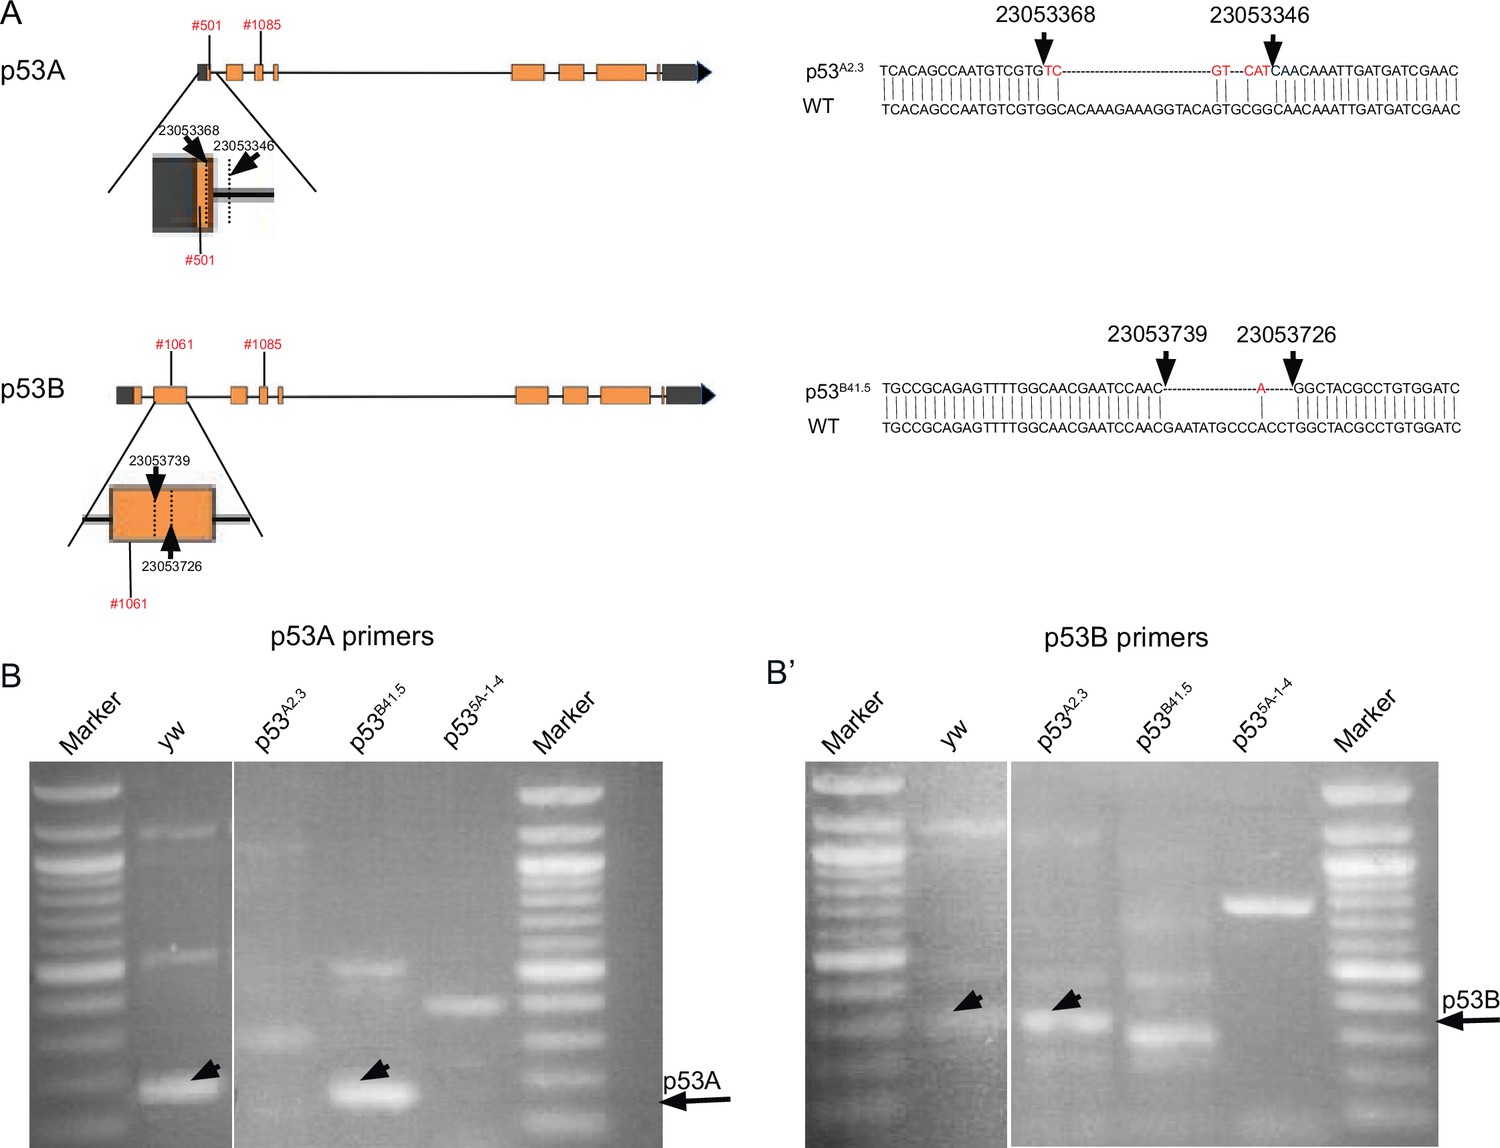
p53 isoform-specific alleles.
(A) Left: Shown are the location of p53A2.3 and p53B41.5 deletion alleles and the coordinates of primers (red font) used for RT-PCR. Expanded maps below indicate the coordinates of the deletion endpoints within the p53A and p53B mRNA isoforms (dotted lines and straight arrows). Right: DNA Sequence of p53A2.3 and p53B41.5 deletion alleles (top) aligned with Drosophila reference genome sequence (WT, bottom). Red nucleotides indicate unique nucleotide insertions. All genomic coordinates are based on Drosophila melanogaster genome release 6.32. (B, B’) RT-PCR with the primer pairs indicated in (A) that are specific to p53A mRNA (B) or p53B mRNA (B’) from p53+ (A+B+), p53A2.3 (A-B+), p53B41.5 (A+B-), p535A-1-4 (A-B-). Black arrows indicate position of p53A and p53B PCR products.
-
Figure 2—figure supplement 1—source data 1
Counts of TUNEL-positive follicle cells for Figure 2.
- https://cdn.elifesciences.org/articles/61389/elife-61389-fig2-figsupp1-data1-v1.zip
Figure 3
p53A and p53B are expressed in the early female germline, but only p53A is required for IR-induced germline apoptosis.
(A) Illustration of three regions of the germarium: germline stem cells (GSC), their primary daughter cystoblasts (CB), dividing cystocytes (CC), GSC spherical cytoskeletal spectrosome (S), branched fusome (F, green lines), oocyte (O, red), nurse cell (NC, blue), somatic follicle cells (FC, green). (B, C) Expression of GFP-p53A (B) and mCh-p53B (C) in subnuclear bodies of GSC and cystocytes of the germarium. The GSCs were identified by the presence of the spectrosome (yellow arrows). Scale bars are 5 μm. (D–E) TUNEL (green) and anti-Hts labeling (red) in germaria from p53+ (A+B+) wild-type females without IR (D) or with IR (E). Spectrosomes and fusomes were labeled with anti-Hts antibody to identify GSC and cystocytes, respectively. (F–H) TUNEL after IR of p535A-1-4 (A-B-) null (F), p53A2.3 (A-B+) (G) and p53B41.5 (A+B-) (H) females. The GSCs (white arrows in E and H) were not TUNEL positive. Scale bars are 10 μm. (I) Quantification of the average number of TUNEL-labeled cystocytes in region 1 of the germarium for the genotypes and treatments shown in D–H. Averages are based on 10 germaria per genotype and three biological replicates. Error bars are S.E.M. ****: p < 0.0001 by unpaired Student’s t test.
-
Figure 3—source data 1
Counts of Tunel-positive germline cells for Figure 3.
- https://cdn.elifesciences.org/articles/61389/elife-61389-fig3-data1-v1.xlsx
Figure 4 with 1 supplement

p53A is necessary and sufficient for IR-induced expression of proapoptotic genes in the germline.
(A-H’) Confocal micrographs of the expression of the p53 activity reporter, hid-GFP, in germaria of females with the indicated p53 allele genotypes (rows), without IR (left two columns) or with IR (right two columns). Shown are single channel hid-GFP (A–H) and double label with DAPI (A’-H’). Scale bar in panel A is 10 μm for all panels. (I) Quantification of hid-GFP fluorescent intensity in the germaria of females with the indicated p53 genotypes. Bars represent mean fluorescent intensity and error bars S.E.M. from three biological replicates. Statistical significance of expression differences between irradiated and unirradiated within a genotype are indicated by red font and lines, and comparison of nonirradiated p53 wild type to all nonirradiated p53 mutants are indicated by black font and lines. ***: p < 0.001, **: p < 0.01, n.s.: not significant based on ANOVA.
-
Figure 4—source data 1
Quantification of hid-GFP intensity for Figure 4.
- https://cdn.elifesciences.org/articles/61389/elife-61389-fig4-data1-v1.xlsx
Figure 4—figure supplement 1
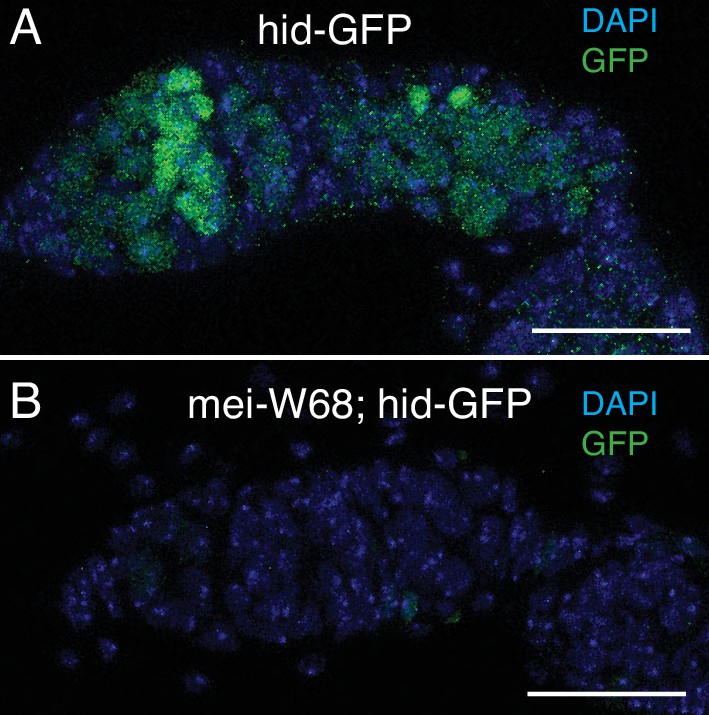
hid-GFP expression in region 2a responds to meiotic DNA breaks.
Hid-GFP expression in wild type (A) and mei-W681/ Df(2R)BSC782 mutants (B). Scale bars are 25 μm.
Figure 5 with 1 supplement

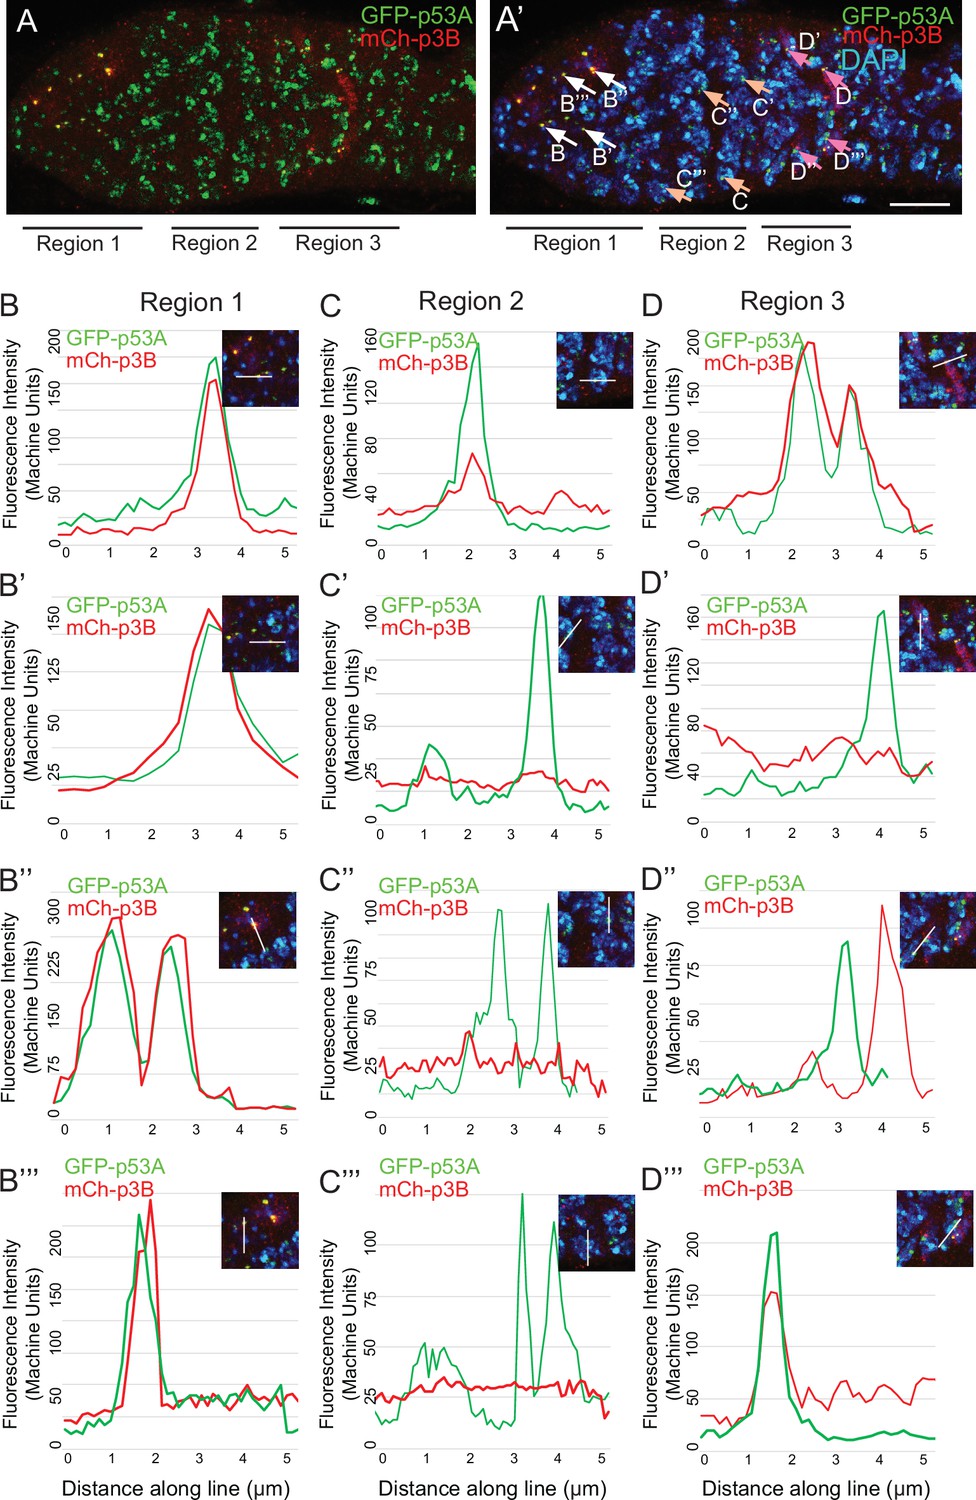
p53B protein levels fluctuate in p53 bodies during early meiosis.
(A-C’) Micrographs p53 bodies in germaria from GFP-p53A (A-A’, green) and mCh-p53B (B-B’, red), and GFP-p53A / mCh-p53B females (C-C’). (D–F) Representative quantification of GFP-p53A and mCh-p53B fluorescent intensity within p53 bodies along the line shown in micrograph insets for region 1 (D), region 2 (E), and region 3 (F), indicated by white arrows in C’. A-B’ are single confocal z sections, whereas C-C’ are a composite stack of several z sections. Scale bars are 10 μm. (G) Quantification of the ratio of mCh-p53B to GFP-p53A within bodies in gemarium regions 1, 2, and 3. Shown are mean and S.E.M. **** = p < 0.0001 and n.s. = not significant by unpaired Student’s t test. n = 10 foci for regions 1 and 3 and 23 foci for region 2. See Figure 5—figure supplement 1 for more examples of quantification of p53A and p53B in nuclear bodies in regions 1–3.
-
Figure 5—source data 1
Quantification of GFP-p53A and mCh-p53B intensity in nuclear bodies for Figure 5.
- https://cdn.elifesciences.org/articles/61389/elife-61389-fig5-data1-v1.xlsx
Figure 5—figure supplement 1
mCh-p53B levels fluctuate in p53 bodies during early meiosis.
(A, A’) A germarium from a GFP-p53A / mCh-p53B female showing localization of p53A and p53B proteins to p53 nuclear bodies in germarium regions 1, 2, and 3, with DAPI labeling of DNA (blue) shown in A’. Arrows in A’ indicate the bodies within which GFP-p53A and mCh-p53B were quantified and the letters within the figure indicate the corresponding panels shown below. Scale bar is 10 μm. (B-D”) Four examples each of fluorescent quantification along a 6 μm line within nuclear bodies from regions 1 (B-B”’), 2 (C-C”’), and 3 (D-D”’), which are indicated by arrows in A’. Related to Figure 5.
Figure 6 with 3 supplements
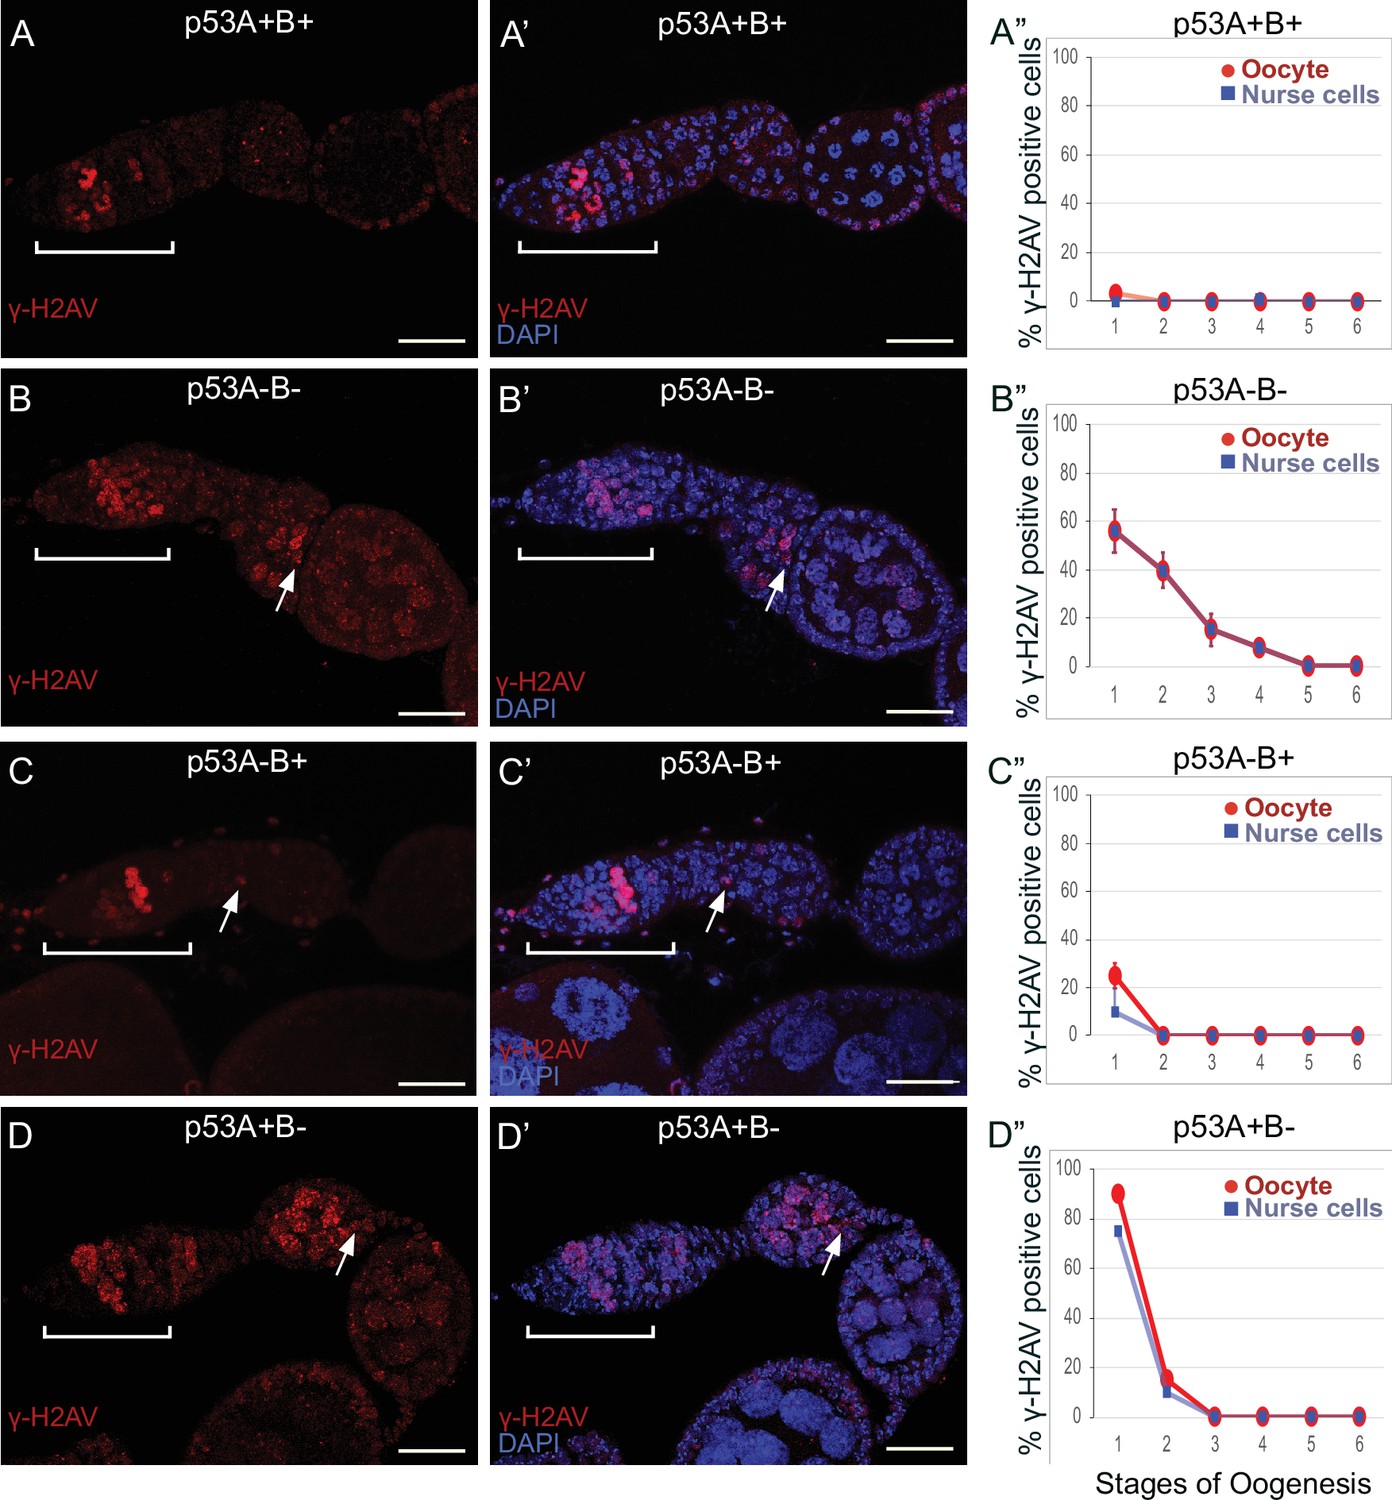
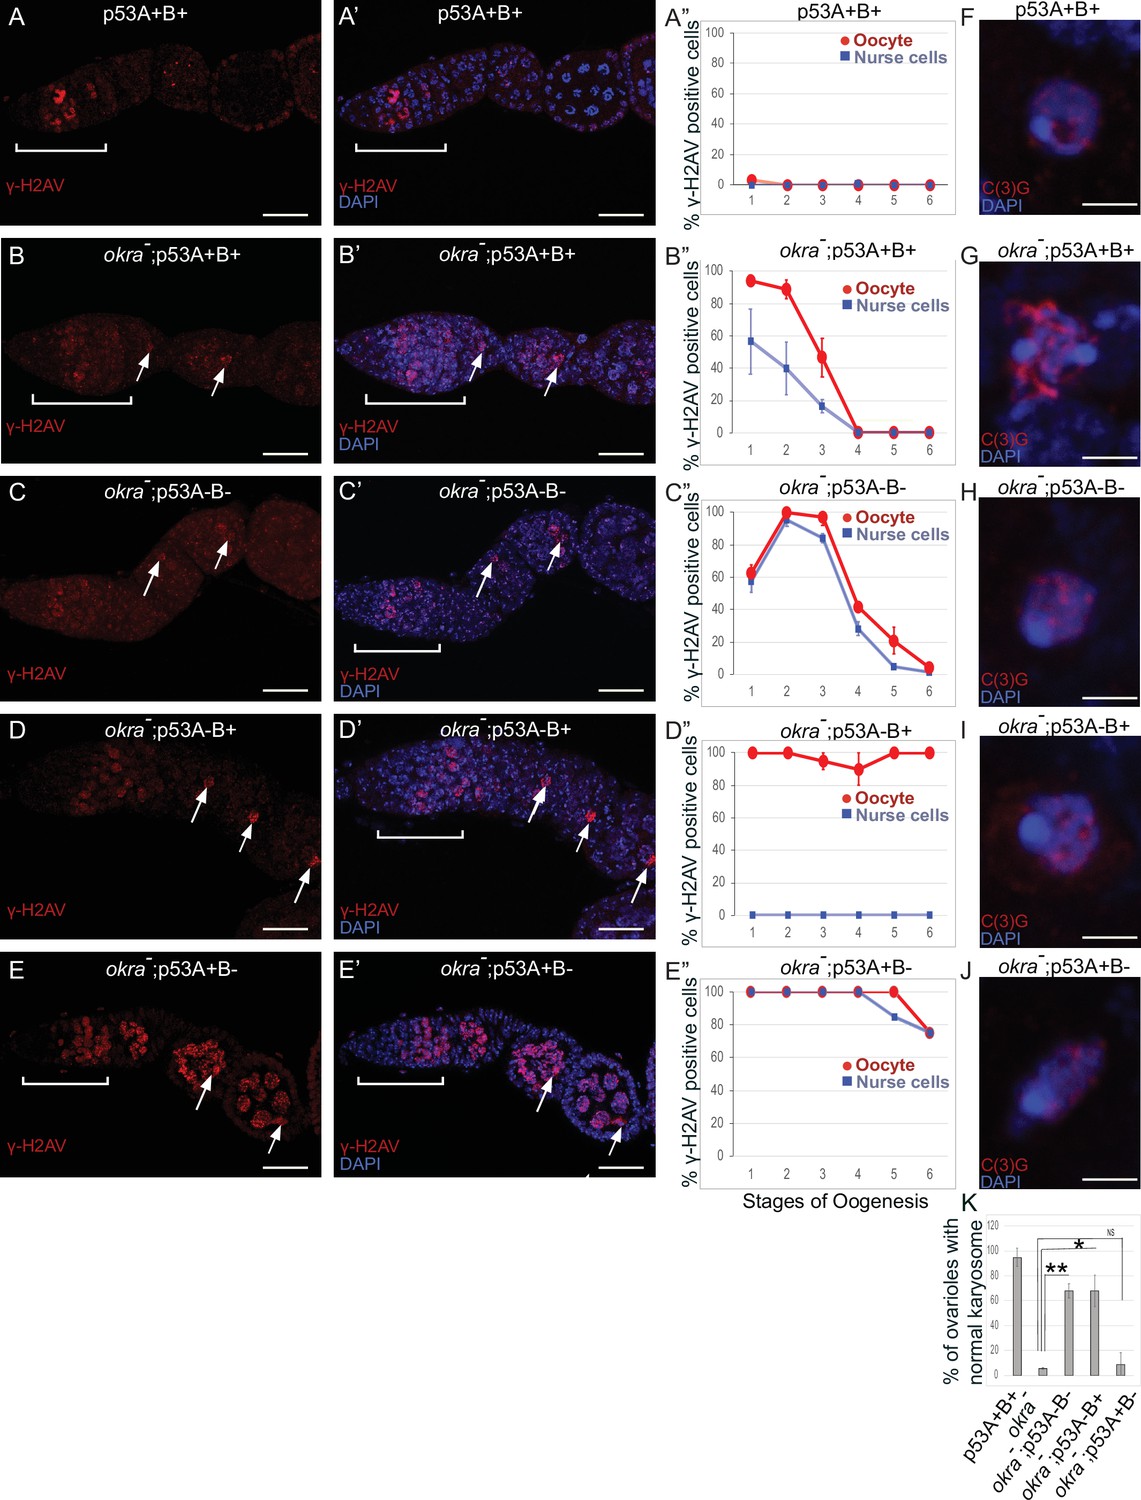
p53A and p53B mutants have persistent germline DNA damage.
(A-D’) Images of ovarioles of indicated genotypes immunolabeled with anti-γ-H2Av (red) (A–D) to detect DNA breaks, and counterstained with the DNA dye DAPI (blue) (A’-D’). The ovarioles are oriented with the anterior germarium to left (square bracket). Scale bars are 25 µm. (A”-D”) Quantification of percent of ovarioles with γ-H2Av-positive nurse cells (blue squares) and oocyte (red ovals) for the indicated genotypes. Values are means of three biological replicates and >20 ovarioles, with error bars representing S.E.M. Values with low variance have very small error bars that are not visible in the graphs. See Figure 6—figure supplement 1 for higher magnification images of germaria, and Supplementary file 1 for p values.
-
Figure 6—source data 1
Quantification of persistent DNA breaks by stage for Figure 6.
- https://cdn.elifesciences.org/articles/61389/elife-61389-fig6-data1-v1.xlsx
Figure 6—figure supplement 1
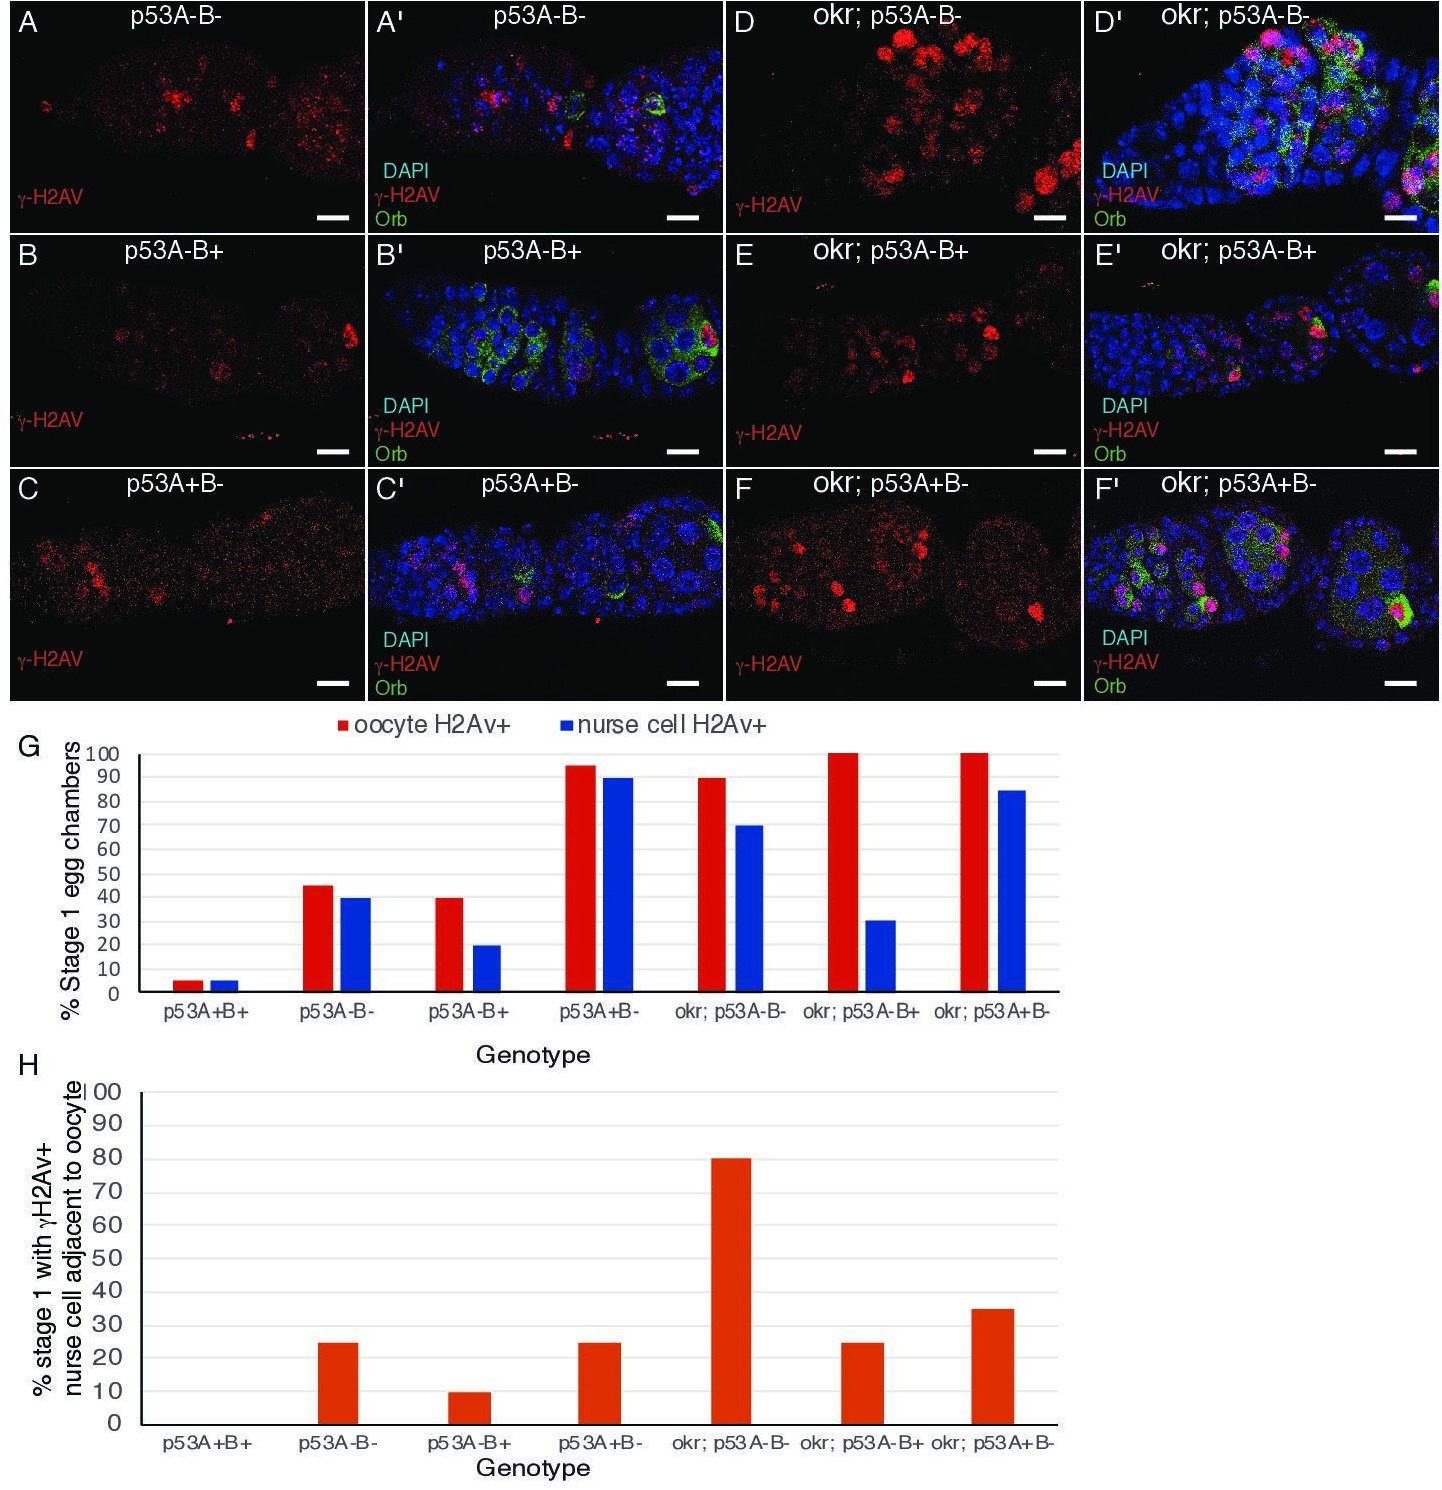
Double labeling for oocyte marker Orb and γ-H2Av in stage 1.
(A-F’) Images of germarium and stage one labeled for γ-H2Av (red) and oocyte marker Orb (green) (A–F), and with DAPI DNA stain (blue) (A’-F’). (G) Quantification of percent stage one with γ-H2Av and Orb positive oocyte. (H) Quantification of percent stage one with a γ-H2Av -bright nurse cell adjacent to a Orb-positive oocyte. n = 20 ovarioles for each genotype.
-
Figure 6—figure supplement 1—source data 1
Quantification of DNA breaks in orb-lableled ovaries of Figure 6—figure supplement 1.
- https://cdn.elifesciences.org/articles/61389/elife-61389-fig6-figsupp1-data1-v1.xlsx
Figure 6—figure supplement 2
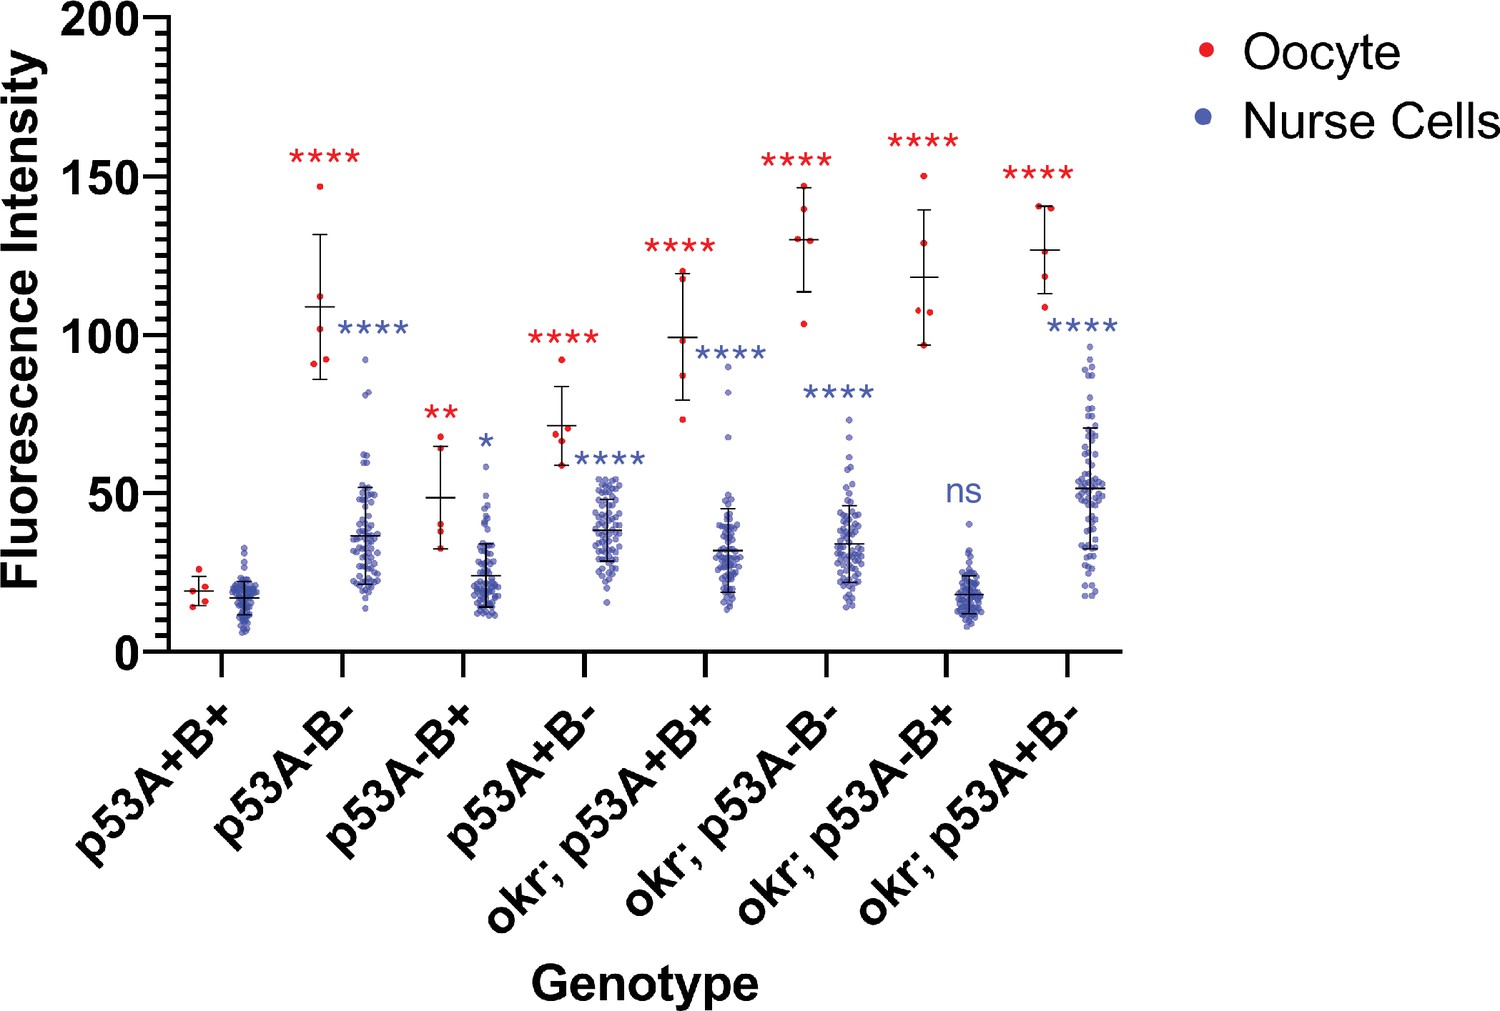
Quantification of γ-H2Av fluorescence intensity in oocytes (red) and nurse cells (blue) of stage one egg chambers.
Each dot represents a single oocyte or nurse cell. Horizontal lines represent mean and standard deviation. Asterisks represent adjusted p values of a two-way, pair-wise ANOVA computed through a Tukey test between p53A+B+ (wild type) and all other genotypes for oocyte (red asterisks) and nurse cells (blue asterisks). * p < 0.05; **p < 0.01; ***p < 0.01; ****p < 0.0001. Statistical analyses were performed using GraphPad Prism (version 9.1.2). See Supplementary file 2 for p values.
-
Figure 6—figure supplement 2—source data 1
Quantification of DNA breaks per cell for Figure 6—figure supplement 2.
- https://cdn.elifesciences.org/articles/61389/elife-61389-fig6-figsupp2-data1-v1.xlsx
Figure 6—figure supplement 3
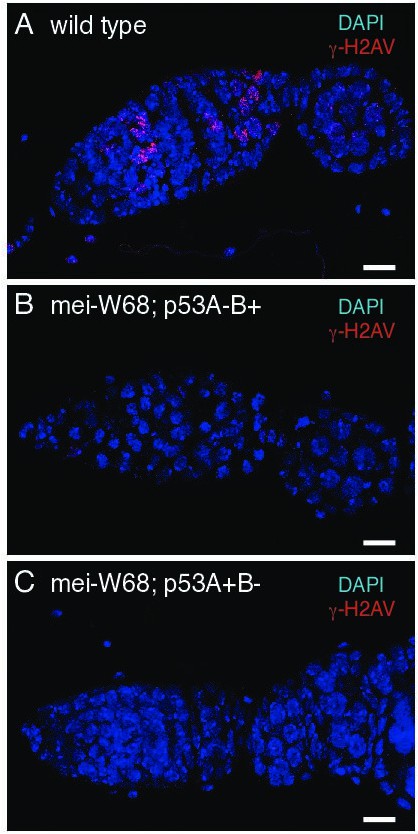
DNA repair foci in p53 mutants depends on DNA meiotic breaks.
γ-H2Av labeling of wild type (A), mei-W681/ Df(2R)BSC782; p53A2.3 (B), and mei-681/Df(2R)BSC782; p53B41.5 (C).
Figure 7 with 3 supplements
p53A and p53B have overlapping and distinct functions in germline genome integrity and the meiotic pachytene checkpoint.
(A-E’) Drosophila ovarioles of indicated genotypes were immunolabeled for γ-H2Av (red A-E) to detect DNA breaks and counterstained with the DNA dye DAPI (blue A’-E’). The ovarioles are shown with the anterior germarium to left (square bracket). Scale bars are 25 µm. (A”-E”) Quantification of percent of ovarioles with γ-H2Av-positive nurse cells (blue squares) and oocyte (red ovals) at different stages. Values are means of five biological replicates and >20 ovarioles with error bars representing S.E.M. Those values that had low variance have very small error bars that are not visible in the graphs. See Figure 6—figure supplement 1 for higher mag images of germaria, and Supplementary file 1 for p values. (F–K) p53A is required for activation of the pachytene checkpoint. (F–J) Oocyte nuclei from stage 3 to 4 egg chambers labeled with antibodies against synaptonemal protein C(3)G (red) and DNA dye DAPI (blue). (F) Wild type with spherical compact karyosome. (G) okraRU / okraAA with diffuse chromatin indicating activation of the pachytene checkpoint. (H) okraRU / okraAA; p535A-1-4 (A-B-) null with compact spherical karyosome. (I) okraRU / okraAA; p53A2.3 (A-B+) p53A mutant with spherical karyosome. (J) okraRU / okraAA; p53B41.5 (A+B-) with elliptical nucleus. Scale bars are 3 µm. (K) Quantification of karyosome formation. Data are means based on two biological replicates with ~30 nuclei per strain per replicate, with error bars representing S.E.M. * p < 0.05, ** p < 0.01, n.s. = not significant by unpaired Student’s t test.
-
Figure 7—source data 1
Quantification of persistent DNA breaks by stage for Figure 7.
- https://cdn.elifesciences.org/articles/61389/elife-61389-fig7-data1-v1.xlsx
-
Figure 7—source data 2
Quantification of karysome phenotype for Figure 7K.
- https://cdn.elifesciences.org/articles/61389/elife-61389-fig7-data2-v1.xlsx
Figure 7—figure supplement 1
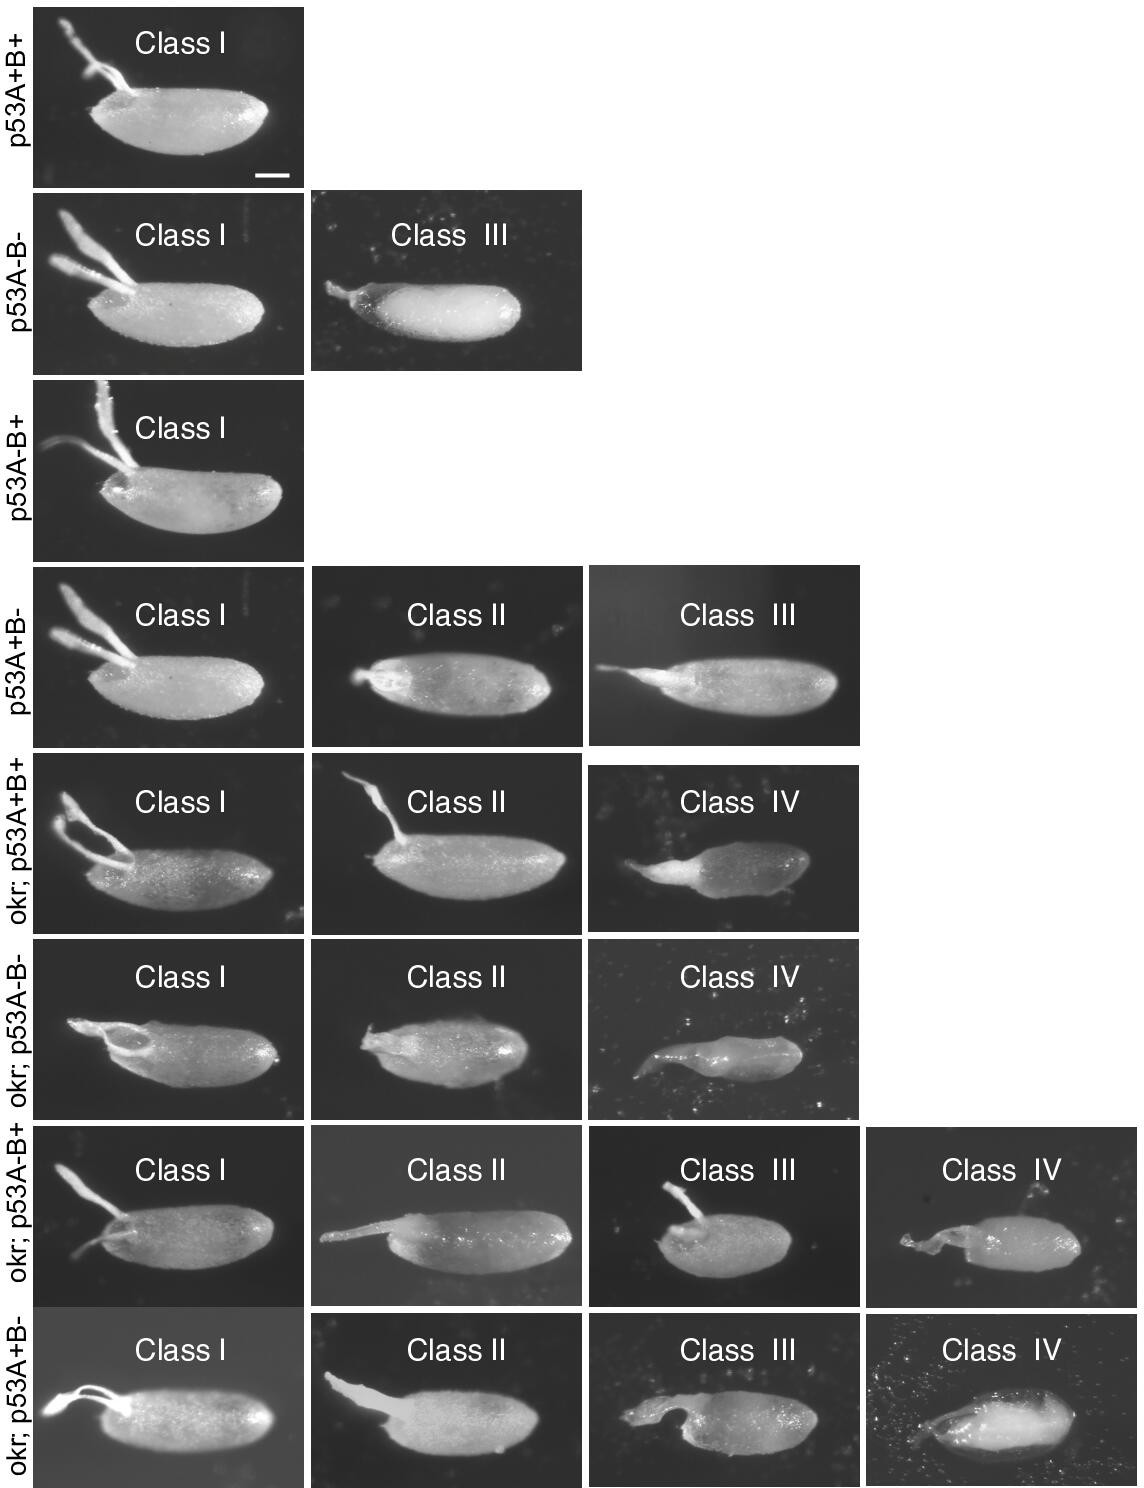
Images of eggshell phenotype classes produced by p53 and okr single or double mutant mothers.
p53A+B+ = wild type. okr; p53A+B+ = okra single mutant. Class I- wild type; Class II: ventralized; Class III: short or missing dorsal appendages. Class IV: Small collapsed eggs with thin eggshells. See Figure 7—figure supplement 2 for quantification.
Figure 7—figure supplement 2
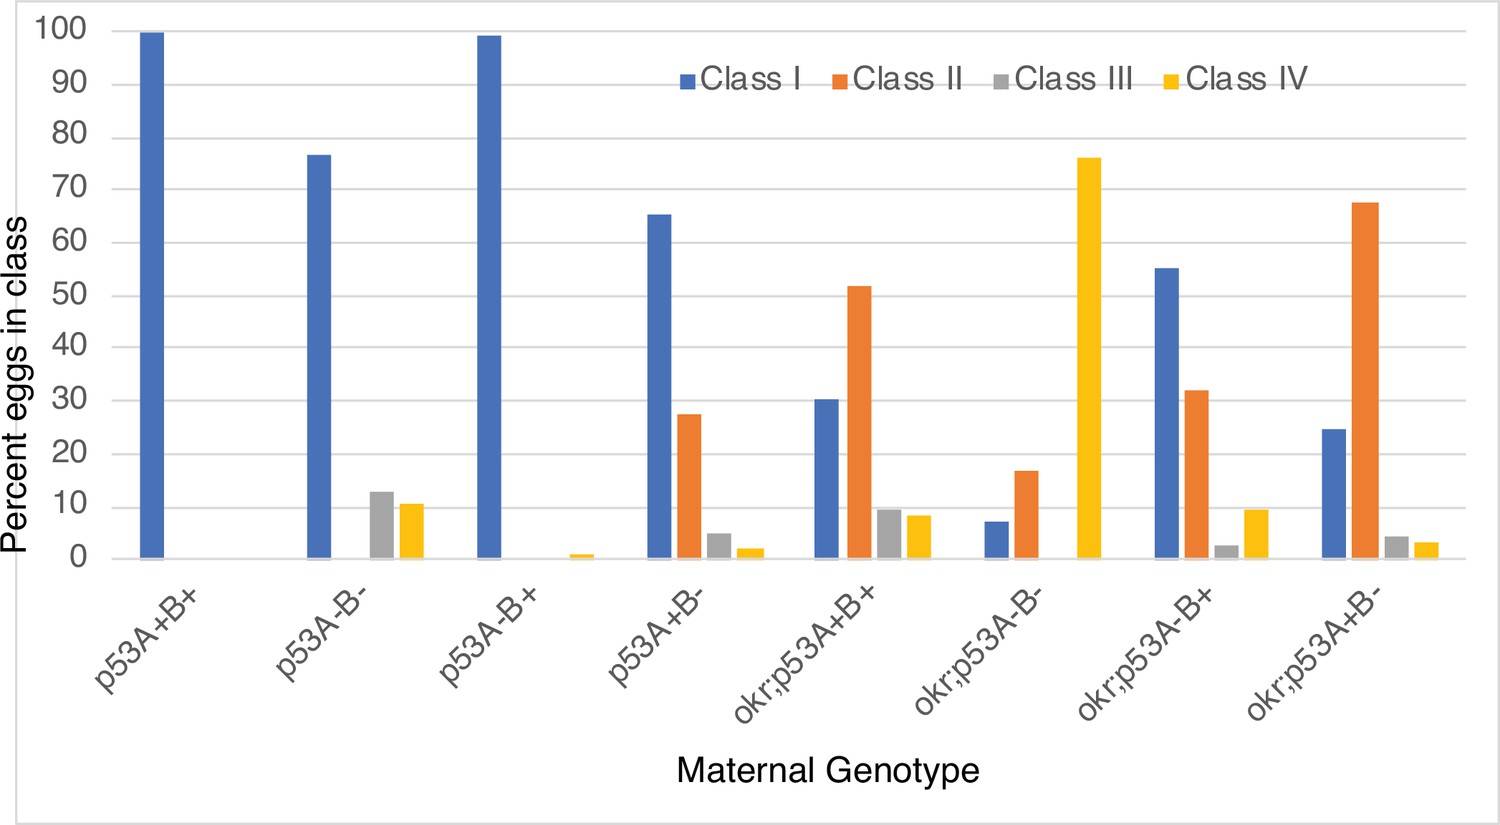
Quantification of eggshell phenotype classes produced by p53 and okr single or double mutant mothers.
p53A+B+ = wild type. okr; p53A+B+ = okra single mutant. Class I- wild type; Class II: ventralized; Class III: short or missing dorsal appendages. Class IV: Small collapsed eggs with thin eggshells.
-
Figure 7—figure supplement 2—source data 1
Quantification of egg phenotypes for Figure 7—figure supplement 2.
- https://cdn.elifesciences.org/articles/61389/elife-61389-fig7-figsupp2-data1-v1.xlsx
Figure 7—figure supplement 3
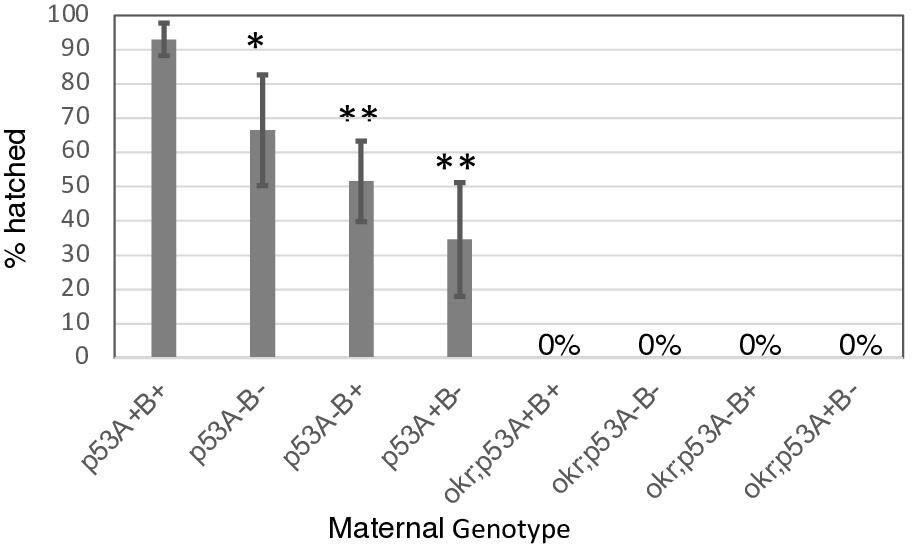
p53 mutant mothers have reduced fertility.
Hatch rates of eggs from p53 and okr single or double mutant mothers. The hatch rate for all okr single and double mutants was zero (complete female sterility). p53A+B+ = wild type. okr; p53A+B+ = okra single mutant. Shown are mean and standard deviation based on four to five biological replicates of 30–50 eggs per genotype. *p < 0.05, **p < 0.01 versus wild type by unpaired student’s t test.
-
Figure 7—figure supplement 3—source data 1
Quantification of hatch rates for Figure 7—figure supplement 3.
- https://cdn.elifesciences.org/articles/61389/elife-61389-fig7-figsupp3-data1-v1.xlsx
Figure 8
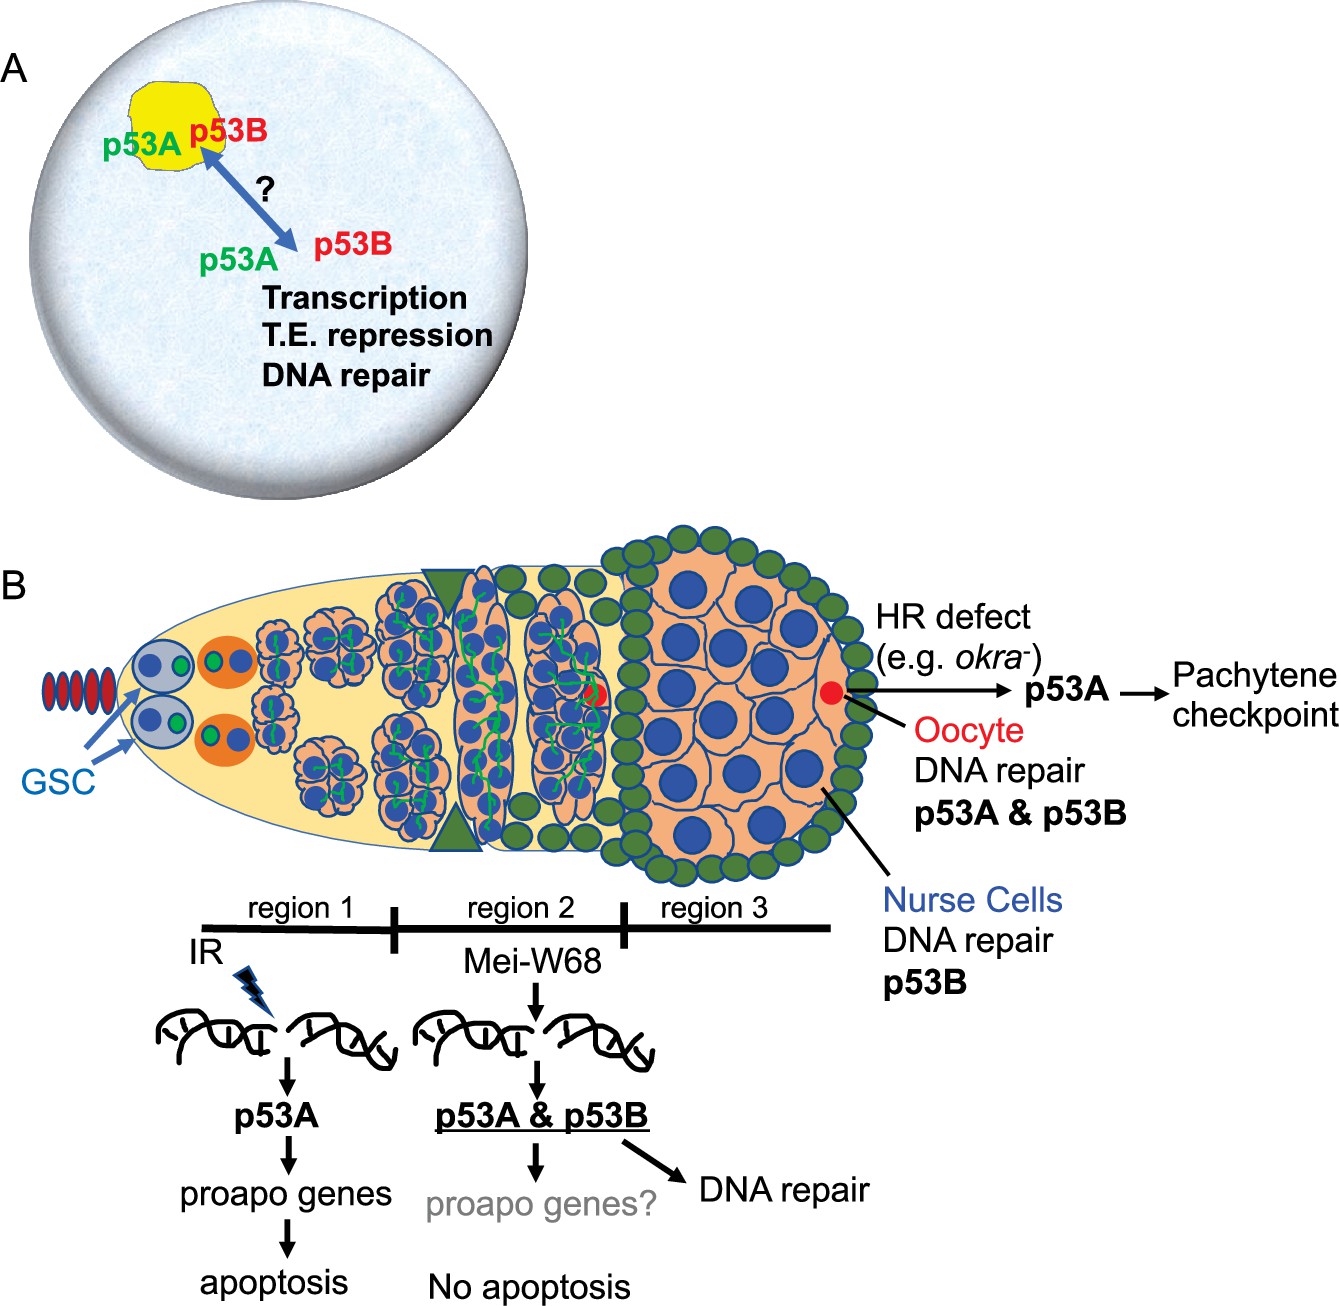
Model: Drosophila p53 isoforms colocalize to nuclear bodies and have DNA lesion and cell type specific functions in the germline genotoxic stress response.
(A) The p53A (green) and p53B (red) isoforms are concentrated in p53 bodies of germline nuclei (blue). Trafficking of p53 isoforms through these bodies (double arrow) may mediate their functions in transcription, transposable element (T.E.) repression, and DNA repair. (B) The p53A isoform mediates the apoptotic response to IR in dividing germline cells in region 1 of the germarium. This apoptotic response is repressed in germline stem cells (GSCs) and meiotic cells. The data lead to the proposal that p53B is required for repair of meiotic DNA breaks in nurse cell (blue) and oocyte (red) nuclei, whereas p53A is required for DNA repair and activation of the meiotic pachytene checkpoint in oocytes when homologous recombination (HR) is defective.
Tables
Key resources table
| Reagent type (species) or resource | Designation | Source or reference | Identifiers | Additional information |
|---|---|---|---|---|
| Gene (Drosophila melanogaster) | w67c23 | Bloomington Drosophila Stock Center | FBal0095147 | |
| Gene (Drosophila melanogaster) | w1118 | Bloomington Drosophila Stock Center | FBal0018186RRID:BDSC_6598 | |
| Gene (Drosophila melanogaster) | p53 (p535A1-4) | Bloomington Drosophila Stock Center | FLYB:FBgn0039044; RRID:BDSC_6815 | FBal0138188 |
| Gene (Drosophila melanogaster) | p53 (p53A2.3) | Robin et al., 2019 | FLYB:FBgn0039044 | See Materials and Methods, Section 2 |
| Gene (Drosophila melanogaster) | p53 (p53B41.5) | this study | FLYB:FBgn0039044 | See Materials and Methods, Section 2 |
| Gene (Drosophila melanogaster) | okra (okraAA) | Ghabrial et al., 1998 | FLYB:FBgn0002989 | Obtained from T. Schupbach |
| Gene (Drosophila melanogaster) | okra (okraRU) | Bloomington Drosophila Stock Center | FLYB:FBgn0002989; RRID:BDSC_5098 | FBal0013236;Obtained from T. Schupbach |
| Gene (Drosophila melanogaster) | mei-W68 (Df(2 R)BSC782) | Bloomington Drosophila Stock Center | FLYB:FBgn0002716; RRID:BDSC_27354 | |
| Gene (Drosophila melanogaster) | mei-W68 (mei-W681) | Bloomington Drosophila Stock Center | FLYB:FBgn0002716; RRID:BDSC_4932 | FBal0012191 |
| Genetic reagent (Drosophila melanogaster) | hid-GFP | Tanaka-Matakatsu et al., 2009 | FLYB:FBgn0003997; RRID:BDSC_50751 | Obtained from W. Du |
| Genetic reagent (Drosophila melanogaster) | GFP-p53A | Zhang et al., 2015 | FLYB:FBtp0111619 | |
| Genetic reagent (Drosophila melanogaster) | mCh-p53B | Zhang et al., 2015 | FLYB:FBtp0098077 | |
| Sequence-based reagent | p53 gRNA | This study | 5’:CCTGGAGCA CGGAAGATTCTTG; 3’:GATCCACAG GCGTAGCCAGGTGG | |
| Sequence-based reagent | primer #501 | This study | PCR primer | CCAACAAGAT CGCTTGATCAGATA |
| Sequence-based reagent | primer #1,085 | This study | PCR primer | GGCCATGGG TTCCGTGGTCA |
| Sequence-based reagent | primer #1,061 | This study | PCR primer | GAGTCAGCAG TTCGGGTCTC |
| Antibody | Anti-GFP (Rabbit polyclonal) | Invitrogen | Cat# A11122 | IF(1:500) |
| Antibody | Anti-dsRed (Rabbit polyclonal) | Clontech | Cat# 632,496 | IF(1:200) |
| Antibody | Anti-dsRed (mouse polyclonal) | Clontech | Cat# 632,392 | IF(1:200) |
| Antibody | Anti-Hts 1B1 (mouse monoclonal) | Developmental Studies Hybridoma Bank | RRID:AB_528070 | IF(1:20) |
| Antibody | Anti-γH2Av (mouse monoclonal) | Developmental Studies Hybridoma Bank | RRID:AB_2618077 | IF(1:1000) |
| Antibody | Anti-orb 4H8 (mouse monoclonal) | Developmental Studies Hybridoma Bank | RRID:AB_528418 | IF(1:500) |
| Antibody | Anti-Vasa (rat monoclonal) | Developmental Studies Hybridoma Bank | RRID:AB_10571464 | IF(1:100) |
| Antibody | Alexa Fluor 488 anti-mouse (polyclonal) | Invitrogen | Cat# A11011 | IF(1:1000) |
| Antibody | Alexa Fluor 488 anti-rabbit (polyclonal) | Invitrogen | Cat# A11008 | IF(1:1000) |
| Antibody | Alexa Fluor 568 anti-mouse (polyclonal) | Invitrogen | Cat# A11004 | IF(1:1000) |
| Antibody | Alexa Fluor 568 anti-rabbit (polyclonal) | Invitrogen | Cat# A10042 | IF(1:1000) |
| Antibody | Alexa Fluor 488 anti-mouse IgG1 (polyclonal) | Invitrogen | Cat# A21121 | IF(1:1000) |
| Antibody | Alexa Fluor 568 anti-mouse IgG2b (polyclonal) | Invitrogen | Cat# A21144 | IF(1:1000) |
Additional files
-
Transparent reporting form
- https://cdn.elifesciences.org/articles/61389/elife-61389-transrepform1-v1.docx
-
Supplementary file 1
p values for frequency of nurse cells and oocytes with DNA breaks for Figures 6 and 7.
- https://cdn.elifesciences.org/articles/61389/elife-61389-supp1-v1.docx
-
Supplementary file 2
ANOVA p value comparisons among genotypes for mean H2AV intensity in stage 1 oocytes and nurse cells for Figures 6 and 7.
- https://cdn.elifesciences.org/articles/61389/elife-61389-supp2-v1.docx
Download links
A two-part list of links to download the article, or parts of the article, in various formats.
Downloads (link to download the article as PDF)
Open citations (links to open the citations from this article in various online reference manager services)
Cite this article (links to download the citations from this article in formats compatible with various reference manager tools)
DrosophilaSSS p53 isoforms have overlapping and distinct functions in germline genome integrity and oocyte quality control
eLife 11:e61389.
https://doi.org/10.7554/eLife.61389


