The metal cofactor zinc and interacting membranes modulate SOD1 conformation-aggregation landscape in an in vitro ALS model
- Structural Biology & Bio-Informatics Division, CSIR-Indian Institute of Chemical Biology, India
- Chemistry and Chemical Biology, Harvard University, United States
- Academy of Scientific and Innovative Research (AcSIR), CSIR- Human Resource development Centre Campus, India
- Hiralal Mazumdar Memorial College for Women, India
- Department of Physics, Jadavpur University, India
- School of Biological Sciences, National Institute of Science Education and Research (NISER), India
- Department of Biotechnology, Bhupat & Jyoti Mehta School of Biosciences, Indian Institute of Technology Madras, India
Figures
Figure 1 with 1 supplement

Statistical mechanical modeling of SOD1 folding mechanism.
(a) Cartoon representation of SOD1 monomer highlighting the various structural elements. The positions of the mutation for H121F and H72F have been arrow marked. (b) Residue folding probability as a function of residue index for the different variants of SOD1 as predicted by the bWSME model. Note that WT represents the variant in which both the metallic cofactors are bound. (c) Average folding probabilities colored in the spectral scale going from 0 (dark blue) to 1 (dark red) as a function of the reaction coordinate, number of structured blocks. The vertical white dashed line signals the parts of the protein that fold first. For example, it can be seen that residues 1–40 fol d early in the apo SOD1 (dark red) when compared to WT where residues 40–80 fold first.
Figure 1—figure supplement 1
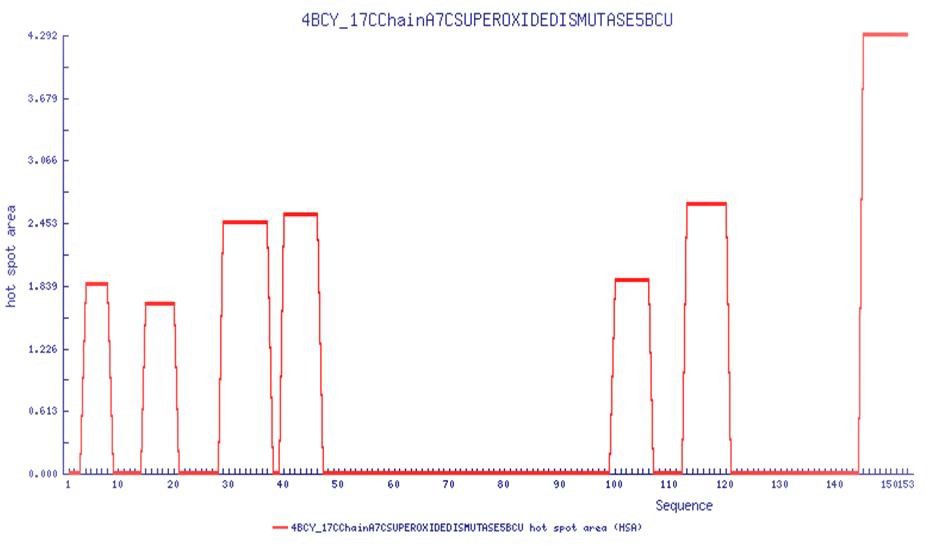
Aggregation prone regions as a function of sequence from AGGRESCAN software (http://bioinf.uab.es/aggrescan/ ).
Results point to the N-terminal residues 1–50 as the hotspot region for aggregation.
Figure 2 with 7 supplements
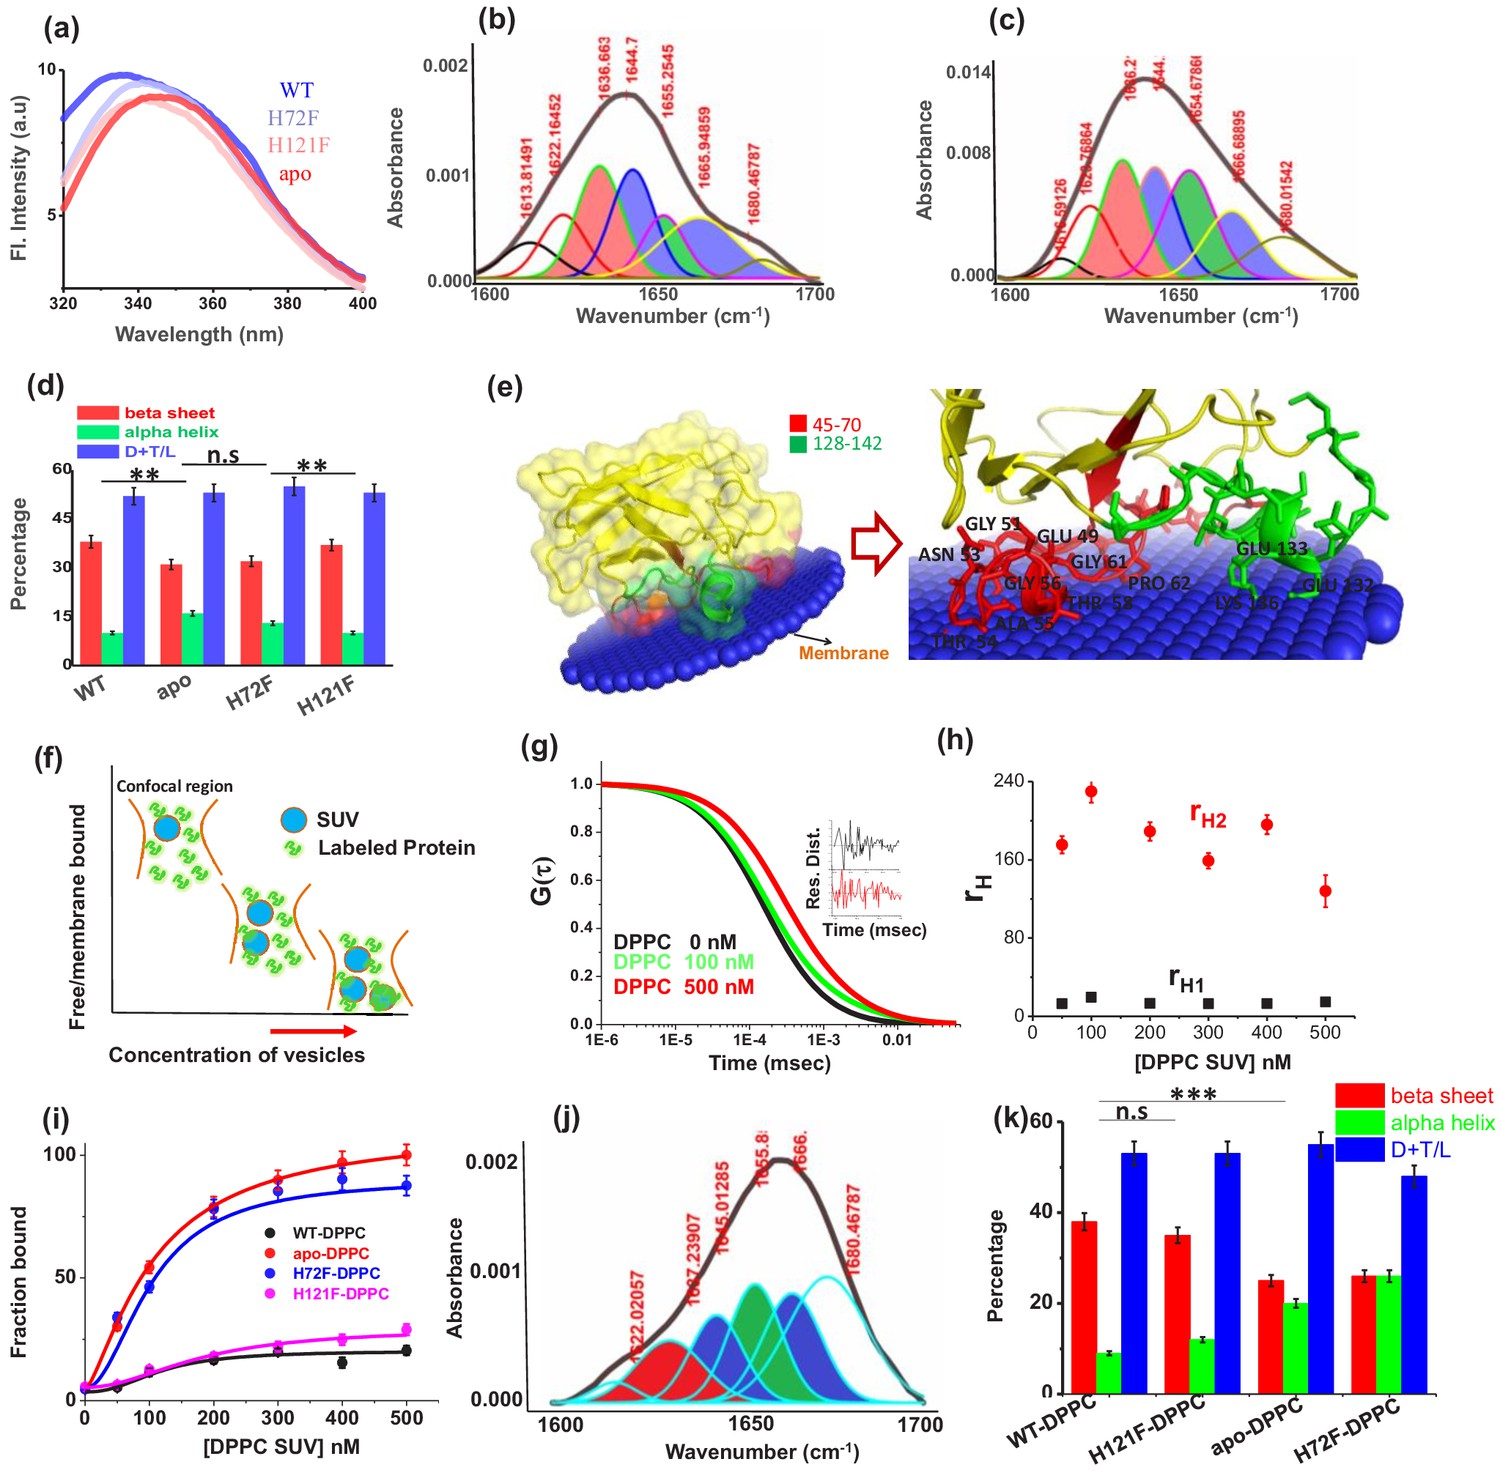
Structural characterization of SOD1 mutants and membrane association.
(a) Steady-state tryptophan fluorescence spectra of WT, apo, and other two metal mutants (H121F and H72F). The WT displays an emission maximum at 332 nm, whereas the apo variant shows a red-shifted spectrum with the emission maximum at 350 nm. On the other hand, H121F and H72F show emission maxima at intermediate wavelengths. Deconvoluted FTIR spectral signatures of (b) WT and (c) apo. Red contour (~1637 cm−1) indicates beta sheet; blue color contour stands for disorder (1644 cm−1) and loops and turns (~1667 cm−1); green contour represents alpha helical character. All these secondary signatures were obtained by considering the amide-I spectra, which arises due to carbonyl frequency (C = O). (d) Percentage of different secondary structural components in WT, apo, H121F, and H72F are shown in this figure. n.s denotes nonsignificant change, while ** stands for significant change with p-value<0.01. Error bars indicate the standard deviation of the data, which were obtained from triplicate experiments. Here, D + T/L stands for Disorder +Turns/Loops. (e) The membrane association of the apo protein as suggested by the OPM calculations. The membrane association of apo protein through the stretches 45–70 and 128–142 has been evaluated from the calculations. The residues which are involved in binding with membrane (Thr54,58, Ala54, Gly56,61, Pro62, Asn53, Glu49, Lys136, Glu132,133) are mentioned. (f) A schematic representation regarding the membrane binding experiments through FCS which suggests that with increasing concentration of DPPC small unilamellar vesicles (SUVs), the alexa labeled free monomeric protein populations (fast component of diffusion model) decreases with concomitant increase in the membrane bound labeled protein that is the slow component. (g) The correlation functions of alexa 488 maleimide labeled apo SOD1 in the absence (black) and presence of DPPC SUVs (red) where DPPC concentration was kept 500 nM. The green correlation curve corresponds to an intermediate DPPC concentration (100 nM). The inset shows the residual distributions of the correlation curves. (h) The hydrodynamic radii of free alexa 488-apo SOD1 and membrane bound labeled apo SOD1 were plotted against the concentrations of added DPPC SUVs. The average hydrodynamic radius of fast component that is free monomeric apo SOD1 (rH1) was found to be 13.5 Å, whereas the average radius for slow membrane bound protein molecule (rH2) was found to be 170 Å. The change of rH1 and rH2 with increasing DPPC SUV concentration remains invariant. (i) Percentage populations of membrane bound alexa-labeled protein variants were plotted against the concentrations of DPPC SUVs added to evaluate the binding affinities of the protein variants towards membranes. (j) Deconvoluted FTIR spectra of apo in membrane (DPPC SUV) bound condition. (k) Percentage of different secondary structural components in WT, apo, H121F, and H72F in the presence of DPPC SUVs are shown in this figure. n.s denotes nonsignificant change, while *** stands for significant change with p-value<0.001.
-
Figure 2—source data 1
Structural characterization and membrane binding of SOD1 protein variants.
- https://cdn.elifesciences.org/articles/61453/elife-61453-fig2-data1-v2.xlsx
Figure 2—figure supplement 1
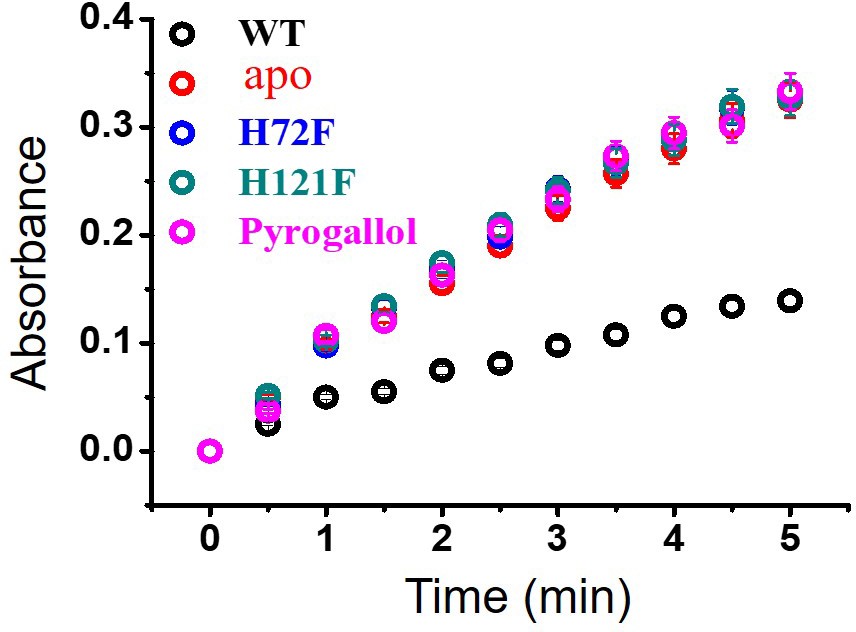
Activity assay (pyrogallol auto-oxidation) for WT and other metal mutants of SOD1.
Error bar indicates the standard deviation for the triplicate measurements.
Figure 2—figure supplement 2
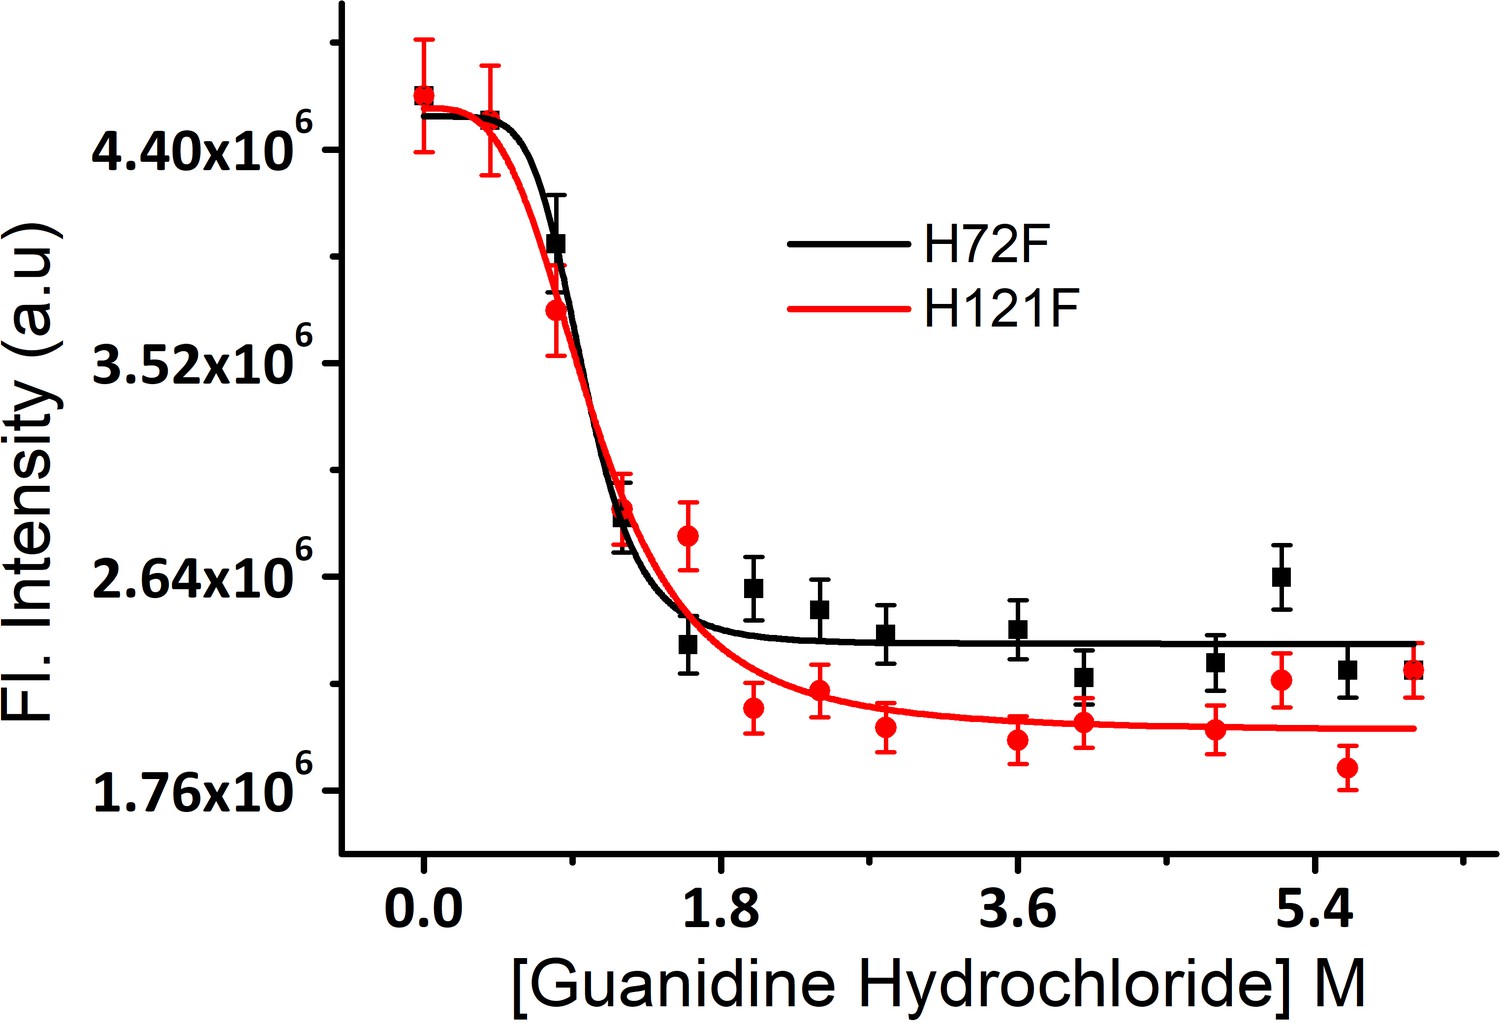
Equilibrium unfolding transitions of H121F and H72F mutants using guanidinium hydrochloride as chemical denaturant.
Error bar indicates the standard deviation using triplicate measurements.
Figure 2—figure supplement 3
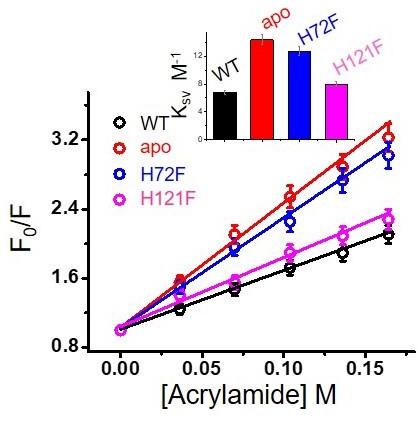
Acrylamide quenching experiments for the different variants.
Inset shows the values of Ksv of different protein species. Error bar indicates the standard deviation for the triplicate experiments.
Figure 2—figure supplement 4
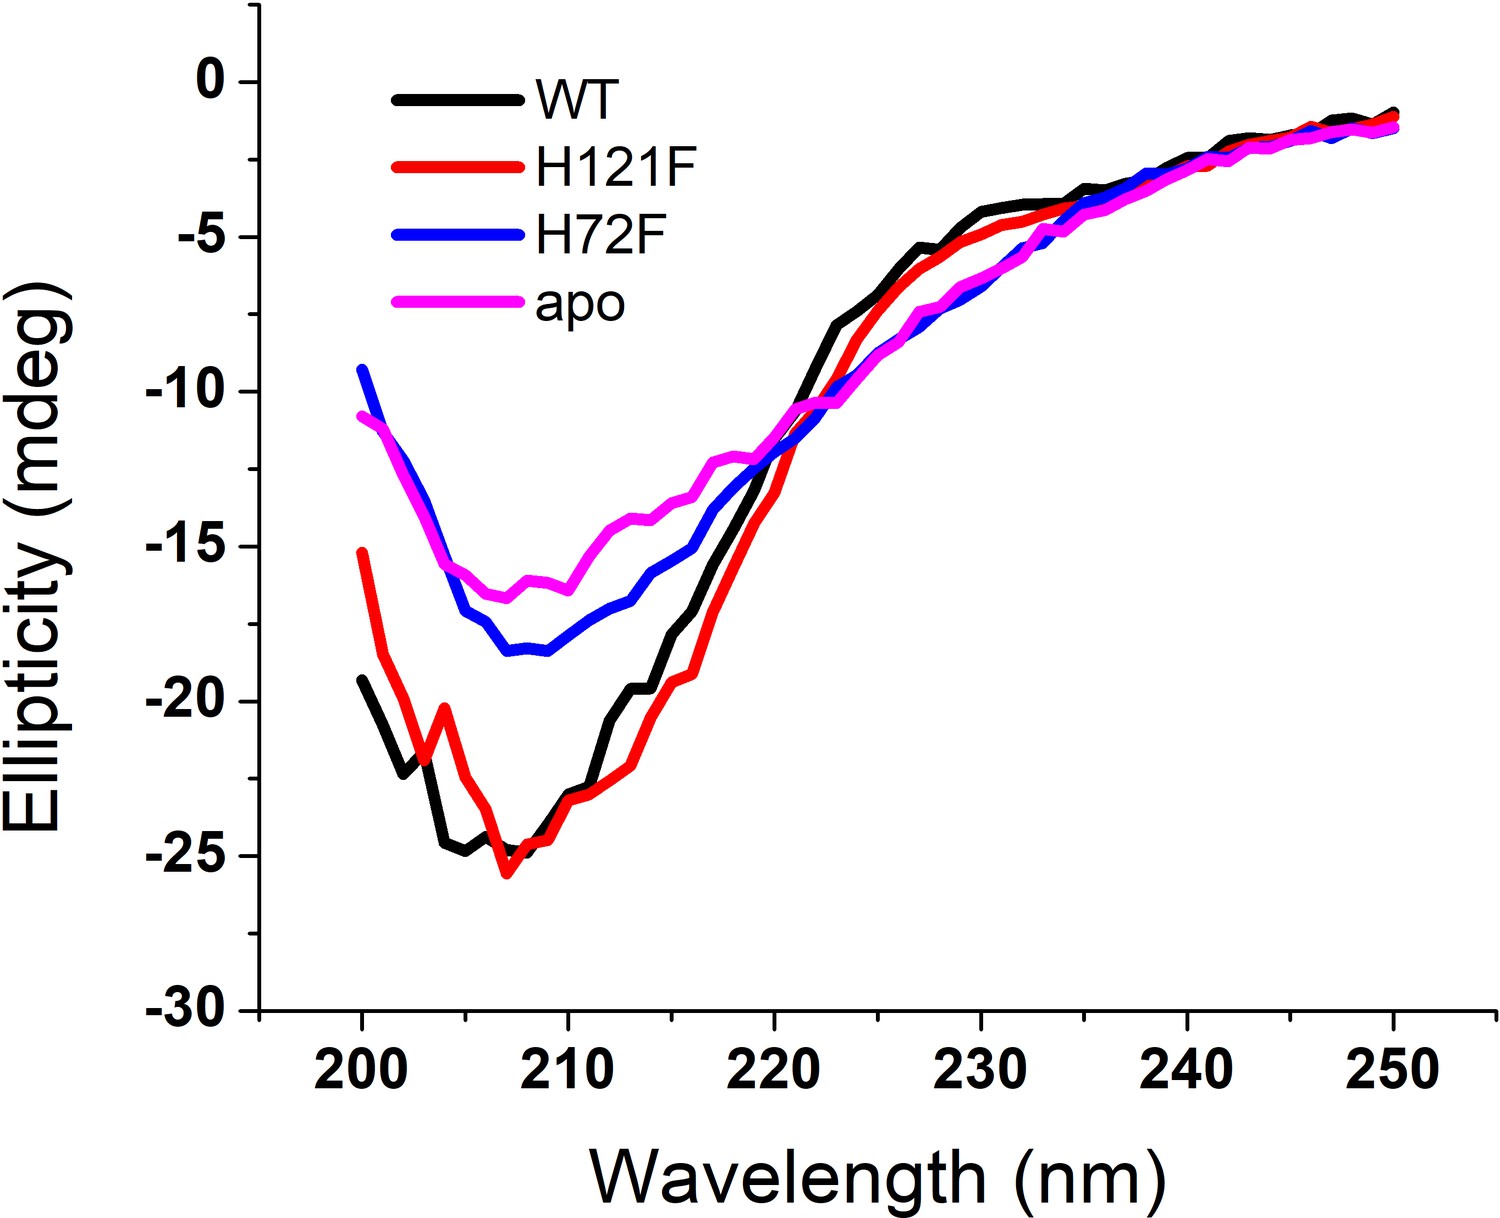
Far UV-CD spectra of the SOD1 variants.
Figure 2—figure supplement 5

Second derivative of the FT-IR data obtained with WT SOD1.
The peak positions were selected from the minima (marked red) for further deconvolution towards secondary structure estimations.
Figure 2—figure supplement 6
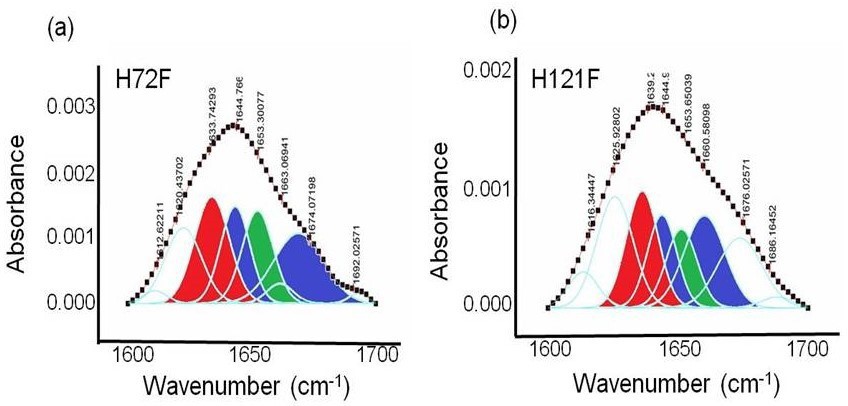
FTIR assessment of the H72F and H121F mutant.
Deconvoluted FTIR spectra of the amide I region of C = O bond vibrations in case of (a) H72F and (b) H121F. Red contour (~1637 cm−1) indicates beta sheet, blue color contour stands for disorder (1644 cm−1) and loops and turns (~1667 cm−1); green contour represents alpha helical character (~1653 cm−1).
Figure 2—figure supplement 7
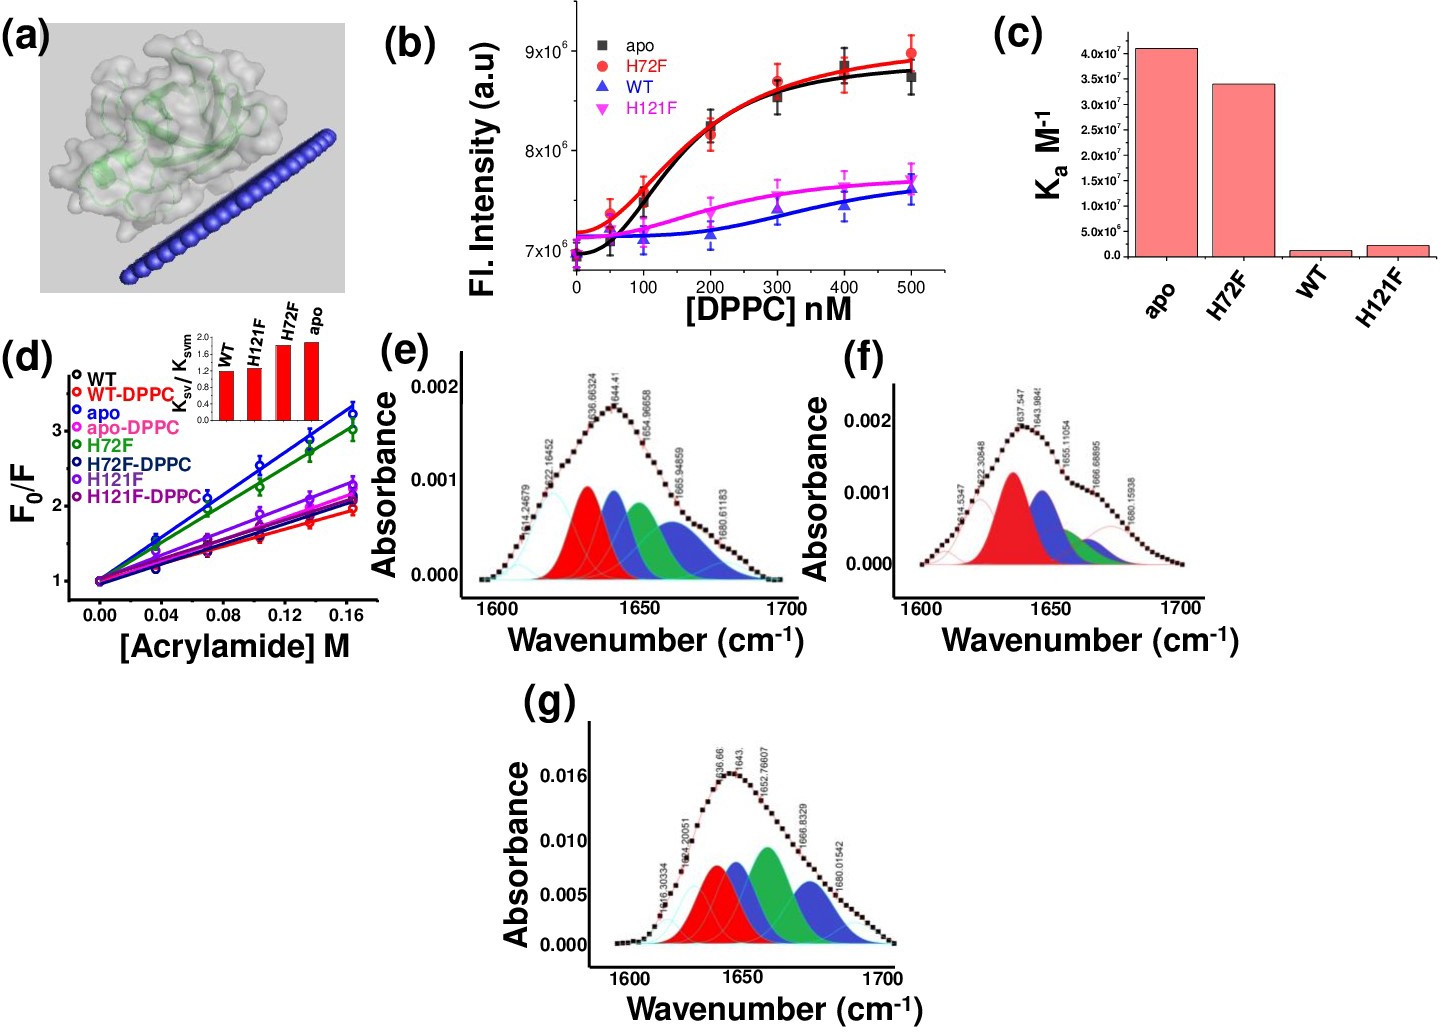
Membrane binding and conformational changes of the protein variants.
(a) Membrane attachment of WT SOD1 with membrane as predicted with OPM. (b) Changes in tryptophan fluorescence for WT, apo, H121F, and H72F with increasing concentrations of DPPC SUVs to estimate the binding affinities towards membrane. (c) Binding constants (Ka) of WT, apo, H121F, and H72F with DPPC SUVs as obtained from tryptophan fluorescence spectra measurements with increasing concentration of DPPC SUVs. (d) Acrylamide-quenching experiments to probe the solvent exposure of Tryp 32 in the presence and absence of membranes. The inset shows the ratio of Ksv and Ksvm for the four SOD1 variants. Deconvoluted FTIR spectral signatures of (e) WT, (f) H121F, and (g) H72F in membrane-bound conditions. The red region indicates the beta sheet conformation, blue color coded region stands for the disorder and loops and turns conformations, and the green color coded region denotes the alpha helical content.
Figure 3 with 3 supplements

Aggregation of WT SOD1 and its mutants and membrane effects.
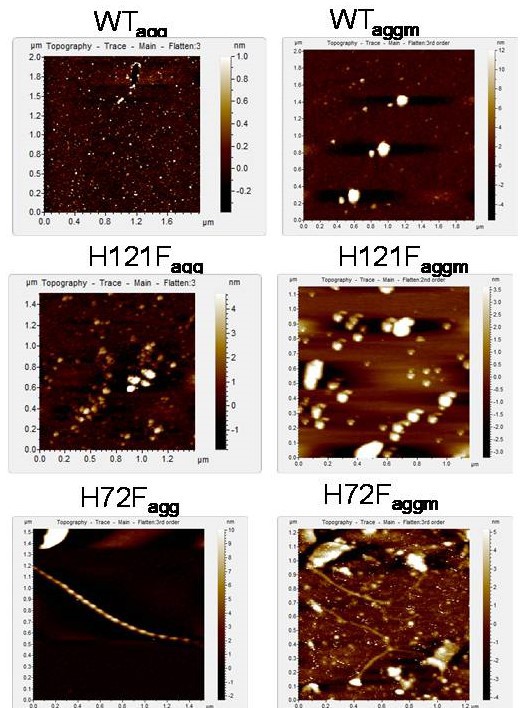
(a) ThT fluorescence (at 484 nm) for the protein variants under reducing conditions to monitor the kinetics of aggregation. (b) Time-dependent increase in ThT fluorescence intensity of WT and apo both in the absence and in the presence of membrane (DPPC SUVs were used here as membrane). (c) Same as (b) but for H72F and H121F. Atomic force microscopy (AFM) images of the aggregates of apo SOD1 in the absence (d) and presence (e) of DPPC SUVs. These AFM images were taken at the plateau of the ThT aggregation curves. AFM images of apoagg showed linear fibrillar aggregates with an average size 1.8–2 μm. In contrast in the presence of membrane (apoaggm), we found network of small fibrils, which were connected by DPPC vesicles (as drawn in the inset of e). It may be noted that the size and height (average diameter is 70 nm and average height is 7 nm) of the connecting spherical objects are similar to (f) AFM micrograph of the control DPPC SUVs, which showed distinct membrane structures with an average size of 70–90 nm.
-
Figure 3—source data 1
Aggregation and effect of membrane curvature and composition on the aggregation behavior of SOD1 protein variants.
- https://cdn.elifesciences.org/articles/61453/elife-61453-fig3-data1-v2.xlsx
Figure 3—figure supplement 1
AFM topographic images of the aggregates of different protein samples at the final points of aggregation.
Figure 3—figure supplement 2
Effect of membrane curvature on binding and aggregation.
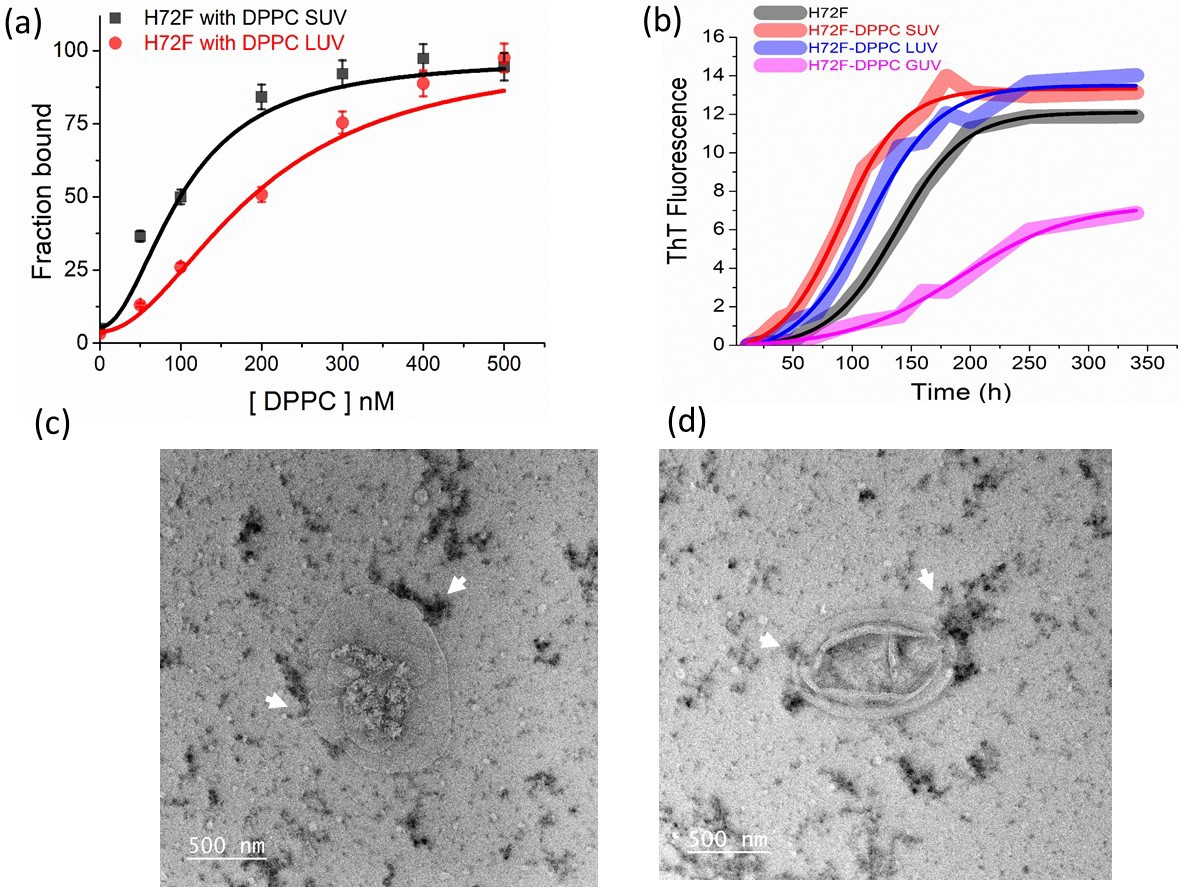
(a) Binding of H72F mutant with DPPC SUV and LUVs as estimated from FCS experiments. (b) ThT fluorescence experiments of H72F mutant in the presence of DPPC SUVs, LUVs, and GUVs to measure the aggregation behavior of H72F in the presence of membranes of different curvatures. The TEM micrographs of H72F aggregates in the presence of GUVs (c, d). The arrow marks indicate the presence of H72F aggregates near the GUVs.
Figure 3—figure supplement 3
Effect of membrane composition on binding and aggregation.
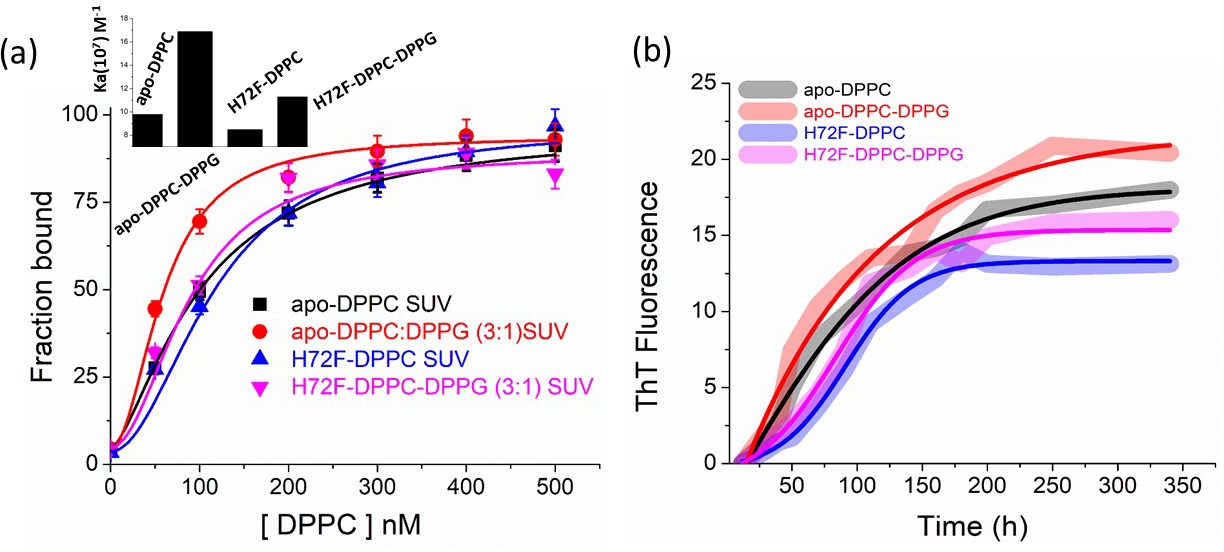
(a) Binding of H72F and apo protein variants with membranes (DPPC SUVs) of different compositions using FCS experiments. We have used DPPC and DPPC:DPPG in the ratio of 3: one for the binding experiments. Inset shows the binding constants of the protein variants with the SUVs of different lipid compositions. (b) ThT aggregation assay of apo and H72F in the presence of different lipid compositions.
Figure 4 with 6 supplements
Membrane deformation by protein aggregates.
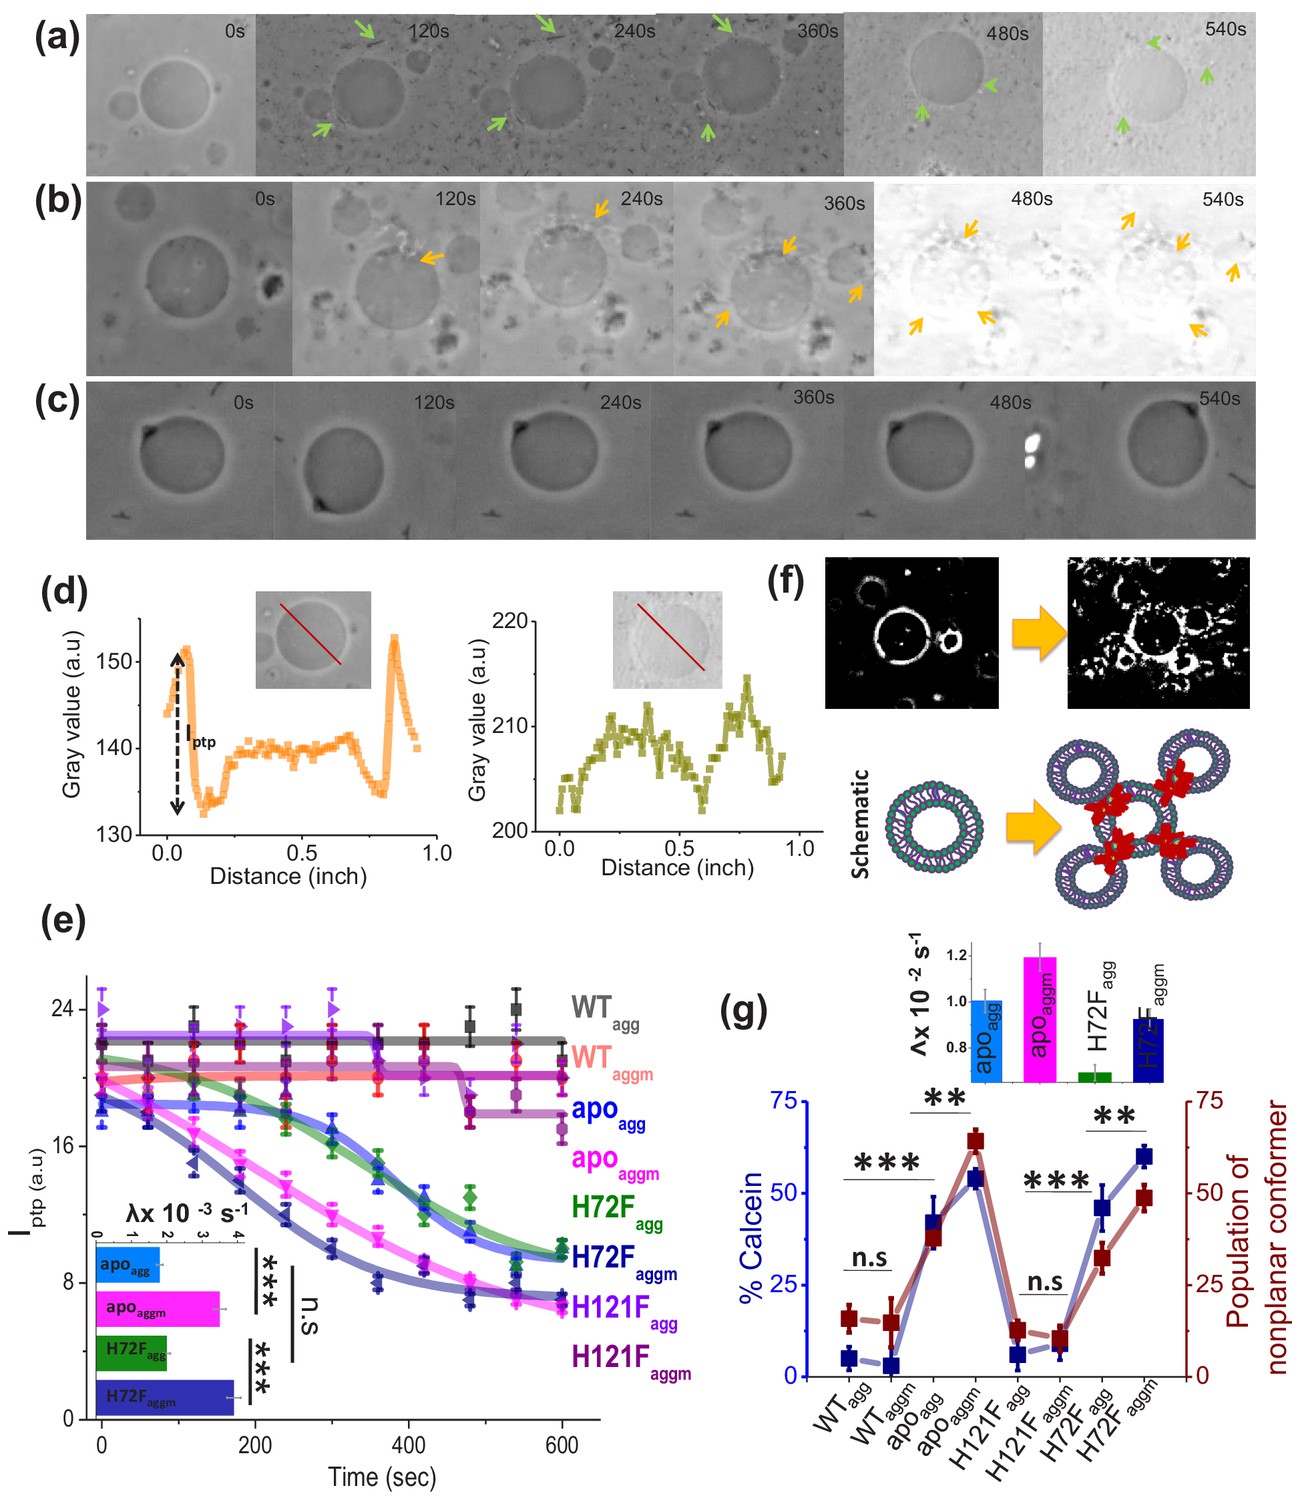
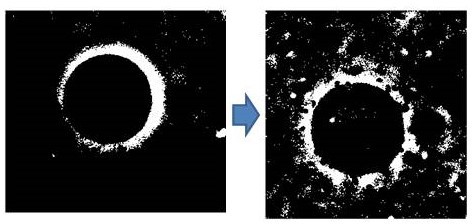
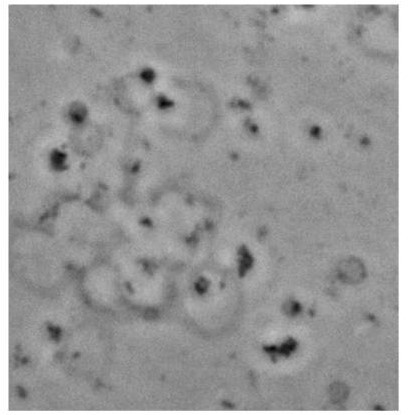
Time variations of phase-contrast micrographs of a single GUV when GUVs were treated with (a) apoagg, (b) apoaggm, and (c) WTagg. The images show gradual contrast loss, the loss of lamellarity and aggregate association with the vesicles for (a) and (b), while (c) does not show any change. (b) also shows few vesicles assemblies as induced by aggregates (also refer to a high contrast image below). The protein aggregates and their association with GUVs have been marked by green and yellow arrows. (d) The pictorial definition of Iptp and how Iptp changes for an intact (left) and porus (right) vesicle. (e) The values of Iptp are plotted for different protein aggregates with time. The inset of this figure shows the rate of deformation (λ, s−1) for apoagg/apoaggm and H72Fagg/H72 Faggm. The typical sizes of the GUVs were ~30 μm. (f) High-contrast images of GUVs show vesicular assembly in the presence of apoaggm, which is also schematically described in the figure below using a drawing. The schematic representation shows that apoaggm can act as a connector between multiple GUVs. (g) Plot of calcein leakage percentage and the population of nonplanar rotamers (these rotamers arise at 1367 cm−1 vibrational frequency region of hydrocarbon lipid chains on treatment with different protein aggregates). Here, the subscripts agg and aggm stand for the aggregates of the respective protein species at the plateau region of the aggregation profiles, which were formed in the absence and presence of membrane (DPPC SUVs), respectively. The inset of this figure shows the rate of fluorescence growth(∧, s−1) due to aggregate induced pore formation mediated calcein dye leakage from the SUVs that mimic synaptic vesicles (composition of lipid: DOPC:DOPE:DOPS in the ratio 2:5:3). Here, n.s designates nonsignificant change, whereas ** stands for significant (p-value<0.01) and *** for highly significant (p-value<0.001). The error bars indicate the standard deviation of triplicate experimental data.
-
Figure 4—source data 1
Toxicity of the aggregates .
- https://cdn.elifesciences.org/articles/61453/elife-61453-fig4-data1-v2.xlsx
Figure 4—figure supplement 1

MTT assay to detect the cell viability of neuronal cells (SHSY5Y) when treated with different aggregates of SOD1 protein variants.
The concentration of the aggregate for each sample was taken 5 μM. Error bar indicates the standard deviation as obtained from triplicate measurements. n.s stands for nonsignificant data. For the significant changes, *p-value<0.05; **p-value<0.01; ***p-value<0.001.
Figure 4—figure supplement 2
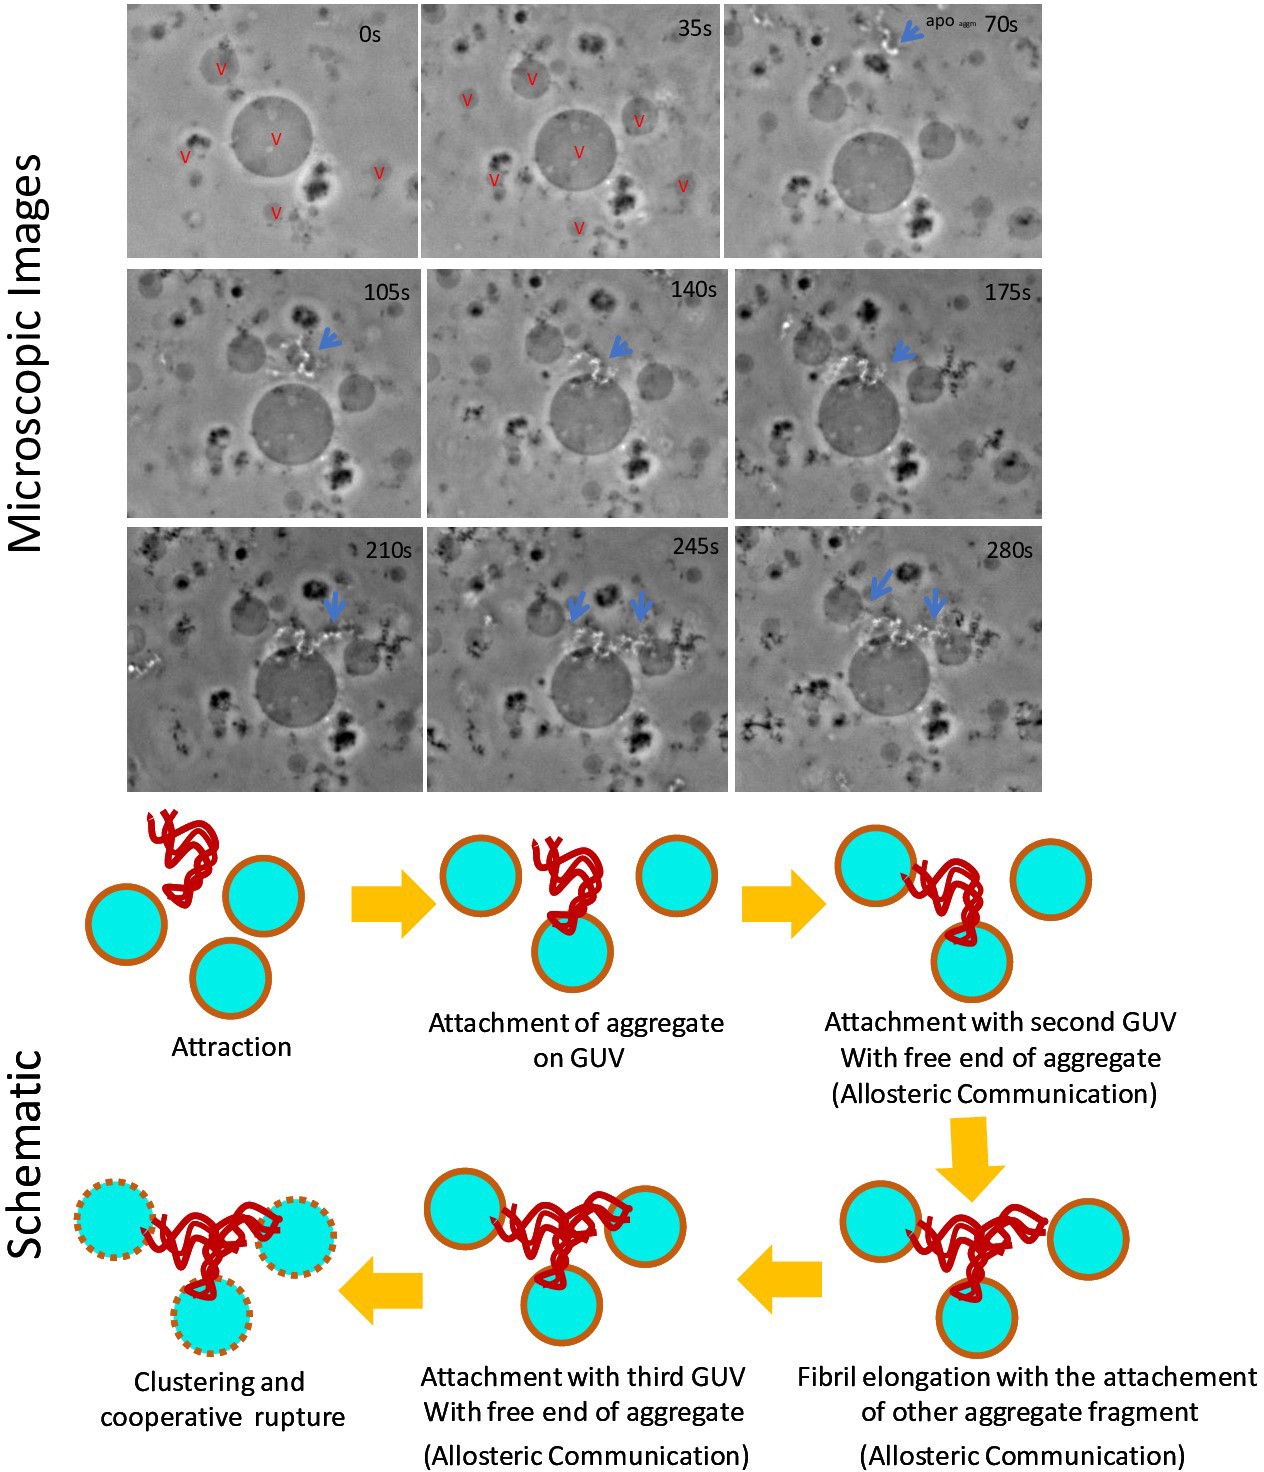
Time scale optical microscopic images of GUVs when these were treated with apo aggm.
The size of the central vesicle is ~30 μm. Stepwise deformation kinetics and GUV clustering by aggregates were shown in the image panel as well as in the schematic diagram. The observation suggested that the attachment of a fibril occurred first on a GUV surface. Then the free site of the aggregate interacted with other GUV of the proximity presumably through allosteric communication mechanistic way. Next, other small fibrillar aggregate species got attached with the previous GUV-attached fibril for elongation and there after it got bound with nearest another vesicle. Finally, vesicle clustering happened by the aggregates and GUV deformation/rupture took place. Here ‘v’ stands for vesicle.
Figure 4—figure supplement 3
High contrast images of the GUV when it was treated with apoagg.
The use of apoagg also resulted in vesicle fusion, but the extents and the number of participating vesicles were found to be more in the case of apoaggm (Figure 4f).
Figure 4—figure supplement 4
Assembly of vesicles/GUV clustering when GUVs were treated with H72Faggm.
Figure 4—figure supplement 5
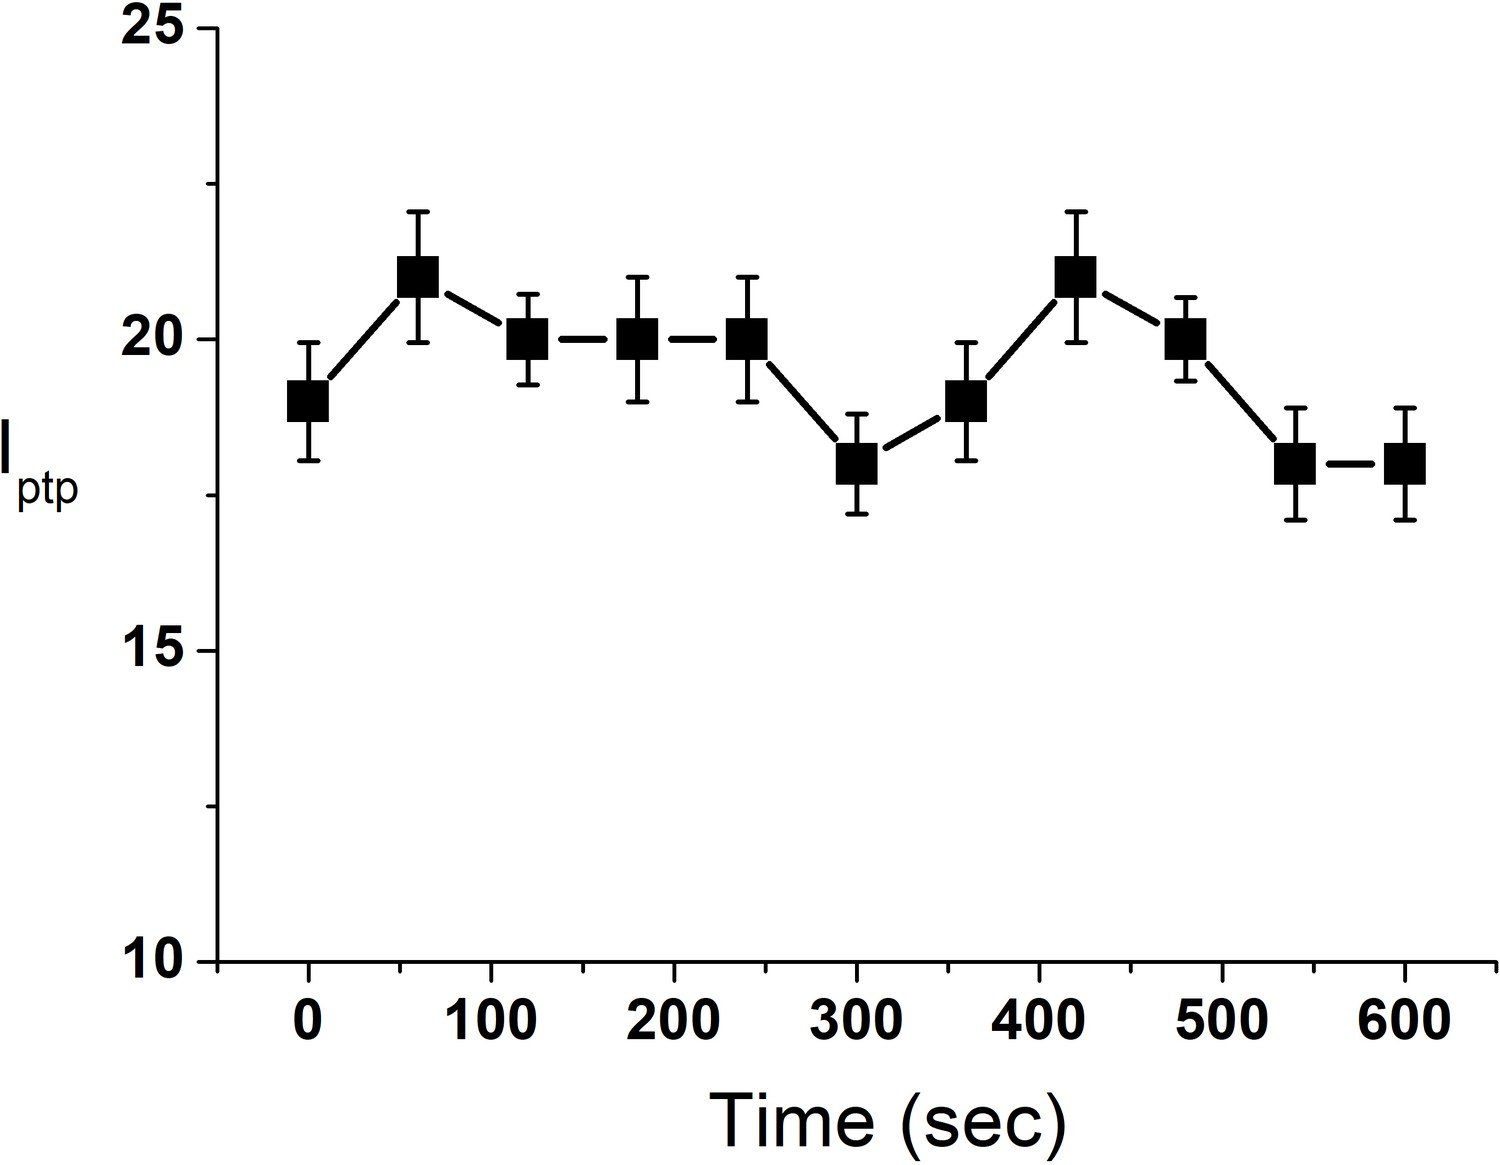
Change in Iptp of a single GUV in presence of DPPC SUVs (10 μM).
Iptp value is a representative of three independent replicates. Error bar stands for standard deviation from three measurements.
Figure 4—figure supplement 6

Effect of aggregates on membrane deformation.
(a) Calcein release assay to probe the membrane rupture and pore formation in SUVs mimicking the synaptic vesicle composition (DOPC:DOPE:DOPS in the ratio 2:5:3), while these SUVs were treated with different protein aggregates. The full release/rupture of the synaptic vesicle mimicking SUVs in the presence of Triton X-100 was considered as 100% release with respect to which other aggregate induces leakage percentages were calculated. Here ‘control’ indicates the kinetics in absence of any additive. The fitting of the kinetics were done by exponential growth kinetics equation. (b) FTIR spectral signatures of the CH2 wagging band frequency of DPPC (1280–1440 cm−1). The green region (1637 cm−1) stands for the population of nonplanar gauche and kink conformers which were found to be got increased after the interaction of trans planar bilayer with apoagg/apoaggm and H72Fagg/H72 Faggm. It is to be noted that apoaggm and H72Faggm show higher population of nonplanar rotamers than apoagg and H72Fagg, respectively. On the other hand, insignificant changes were found when trans-planar bilayer was treated with WTagg, WTaggm, and H121Fagg, H121Faggm. (c) Schematic representation of the planar membrane perturbations by aggregates and the changes from trans to gauche rotamers of the hydrocarbon tail region. This kind of lipid’s hydrocarbon conformational change may induce the macropinocytosis in membrane by aggregate induced increased flexibility in the membrane.
Figure 5 with 6 supplements
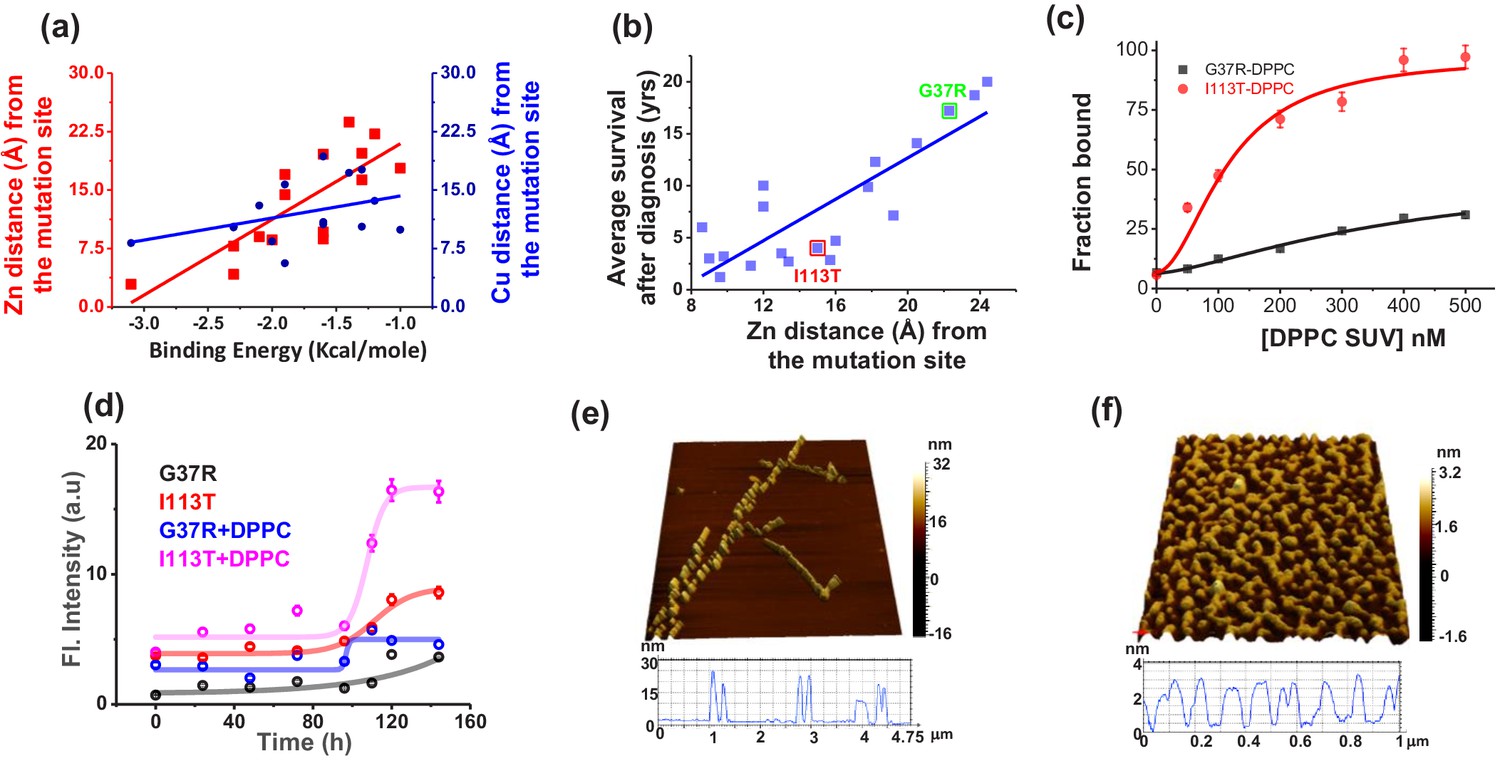
Validation in ALS disease mutants.
(a) Computational validation. The distances of the disease mutation sites from the Zn (red) and Cu (blue) co-factor were plotted against the binding energy towards membrane, which were computed. The binding energy decreased linearly as the distance between Zn and mutation site increased (red curve), while there was no significant change for Cu (blue curve). The distance information for these mutants was calculated from their solved structures. (b) The ALS disease severity in terms of average survival time after diagnosis has been plotted against the distance parameters of the mutation points from Zn centre for the disease mutants.(c) percentage populations of membrane bound alexa-labeled protein variants which were obtained from the two component diffusion model fitting of the FCS data for G37R and I113T were plotted against the concentrations of DPPC SUVs added to evaluate the binding affinities of the protein variants towards membranes. (d) Fibril formation kinetics. ThT fluorescence spectra of G37R and I113T were plotted in the absence and presence of DPPC SUVs. The 3D AFM images of I113T in absence (e) and presence (f) of membranes. Error bar indicates the standard deviation for the triplicate experiments.
-
Figure 5—source data 1
Conformational characterization, membrane binding, aggregation and toxicity of ALS disease mutants.
- https://cdn.elifesciences.org/articles/61453/elife-61453-fig5-data1-v2.xlsx
Figure 5—figure supplement 1
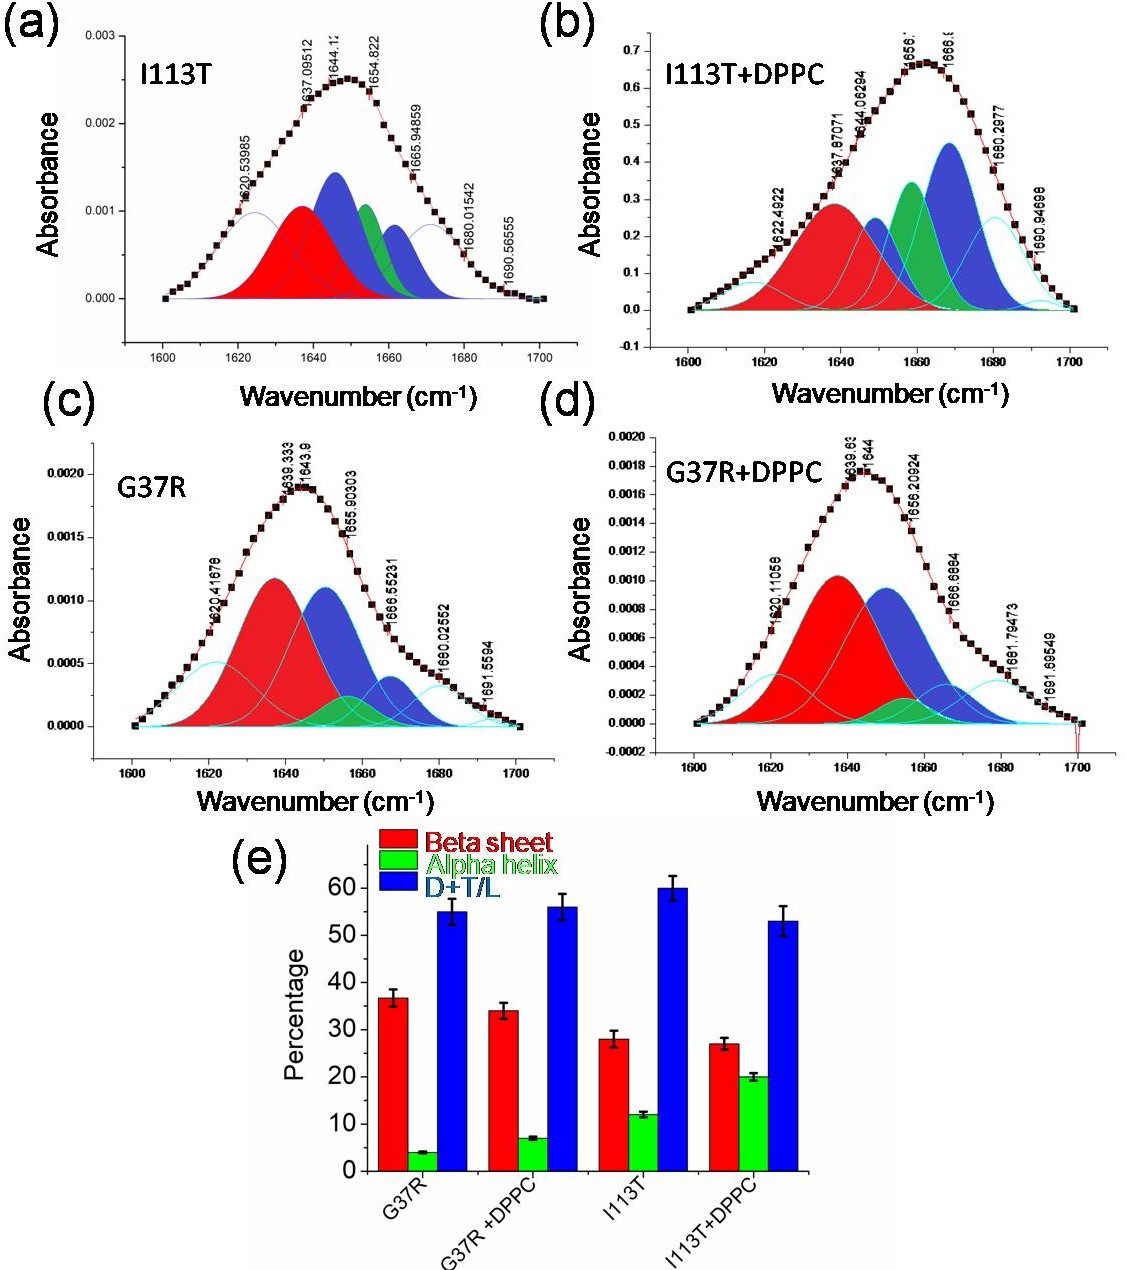
Conformational changes in disease mutants.
(a)–(d) Deconvoluted FTIR spectral signatures that correspond to the carbonyl vibrational frequency of amide-I region (1600–1700 cm−1) of I113T and G37R mutant both in the absence and in the presence of lipid membranes. (e) Percentages of secondary conformations of G37R and I113T disease mutants both in the absence and in the presence of DPPC SUVs. Error bar indicates the standard deviation for the triplicate experiments.
Figure 5—figure supplement 2
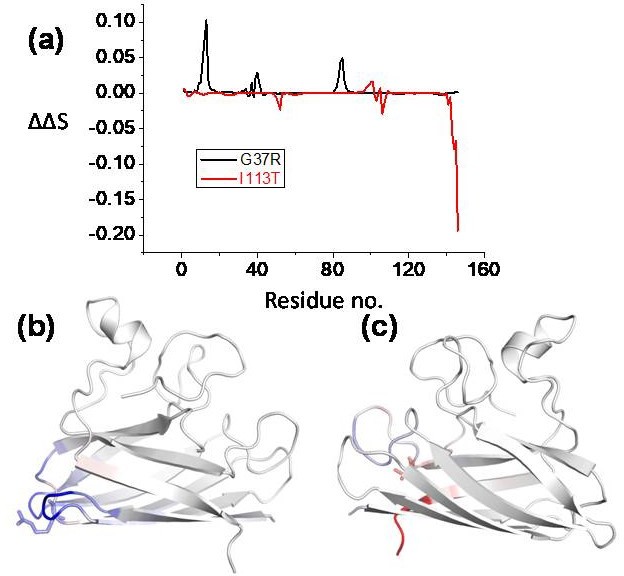
Effect of point mutations (here disease mutations) of the proteins flexibility, conformational stability and dynamics as predicted using DynaMut webserver (http://biosig.unimelb.edu.au/dynamut/).
(a) Residue-wise vibrational entropy changes for G37R and I113T; (b) the structure of G37R indicating the increase in the structural rigidity (blue color indicates the region becomes rigid due to the mutation); (c) structural flexibility increases in I113T mutant (red color indicates the region becomes more flexible due to mutation).
Figure 5—figure supplement 3
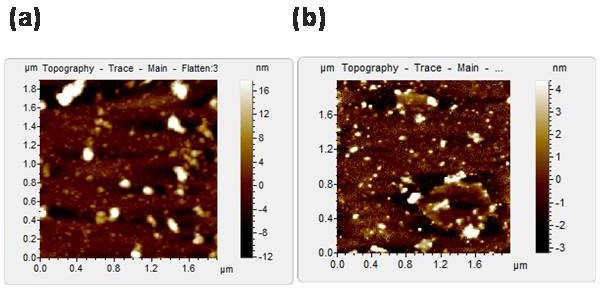
Aggregate morphology of G37R mutant.
AFM topographic images of the aggregates of G37R that was formed in the absence (a) and presence (b) of membrane.
Figure 5—figure supplement 4
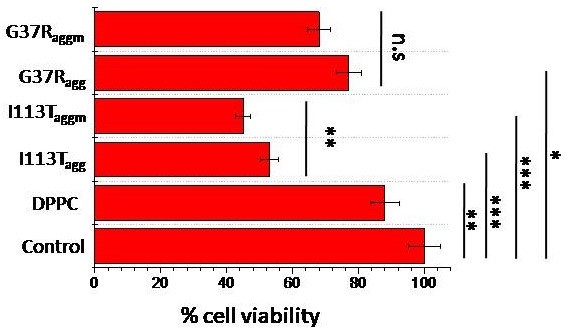
MTT assay to detect the cell viability of neuronal cells (SHSY5Y) when treated with different aggregates of SOD1 disease mutants.
The concentration of the aggregate for each sample was taken 5 μM. n.s. stands for nonsignificant data. For the significant changes, *p-value<0.05; **p-value<0.01; ***p- value<0.001. Error bar indicates the standard deviation for the triplicate experiments.
Figure 5—figure supplement 5
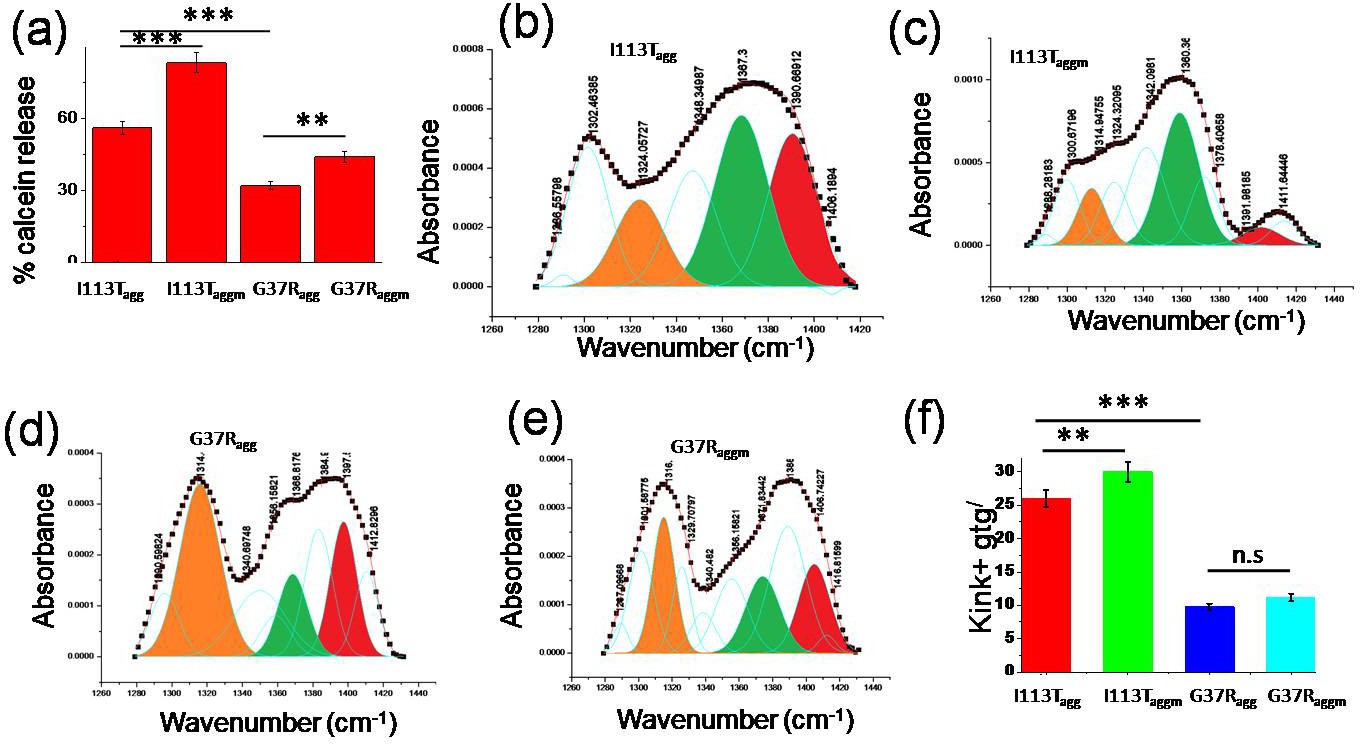
Effect of disease mutant aggregates on membrane deformation.
(a) Calcein release percentage when dye entrapped small unilamellar vesicles (SUVs) were treated with the aggregates of I113T and G37R, which were formed in the absence and presence of membranes. (b)–(e) The Gaussian fittings of the CH2 wagging band region of planar DPPC membrane after the treatments of different disease mutant aggregates. (f) Populations of nonplanar conformations in membrane bilayer that is perturbed by the aggregates of I113T and G37R, which are formed both in the absence and in the presence of membranes. Here n.s. denotes nonsignificant, whereas ** is significant with p-values<0.01 and *** is highly significant with p-values<0.001. I113Tagg and I113Taggm indicate the aggregates of I113T protein which are formed in the absence and presence of DPPC SUVs. G37Ragg and G37Raggm indicate the aggregates of G37R protein that are formed in the absence and presence of DPPC SUVs. Error bar indicates the standard deviations of the values obtained from experiments those were performed triplicate.
Figure 5—figure supplement 6
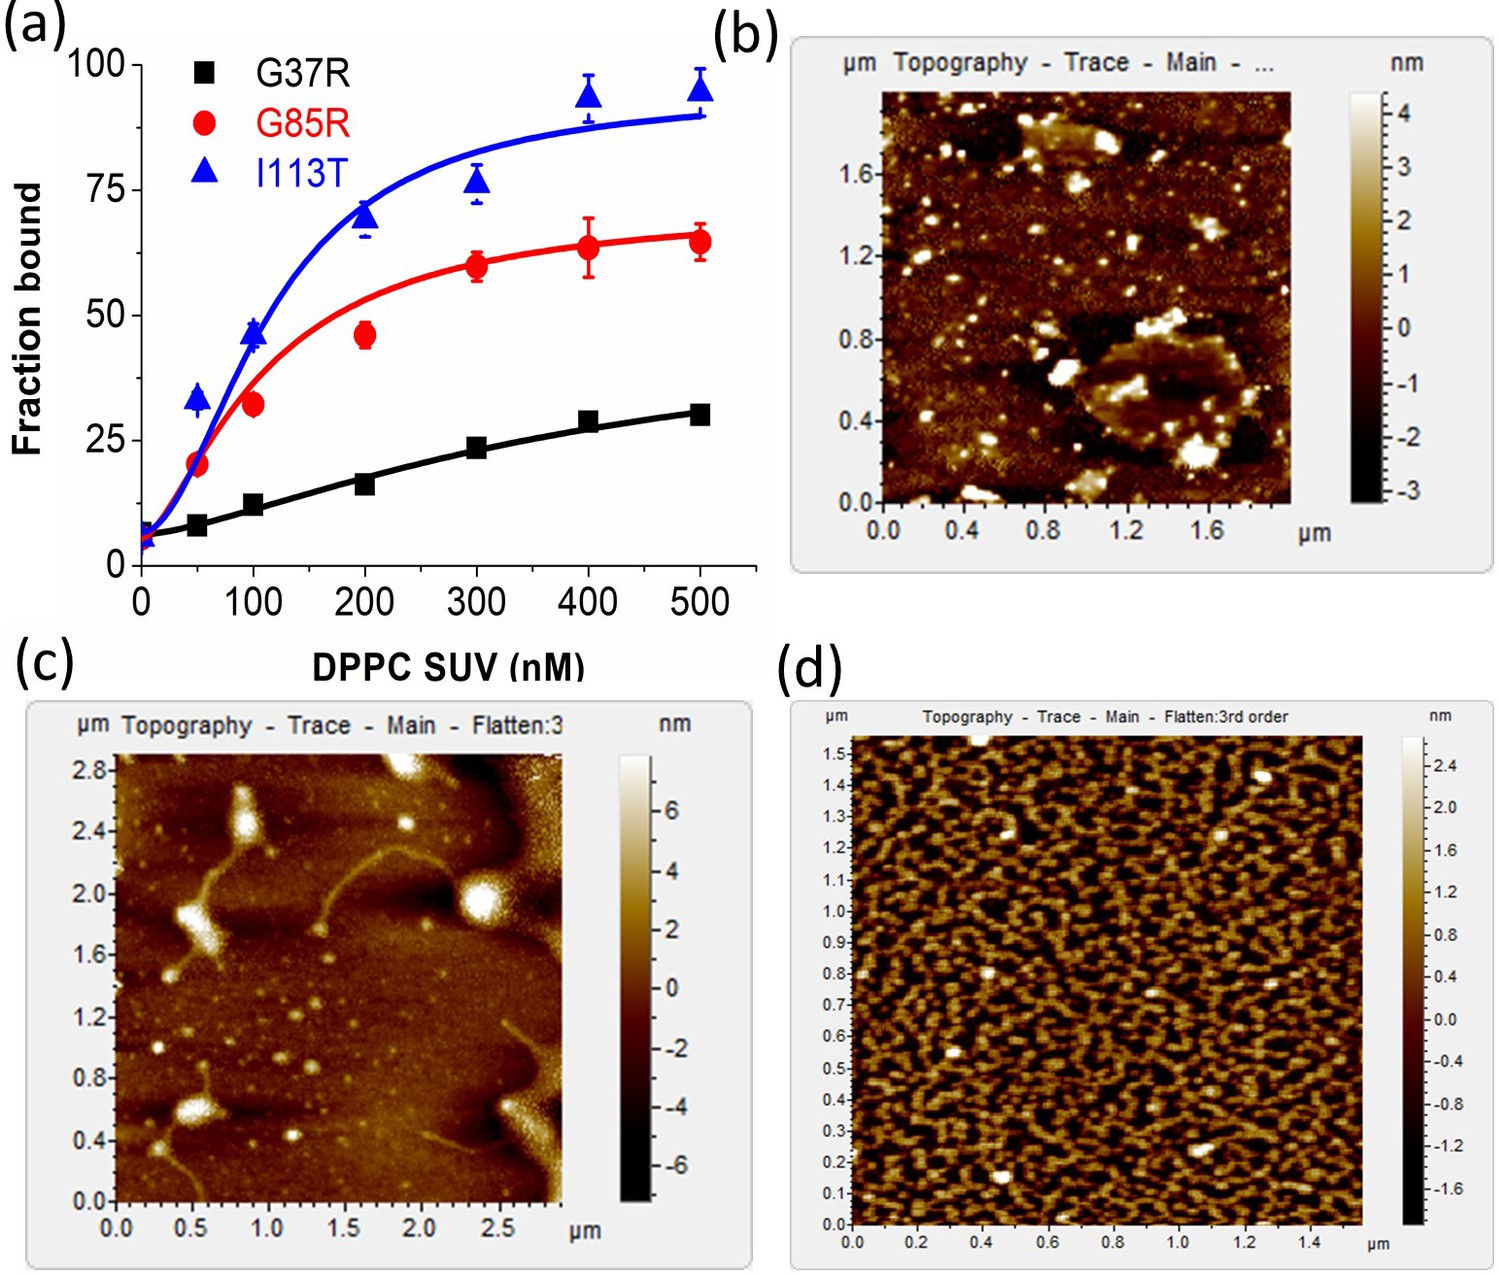
Comparative study of membrane binding and aggregation of different disease mutants.
(a) Plot of fraction bound of labeled proteins against the concentration of DPPC SUVs to estimate the binding constants of G37R, G85R, and I113T (labeled with Alexa-488 Maleimide) using FCS experiments. AFM micrographs for (b) G37R, (c) G85R, and (d) I113T in the presence of DPPC SUVs.
Figure 6
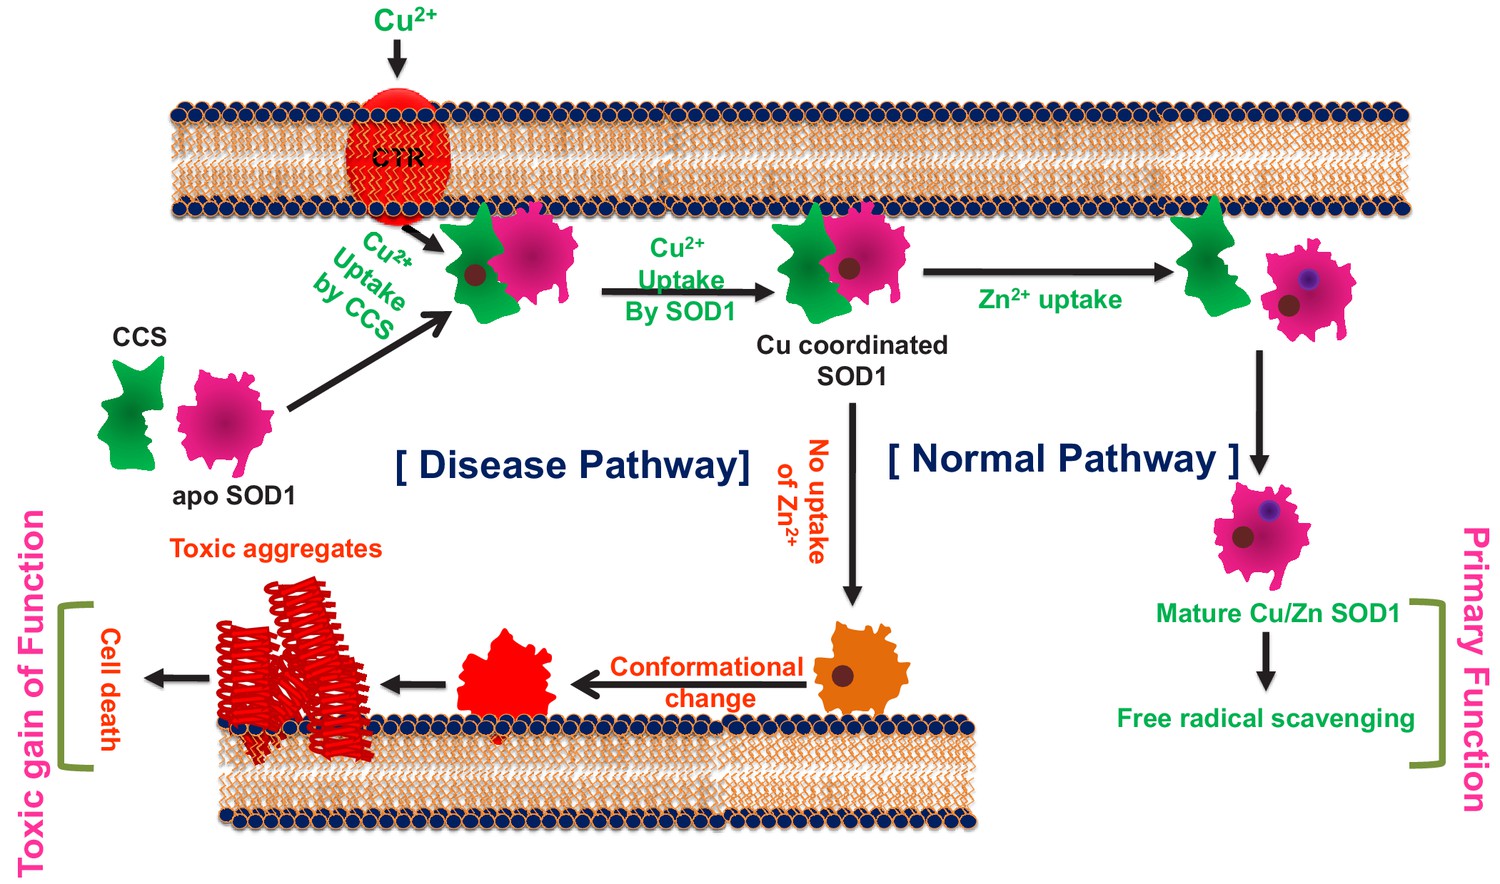
The cofactor-derived membrane association model of SOD1 primary and gain of function.
Tables
Table 1
Metal contents (Cu and Zn) in WT and other mutants (H121F, H72F, and apo) as obtained from atomic absorption spectroscopy.
| Protein forms | Cu content | Zn content |
|---|---|---|
| WT | 4.5 µM | 3.9 µM |
| H121F | <1 µM | 3.8 µM |
| H72F | 4.1 µM | <1.2 µM |
| apo | <0.5 µM | <0.25 µM |
Table 2
The values of Stern–Volmer quenching constants for Trp 32 residue of all the protein variants in the absence (Ksv,M−1) and presence of DPPC SUVs (Ksvm, M−1) as obtained from acrylamide quenching for WT SOD1 and all the mutants including apo SOD1.
| Proteins | Ksv | Ksvm | Ksv/Ksvm |
|---|---|---|---|
| WT SOD1 | 6.8 ± 0.1 | 5.7 ± 0.2 | 1.19 |
| H121F | 8.0 ± 0.1 | 6.3 ± 0.1 | 1.26 |
| H72F | 12.7 ± 0.3 | 7.0 ± 0.2 | 1.82 |
| apo SOD1 | 14.3 ± 0.1 | 7.6 ± 0.2 | 1.88 |
Table 3
Binding constants (Ka,M−1) of the protein variants with model DPPC SUVs as obtained from the FCS study for WT SOD1 and all the mutants.
| Systems | Asssociation constants (Ka,M−1) |
|---|---|
| WT SOD1 + DPPC SUV | (4.1 ± 0.1) × 106 |
| H121F + DPPC SUV | (5.2 ± 0.2) × 106 |
| H72F + DPPC SUV | (9.6 ± 0.4) × 107 |
| apo + DPPC SUV | (9.8 ± 0.1) × 107 |
| G37R-DPPC SUV | (2.2 ± 0.3) × 106 |
| I113T-DPPC SUV | (8.8 ± 0.2) × 106 |
Table 4
Log-phase mid-points of different protein variants obtained from ThT assay.
| Systems | Log-phase mid-point (h) |
|---|---|
| WT SOD1 | Not detectable |
| WT SOD1 + DPPC SUV | Not detectable |
| H121F | Not detectable |
| H121F + DPPC SUV | Not detectable |
| H72F | 167.2 |
| H72F + DPPC SUV | 90.8 |
| apo SOD1 | 112.8 |
| apo + DPPC SUV | 55.9 |
Table 5
SOD1 disease mutants, their corresponding distance parameters in terms of the distances of mutational stress points from the Zn and Cu center, and the membrane binding energies of the disease mutants.
| Mutants | Mutational points distances from zn center (Å) | Mutational points distances from Cu Center (Å) | Membrane binding energies (ΔG, kcal/mole) |
|---|---|---|---|
| A4V | 19.6 | 19.3 | −1.6 |
| C6A | 17 | 15.7 | −2.1 |
| G37R | 23.7 | 17.2 | −1.0 |
| L38V | 22.2 | 13.6 | −1.2 |
| H43R | 17.8 | 9.9 | −1.0 |
| H46R | 7.8 | 10.2 | −2.3 |
| H80R | 4.2 | 10.3 | −2.3 |
| G85R | 8.6 | 8.4 | −2.0 |
| G93A | 20.5 | 22.7 | −1.8 |
| C111A | 11.9 | 18.3 | −3.3 |
| C112S | 19.7 | 17.6 | −1.3 |
| I113T | 16 | 18.5 | −3.2 |
| D124V | 9 | 13 | −2.1 |
| H72F | 2.9 | 8.2 | −3.1 |
| H121F | 14.4 | 5.6 | −1.9 |
| S134N | 9.6 | 10.9 | −1.6 |
| C147S | 16.3 | 10.3 | −1.7 |
Key resources table
| Reagent type (species) or resource | Designation | Source or reference | Identifiers | Additional information |
|---|---|---|---|---|
| Cell line (Homo sapiens) | SH-SY5Y | National Centre for Cell Science, Pune, India | https://www.nccs.res.in/index.php/Nationalrepos/Repocellines | Neuroblastoma cell line |
| Recombinant DNA reagent | H72F (plasmid) | This paper | Clone used to generate H72F mutant (page 21) | |
| Recombinant DNA reagent | H121F (plasmid) | This paper | Clone used to generate H72F mutant (page 21) | |
| Recombinant DNA reagent | I113T (plasmid) | Genscript | ||
| Recombinant DNA reagent | G37R (plasmid) | Genscript | ||
| Recombinant DNA reagent | G85R (plasmid) | Genscript | ||
| Sequence-based reagent | H72F_F | Biotech Desk | PCR primer | cctcactttaatcctctatccagaaaattcggtgggccaaagg |
| Sequence-based reagent | H72F_R | Biotech Desk | PCR primer | cctttggcccaccgaattttctggatagaggattaaagtgagg |
| Sequence-based reagent | H121F_F | Biotech Desk | PCR primer | ggccgcacactggtggtctttgaaaaagcagatgactt |
| Sequence-based reagent | H121F_R | Biotech Desk | PCR primer | aagtcatctgctttttcaaagaccaccagtgtgcggcc |
| Commercial assay or kit | QuickChange XL site directed mutagenesis kit | Agilent | Cat# 200516 | |
| Commercial assay or kit | Vybrant MTT cell proliferation assay kit | Invitrogen | Cat# V-13154 | |
| Chemical compound, drug | 1,2-Dipalmitoyl-sn-glycero-3-phosphocholine (DPPC) | Avanti Polar Lipids Inc. | Cat# 850355 | |
| Chemical compound, drug | 1,2-Dioleoyl-sn-glycero-3-phosphoethanolamine (DOPE) | Avanti Polar Lipids Inc. | Cat# 850725 | |
| Chemical compound, drug | 1,2-Dioleoyl-sn-glycero-3-phospho-L-serine (DOPS) | Avanti Polar Lipids Inc. | Cat# 840035 | |
| Chemical compound, drug | Cardiolipin | Avanti Polar Lipids Inc. | Cat# 710335 | |
| Chemical compound, drug | 1,1'-Dioctadecyl-3,3,3',3'-tetramethylindotricarbocyanine iodide (DiIC-18(3)) | Invitrogen | Cat# D3911 | |
| Chemical compound, drug | Isopropyl ß-D-1-thiogalactopyranoside (IPTG) | Sigma Aldrich | Cat# I6758 | |
| Chemical compound, drug | Thioflavin T | Merck | Cat# T3516 | |
| Chemical compound, drug | Calcein AM | Merck | Cat# 17783 | |
| Software, algorithm | OPM server | Orientations of Proteins in Membranes | https://opm.phar.umich.edu/ppm_server | |
| Software, algorithm | AGGRESCAN | AGGRESCAN | http://bioinf.uab.es/aggrescan/ | |
| Software, algorithm | Image J | National Institutes of Health | https://imagej.nih.gov/ij/ | |
| Other | Alexa Fluor 488 C5 maleimide | Invitrogen | Cat# A10254 |
Additional files
Download links
A two-part list of links to download the article, or parts of the article, in various formats.
Downloads (link to download the article as PDF)
Open citations (links to open the citations from this article in various online reference manager services)
Cite this article (links to download the citations from this article in formats compatible with various reference manager tools)
The metal cofactor zinc and interacting membranes modulate SOD1 conformation-aggregation landscape in an in vitro ALS model
eLife 10:e61453.
https://doi.org/10.7554/eLife.61453


