The mechanism of kinesin inhibition by kinesin-binding protein
- Randall Centre for Cell and Molecular Biophysics, King’s College, United Kingdom
- Institute of Structural and Molecular Biology, Birkbeck, University of London, United Kingdom
- Cell Biology, Neurobiology and Biophysics, Department of Biology, Faculty of Science, Utrecht University, Netherlands
- Laboratory of Biomolecular Research, Division of Biology and Chemistry, Paul Scherrer Institut, Switzerland
- Department of Cancer Biology, Mayo Clinic, United States
- University of Basel, Biozentrum, Switzerland
Figures
Figure 1 with 3 supplements
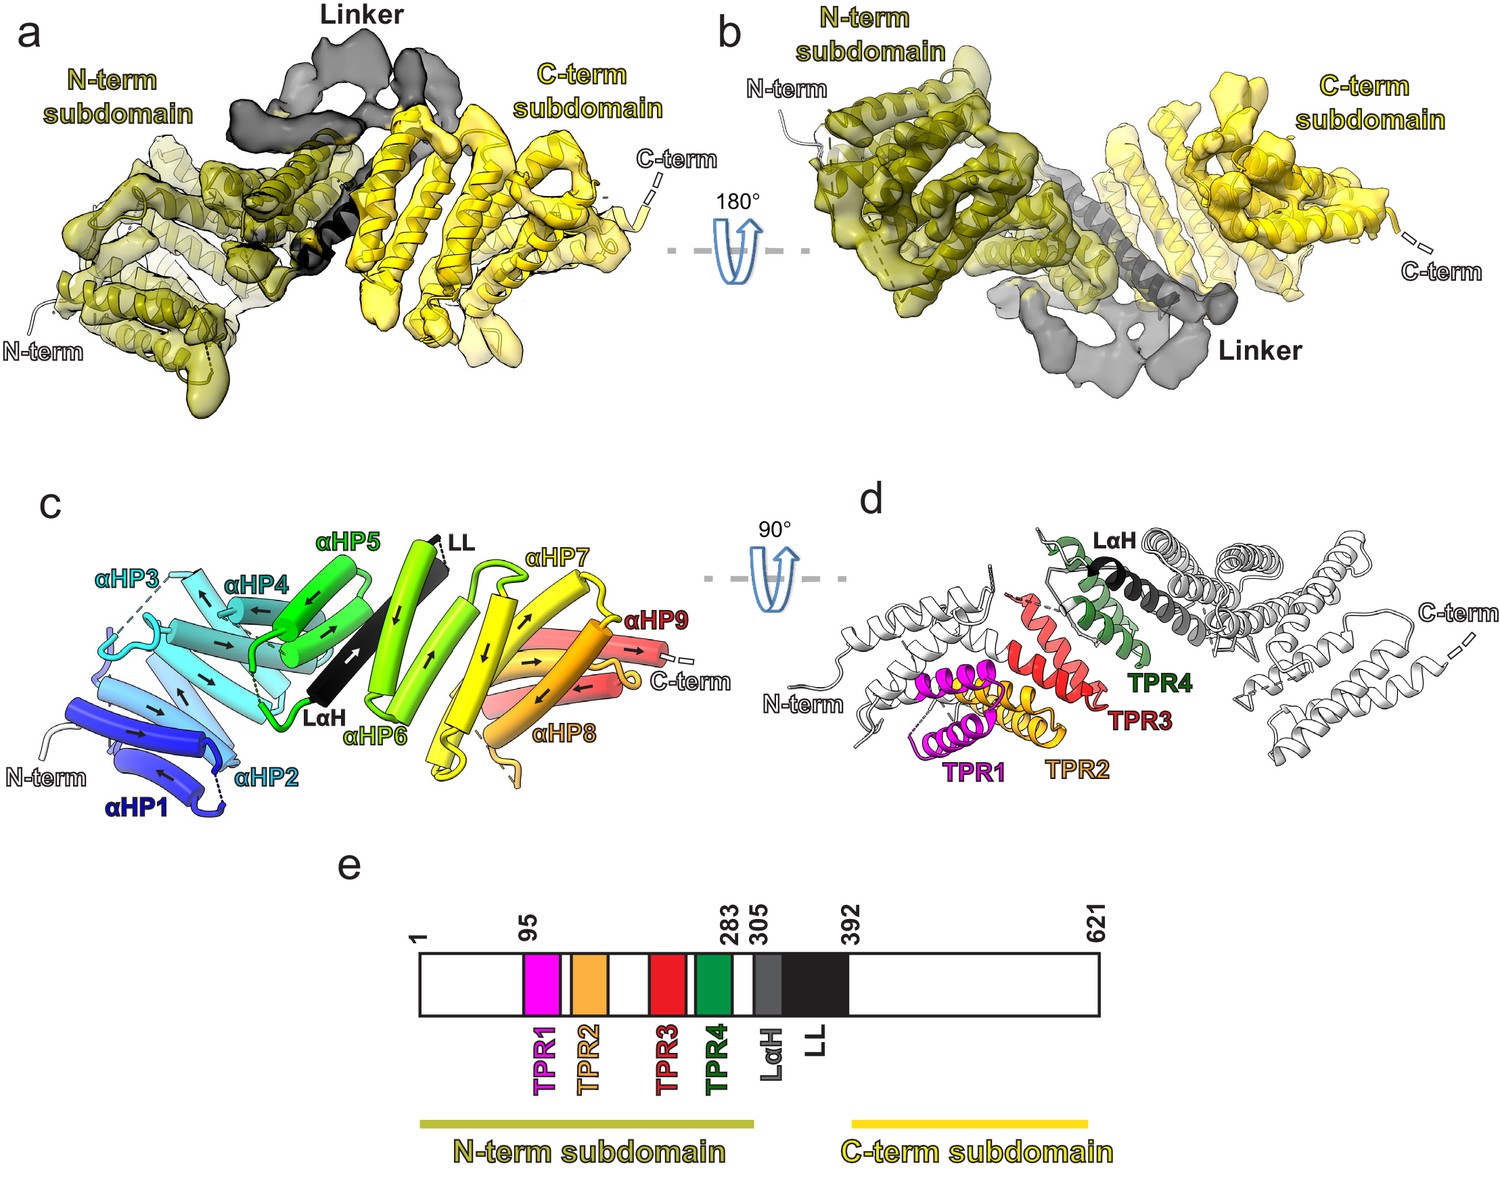
Kinesin-binding protein (KBP) is a tetratricopeptide repeat (TPR)-containing right-handed α-solenoid.
(a) Model of KBP (ribbon representation) displayed in experimental cryo-electron microscopy density. The N-terminal (olive) and C-terminal (gold) subdomains are separated by a linker region (black). Semi-transparent density is coloured regionally as per the fitted model. The N- and C-termini are shown, with a dotted line representing the disordered C-terminus (not modelled). The linker loop (LL) region was not modelled but its density is shown in semi-transparent black. (b) The same as panel a, but rotated 180° around the axis indicated. (c) The same view as in panel a, but with the density removed and α-helices displayed as pipes with their directionality indicated by arrows. The nine antiparallel α-helical pairs (αHP1–αHP9) are each coloured separately and labelled, as is the linker α-helix (LαH) and LL (dotted line). (d) Ribbon representation of KBP showing the four TPR motifs and the LαH coloured according to the labels. View related to panel c, by a 90° rotation around the indicated axis. (e) Schematic of the KBP showing the position of the TPR motifs between residue 95 and 283 of the N-terminal subdomain and position of the linker region (LαH and LL) between residues 305 and 392.
Figure 1—figure supplement 1
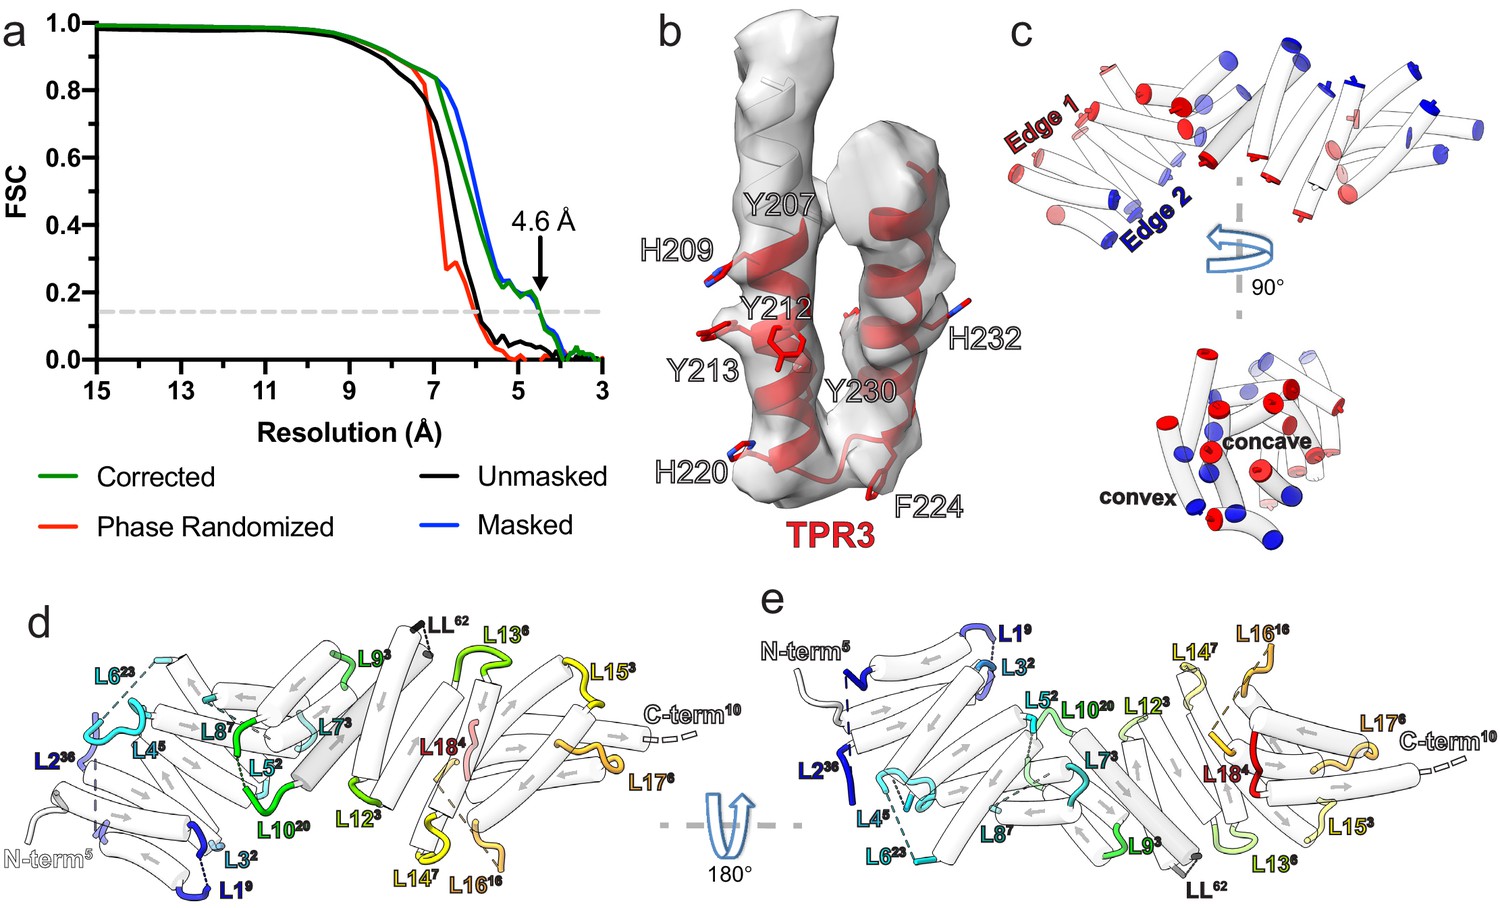
Kinesin-binding protein (KBP) reconstruction, structure, and loop lengths.
(a) Gold-standard Fourier shell correlation (FSC) curves between independent masked, unmasked, phase-randomised, and corrected half-maps (Chen et al., 2013) of KBP as calculated by RELION v3.1 (Zivanov et al., 2018) (4.6 Å resolution at the ‘gold-standard’ 0.143 FSC cutoff). (b) Density and fitted model for TPR3 of KBP, showing exemplar bulky side chain density that guided modelling. (c) Same view as Figure 1c (upper panel), or rotated 90° around the indicated axis (lower panel), showing only α-helices (semi-transparent white tubes) with their terminal residues coloured, illustrating the edges and faces (concave and convex) of the α-solenoid respectively. (d) Same view as panel c, but now with loops shown and coloured (semi-transparent tube helices have their directionality represented by arrows). Each loop or terminus label has a superscript number indicating their length. (e) Same as panel d, rotated 180° around the indicated axis.
Figure 1—figure supplement 2
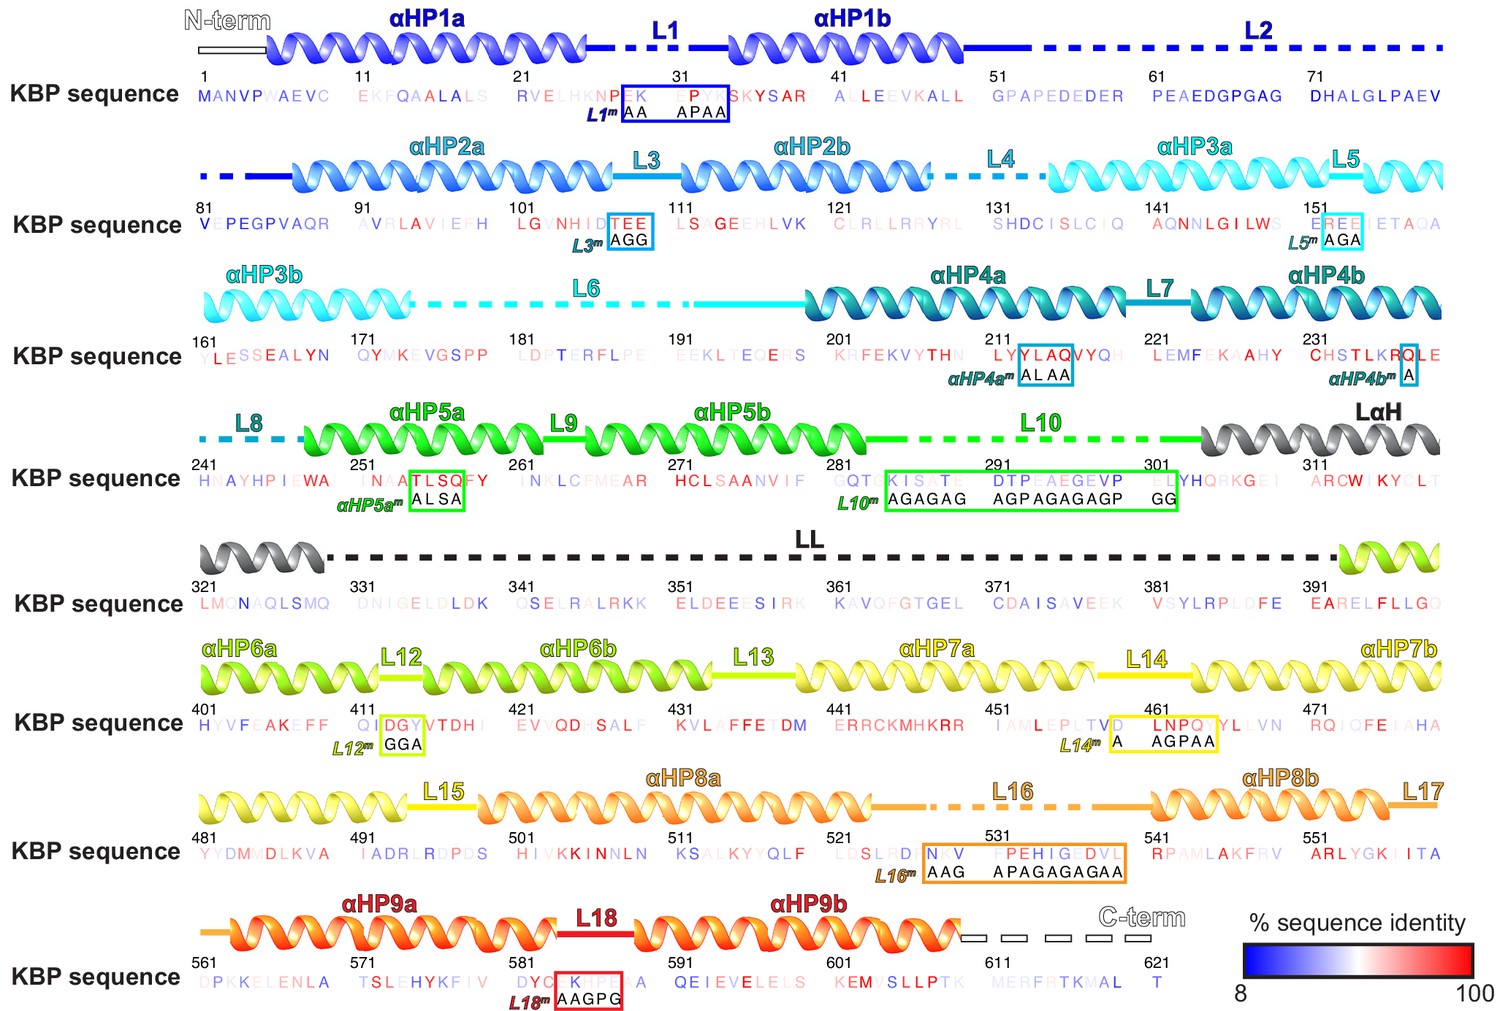
Kinesin-binding protein (KBP) loops, sequence, inter-species conservation, and experimental mutations.
The human KBP sequence (numbering above), with residues coloured by intra-species sequence identity as indicated in the key. The following species were included in the Clustal Omega multiple sequence alignment (Sievers et al., 2011); Homo sapiens, Mus musculus Gallus gallus, Xenopus tropicalis, Alligator mississippiensis, Danio rerio, Drosophila melanogaster, Amphimedon queenslandica, Stylophora pistillata, Trichoplax adhaerens, Spizellomyces punctatus, and Salpingoeca rosetta. Above the sequence, secondary structure elements are indicated, coloured to delineate the nine α-helical pairs and connecting loops. Mutation sites are indicated within each boxed sequence region, labelled to coordinate with Figure 5. Within these boxes, the mutated sequence is shown below the original wild-type sequence.
Figure 1—figure supplement 3
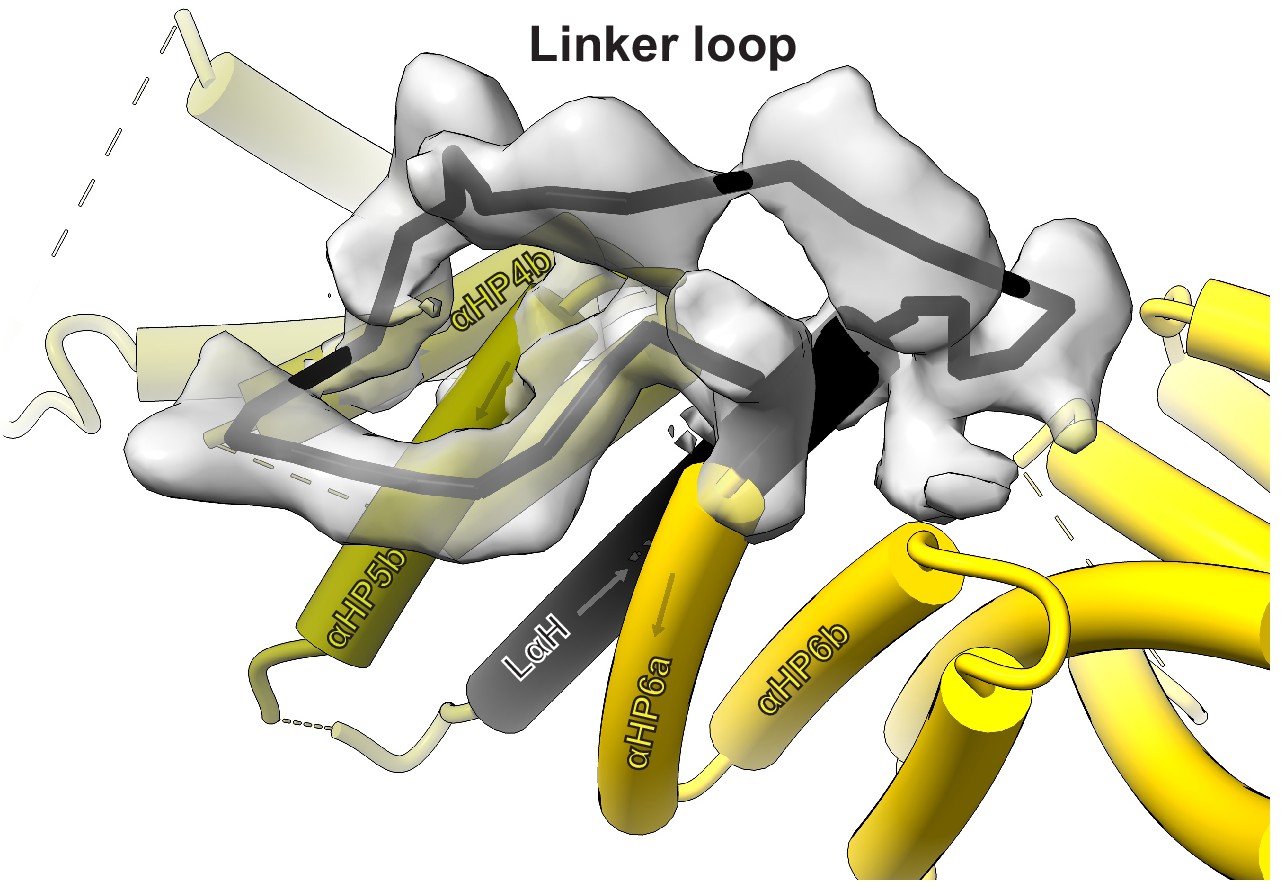
Approximate path of the kinesin-binding protein (KBP) linker loop (LL).
View of KBP’s LL, using the same KBP model subdomain colouring and representation as in Figure 1a and b. Only density for the LL is shown and a rough path for the LL is indicated with a solid black line. KBP α-helices contacting the LL region are labelled.
Figure 2 with 1 supplement
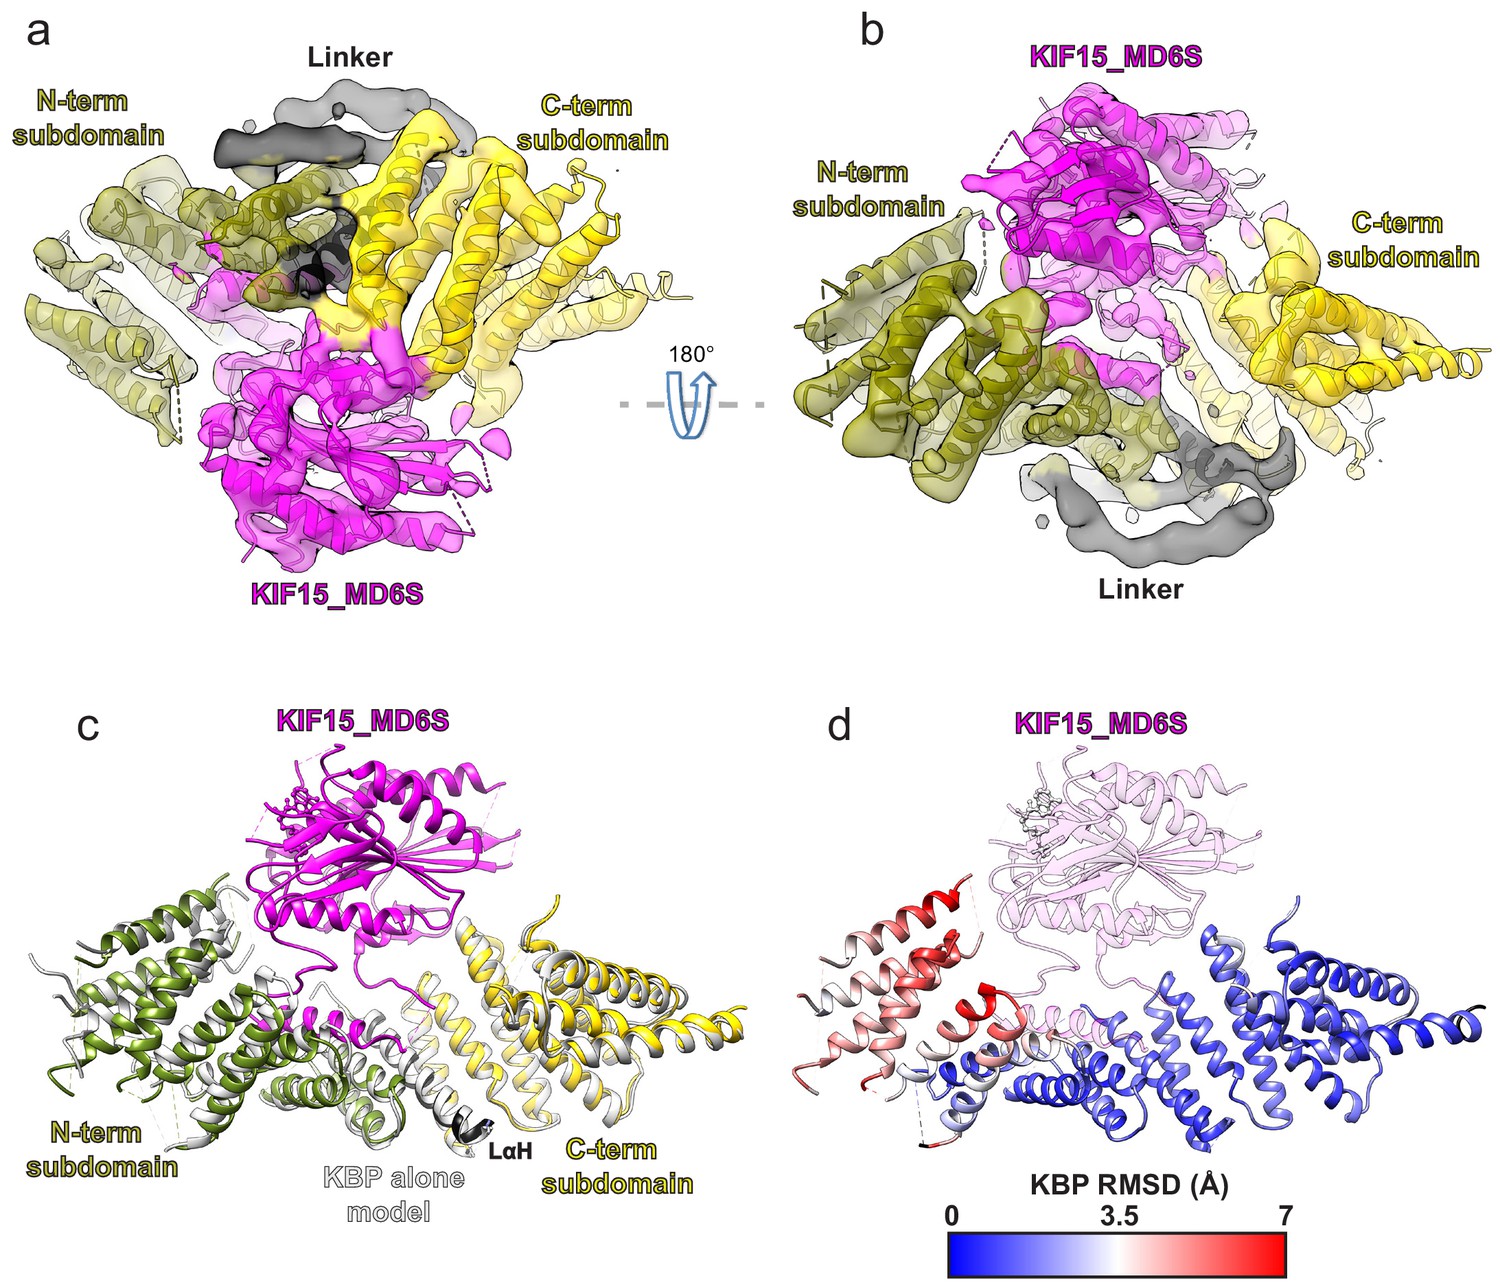
Kinesin-binding protein (KBP) conformationally adapts to bind KIF15’s motor domain via both subdomains.
(a) Model of the KBP–KIF15_MD6S complex (ribbon representation) displayed in experimental cryo-electron microscopy density. The N-terminal (olive) and C-terminal (gold) subdomains and the linker helix (black) are shown in KBP, while kinesin is coloured in magenta. Semi-transparent density is coloured regionally as per the fitted model and additional density for the linker loop is shown in semi-transparent black. (b) The same as panel a, but rotated 180° around the axis indicated. (c) The KBP-alone model (light grey ribbons) was superimposed on the KBP–KIF15_MD6S model (opaque ribbons) using Chimera’s matchmaker (Pettersen et al., 2004). Colouring and view as in panel b. (d) RMSD in Å for KBP comparing KBP–KIF15_MD6S and superimposed KBP-alone models as in panel c, shown on KBP from the KBP–KIF15_MD6S model. Parts of the KBP model coloured black are disordered/missing in the KBP alone model. The KIF15_MD6S is shown in transparent magenta.
Figure 2—figure supplement 1
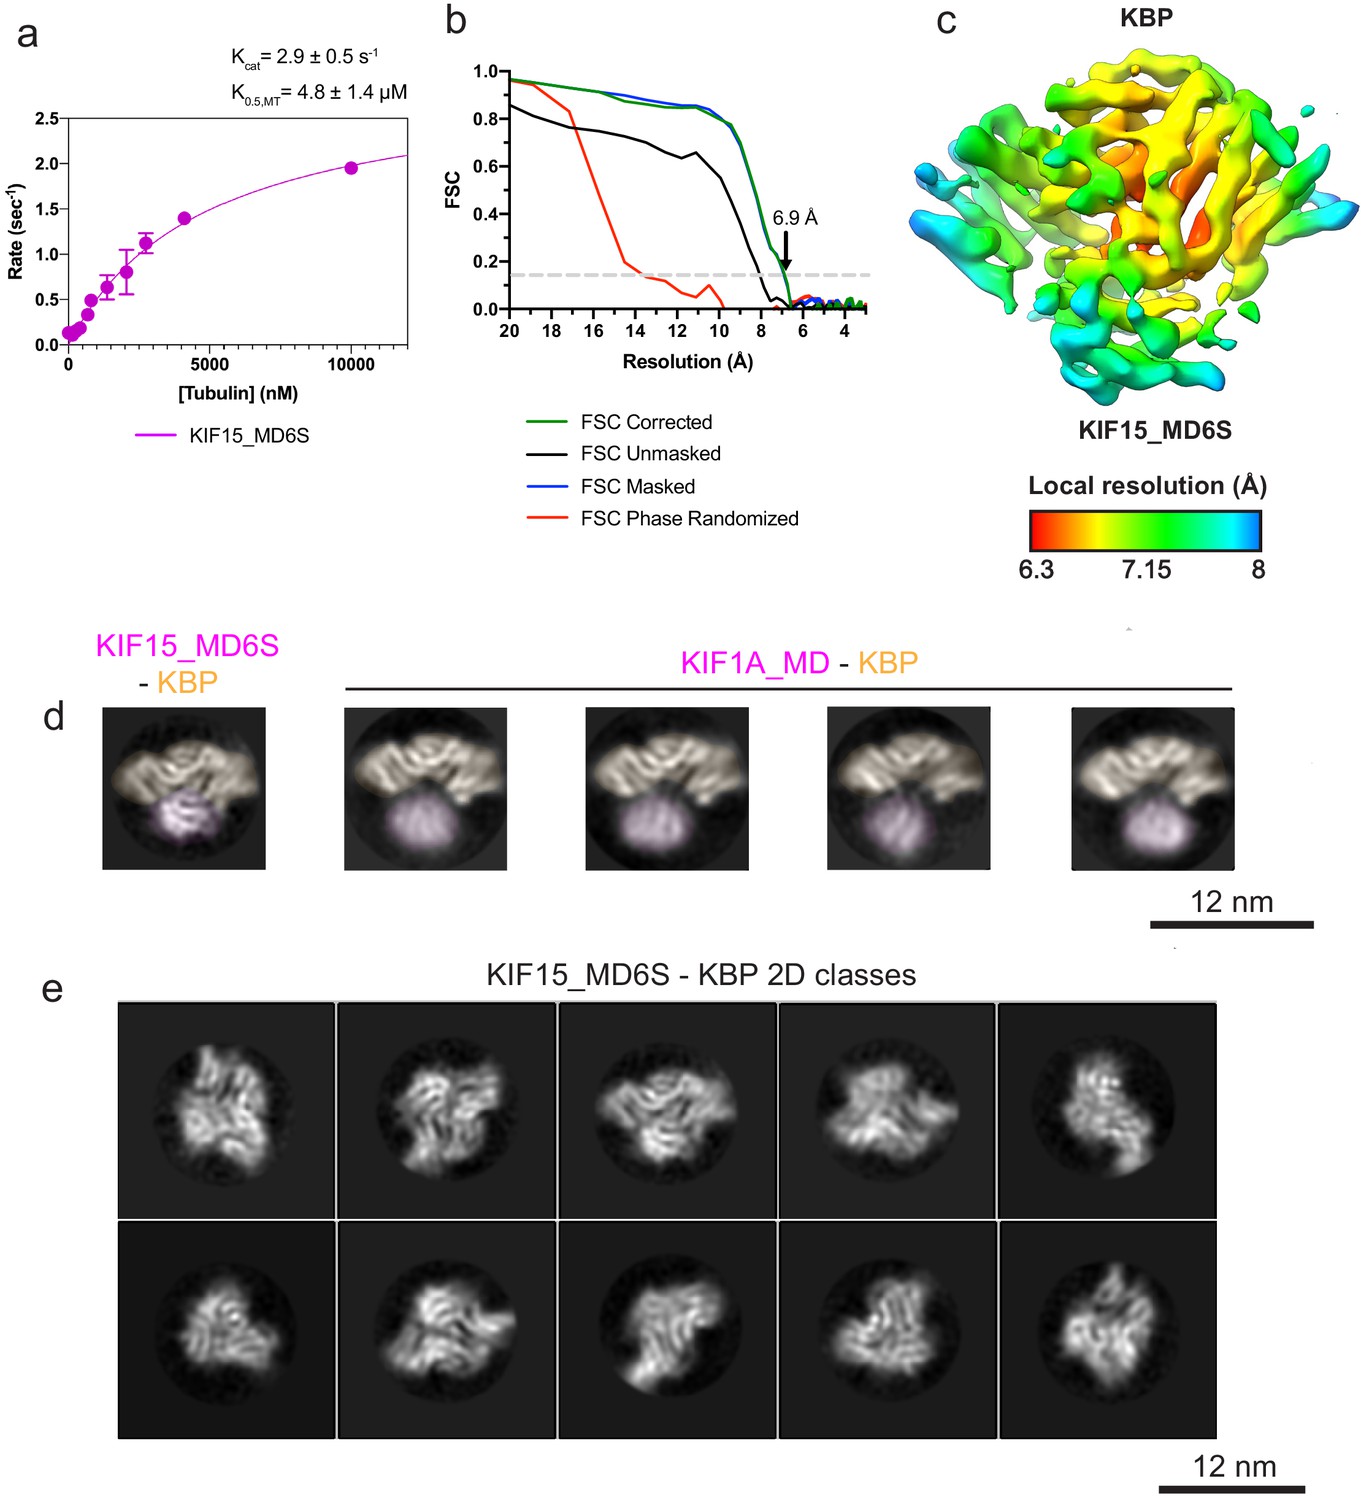
Kinesin-binding protein (KBP)–KIF15_MD6S reconstruction resolution estimation and 2D class analysis of KBP–KIF1A_MD and KBP–KIF15_MD complexes.
(a) KIF15_MD6S MT-activated steady-state ATPase velocity plotted as a function of [MT]. Data were fit to a Michaelis–Menten kinetic (pink curve) yielding values for kcat = 2.9 ± 0.5 s−1 and K0.5,MT = 4.8 ± 1.4 μM; R2 = 0.97, which are very similar to previously published values for KIF15_MD of kcat = 2.1 s−1 and K0.5,MT = 3.1 μM (Klejnot et al., 2014). (b) Gold-standard Fourier shell correlation (FSC) curves between independent masked, unmasked, phase-randomised, and corrected half-maps (Chen et al., 2013) of the KBP–KIF15_MD6S complex as calculated by RELION v3.0 (Zivanov et al., 2018). The resolution at the ‘gold-standard’ 0.143 FSC cutoff is 6.9 Å. (c) Local resolution as calculated by RELION v3.0, shown on the same view as in Figure 2a with coloured density corresponding to the local resolutions indicated in the key. (d) Selected RELION v3.0 (Zivanov et al., 2018) 2D classes of KBP–KIF15_MD6S (left) and KIF1A_MD–KBP (four to the right). Densities for the kinesin motor domain and KBP are pseudo-coloured pale magenta and pale orange respectively. Classes have been in-plane rotated such that KBP is seen from roughly the same orientation. Note poor resolution and a variable relative position in the KIF1A_MD. (d) A representative subset of KBP–KIF15_MD6S complex 2D classes, showing multiple orientations.
Figure 3 with 3 supplements

The KIF15 motor domain binds kinesin-binding protein (KBP) via rearrangement of its tubulin-binding subdomain.
(a) The crystallographic model of the KIF15_MD alone (PDB: 4BN2 Klejnot et al., 2014) was superimposed on the KIF15 region of the KBP–KIF15_MD6S complex, with the KIF15 part of the KBP–KIF15_MD6S complex model hidden. The KIF15_MD6S Switch 1/2 subdomain (Switch 1/2 subdomain) is coloured sienna, and the P-loop subdomain (Kin-PLsd) is coloured light pink. The TBsd of the KIF15_MD crystallographic model is shown as pale magenta to illustrate poor fit into density. The KBP subdomains are coloured as labelled. Black arrows indicate unaccounted-for cryo-electron microscopy (cryo-EM) density. Individual secondary structure elements in the tubulin-binding subdomain are labelled. The cryo-EM density for the KBP–KIF15_MD6S complex is shown in mesh and is coloured by proximity (≤3.5 Å) to the fitted model. (b) Same as in panel a, but the whole fitted KBP–KIF15_MD6S complex model is shown. The KIF15_MD6S tubulin-binding subdomain (TBsd) is now coloured magenta to indicate good fit into density. (c) Zoomed view of just the TBsd (corresponding to the boxed region in Figure 3—figure supplement 2d), showing just the KIF15_MD-alone crystallographic model. (d) The TBsd in the KIF15_MD6S-MT model, same view as in panel c. The MT is shown in light grey surface representation. (e) The TBsd in the KBP–KIF15_MD6S model, same view as in panel c. KBP is shown in light grey surface representation and the ~15 Å displacement of helix α4 is indicated by the dashed grey arrow.
Figure 3—figure supplement 1
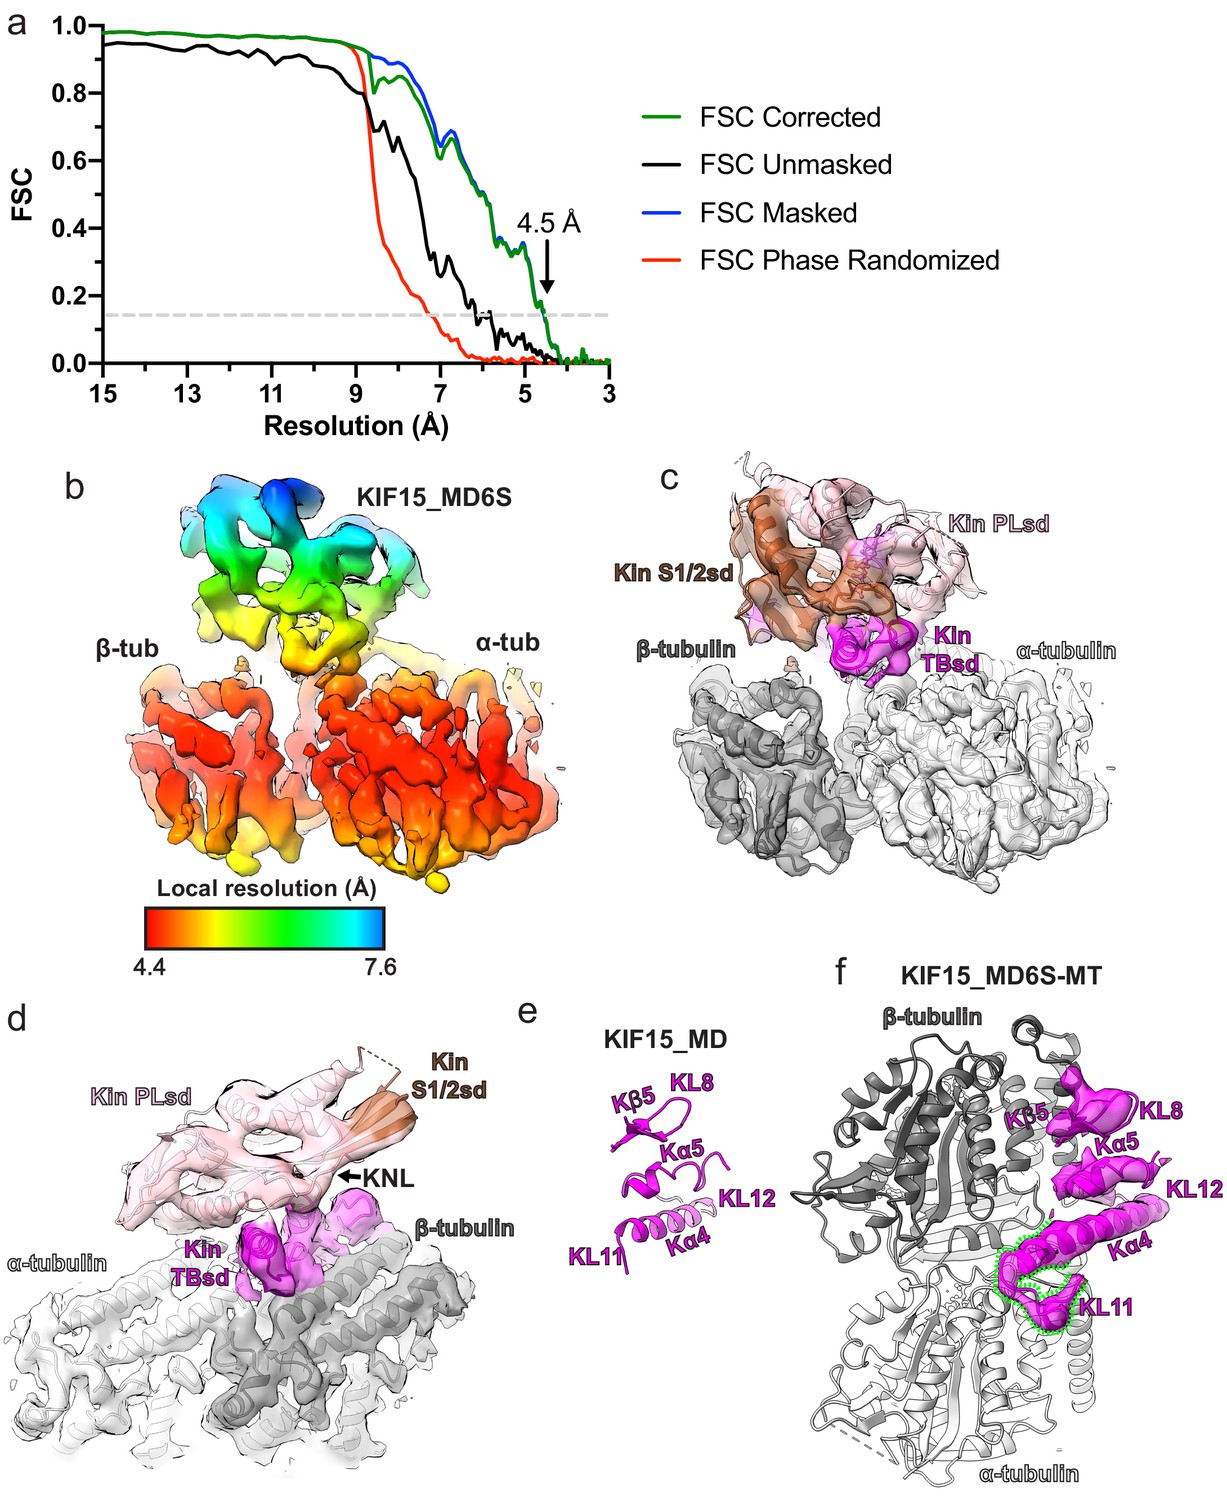
KIF15_MD6S adopts a canonical MT-bound kinesin conformation.
(a) Gold-standard Fourier shell correlation (FSC) curves between independent masked, unmasked, phase-randomised, and corrected half-maps (Chen et al., 2013) of the KIF15_MD6S-MT complex as calculated by RELION v3.0 (Zivanov et al., 2018). The resolution at the ‘gold-standard’ 0.143 FSC cutoff is 4.5 Å. (b) Local resolution as calculated by RELION v3.0, with coloured density corresponding to the local resolutions indicated in the key. (c) The KIF15_MD6S-MT asymmetric unit model in corresponding density. The KIF15_MD6S is coloured by subdomain, bound Mg2+-AMPPNP coloured lilac, and α- and β-tubulin are coloured light and dark grey respectively, along with their corresponding cryo-electron microscopy (cryo-EM) densities. The same view as in panel b. (d) A view of the KIF15_MD6S-MT asymmetric unit showing a docked conformation of the neck-linker (KNL). Model and density colouring as in panel c. (e) The tubulin-binding subdomain of KIF15_MD alone from the crystal structure (PDB code:4BN2 Klejnot et al., 2014). (f) KIF15_MD6S complexed with MTs with only the tubulin-binding subdomain and α- and β-tubulin shown, along with the tubulin-binding subdomain cryo-EM density (semi-transparent). Kα4 of KIF15_MD6S is extended relative to the crystal structure and KL12 adopts a new conformation on α-tubulin, as indicated by the green dashed lines. Panels d and e show the KIF15_MD6S tubulin-binding subdomain from the same viewpoint.
Figure 3—figure supplement 2
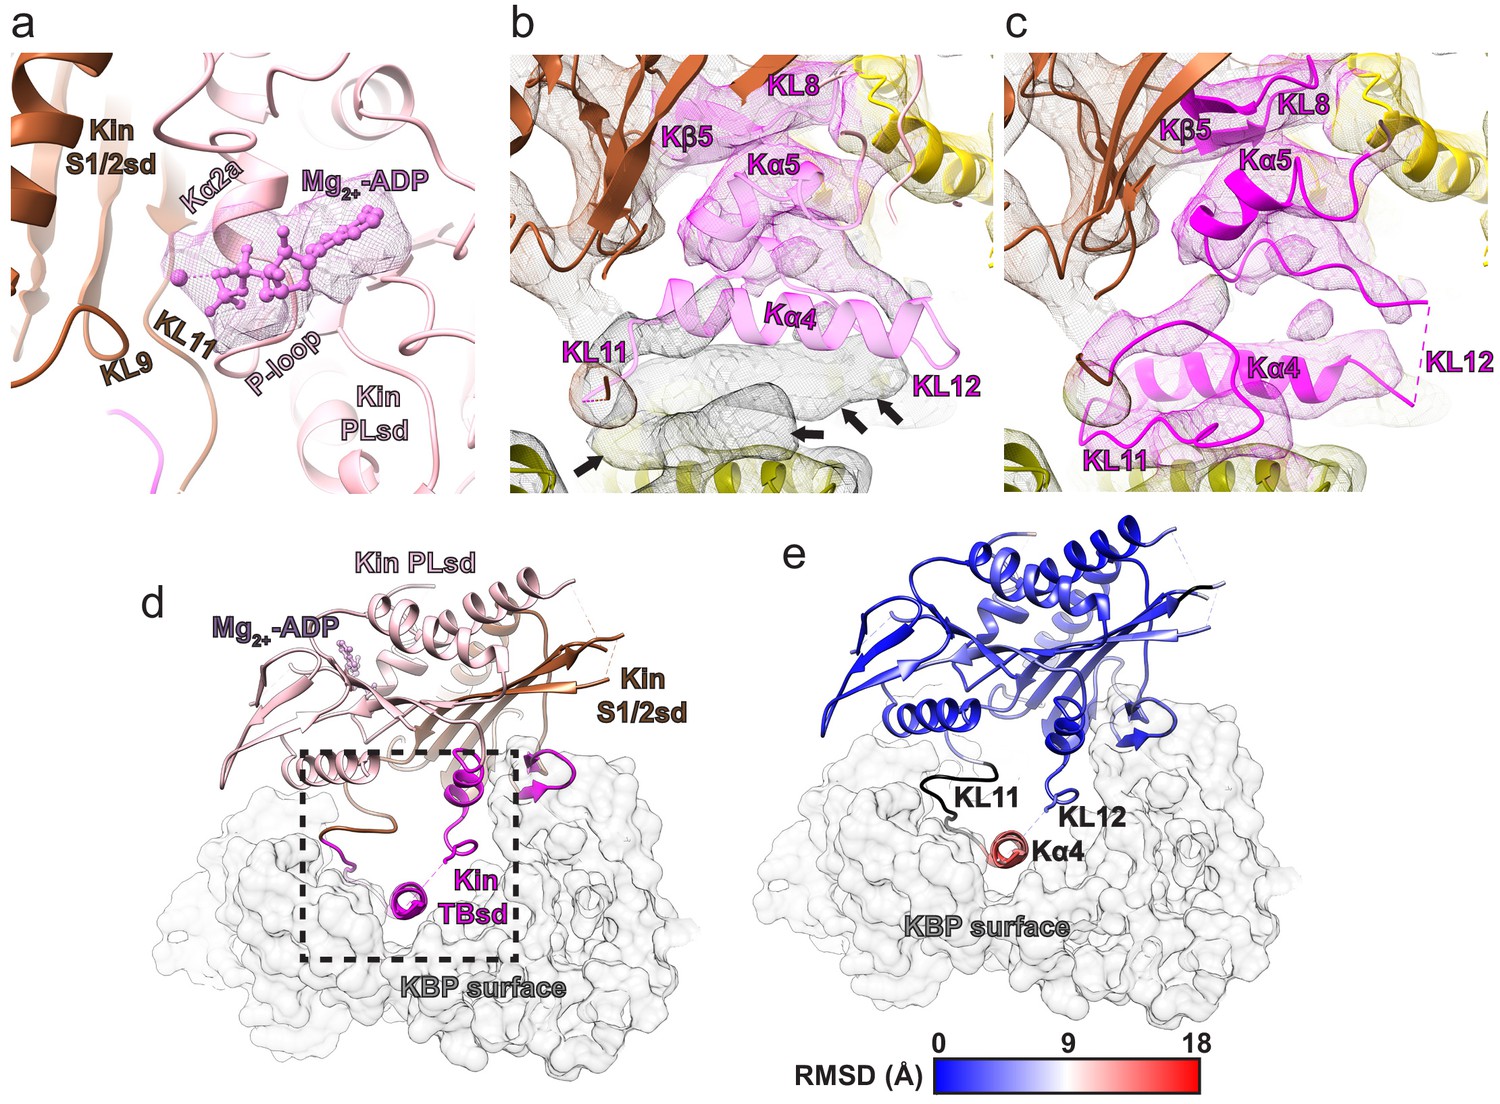
Movement of Kα4 of the Kin TBsd upon kinesin-binding protein (KBP) binding.
(a) The KIF15_MD alone crystal structure (PDB code:4BN2 Klejnot et al., 2014) is shown coloured by kinesin subdomain (as in Figure 3), fitted into the KBP–KIF15_MD6S complex cryo-electron microscopy map, with only density shown for the Mg2+-ADP as mesh. Density for Mg2+-ADP is found in the expected position between nucleotide-binding elements KL9, KL11, Kα2a, and the P-loop. (b) As in Figure 3a, but with a clipped viewpoint zoomed on the TBsd (in pale magenta to illustrate poor fit). Black arrows indicate unaccounted-for density. (c) As in Figure 3b, with the clipped viewpoint as in panel b of this figure (TBsd now opaque to illustrate good density fit). (d) The KBP–KIF15_MD6S model is shown as opaque ribbons, with kinesin subdomain colouring as in panels a and b and as labelled. KBP is shown as a transparent light grey surface representation. The boxed region indicates that shown in Figure 3c–e. (e) RMSD in Å corresponding to the KIF15_MD6S overlay in panel d, shown on the model of KIF15_MD6S in complex with KBP (grey transparent surface). Parts of the model coloured black are disordered/missing in the KIF15_MD alone crystal structure.
Figure 3—figure supplement 3
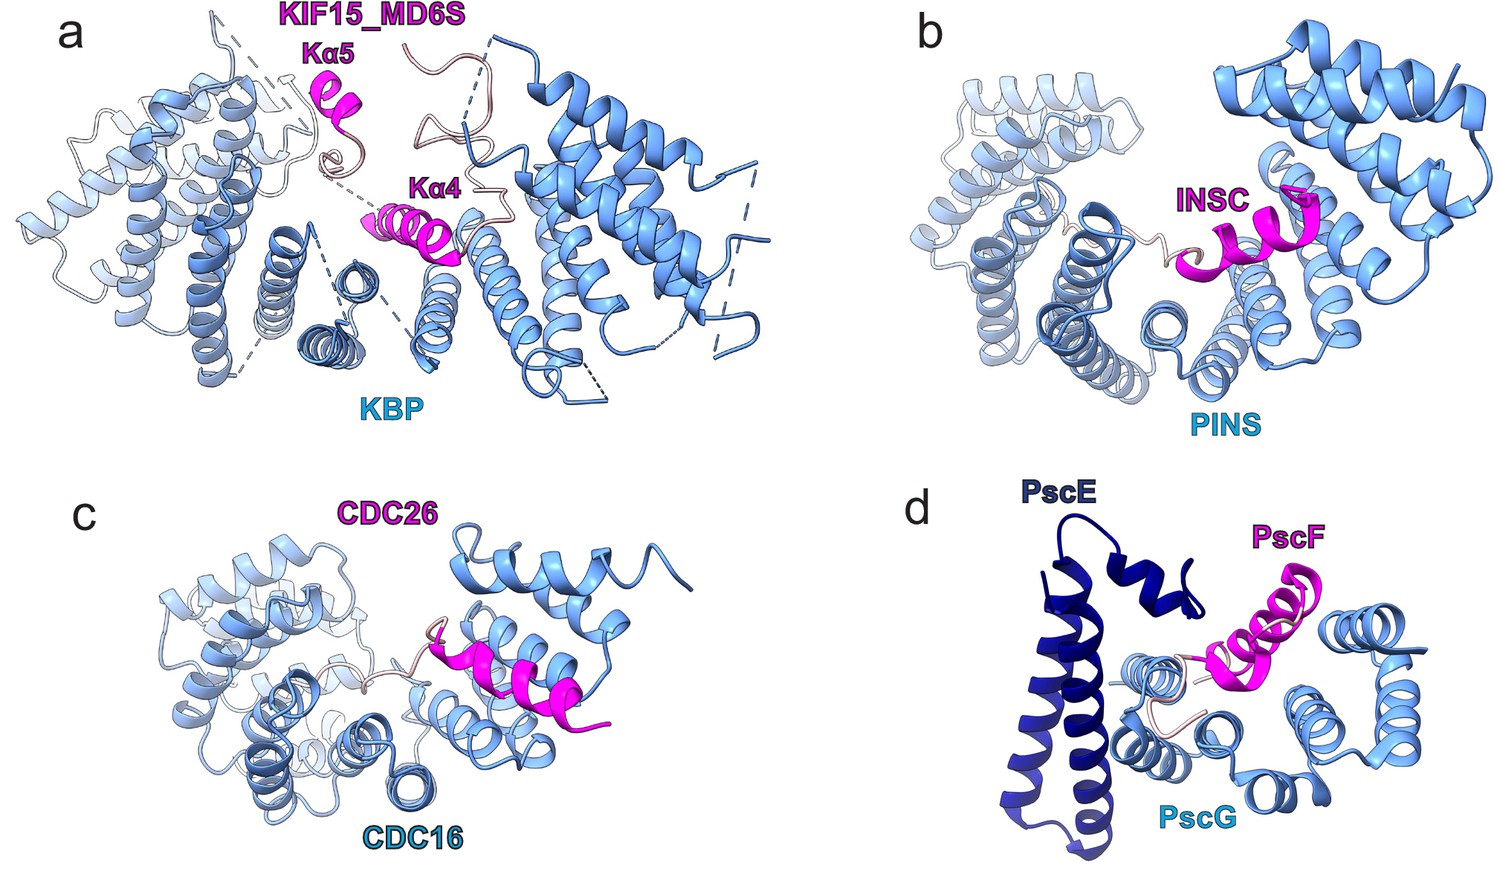
Examples of tetratricopeptide repeat (TPR)-containing α-solenoid proteins binding α-helical SSE ligands.
(a–d) Comparison of (a) kinesin-binding protein (KBP)-KIF15_MD6S complex with other TPR-containing α-solenoids shown in blue, and binding peptide motifs shown in magenta or pink for helical and random coil regions respectively; (b) the PINS–INSC complex (Culurgioni et al., 2011), (c) the CDC16–CDC26 complex (Wang et al., 2009), and (d) the PscE/PscG–PscF complex (Quinaud et al., 2007).
Figure 4 with 1 supplement
Kinesin-binding protein (KBP) binds kinesin MDs via conserved motifs in the α-solenoid edge loops and α-helices at the concave face.
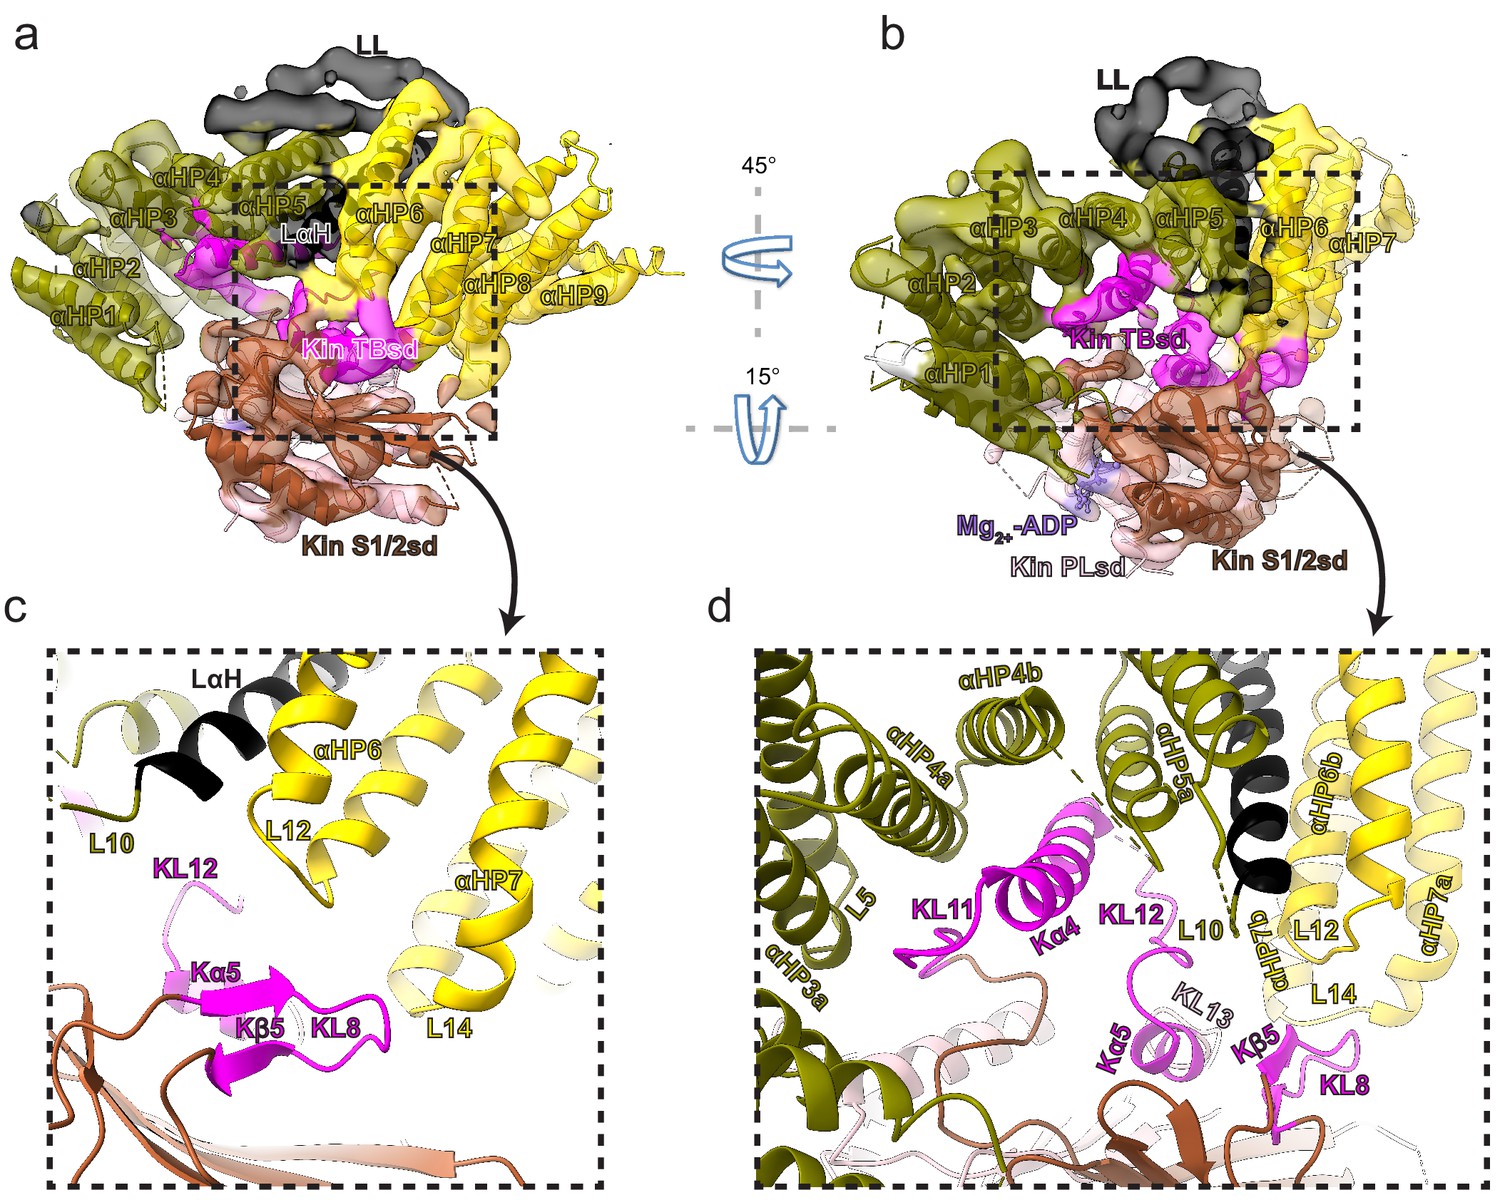
(a) Pseudo-atomic model of the KBP–KIF15_MD6S complex (ribbon representation) displayed in cryo-electron microscopy density, using the same viewpoint as Figure 2a, but with the KIF15_MD6S now coloured by subdomain as in Figure 3. The KIF15_MD6S Switch 1/2 subdomain (Kin S1/2 sd) is coloured sienna, and the P-loop subdomain (Kin-PLsd) is coloured light pink. The KIF15_MD6S tubulin-binding subdomain (TBsd) is coloured magenta. The KBP subdomains are coloured as labelled. The nine helix pairs of KBP are labelled. Semi-transparent density is coloured regionally as per the fitted model and additional density for the linker loop is shown in semi-transparent black. (b) The same as panel a, but rotated 45° and 15° respectively around the axes indicated. (c) Zoomed view of the region indicated in panel a, with density removed and selected KIF15_MD6S and KBP secondary structure elements labelled. (d) Zoomed view of the region indicated in panel b, with density removed and selected KIF15_MD6S and KBP secondary structure elements labelled.
Figure 4—figure supplement 1
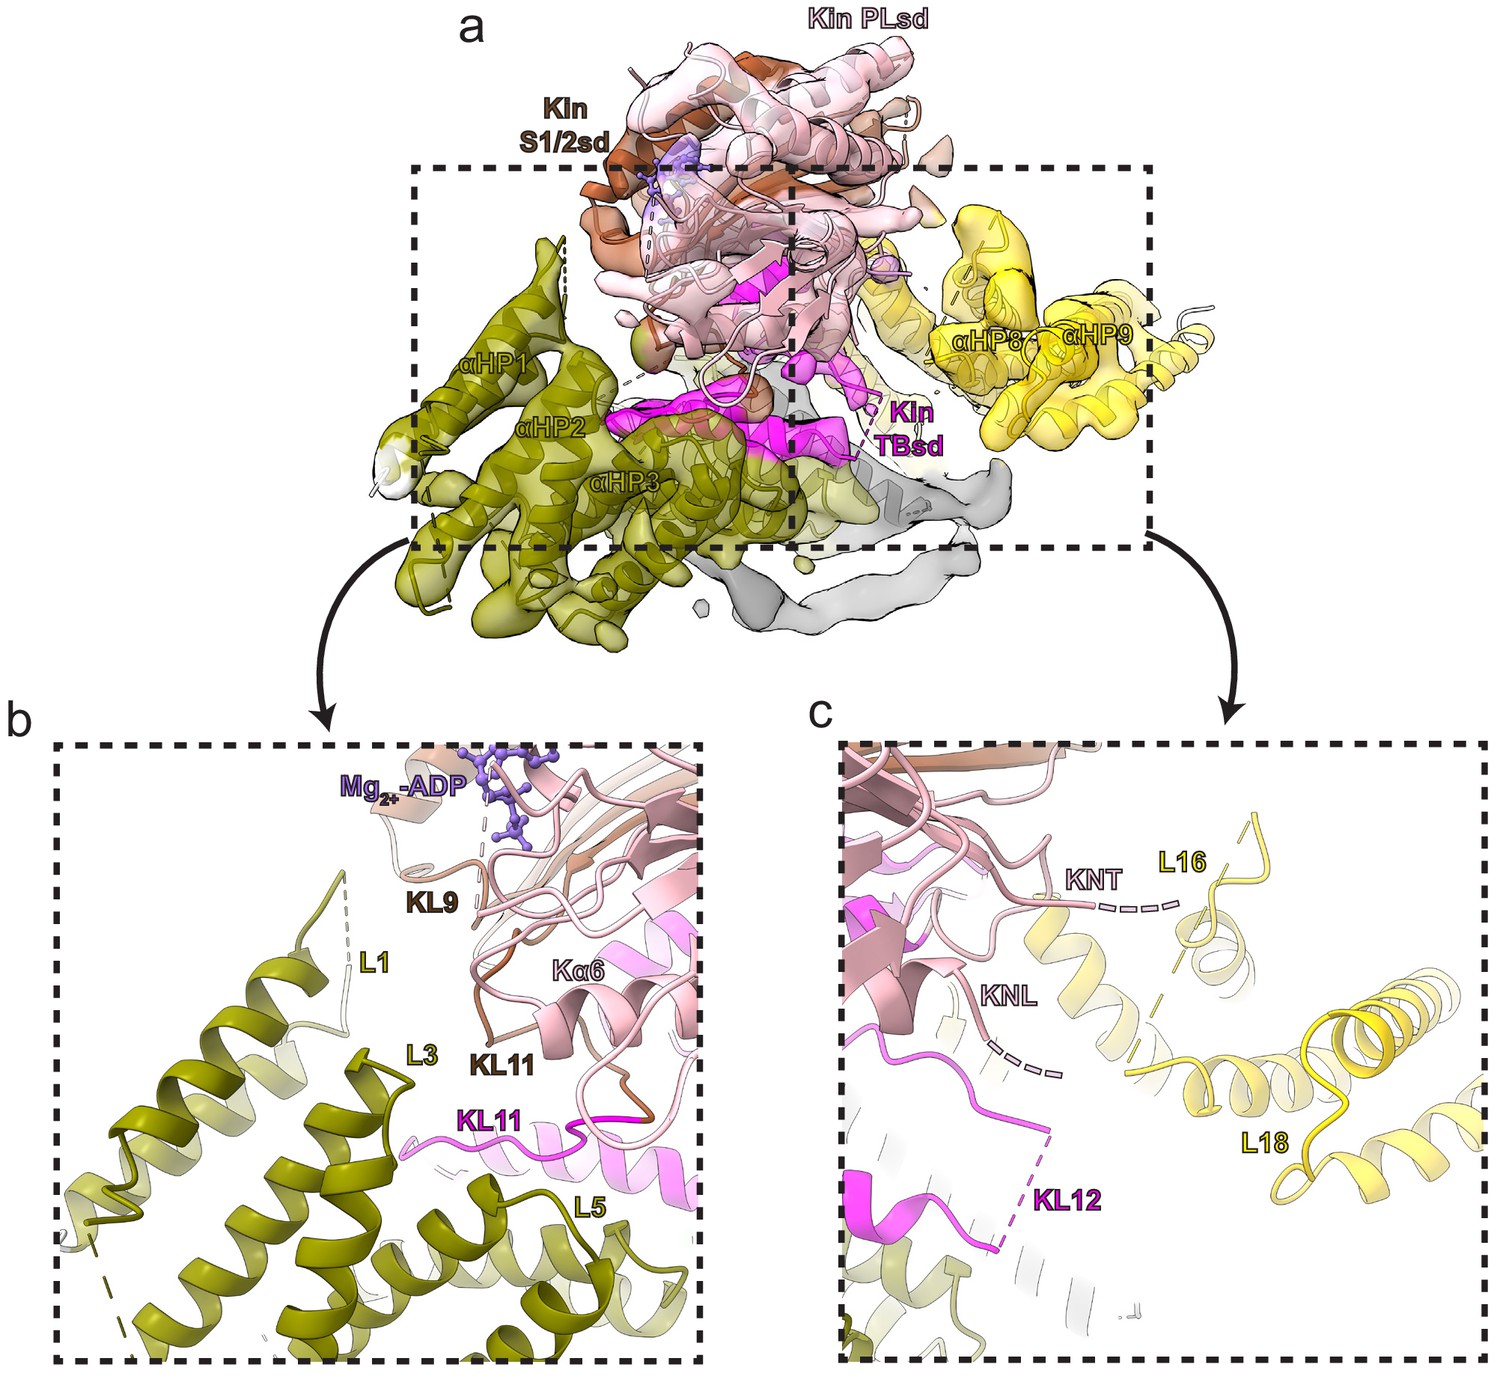
Additional kinesin-binding protein (KBP) α-solenoid edge loops proximal to KIF15_MD6S.
Colouring and representation as in Figure 4. (a) A view showing α-helical pairs αHP1, αHP2, αHP3, αHP8, and αHP9 of KBP and the KIF15_MD6S coloured by subdomain as labelled. (b) Left zoomed region in panel a, with density removed, showing KBP L1, L3, and L5 and proximal kinesin elements KL9, KL11, and Kα6. ADP is coloured in light orchid. (c) Right zoomed region in panel a, with density removed, showing KBP L16 and L18 and proximal KIF15_MD6S elements KNT (kinesin N-terminus), KNL (kinesin neck-linker), and KL12.
Figure 5 with 3 supplements

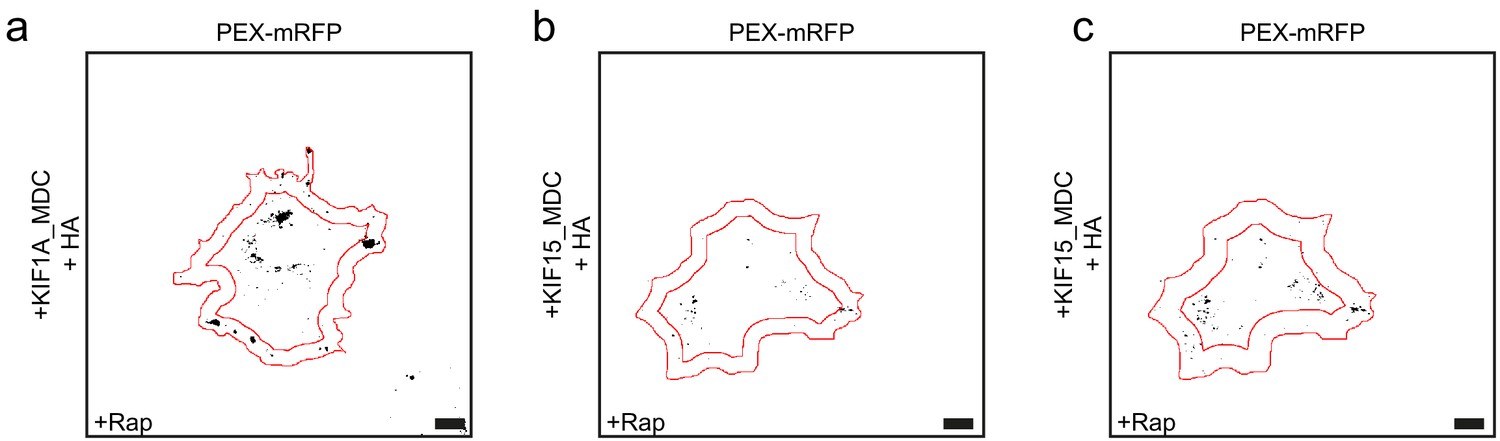
Disruption of cryo-electron microscopy defined kinesin-binding protein (KBP)–kinesin interface perturbs KBP inhibition of KIF15- and KIF1A-mediated cargo translocation in cells.
(a) Schematic depiction of the inducible peroxisome motility assay, with the kinesin motor domain fused to an FRB domain and PEX fused to an FKBP domain. Addition of rapalog (Rap) links FRB and FKBP and induces peroxisome translocation by kinesin dimers. Expression of KBP inhibits kinesin movement, such that addition of rapalog cannot induce peroxisome translocation. (b) Schematic representation of the inducible peroxisome motility assay in cells. Without rapalog or KBP, peroxisomes localise in the cell centre, whereas kinesin moves towards the cell periphery. Rapalog induces peroxisome translocation into the cell periphery, which is inhibited in the presence of KBP. (c) Representative images of peroxisomes in COS-7 cells expressing KIF15_MDC–FRB, PEX–mRFP–FKBP, and HA (left panels) or HA–KBP (right panels) without and with addition of rapalog. Scale bar, 10 µm. (d, e) Quantification of the percentage of cells in which peroxisome translocation is observed after rapalog treatment in cells expressing KIF15_MDC–FRB (d) or KIF1A_MDC–FRB (e), PEX–mRFP–FKBP, and HA–KBP constructs including the indicated mutants. Data are displayed as mean ± s.e.m. (n = 28–35 cells from two independent experiments). (f, g) Quantification of the area above threshold intensity in the outer 5 µm (KIF1A_MDC) or 7.5 µm (KIF15_MDC) of the cell from the total area above threshold intensity in cells expressing KIF15_MDC–FRB (f) or KIF1A_MDC–FRB (g), PEX–mRFP–FKBP, and HA–KBP constructs including the indicated mutants without and with rapalog treatment. Data are displayed as mean ± s.e.m. (n = 28–35 cells from two independent experiments).
Figure 5—figure supplement 1
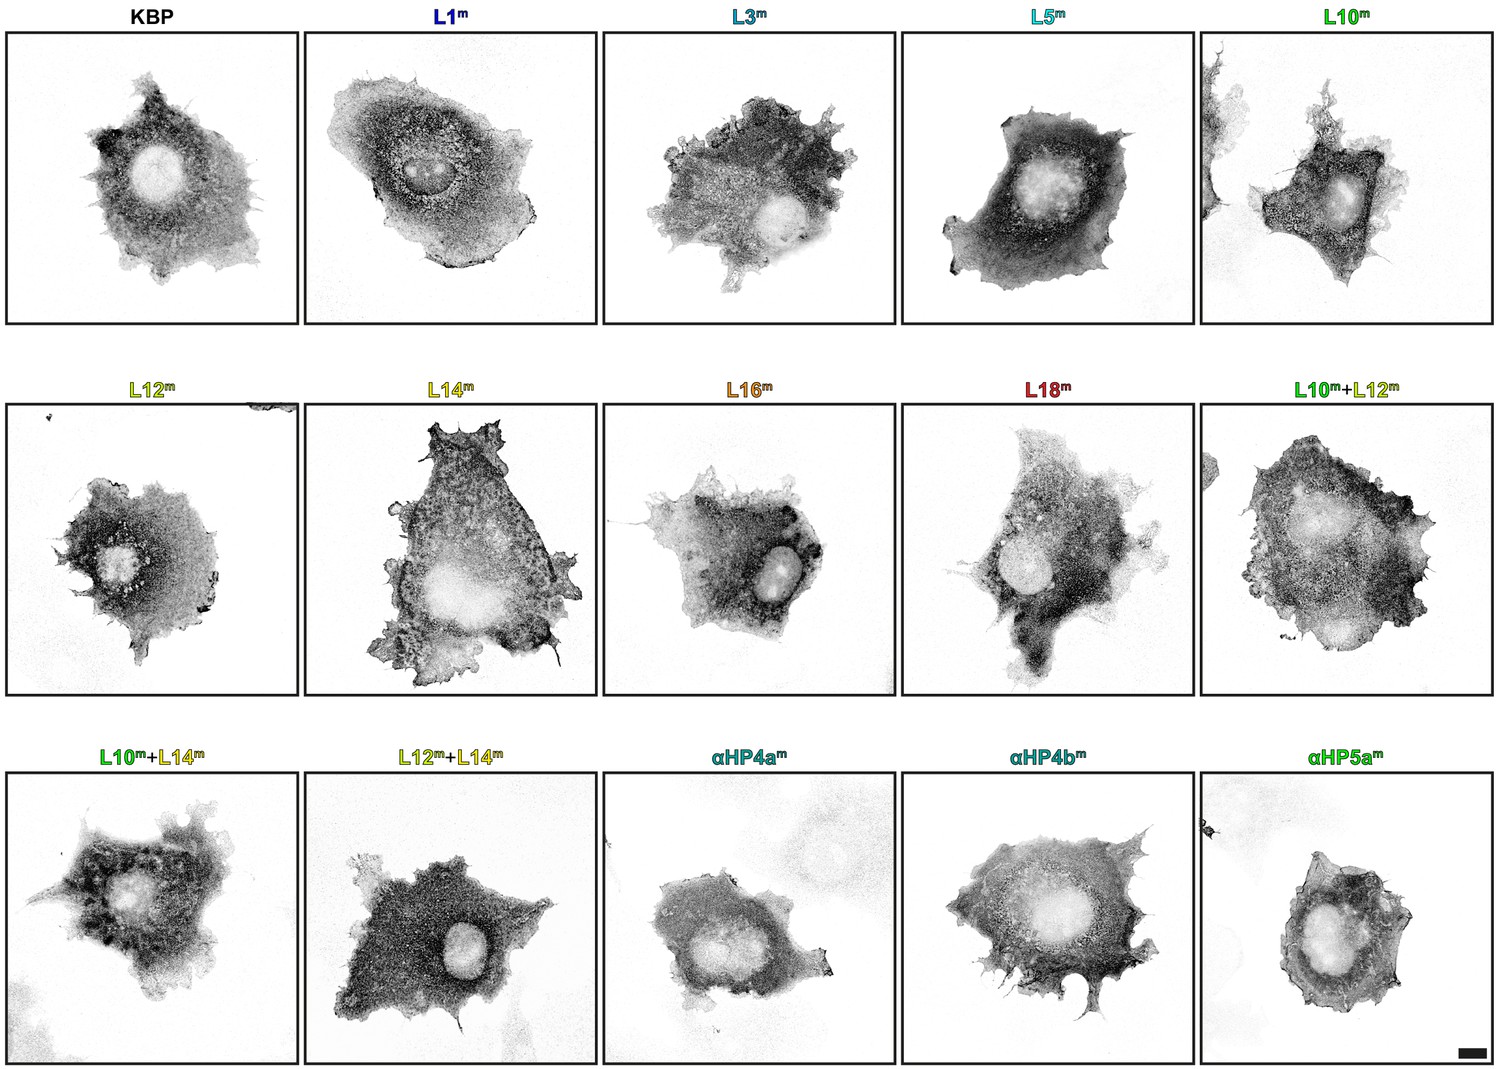
Kinesin-binding protein (KBP) mutants show similar expression profiles in COS-7 cells.
Representative images of COS-7 cells expressing HA–KBP mutant constructs. Scale bar, 10 µm.
Figure 5—figure supplement 2
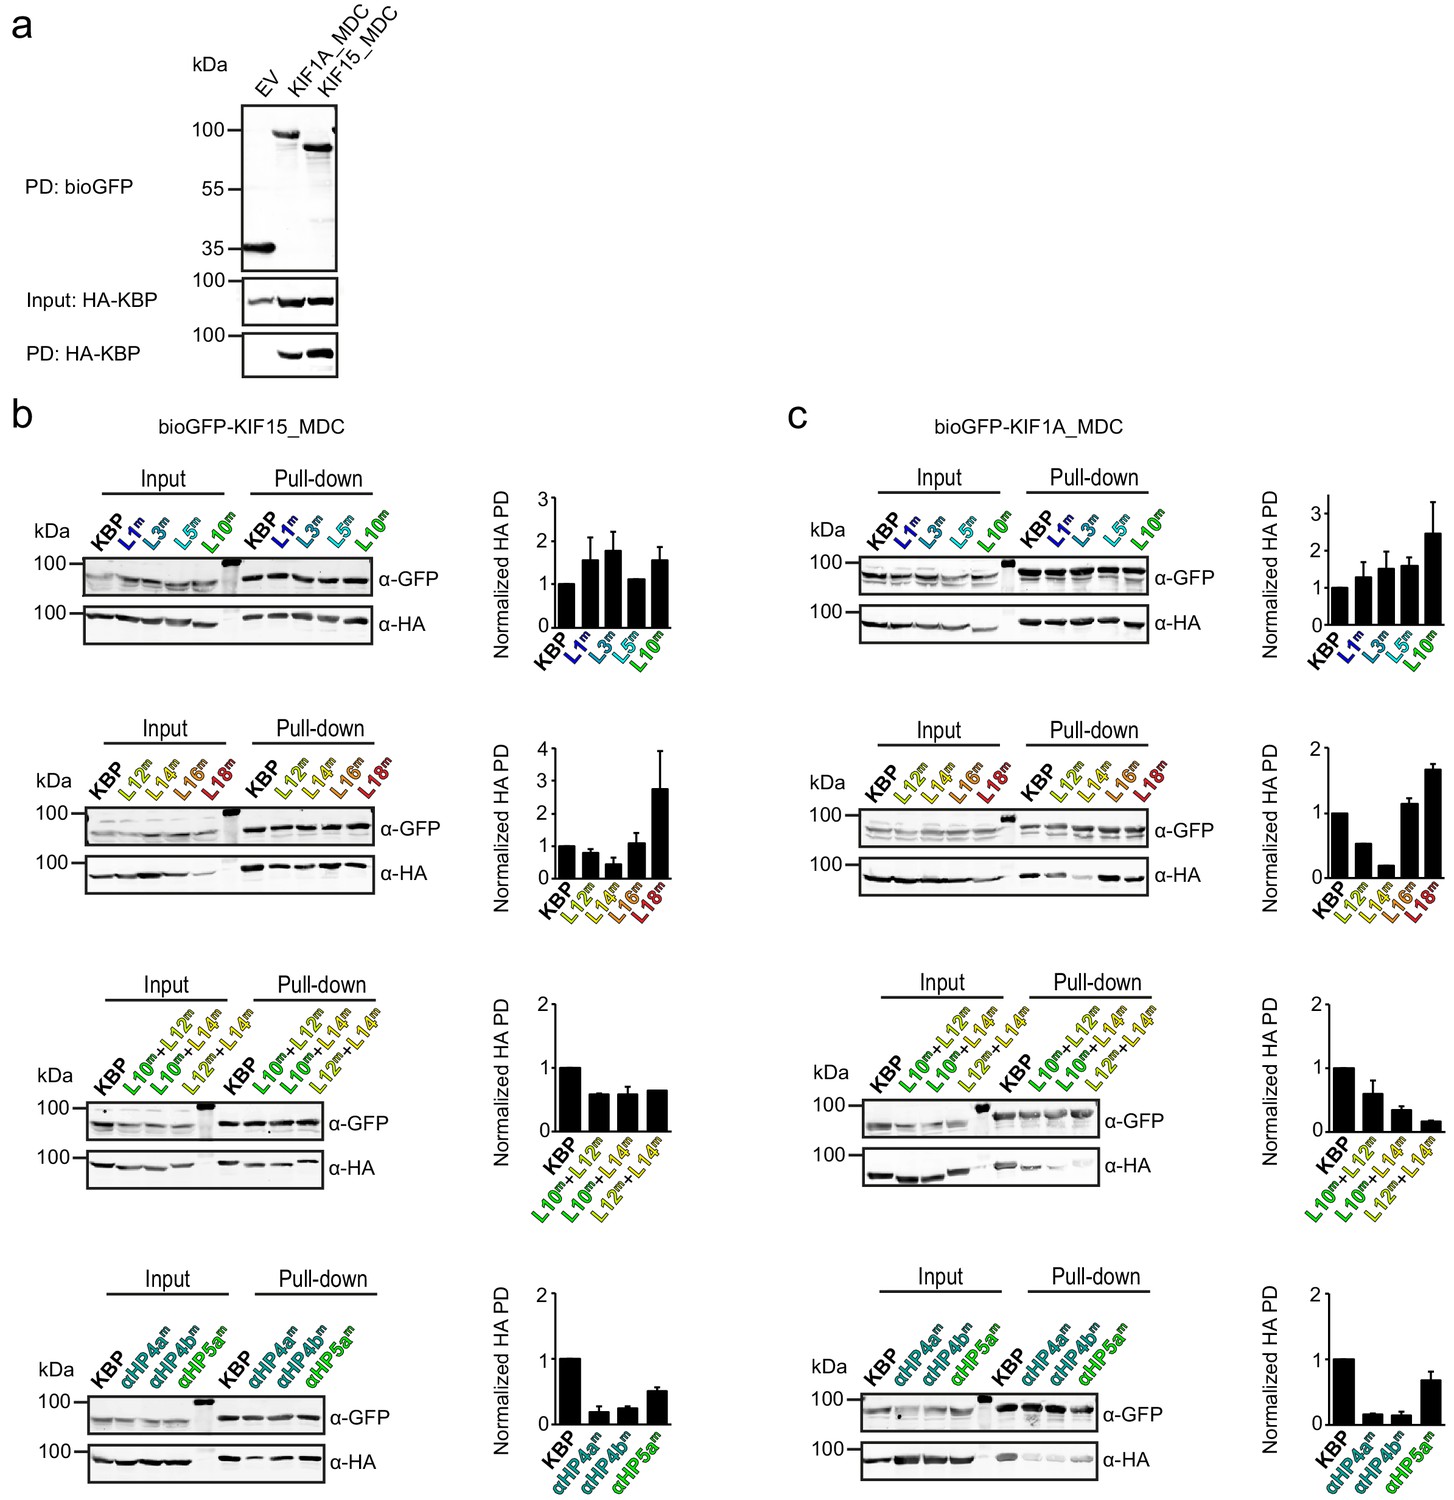
Pull-down experiments demonstrate the effect of kinesin-binding protein (KBP) mutation on the interaction between KIF15 and KIF1A.
(a) Control pull-down experiment with bioGFP-EV, bioGFP-KIF1A_MDC or bioGFP-KIF15_MDC and HA–KBP showing that KBP interacts with KIF1A_MDC and KIF15_MDC, but not with bioGFP-EV. (b, c) Example of pull-down experiments showing the interaction between (b) KIF15_MDC or (c) KIF1A_MDC and mutated KBP constructs in HEK293T cell lysates. Graphs show the quantification of the intensity of the mutated HA–KBP construct in the pull-down fraction over the input fraction divided by the intensity of bioGFP_MDC in the pull-down fraction and normalised to HA–KBP. Data are displayed as mean ± s.e.m. (data from two independent experiments).
Figure 5—figure supplement 3
Kinesin motors show different properties in the peroxisome assay.
(a–c) Representative images of peroxisomes in COS-7 cells expressing KIF1A_MDC (a) or KIF15_MDC–FRB (b, c), PEX–mRFP–FKBP and HA (left panels) with addition of rapalog. Images were thresholded at 10,000 (a, b) or 7500 (c) and peripheral areas of 5 µm (a, b) or 7.5 µm (c) are shown. Scale bars, 10 µm.
Figure 6
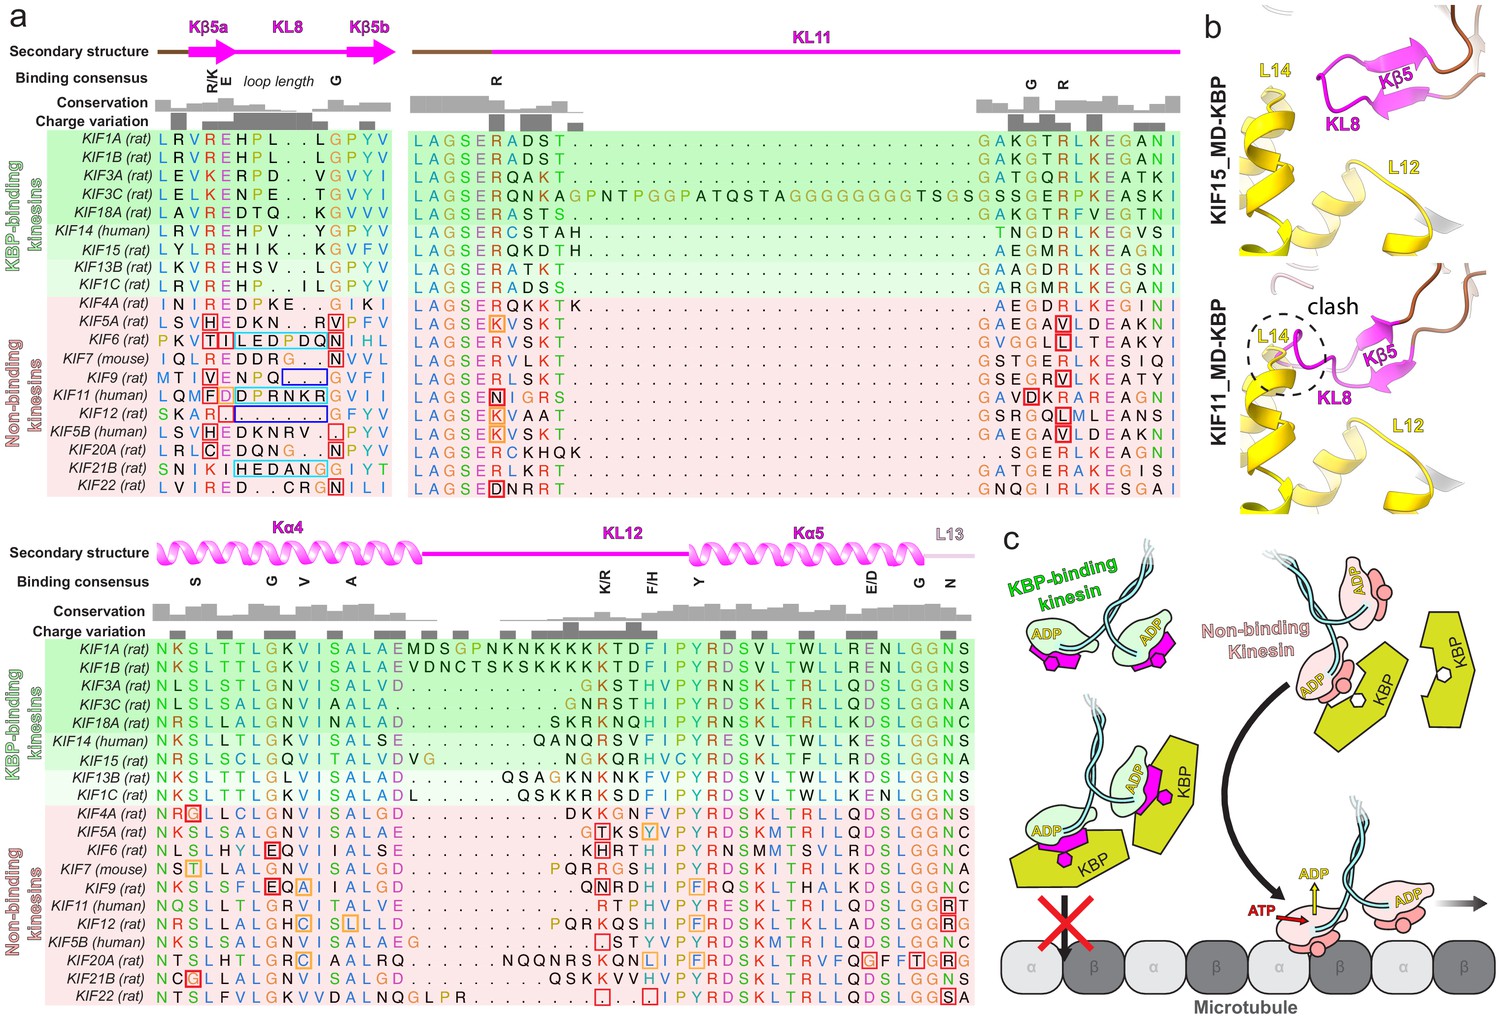
Conserved motifs in kinesin-binding protein (KBP)-binding kinesin MDs.
(a) Sequence alignment of the tubulin-binding subdomain from kinesin motor domains, made using Clustal Omega multiple sequence alignment (Sievers et al., 2011). Residues are coloured according to standard Clustal X colouring (dependent on residue type and conservation, see http://bioinfolab.unl.edu/emlab/documents/clustalx_doc/clustalx.html#C). Kinesin MD constructs experimentally assessed for KBP interactivity are taken from Kevenaar et al., 2016; strongest interactors are in rows highlighted in darker shades of green, weaker interactors in lighter shades of green, and non-interactors in red. Secondary structure element, conservation and charge variation columns, as well as a ‘binding consensus’ column indicating residues/loop length conserved at the interface (according to the KBP–KIF15_MD6S complex) in KBP-binding but not non-binding kinesins are shown above the alignment. Non-conservation relative to this consensus is shown in boxed sequence; red boxes, non-conservative substitutions, orange boxes, conservative substitutions (general charge/polarity/hydrophobicity retention), cyan boxes, extended loop region, dark blue boxes, truncated loop region. (b) Top panel; view of the Kβ4–KL8 region of the tubulin-binding subdomain in the KBP–KIF15_MD6S model, coloured as in Figure 4. Bottom panel; as in upper panel, but with the KIF11_MD cryo-electron microscopy model (PDB: 6TA4 [Peña et al., 2020]) superimposed onto the now hidden KBP–KIF15_MD6S. Note steric clash introduced by KIF11_MD’s extended KL8. (c) Schematic model of KBP’s hypothesised selective kinesin inhibition mechanism. KBP (olive) binds the compatible TBsd of recognised kinesins (magenta) but is incompatible with the TBsd of non-binding kinesins (salmon). For its target kinesins, KBP therefore sterically blocks the TBsd interaction with MTs (grey), preventing activation of kinesin ATPase and motility.
Author response image 1
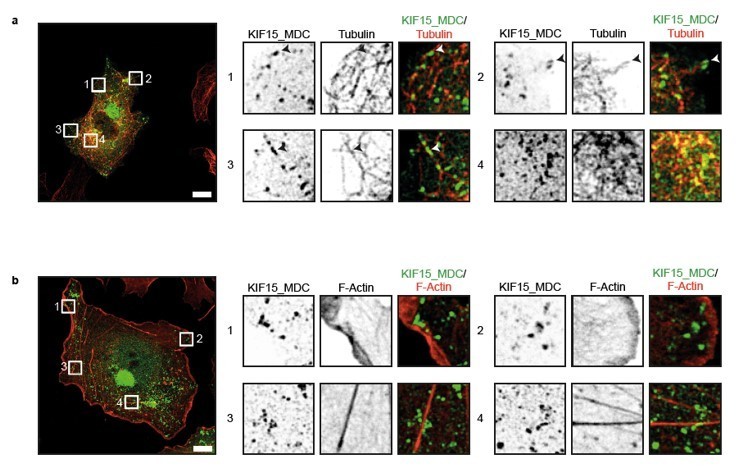
KIF15 localizes on microtubules in the peroxisome motility assay.
(a, b) Representative images of COS-7 cells expressing KIF15_MDC–HA–FRB and PEX–mRFP–FKBP treated with rapalog for three hours and co-stained for (a) microtubules (rabbit anti-α-tubulin, 1:1000, Abcam) or (b) F-actin (Phalloidin Alexa647, 1:40, Life technologies). Zooms of the boxed regions are shown on the right. Scale bars, 10 µm.
Author response image 2
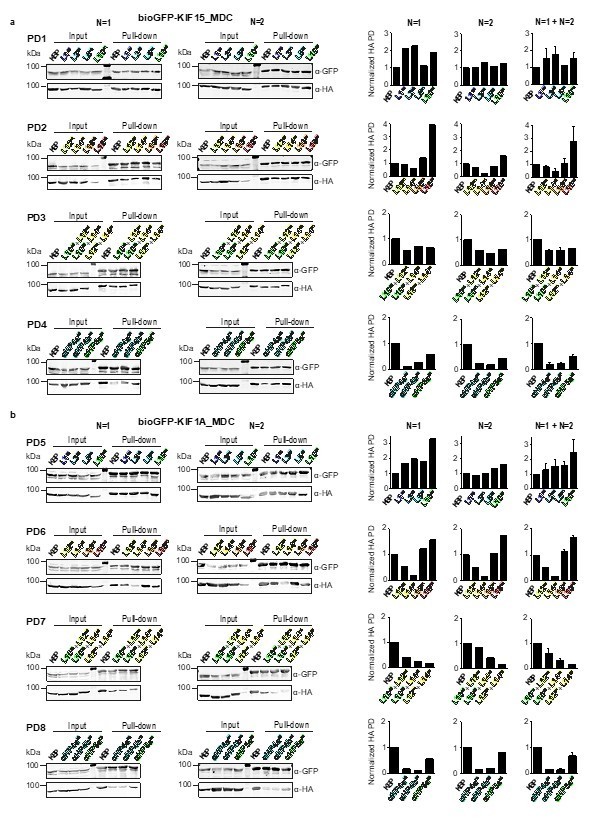
Overview of pull-down experimental data.
Pull-down experiments showing the interaction between (a) KIF15_MDC or (b) KIF1A_MDC and mutated KBP constructs in HEK293T cell lysates. Two individual experiments for each pull-down are shown. Graphs on the right show the quantification of the intensity of the mutated HA-KBP construct in the pull-down fraction over the input fraction divided by the intensity of bioGFP_MDC in the pull-down fraction and normalized to HA-KBP. Quantifications of single experiments are shown as well as graphs combining the results from both experiments. Data are displayed as mean ± s.e.m. (data from two independent experiments).
Videos
Video 1
Kinesin-binding protein (KBP) undergoes conformational change to relieve clashes when forming a complex with KIF15_MD6S.
The KBP-alone model was superimposed on the KBP–KIF15_MD6S model using UCSF Chimera’s matchmaker (Pettersen et al., 2004). A conformational morph movie was then generated in Chimera between the KBP-alone and KIF15 motor domain bound states, with KIF15_MD6S shown throughout to illustrate the relief of clashes. The N-terminal and C-terminal subdomains are coloured in olive and gold respectively, as in Figure 2a and b, while KIF15_MD6S is shown in pale magenta. Distances between identified clashing atoms when KBP-alone is superimposed onto the KBP–KIF15_MD6S model are indicated by red linking lines and KBP clashing residues and side chains shown in cyan. Atoms that were clashing remain coloured while the red lines gradually disappear as the clashes are relieved by the conformational change. Clashes were calculated in Chimera using default criteria.
Video 2
Interaction of kinesin-binding protein (KBP) with the KIF15 motor domain.
Model of the KBP–KIF15_MD6S complex (ribbon representation) displayed in experimental cryo-electron microscopy density. The N-terminal (olive) and C-terminal (gold) subdomains and the linker region (black) are shown in KBP, while the KIF15_MD6S Switch 1/2 subdomain (Switch 1/2 subdomain) is coloured sienna, the P-loop subdomain (Kin-PLsd) is coloured light pink and the Kif15_MD tubulin-binding subdomain (TBsd) is coloured magenta. Semi-transparent density is coloured regionally as per the fitted model and additional density for the linker loop is shown in semi-transparent black.
Tables
Table 1
Cryo-electron microscopy reconstruction information and model refinement statistics and model geometry.
Data collection, processing, and model refinement information for the kinesin-binding protein (KBP), KBP–KIF15_MD6S, and KIF15_MD6S–MT datasets.
| KBP (EMDB: EMD-11338, PDB: 6ZPG) | KBP–KIF15_MD6S (EMDB: EMD-11339, PDB: 6ZPH) | KIF15_MD6S–MT (EMDB: EMD-11340, PDB: 6ZPI) | |
|---|---|---|---|
| Data collection and processing | |||
| Pixel size (Å)* | 1.055, 1.043, or 1.047 | 1.047 | 1.39 |
| Number of micrographs (collected, final)* | 9360, 7547 | 6497, 5138 | 214,202 |
| Final particle number | 258,049 (81,628 of which on graphene oxide) | 7513 | 12,674 |
| Map resolution (Å) FSC threshold† | 4.6 Independent half-map FSC 0.143 | 6.9 Independent half-map FSC 0.143 | 4.5 Independent half-map FSC 0.143 |
| Refinement | |||
| Refinement resolution (Å) CC_mask‡ | 4.6 0.64 | 6.9 0.74 | 6 0.60 |
| Map sharpening B-factor (Å2) | −200 | −495 | −134 |
| Model composition Nonhydrogen atoms Protein residues Ligands | 3808 610 0 | 6232 948 1 | 9420 1185 4 |
| R.m.s. deviations§ Bond lengths (Å) Bond angles (°) | 0.01 0.96 | 0.01 1.07 | 0.08 0.17 |
| Validation# MolProbity score Clashscore Poor rotamers (%) | 1.66 5.25 0.5% | 1.84 7.31 0.9% | 1.95 13.25 0.1% |
| Ramachandran plot# Favoured (%) Allowed (%) Outliers (%) | 94.38 5.62 0 | 93.13 6.87 0 | 95.38 4.62 0 |
-
*Inclusive of all data collection sessions.
†The resolution value at the gold-standard Fourier Shell Correlation (FSC) 0.143 criterion between independently refined half-maps.
-
‡Cross-correlation provided by Phenix real-space refine (Afonine et al., 2018).
§Root-mean-square deviations of bond lengths or angles in the model.
-
#As defined by the MolProbity validation server (Chen et al., 2010).
Key resources table
| Reagent type (species) or resource | Designation | Source or reference | Identifiers | Additional information |
|---|---|---|---|---|
| Gene (Homo sapiens) | KIAA1279 | GenBank | HGNC:23419 | |
| Gene (Mus musculus) | KIF1A | GenBank | MGI:108391 | |
| Gene (Mus musculus) | KIF15 | GenBank | MGI:1098258 | |
| Strain, strain background (Escherichia coli) | BL21(DE3) | NEB | Cat. #: C2527H | Competent cells |
| Strain, strain background (Escherichia coli) | BL21-Gold (DE3) | Agilent | Cat. #: 230130 | Competent cells |
| Strain, strain background (Escherichia coli) | Rosetta2 (DE3) | Novagen | Cat. #: 71400 | Competent cells |
| Cell line (Homo sapiens) | Human embryonic kidney 239T (HEK293T) | ATCC | CRL-3216 RRID:CVCL_0063 | |
| Cell line (Cercopithecus aethiops) | Cercopithecus aethiops kidney (COS-7) | ATCC | CRL-1651 RRID:CVCL_0224 | |
| Peptide, recombinant protein | Porcine tubulin (>99% pure) | Cytoskeleton Inc | Cat. #: T240 | |
| Antibody | Anti-HA (mouse monoclonal) | Roche | Cat# 11666606001; RRID:AB_514506 | IF (1:500) |
| Antibody | Anti-mouse IgG1, Alexa488 (goat polyclonal) | Thermo Fisher Scientific | Cat# A-21121, RRID:AB_2535764 | IF (1:400) |
| Antibody | Anti-HA (mouse monoclonal) | Biolegend | Cat# 901533; RRID:AB_2801249 | WB (1:2000) |
| Antibody | Anti-GFP (rabbit polyclonal) | Abcam | Cat# ab290; RRID:AB_303395 | WB (1:10000) |
| Antibody | Anti-rabbit IgG antibody, IRDye 680LTconjugated (goat polyclonal) | LI-COR Biosciences | Cat# 827–11081; RRID:AB_10795015 | WB (1:20000) |
| Antibody | Anti-mouse IgG antibody, IRDye 800CWconjugated (goat polyclonal) | LI-COR Biosciences | Cat# 827–08364; RRID:AB_10793856 | WB (1:15000) |
| Recombinant DNA reagent | KBP (plasmid) | Kevenaar et al., 2016 | Described in Materials and methods | |
| Recombinant DNA reagent | KIF1A_MD (plasmid) | Atherton et al., 2014 | Described in Materials and methods | |
| Recombinant DNA reagent | KIF15_MD (plasmid) | This study | Described in Materials and methods | |
| Recombinant DNA reagent | pebioGFP (plasmid) | van der Vaart et al., 2013 | N/A | Described in Materials and methods |
| Recombinant DNA reagent | BirA coding vector (plasmid) | van der Vaart et al., 2013 | N/A | Described in Materials and methods |
| Recombinant DNA reagent | GW1–PEX3–mRFP–FKBP1 (plasmid) | Kevenaar et al., 2016 | N/A | Described in Materials and methods |
| Recombinant DNA reagent | β-actin–Kif1A_MDC–FRB (plasmid) | Kevenaar et al., 2016 | N/A | Described in Materials and methods |
| Recombinant DNA reagent | β-actin–Kif15_MDC–FRB (plasmid) | This study | N/A | Described in Materials and methods |
| Recombinant DNA reagent | pebioGFP-Kif1A_MDC (plasmid) | This study | N/A | Described in Materials and methods |
| Recombinant DNA reagent | pebioGFP-Kif15_MDC (plasmid) | This study | N/A | Described in Materials and methods |
| Recombinant DNA reagent | pGW1–HA–KBP (plasmid) | This study | N/A | Described in Materials and methods |
| Recombinant DNA reagent | pGW1–HA–KBP_L1 (plasmid) | This study | N/A | Described in Materials and methods |
| Recombinant DNA reagent | pGW1–HA–KBP_L3 (plasmid) | This study | N/A | Described in Materials and methods |
| Recombinant DNA reagent | pGW1–HA–KBP_L5 (plasmid) | This study | N/A | Described in Materials and methods |
| Recombinant DNA reagent | pGW1–HA–KBP_L10 (plasmid) | This study | N/A | Described in Materials and methods |
| Recombinant DNA reagent | pGW1–HA–KBP_L12 (plasmid) | This study | N/A | Described in Materials and methods |
| Recombinant DNA reagent | pGW1–HA–KBP_L14 (plasmid) | This study | N/A | Described in Materials and methods |
| Recombinant DNA reagent | pGW1–HA–KBP_L16 (plasmid) | This study | N/A | Described in Materials and methods |
| Recombinant DNA reagent | pGW1–HA–KBP_L18 (plasmid) | This study | N/A | Described in Materials and methods |
| Recombinant DNA reagent | pGW1–HA–KBP_L10+L12 (plasmid) | This study | N/A | Described in Materials and methods |
| Recombinant DNA reagent | pGW1–HA–KBP_L10+L14 (plasmid) | This study | N/A | Described in Materials and methods |
| Recombinant DNA reagent | pGW1–HA–KBP_L12+L14 (plasmid) | This study | N/A | Described in Materials and methods |
| Recombinant DNA reagent | pGW1–HA–KBP_αHP4a (plasmid) | This study | N/A | Described in Materials and methods |
| Recombinant DNA reagent | pGW1–HA–KBP_αHP4b (plasmid) | This study | N/A | Described in Materials and methods |
| Recombinant DNA reagent | pGW1–HA–KBP_αHP5a (plasmid) | This study | N/A | Described in Materials and methods |
| Sequence-based reagent | KBP_fwd | This study | PCR primer for KBP mutants | TATTATTATGGCGCGCCAGGATCCCCGGAATTCGGCACGAGGGAGGCCGCTATGGCGAACGTTCCGTGGGCA |
| Sequence-based reagent | KBP_rev | This study | PCR primer for KBP mutants | CTCGTCGACTCCTAATCCTTAAGTCAGGGCCATCTT |
| Sequence-based reagent | KBP_L1_fwd | This study | PCR primer for KBP_L1 | CTGCATAAAAATCCGGCAGCAGCACCAGCAGCATCCAAATACAGCGCC |
| Sequence-based reagent | KBP_L1_rev | This study | PCR primer for KBP_L1 | GGCGCTGTATTTGGATGCTGCTGGTGCTGCTGCCGGATTTTTATGCAG |
| Sequence-based reagent | KBP_L3_fwd | This study | PCR primer for KBP_L3 | TGAACCACATCGACGCAGGAGGACTGTCGGCGGGGGA |
| Sequence-based reagent | KBP_L3_rev | This study | PCR primer for KBP_L3 | TCCCCCGCCGACAGTCCTCCTGCGTCGATGTGGTTCA |
| Sequence-based reagent | KBP_L5_fwd | This study | PCR primer for KBP_L5 | ATCTTGTGGTCTGAAGCAGGAGCAATTGAAACTGCACAG |
| Sequence-based reagent | KBP_L5_rev | This study | PCR primer for KBP_L5 | CTGTGCAGTTTCAATTGCTCCTGCTTCAGACCACAAGAT |
| Sequence-based reagent | KBP_L10_fwd | This study | PCR primer for KBP_L10 | TTTGGTCAAACTGGAGCAGGAGCAGGAGCAGGAGCAGGACCAGCAGGAGCAGGAGCAGGACCAGGAGGATATCATCAAAGAAA |
| Sequence-based reagent | KBP_L10_rev | This study | PCR primer for KBP_L10 | TTTCTTTGATGATATCCTCCTGGTCCTGCTCCTGCTCCTGCTGGTCCTGCTCCTGCTCCTGCTCCTGCTCCAGTTTGACCAAA |
| Sequence-based reagent | KBP_L12_fwd | This study | PCR primer for KBP_L12 | GAGTTCTTTCAGATTGGCGGCGCGGTCACTGACCATATT |
| Sequence-based reagent | KBP_L12_rev | This study | PCR primer for KBP_L12 | AATATGGTCAGTGACCGCGCCGCCAATCTGAAAGAACTC |
| Sequence-based reagent | KBP_L14_fwd | This study | PCR primer for KBP_L14 | TAGAGCCCCTAACTGTAGCAGCAGGACCAGCAGCATATCTGTTGGTCAAC |
| Sequence-based reagent | KBP_L14_rev | This study | PCR primer for KBP_L14 | GTTGACCAACAGATATGCTGCTGGTCCTGCTGCTACAGTTAGGGGCTCTA |
| Sequence-based reagent | KBP_L16_fwd | This study | PCR primer for KBP_L16 | TCCCTGAGAGACCCAGCAGCAGGAGCACCAGCAGGAGCAGGAGCAGGAGCAGCACGCCCTGCCATGTTA |
| Sequence-based reagent | KBP_L16_rev | This study | PCR primer for KBP_L16 | TAACATGGCAGGGCGTGCTGCTCCTGCTCCTGCTCCTGCTGGTGCTCCTGCTGCTGGGTCTCTCAGGGA |
| Sequence-based reagent | KBP_L18_fwd | This study | PCR primer for KBP_L18 | ATTGTTGATTACTGTGCAGCAGGACCAGGAGCCGCCCAGGAAATA |
| Sequence-based reagent | KBP_L18_rev | This study | PCR primer for KBP_L18 | TATTTCCTGGGCGGCTCCTGGTCCTGCTGCACAGTAATCAACAAT |
| Sequence-based reagent | KBP_HP4a_fwd | This study | PCR primer for KBP_L HP4a | ACTCATAACCTATATGCACTAGCTGCAGTCTACCAGCATCTG |
| Sequence-based reagent | KBP_L HP4a _rev | This study | PCR primer for KBP_ HP4a | CAGATGCTGGTAGACTGCAGCTAGTGCATATAGGTTATGAGT |
| Sequence-based reagent | KBP_HP4b_fwd | This study | PCR primer for KBP_L HP4b | AGTACACTAAAACGCGCACTTGAGCACAATGCC |
| Sequence-based reagent | KBP_L HP4b _rev | This study | PCR primer for KBP_ HP4b | GGCATTGTGCTCAAGTGCGCGTTTTAGTGTACT |
| Sequence-based reagent | KBP_HP5a_fwd | This study | PCR primer for KBP_L HP5a | GCTATCAATGCTGCTGCGTTGTCAGCGTTTTACATCAATAAG |
| Sequence-based reagent | KBP_ HP5a _rev | This study | PCR primer for KBP_ HP5a | CTTATTGATGTAAAACGCTGACAACGCAGCAGCATTGATAGC |
| Sequence-based reagent | KIF15_FRB_fwd | This study | PCR primer for KIF15–FRB | AAGCTTGCCACCATGGGCGCGCCTGCCACCATGGCTCCTGGCTGCAAATCT |
| Sequence-based reagent | KIF15_FRB_rev | This study | PCR primer for KIF15–FRB | AGAGGATTCTAGAAGCAGGCGCGCCAGCGTAGTCTGGGACGTCGTATGGGTAGAATTCTCCTGGTGTCAGCTGCCCAGA |
| Sequence-based reagent | bioGFPKIF15 _fwd | This study | PCR primer for bioGFPKIF15 | AGCTCAAGCTTCGAATTGGGCGCGCCAGCCACCATGGCTCCTGGCTGCAAATCT |
| Sequence-based reagent | bioGFPKIF15_rev | This study | PCR primer for bioGFPKIF15 | GAATTCGATATCCTGCAGGTCGACTCCAGATCCTCATCCTGGTGTCAGCTGCCCAGA |
| Sequence-based reagent | bioGFPKIF1A _fwd | This study | PCR primer for bioGFPKIF1A | TATTATAATGGCGCGCCAGCCACCGCCGGGGCCTCTGTGAAGGT |
| Sequence-based reagent | bioGFPKIF1A_rev | This study | PCR primer for bioGFPKIF1A | CTCGTCGACTCCTCCTCCTCATTTGGGAGAAAACACACCCAA |
| Commercial assay or kit | EnzChek Phosphate Assay Kit | Invitrogen | E6646 | |
| Chemical compound, drug | AP21967 | TaKaRa | Cat# 635057 | 1 µM |
| Chemical compound, drug | PEI | PolySciences | Cat# 24765–2 | |
| Chemical compound, drug | Fugene | Promega | Cat# E2692 | |
| Software, algorithm | ImageJ | NIH | https://imagej.nih.gov/ij/; RRID:SCR_003070 | |
| Software, algorithm | RELION | Zivanov et al., 2018 | n/a | |
| Software, algorithm | CryoSparc2 | Punjani et al., 2017 | n/a | |
| Software, algorithm | CisTEM | Grant et al., 2018 | n/a | |
| Software, algorithm | MiRP | Cook et al., 2020 | n/a | Protocol implemented in RELION |
Table 2
Kinesin-binding protein (KBP) mutants used in this study.
The original and mutated amino acid (top) and nucleotide sequences (bottom) are shown for each construct.
| Construct | Original sequence | Mutated to |
|---|---|---|
| L1 | EKEPYK gagaaggaaccatacaag | AAAPAA gcagcagcaccagcagca |
| L3 | TEE acggaggag | AGG gcaggagga |
| L5 | REE agagaagaa | AGA gcaggagca |
| L10 | KISATEDTPEAEGEVPEL aagatctcagccacagaagacactcctgaagctgaaggagaagtgccagagctt | AGAGAGAGPAGAGAGPGG gcaggagcaggagcaggagcaggaccagcaggagcaggagcaggaccaggagga |
| L12 | DGY gatggttat | GGA ggcggcgcg |
| L14 | DLNPQY gacctgaatccacagtat | AAGPAA gcagcaggaccagcagca |
| L16 | NKVFPEHIGEDVL aataaagtattccctgagcatataggggaagatgttctt | AAGAPAGAGAGAA gcagcaggagcaccagcaggagcaggagcaggagcagca |
| L18 | EKHPE gaaaagcatcctgag | AAGPG gcagcaggaccagga |
| αHP4a | YLAQ tacctagctcaa | ALAA gcactagctgca |
| αHP4b | Q cag | A gca |
| αHP5a | TLSQ accttgtcacag | ALSA gcgttgtcagcg |
Additional files
Download links
A two-part list of links to download the article, or parts of the article, in various formats.
Downloads (link to download the article as PDF)
Open citations (links to open the citations from this article in various online reference manager services)
Cite this article (links to download the citations from this article in formats compatible with various reference manager tools)
The mechanism of kinesin inhibition by kinesin-binding protein
eLife 9:e61481.
https://doi.org/10.7554/eLife.61481


