Polo-like kinase acts as a molecular timer that safeguards the asymmetric fate of spindle microtubule-organizing centers
- Centro Andaluz de Biología Molecular y Medicina Regenerativa (CABIMER) / Spanish National Research Council (CSIC) - University of Seville - University Pablo de Olavide, Spain
Figures
Figure 1 with 1 supplement
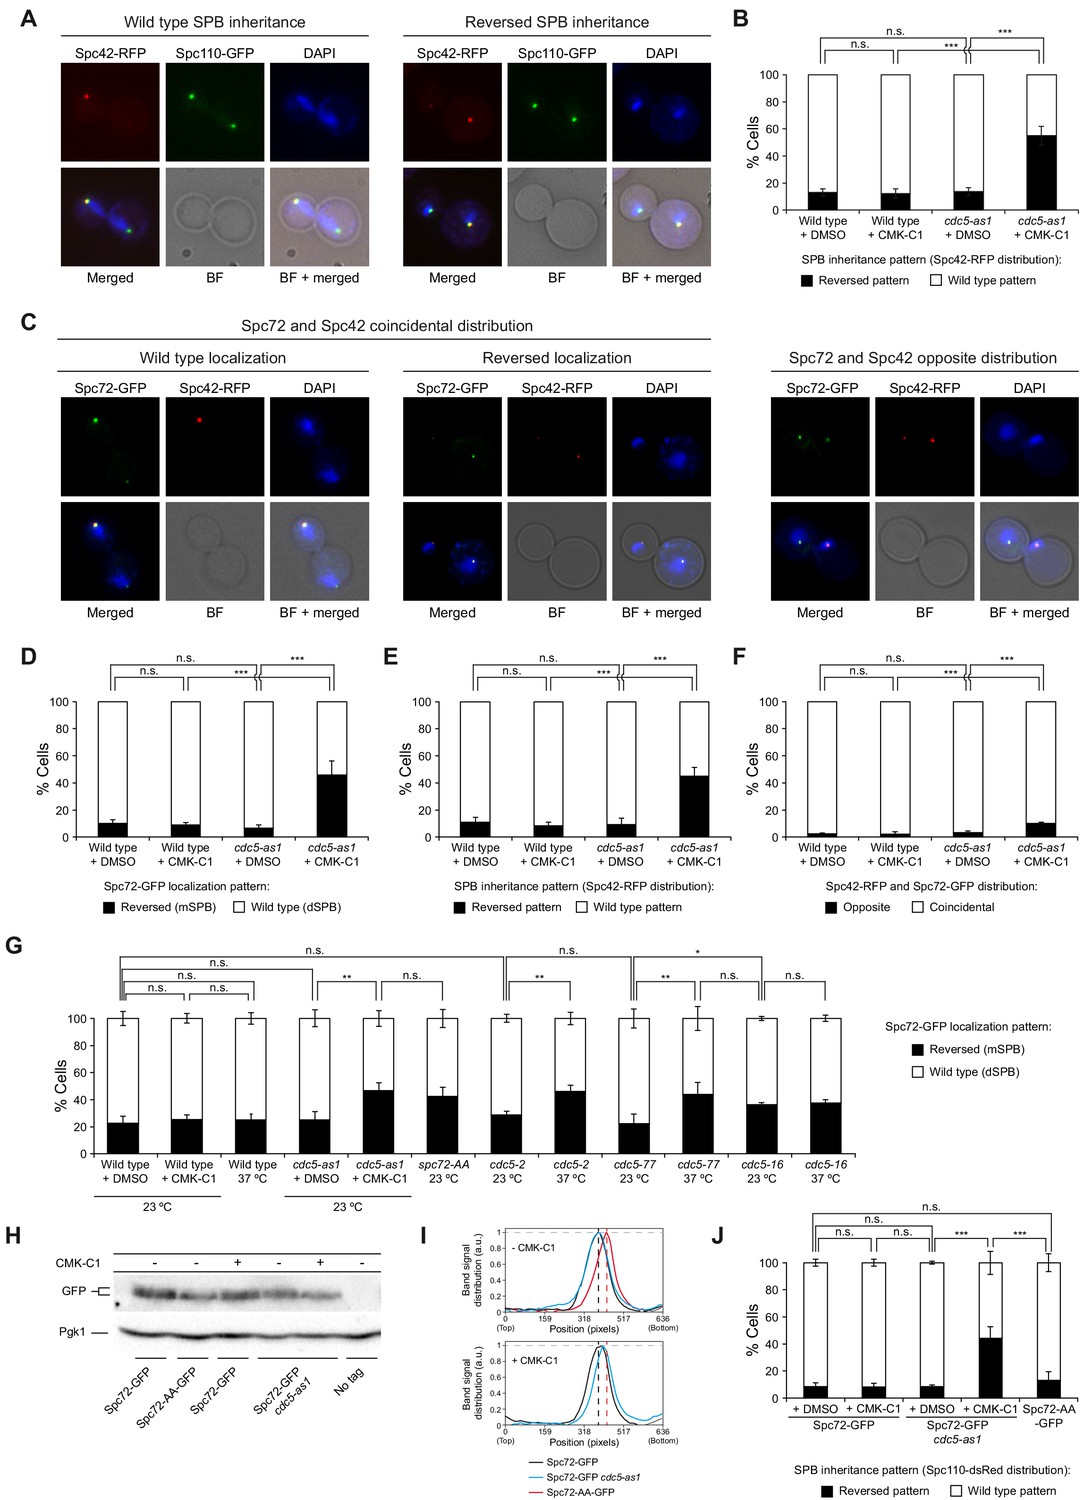
Cdc5 activity is required for asymmetric SPB inheritance and Spc72 distribution.
(A, B) SPB inheritance in wild-type (F2071) and cdc5-as1 (F2741) cells expressing Spc42-RFP and Spc110-GFP. (A) Representative images of Spc42-RFP (red) and Spc110-GFP (green) localization in cells exhibiting wild-type and reversed (old SPB retained in the mother cell) SPB distribution patterns. Also shown are nuclear morphology (DAPI, blue), bright-field (BF), and merged images. (B) The percentage of cells displaying wild-type (white bars) or reversed (black bars) SPB inheritance, based on Spc42-RFP distribution. (C–F) Spc72-GFP distribution and SPB inheritance in wild-type (F3712) and cdc5-as1 (F3707) cells also expressing Spc42-RFP. (C) Representative images showing coincidental or opposite Spc72-GFP (green) and Spc42-RFP (red) distribution, distinguishing in the former between cells exhibiting wild-type (main accumulation in the bud) and reversed (preferential retention in the mother cell) Spc72 localization. Also shown are nuclear morphology (DAPI, blue), BF, and merged images. (D–F) The percentages of cells displaying wild-type (white bars) or reversed (black bars) Spc72-GFP localization (D), wild-type (white bars) or reversed (black bars) SPB inheritance (based on Spc42-RFP distribution) (E), and coincidental (white bars) or opposite (black bars) distribution of both tagged proteins (F). (G) Spc72-GFP distribution in wild-type (F3696), cdc5-as1 (F3699), cdc5-2 (F4439), cdc5-77 (F4705), and cdc5-16 (F4699) cells, and localization of Spc72-AA-GFP mutant protein in a wild-type background (F4606). (H, I) Western blot analyses in asynchronous cultures of wild-type (F3696) or cdc5-as1 (F3699) cells expressing Spc72-GFP, and of wild-type cells expressing the Spc72-AA-GFP mutant (F4606) or untagged Spc72 (F496, No tag). (H) The experiment was performed thrice (n = 3); shown is a representative image displaying the levels of GFP-tagged protein. Pgk1 levels were used as the loading control. (I) Intensity plot profile of the lanes from the blot shown in (H). (J) SPB inheritance in wild-type (F3702) and cdc5-as1 (F3705) cells expressing Spc72-GFP, and in wild-type cells expressing Spc72-AA-GFP (F4608), all simultaneously carrying Spc110-dsRed. Shown is the percentage of wild-type (white bars) or reversed (black bars) SPB inheritance, based on Spc110-dsRed distribution. (B, D, E, F, G, J) Final data are the average of three experiments (n = 3; 100 cells each). Error bars represent the SD. Statistical significance according to the Newman-Keuls multiple comparison test is indicated.
Figure 1—figure supplement 1
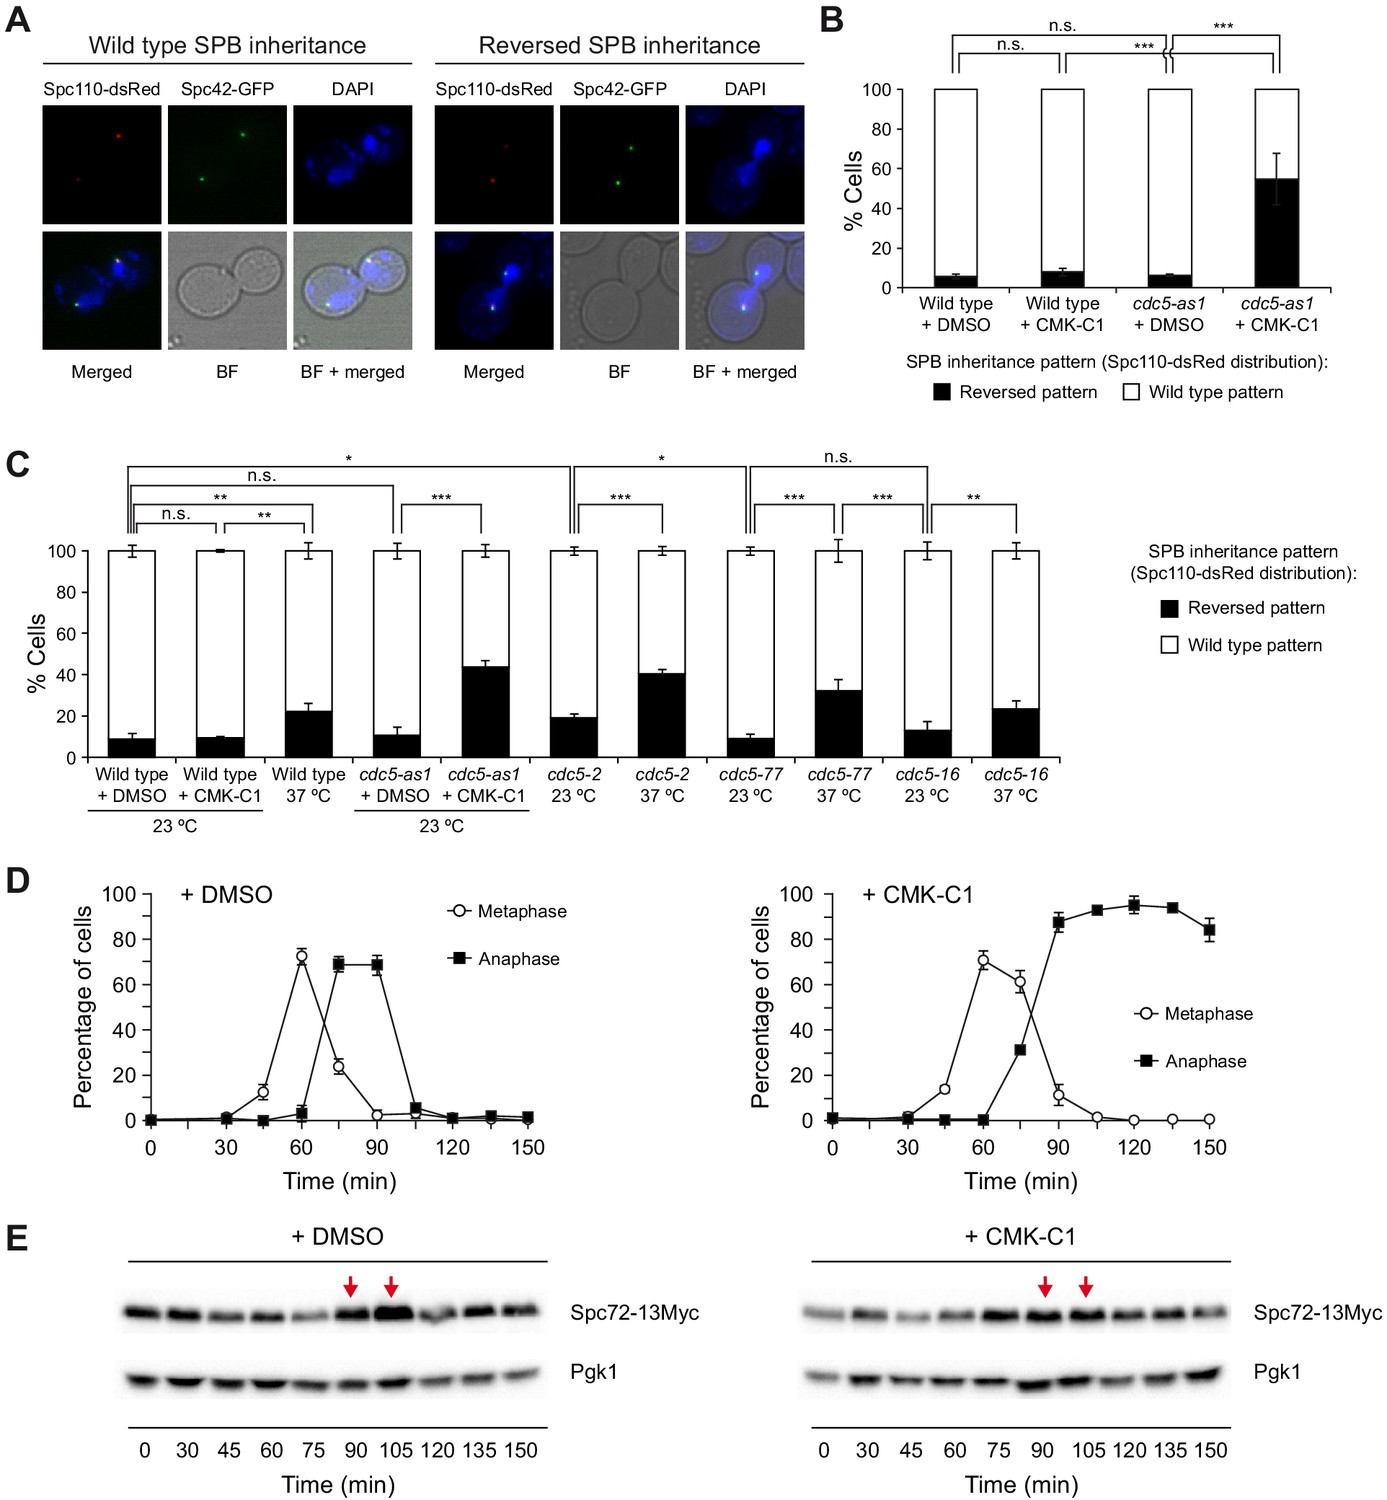
SPB inheritance and Spc72 post-translational modification in cells lacking Cdc5 activity.
(A–C) SPB inheritance in wild type (F2276) and cdc5-as1 (F2865) cells expressing both Spc110-dsRed and Spc42-GFP (A, B), as well as in wild type (F2111), cdc5-as1 (F3703), cdc5-2 (F4441), cdc5-77 (F4702), and cdc5-16 (F4696) cells only expressing Spc110-dsRed (C). Stationary phase cultures in YPAD were diluted to OD600 = 0.2 in fresh medium and grown for 3 hr at 26°C or 23°C. Then, cells were treated (+CMK-C1) or untreated (+DMSO) with 5 µM CMK-C1 at 26°C or 23°C for another 3 hr or alternatively grown at 37°C for 3 hr, as indicated in each case. (A) Representative images of Spc110-dsRed (red) and Spc42-GFP (green) in cells exhibiting wild type (old SPB inherited by the daughter cell) and reversed (old SPB retained in the mother cell) SPB distribution patterns. Also shown are nuclear morphology (DAPI, blue), bright-field (BF), and merged images. (B, C) The percentages of cells displaying wild-type (white bars) or reversed (black bars) SPB inheritance patterns (based on Spc110-dsRed distribution). Final data are the average of three experiments (n = 3; 100 cells/each). Error bars represent the SD. Statistical significance according to the Newman-Keuls multiple comparison test is indicated. (D, E) Cells expressing Cdc5-as1 and Spc72-13Myc (F3897) were grown overnight in YPD at 26°C, diluted to OD600 = 0.2 in fresh medium, arrested in G1 with 5 µg/ml α-factor and finally released at 26°C in YPD medium without pheromone and treated (+CMK-C1) or untreated (+DMSO) with 5 µM CMK-C1. (D) Cell cycle progression according to spindle and nuclear morphologies. The percentages of metaphase and anaphase cells are shown. Final data are the average of three samples (n = 3; 100 cells/each). Error bars represent the SD. (E) Western blot displaying Spc72-13Myc levels. The analysis was performed thrice (n = 3); shown is a representative experiment. Red arrows indicate a gel shift suggesting a post-translational modification of Spc72 in cells treated with DMSO that is reduced after CMK-C1 addition. Pgk1 levels were used as the loading control.
Figure 2 with 1 supplement

Cdc5 regulates Kar9 association with the SPBs.
(A–D) Kar9-sfGFP distribution and SPB inheritance in wild-type (F3754) and cdc5-as1 (F3755) cells also expressing Spc110-dsRed. (A) Representative images showing coincidental or opposite distribution of Kar9-sfGFP (green) and Spc110-dsRed (red), distinguishing in the former between cells exhibiting wild-type and reversed Kar9 localization. Also shown are nuclear morphology (DAPI, blue), BF, and merged images. (B–D) The percentages of cells displaying wild-type (white bars) or reversed (black bars) Kar9-sfGFP localization (B), cells with wild-type (white bars) or reversed (black bars) SPB inheritance patterns (based on Spc110-dsRed distribution) (C), and cells showing coincidental (white bars) or opposite (black bars) distribution of both tagged proteins (D). Final data are the average of three experiments (n = 3; 100 cells each). Error bars represent the SD. Statistical significance according to the Newman-Keuls multiple comparison test is indicated. (E–G) Analysis of Kar9-sfGFP distribution in cells expressing mCherry-Tub1 and cdc5-as1 (F4820). (E) Percentages of cells with Kar9-sfGFP localization to the mSPB or dSPB, to interpolar microtubules, and/or the plus (+) end of mother (mMT) or daughter-attached (dMT) cytoplasmic microtubules, both for cells treated (+CMK-C1, black bars) and untreated (+DMSO, white bars) with CMK-C1. Final data are the average of three experiments (n = 3; 50 cells each). Error bars represent the SEM. (F, G) Representative images of cells illustrating the different localizations of Kar9-sfGFP (green) in the absence (F) or presence (G) of CMK-C1. Also shown are microtubules (mCherry-Tub1, red), nuclear morphology (DAPI, blue), BF, and merged images. (H) Western blot analyses of Kar9-13Myc in asynchronous cultures of wild-type (F3924), cdc5-as1 (F3964), cdc5-2 (F4657), cdc5-77 (F4719), and cdc5-16 (F4717) cells, and in the wild-type untagged control (F496, No tag). The experiment was performed thrice (n = 3); a representative image is shown. Pgk1 levels were used as the loading control.
Figure 2—figure supplement 1
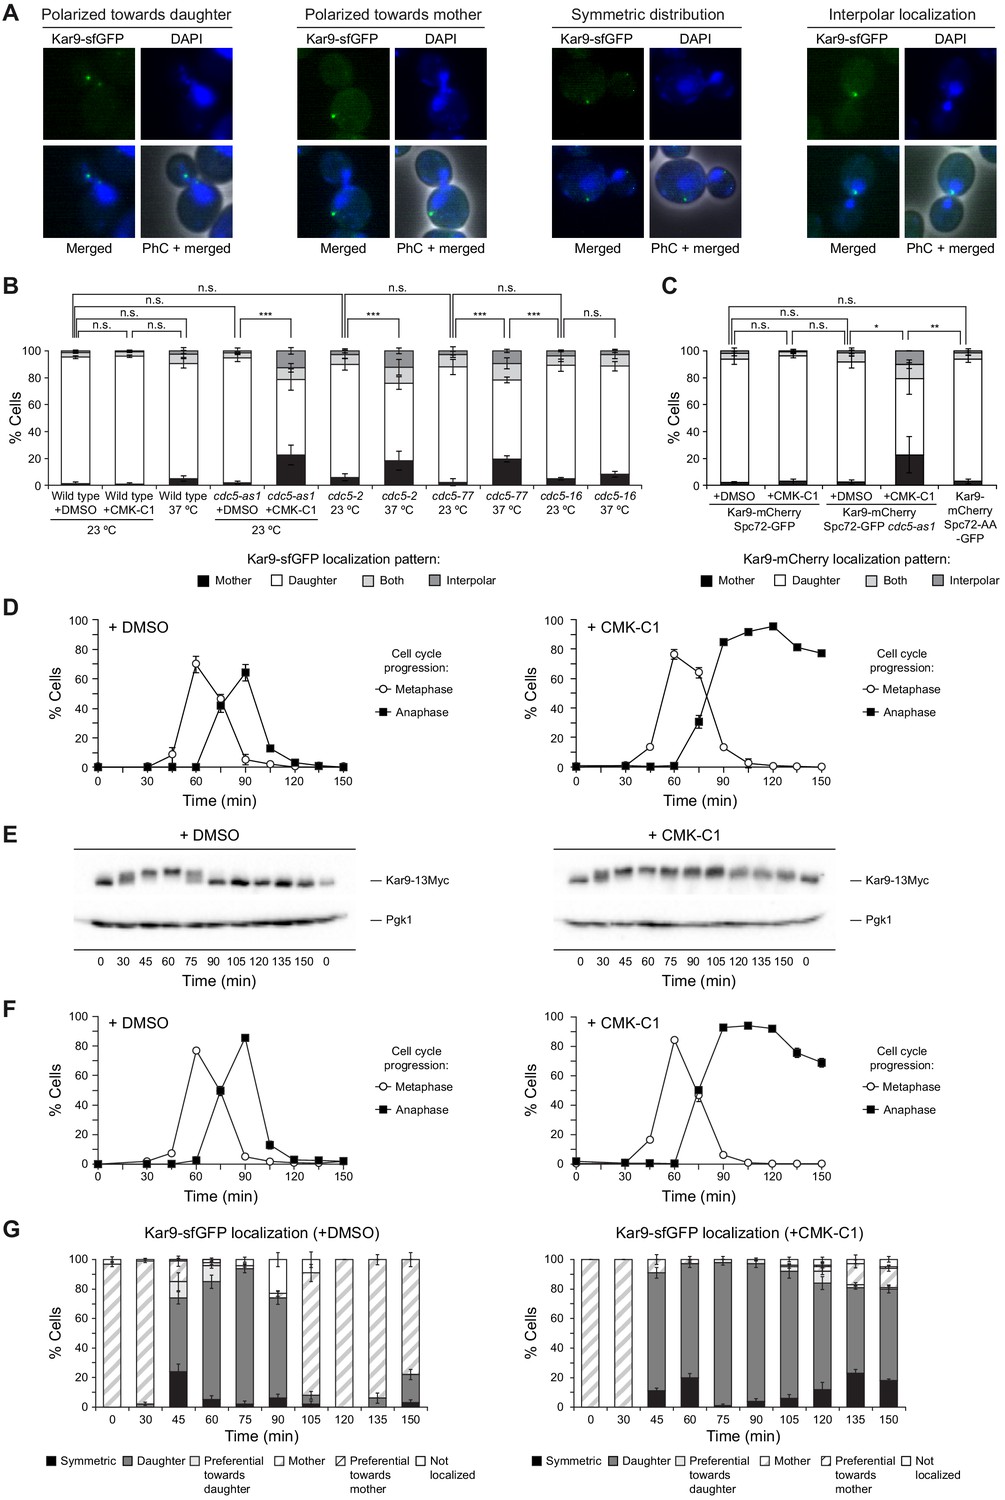
Kar9 distribution and post-translational modification in cells lacking Cdc5 activity.
(A–C) Kar9-sfGFP distribution in wild-type (F3172), cdc5-as1 (F3753), cdc5-2 (F4498), cdc5-77 (F4704), and cdc5-16 (F4698) cells (A, B), as well as Kar9-mCherry localization in wild-type (F4628) and cdc5-as1 (F4684) also expressing Spc72-GFP or wild-type cells instead expressing the Spc72-AA-GFP mutant (F4632) (C). (A) Representative images showing Kar9-sfGFP (green) polarized toward the daughter or the mother cell, symmetrically distributed or localized to interpolar microtubules. Also shown are nuclear morphology (DAPI, blue), phase-contrast (PhC), and merged images. (B, C) The percentages of cells displaying Kar9-sfGFP (B) or Kar9-mCherry (C) polarized toward the mother (black bars) or the daughter (white bars), symmetrically distributed (light grey bars) or localized to interpolar microtubules (dark grey bars). Final data are the average of three experiments (n = 3; 100 cells/each). Error bars represent the SD. Statistical significance according to the Newman-Keuls multiple comparison test is indicated. (D, E) Cells expressing Cdc5-as1 and Kar9-13Myc (F3964) were grown overnight in YPD at 26°C, diluted to OD600 = 0.2 in fresh medium, arrested in G1 with 5 µg/ml α-factor and finally released at 26°C in YPD medium without pheromone and treated (+CMK-C1) or untreated (+DMSO) with 5 µM CMK-C1. (D) Cell cycle progression according to spindle and nuclear morphologies. The percentages of metaphase and anaphase cells are shown. Final data are the average of three samples (n = 3; 100 cells/each). Error bars represent the SD. (E) Western blot showing Kar9-13Myc levels. The analysis was performed twice (n = 2); a representative experiment is shown in each case. Pgk1 levels were used as the loading control. (F, G) Cdc5-as1 cells expressing Kar9-sfGFP and Spc42-mCherry (F3780) were grown overnight in YPAD at 26°C, diluted to OD600 = 0.2 in fresh medium, arrested in G1 with 5 µg/ml α-factor and finally released at 26°C in YPAD medium without pheromone and treated (+CMK-C1) or untreated (+DMSO) with 5 µM CMK-C1. (F) Cell cycle progression according to spindle and nuclear morphologies. The percentages of metaphase and anaphase cells are indicated. Final data are the average of three samples (n = 3; 100 cells/each). Error bars represent the SD. (G) The percentages of cells displaying non-localization of Kar9-sfGFP (white bars) or with Kar9-sfGFP asymmetrically localized (mother, thick striped bars) or preferentially polarized toward the mother cell (preferential toward mother, thin striped bars), asymmetrically localized (daughter, dark grey bars) or preferentially polarized toward the daughter cell (preferential toward daughter, light grey bars), or symmetrically distributed between the mother and the daughter cells (symmetric, black bars). Final data are the average of four samples (n = 4; 25 cells/each). Error bars represent the SD.
Figure 3 with 1 supplement
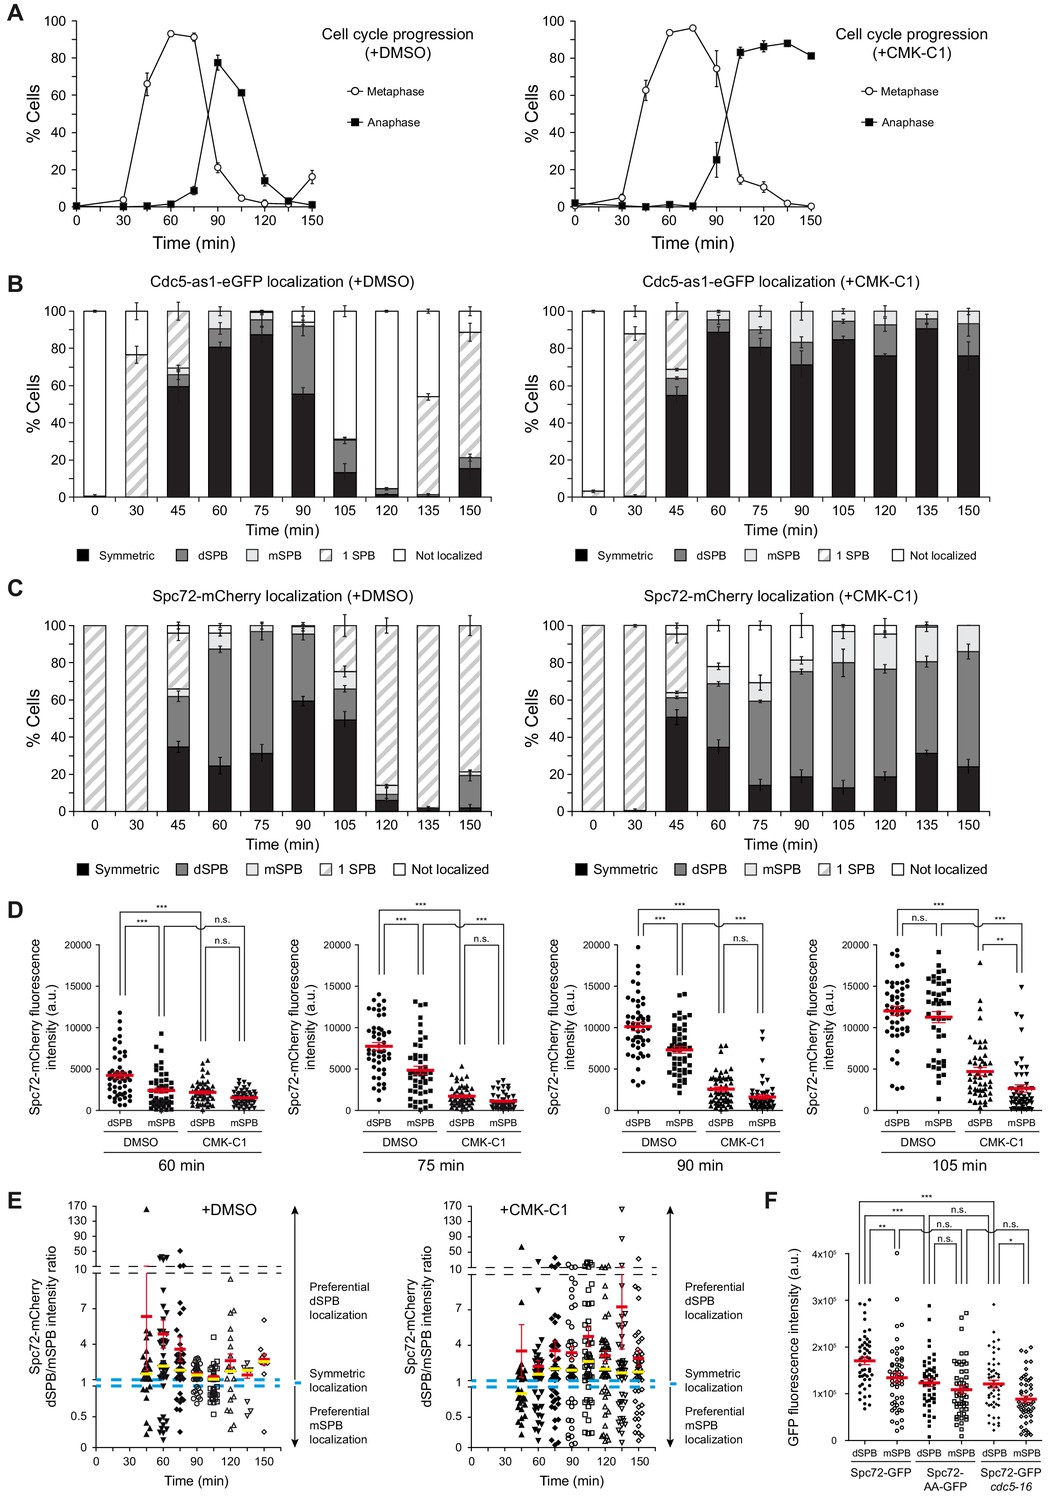
Cell cycle analysis of Cdc5 and Spc72 localization.
(A–E) Cells expressing Cdc5-as1-eGFP and Spc72-mCherry (F3053) were arrested in G1 with α-factor and released at 26°C in YPAD medium with (+CMK-C1) or without (+DMSO) CMK-C1. The experiment was repeated twice (n = 2), with similar results; a representative experiment is shown. (A) Cell cycle progression according to spindle and nuclear morphologies. The percentages of metaphase and anaphase cells are indicated. Final data are the average of three samples (n = 3; 100 cells per each). Error bars represent the SD. (B, C) The percentages of cells displaying localization or non-localization (white bars) of Cdc5-as1-eGFP (B) or Spc72-mCherry (C) to the SPB before its duplication (one SPB, striped bars), or subsequently to both (symmetric, black bars) or preferentially one SPB. In the latter, it is indicated whether the protein was asymmetrically distributed to the dSPB (dark grey bars) or the mSPB (light grey bars). Final data are the average of three samples (n = 3; 50 cells each). Error bars represent the SEM. (D) Scatter plot of Spc72-mCherry fluorescence intensity in the dSPB and mSPB from metaphase to anaphase (60–105 min), in CMK-C1–treated (CMK-C1) or untreated (DMSO) cells. Red bars indicate the mean ± SEM (n = 50 cells). Statistical significance according to the Newman-Keuls multiple comparison test is indicated. (E) Scatter plot displaying the dSPB/mSPB Spc72-mCherry fluorescence intensity ratio throughout the time course in CMK-C1–treated (+CMK-C1) or untreated (+DMSO) cells. The ratio equals one when Spc72 is evenly loaded on both SPBs (dashed blue line), >1 when the protein is asymmetrically localized on the dSPB, and <1 when it is preferentially found on the mSPB. The Y-axis is divided into three different scales to facilitate visualization of all samples. Red bars indicate the mean ± SEM and yellow bars the median (n = up to 50 cells displaying two SPBs at each time point). (F) Scatter plot of GFP fluorescence intensity in the dSPB and mSPB in asynchronous wild-type (F3696) and cdc5-16 (F4699) cells expressing Spc72-GFP, and in wild-type cells expressing Spc72-AA-GFP (F4606) during anaphase. Red bars indicate the mean ± SEM (n = 50 cells). Statistical significance according to the Newman-Keuls multiple comparison test is indicated.
Figure 3—figure supplement 1
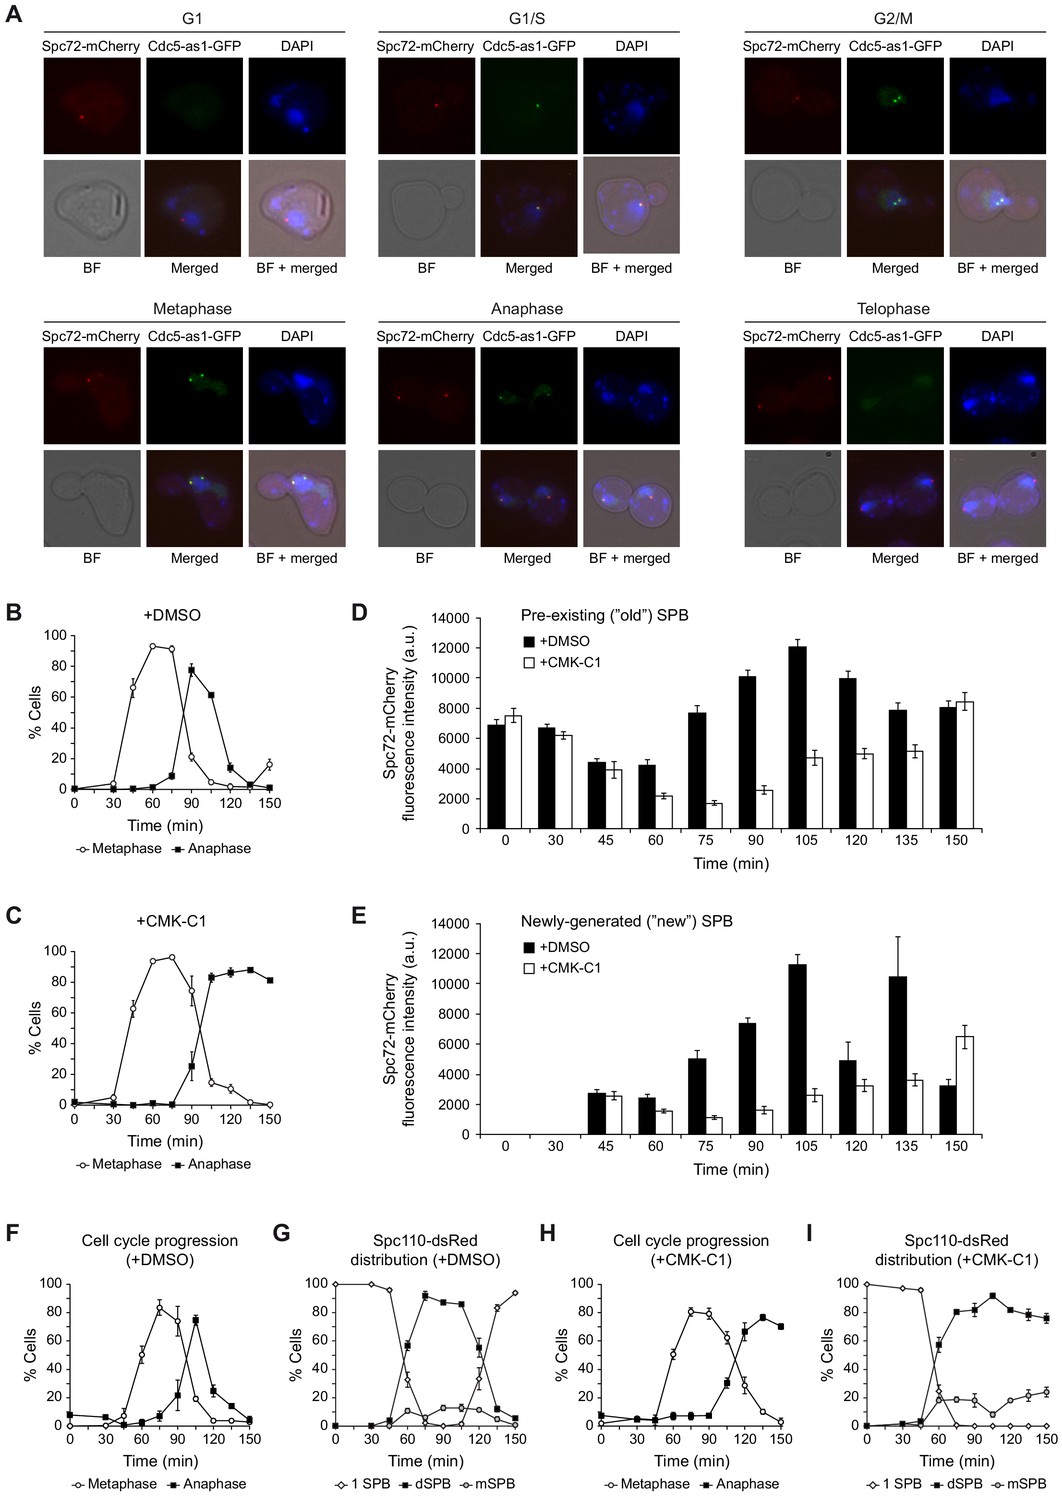
Spc72 and SPB distribution during a synchronous cell cycle.
(A–E) Cells expressing Cdc5-as1-eGFP and Spc72-mCherry (F3053) were grown overnight in YPAD at 26°C, diluted to OD600 = 0.2 in fresh medium, arrested in G1 with 5 µg/ml α-factor and finally released at 26°C in YPAD medium without pheromone and treated (+CMK-C1) or untreated (+DMSO) with 5 µM CMK-C1. The experiment was repeated twice (n = 2), with similar results. An illustrative experiment is shown. (A) Representative images showing Spc72-mCherry (red) and Cdc5-as1-eGFP (green) localization at different cell cycle stages. Also shown are nuclear morphology (DAPI, blue), BF, and merged images. (B, C) Cell cycle progression according to spindle and nuclear morphologies. The percentages of metaphase and anaphase cells are indicated. Final data are the average of three samples (n = 3; 100 cells/each). Error bars represent the SD. Please note that these graphs are the same shown in Figure 3A, but are included again here to facilitate interpretation of the results shown in (D) and (E). (D, E) Spc72-mCherry fluorescence intensity in the pre-existing (D) and the newly generated (E) SPBs throughout the cell cycle in cells treated with (+CMK-C1, white bars) or without (+DMSO, black bars) CMK-C1. Error bars represent the SEM (n = up to 50 cells displaying two SPBs at each time point). (F–I) Cells expressing Cdc5-as1-eGFP and Spc110-dsRed (F3766) fusions were grown for 24 hr in YPAD at 26°C, diluted to OD600 = 0.2 in fresh medium, arrested in G1 with 5 µg/ml α-factor and finally released at 26°C in YPAD medium without pheromone and treated (+CMK-C1) or not (+DMSO) with 5 µM CMK-C1. Final data are the average of three samples (n = 3; 100 cells/each (F, H) or 50 cells/each (G, I)). Error bars represent the SD. (F, H) Cell cycle progression according to spindle and nuclear morphologies. The percentages of metaphase (white circles) and anaphase (black squares) cells are shown for each time point. (G, I) SPB inheritance based on Spc110-dsRed distribution. The graphs show the percentages of cells carrying only one SPB (1 SPB, white diamonds), and cells displaying wild type (Spc110-dsRed preferentially localized on the dSPB, black squares) or reversed (Spc110-dsRed asymmetrically loaded on the mSPB, gray circles) SPB inheritance after SPB duplication.
Figure 4
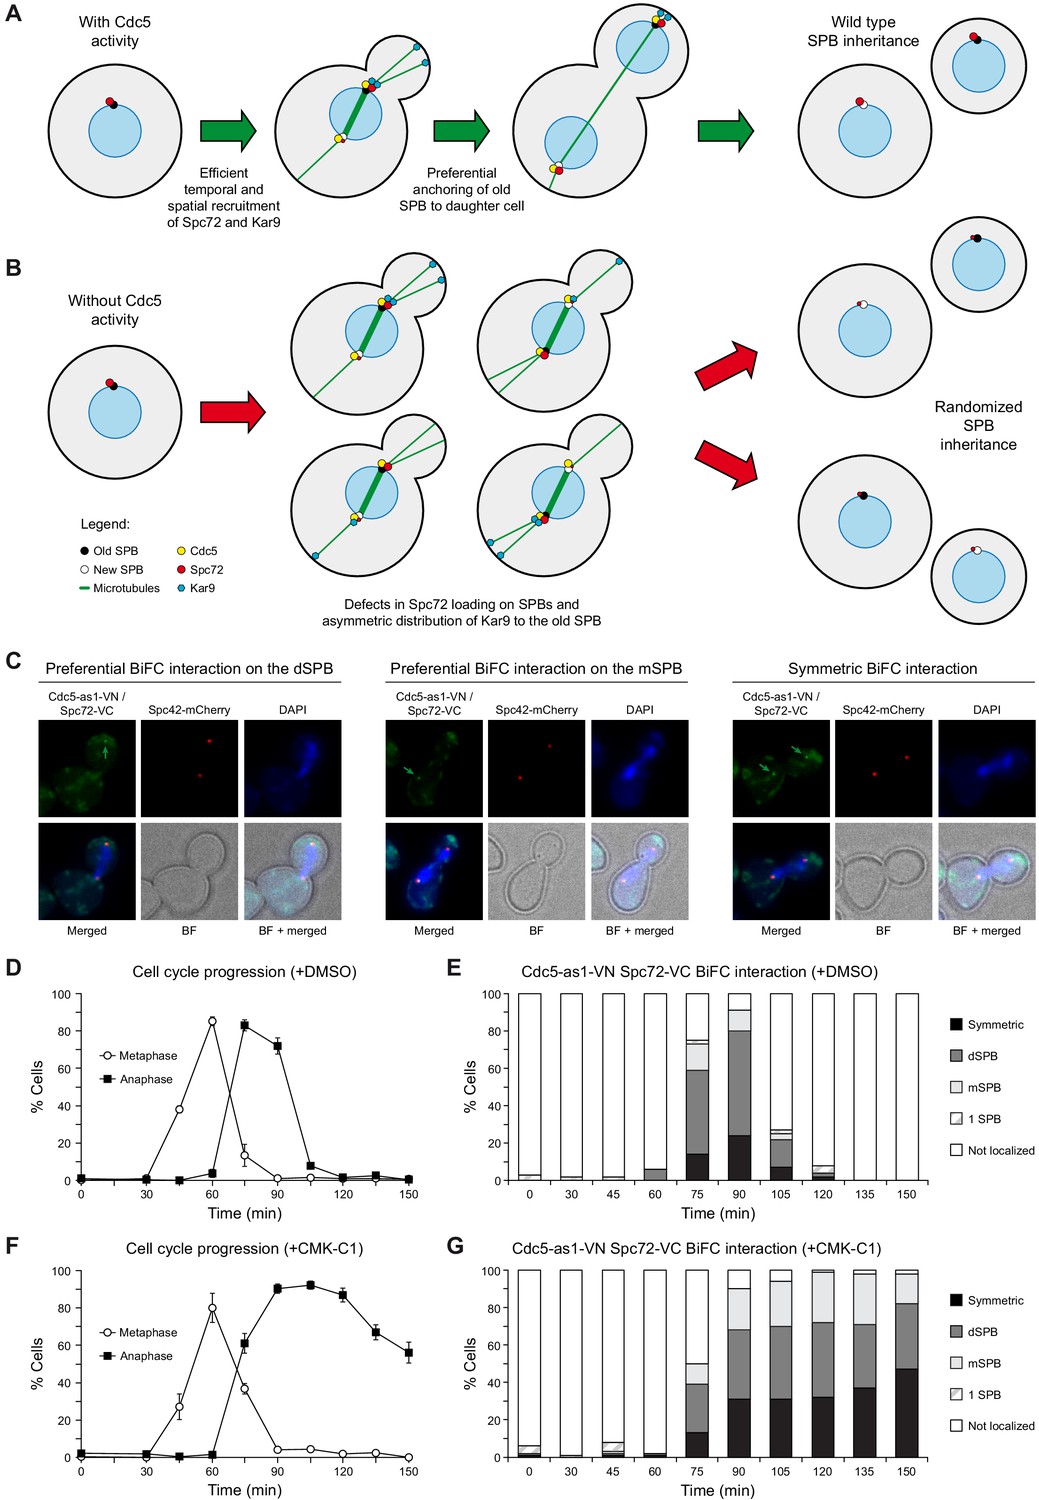
BiFC analysis of Cdc5 and Spc72 interaction.
(A, B) Model depicting the role of Cdc5 in the control of Spc72 and Kar9 function on SPB distribution (A) and the consequences of the lack of its kinase activity on the predetermined SPB inheritance pattern in budding yeast (B). (C–G) Cells expressing Cdc5-as1-VN and Spc72-VC (F3420) were arrested in G1 with α-factor and released at 26°C in YPAD medium with (+CMK-C1) or without (+DMSO) CMK-C1. The experiment was repeated twice (n = 2), with similar results; a representative experiment is shown. (C) Representative images displaying BiFC interaction and reconstitution of Venus fluorescence (Cdc5-as1-VN/Spc72-VC, green) and Spc42-mCherry fluorescence (red) distribution. The green arrow marks the SPB where the BiFC association is observed. Also shown are nuclear morphology (DAPI, blue), BF, and merged images. (D, F) Cell cycle progression according to spindle and nuclear morphologies. The percentages of metaphase and anaphase cells are indicated. Final data are the average of three samples (n = 3; 100 cells each). Error bars represent the SD. (E, G) Percentages of cells displaying or not displaying (non-localized, white bars) Venus fluorescence on the SPB before its duplication (one SPB, striped bars), or subsequently, on both (symmetric, black bars) or preferentially one SPB. In the latter, it is indicated whether the Venus fluorescent signal was asymmetrically distributed to the dSPB (dark grey bars) or the mSPB (light grey bars) (n = 100).
Figure 5 with 3 supplements

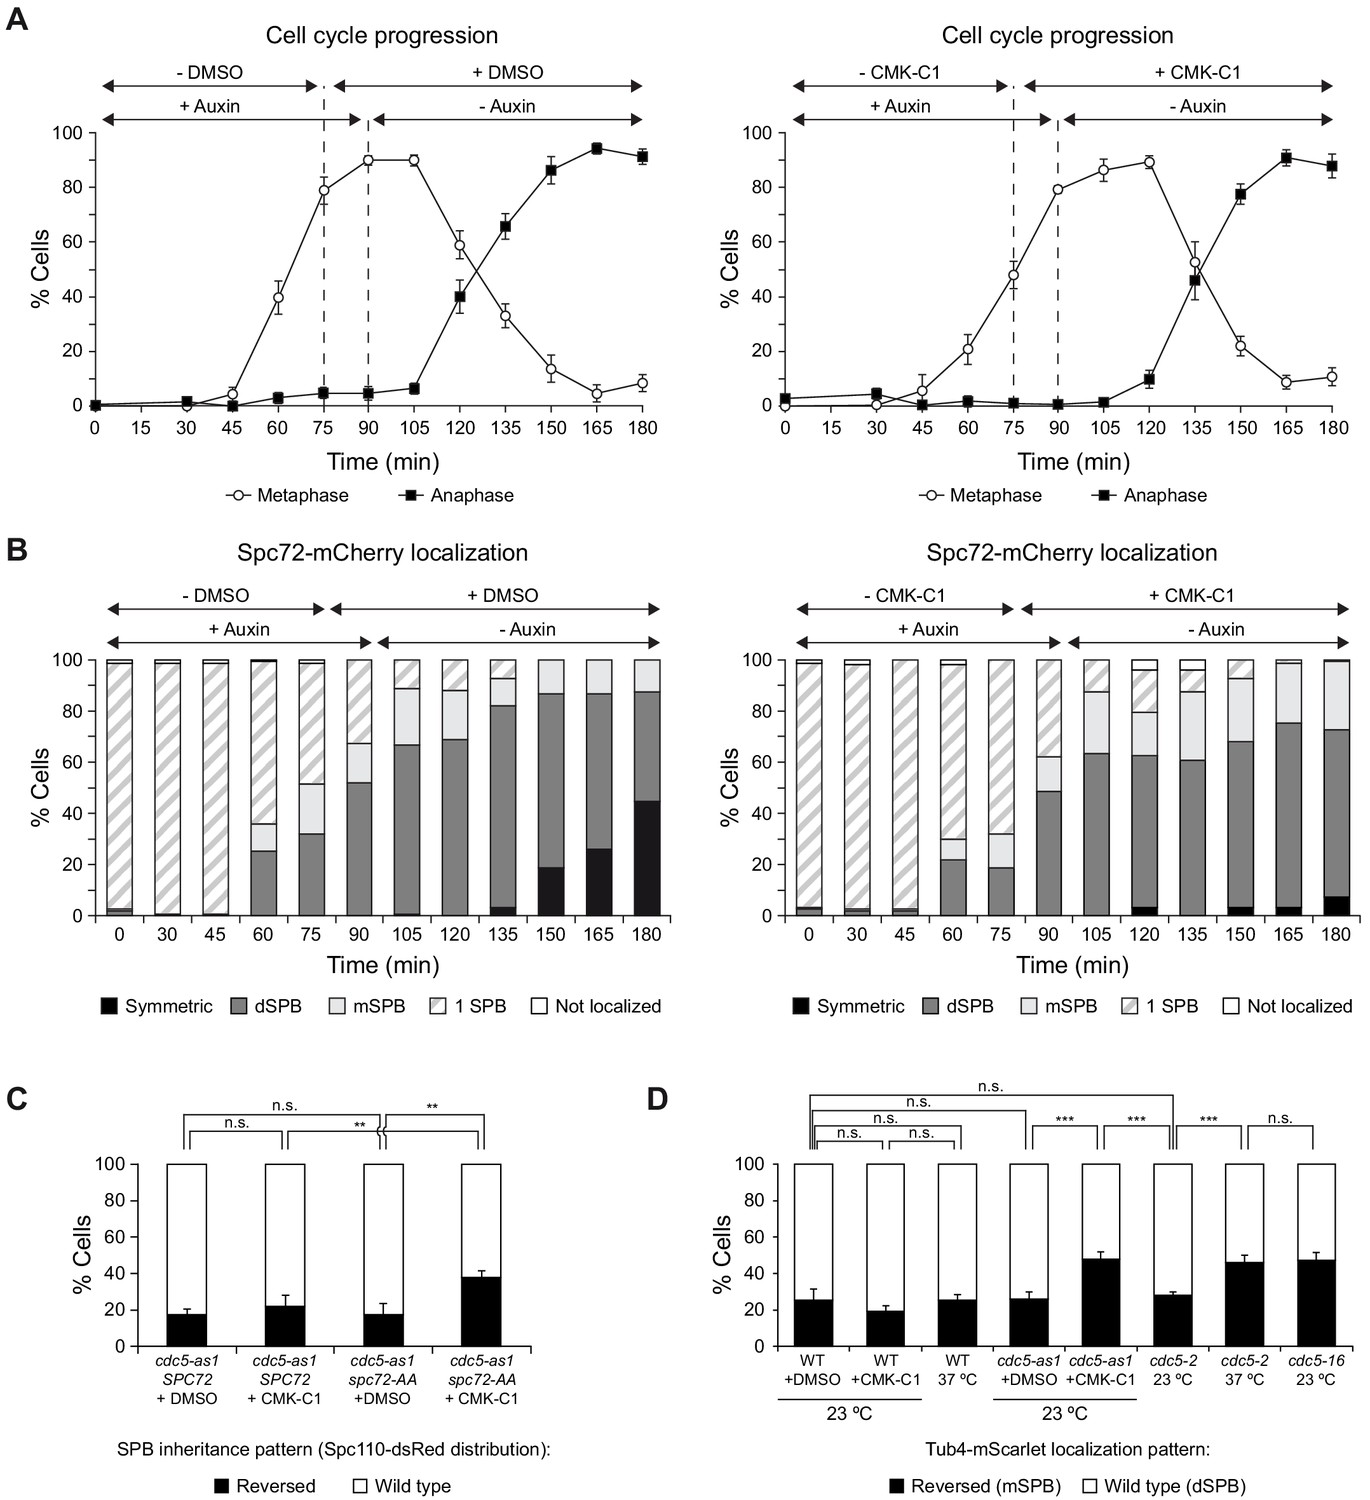
Cdc5 activity is specifically required at metaphase–anaphase transition.
(A-D) Cells expressing Cdc5-as1-eGFP, Spc72-mCherry, and the conditional cdc20-AID allele (F3053) were arrested in G1 with α-factor and released at 26°C in YPAD with 500 µM indole-3-acetic acid (IAA, +auxin) and with (+CMK-C1) or without (-CMK-C1) CMK-C1. After the metaphase arrest was completed (90 min), the cells were washed out and released in fresh medium without IAA (-auxin) and with (+CMK-C1) or without (-CMK-C1) CMK-C1. To ensure Cdc5-as1 inactivation at metaphase release, 5 µM CMK-C1 was added 15 min prior to IAA washout (at 75 min) in case it was necessary. As a control, the same experiments were performed with (+DMSO) or without (-DMSO) DMSO instead of CMK-C1. The experiment was repeated thrice (n = 3) in (A, B) and twice (n = 2) in (C, D), with similar results; a representative experiment is shown in both cases. (A, C) Cell cycle progression according to spindle and nuclear morphologies. The percentages of metaphase and anaphase cells are shown. Final data are the average of three samples (n = 3; 100 cells each). Error bars represent the SD. (B, D) The percentages of cells displaying or not displaying (white bars) Spc72-mCherry localization to the SPB before its duplication (one SPB, striped bars), or subsequently, to both (symmetric, black bars) or preferentially one SPB. In the latter, it is indicated whether the protein was asymmetrically distributed to the dSPB (dark grey bars) or the mSPB (light grey bars) (n = 100).
Figure 5—figure supplement 1
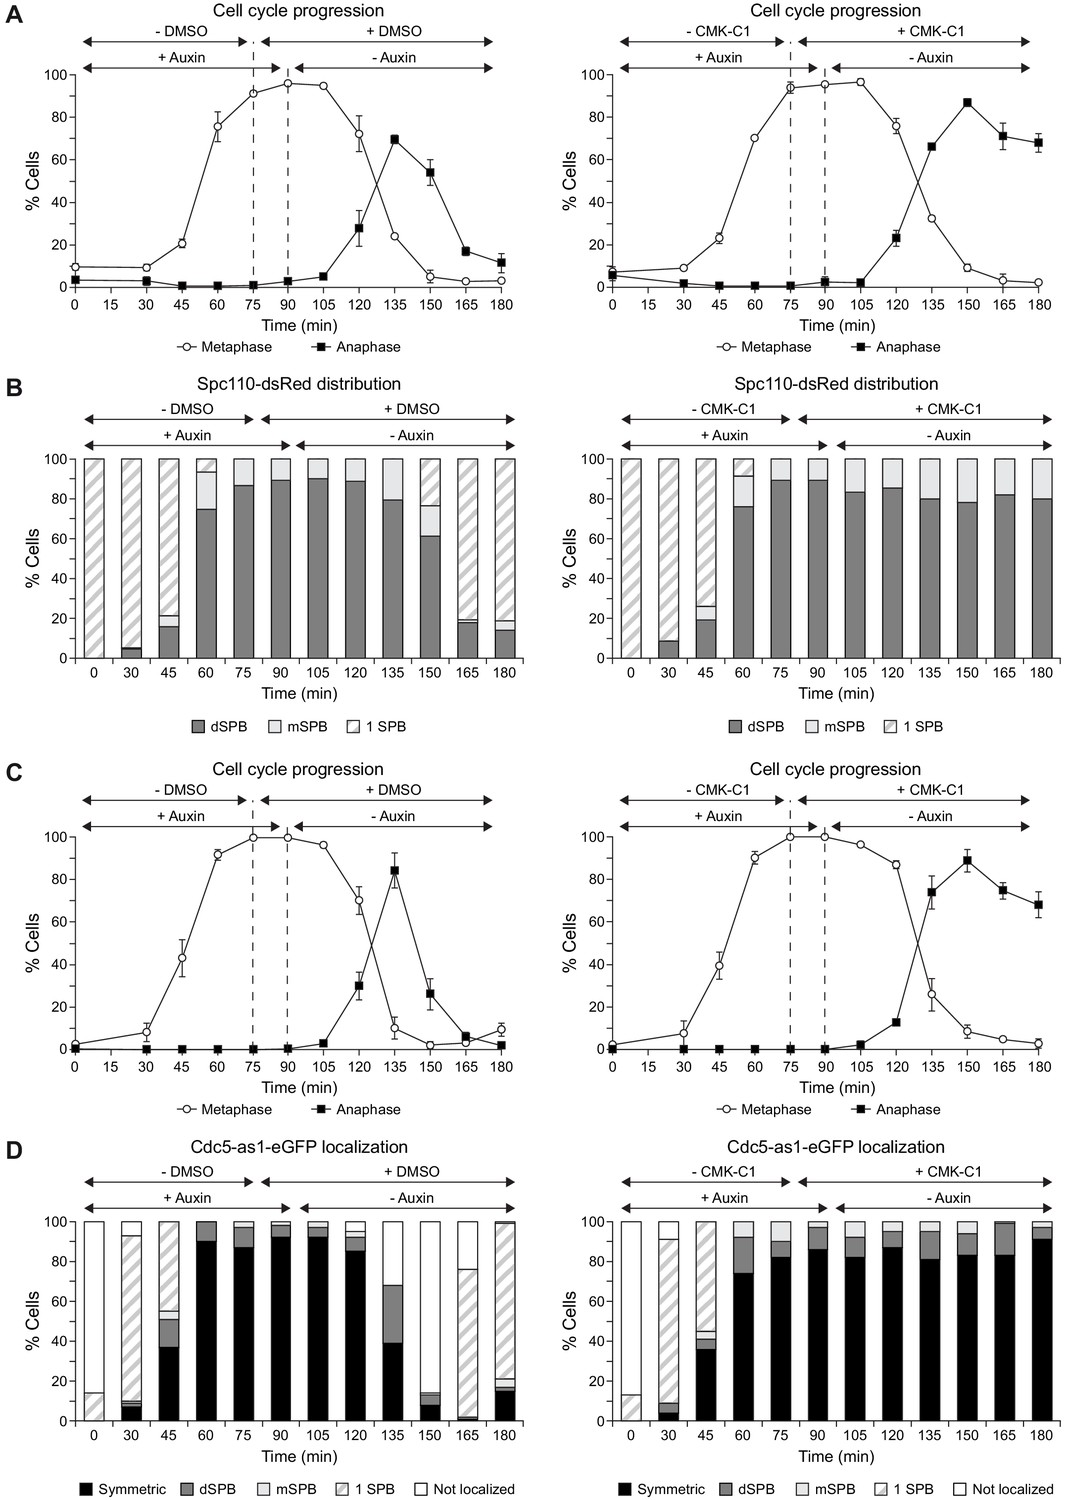
SPB inheritance and Cdc5-as1 localization when Cdc5 activity is inhibited after release from a metaphase arrest.
(A–D) Cells expressing Cdc5-as1-eGFP, the conditional cdc20-AID allele and Spc110-dsRed (F3766) (A, B) or Spc72-mCherry (F3053) (C, D) protein fusions were grown 24 hr (A, B) or overnight (C, D) in YPAD at 26°C, diluted to OD600 = 0.2 in fresh medium, arrested in G1 with 5 µg/ml α-factor and finally released at 26°C in YPAD medium without pheromone, with 500 µM indole-3-acetic acid (IAA, +auxin) and without CMK-C1 (-CMK-C1). After metaphase arrest was completed (90 min), the cells were washed out, released in fresh medium without IAA (-auxin) and treated with 5 µM CMK-C1 (+CMK-C1). To ensure Cdc5-as1 inactivation at the time of metaphase release, 5 µM CMK-C1 was added 15 min prior to IAA washout (at 75 min) in case it was necessary. As a control, the same experiments were performed with (+DMSO) or without (-DMSO) DMSO instead of CMK-C1. (A, C) Cell cycle progression according to spindle and nuclear morphologies. The percentages of metaphase and anaphase cells are shown. Final data are the average of three samples (n = 3; 100 cells/each). Error bars represent the SD. Time courses shown in (C) are the same than those in Figure 5A, but are also included here to facilitate interpretation of the results in (D). (B) The percentages of cells displaying or not displaying (white bars) Spc110-dsRed localization to the SPB before its duplication (one SPB, striped bars), or subsequently, a preferential distribution to the dSPB (dark grey bars) or the mSPB (light grey bars). Final data are the average of three samples (n = 3; 50 cells/each). (D) The percentages of cells displaying or not displaying (white bars) Cdc5-as1-eGFP localization to the SPB before its duplication (one SPB, striped bars), or subsequently, to both (symmetric, black bars) or preferentially one SPB. In the latter, it is indicated whether the protein was asymmetrically distributed to the dSPB (dark grey bars) or the mSPB (light grey bars) (n = 100).
Figure 5—figure supplement 2
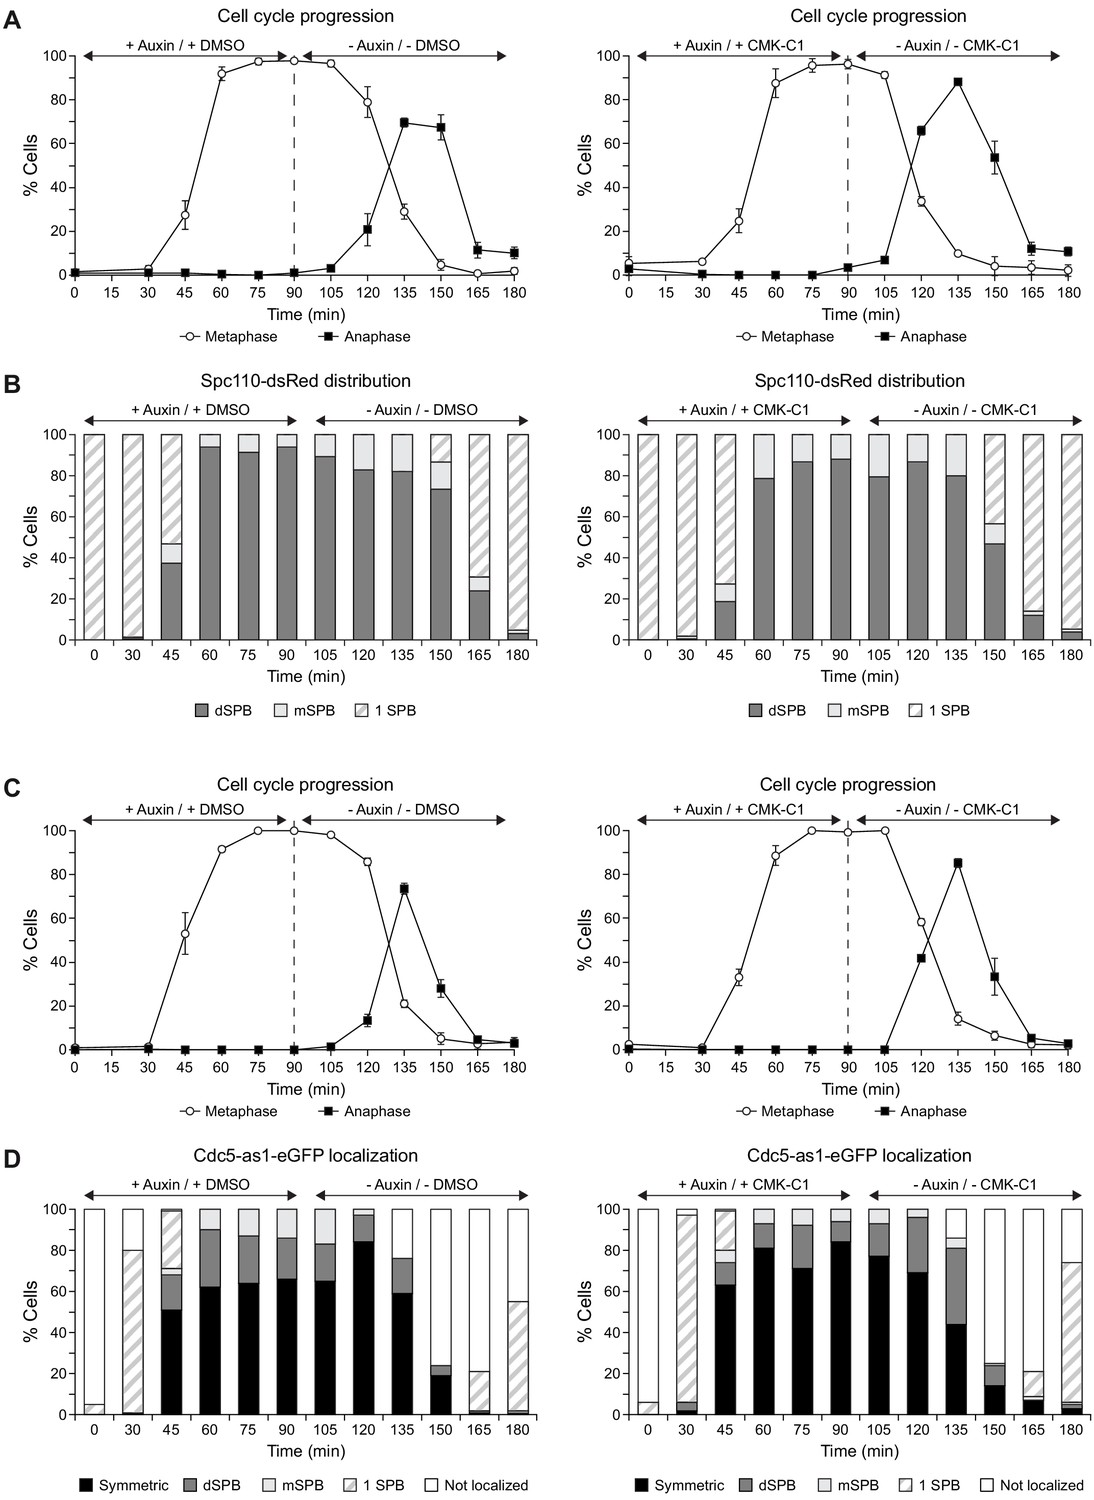
SPB inheritance and Cdc5-as1 localization in cells lacking Cdc5 activity only up to the metaphase-to-anaphase transition.
(A–D) Cells expressing Cdc5-as1-eGFP, the conditional cdc20-AID allele and Spc110-dsRed (F3766) (A, B) or Spc72-mCherry (F3053) (C, D) protein fusions were grown 24 hr (A, B) or overnight (C, D) in YPAD at 26°C, diluted to OD600 = 0.2 in fresh medium, arrested in G1 with 5 µg/ml α-factor and finally released at 26°C in YPAD medium without pheromone, with 500 µM indole-3-acetic acid (IAA, +auxin) and with 5 µM CMK-C1 (+CMK-C1). After metaphase arrest was completed (90 min), the cells were washed out and released in fresh medium without IAA (-auxin) and without CMK-C1 (-CMK-C1). As a control, the same experiments were performed with (+DMSO) or without (-DMSO) DMSO instead of CMK-C1. (A, C) Cell cycle progression according to spindle and nuclear morphologies. The percentages of metaphase and anaphase cells are shown. Final data are the average of three samples (n = 3; 100 cells/each). Error bars represent the SD. Time courses shown in (C) are the same than those in Figure 5C, but are also included here to facilitate interpretation of the results in (D). (B) The percentages of cells displaying or not displaying (white bars) Spc110-dsRed localization to the SPB before its duplication (one SPB, striped bars), or subsequently, a preferential distribution to the dSPB (dark grey bars) or the mSPB (light grey bars). Final data are the average of three samples (n = 3; 50 cells/each). (D) The percentages of cells displaying or not displaying (white bars) Cdc5-as1-eGFP localization to the SPB before its duplication (one SPB, striped bars), or subsequently, to both (symmetric, black bars) or preferentially one SPB. In the latter, it is indicated whether the protein was asymmetrically distributed to the dSPB (dark grey bars) or the mSPB (light grey bars) (n = 100).
Figure 5—figure supplement 3
Cdc5 acts as a molecular timer that facilitates the establishment of SPB fate.
(A, B) Cdc5-as1 cells expressing the conditional cdc20-AID and cdc14-1 alleles and the Spc72-mCherry fusion (F4756) were grown for 24 hr in YPAD at 26°C, diluted to OD600 = 0.2 in fresh medium, arrested in G1 with 5 µg/ml α-factor and finally released at 34°C in YPAD medium without pheromone, with 500 µM indole-3-acetic acid (IAA, +auxin) and without CMK-C1 (-CMK-C1). After metaphase arrest was completed (90 min), cells were washed out and released in fresh medium without IAA (-auxin) and with 5 µM CMK-C1 (+CMK-C1). To ensure Cdc5-as1 inactivation at the time of metaphase release, 5 µM CMK-C1 was added 15 min prior to IAA washout (at 75 min) in case it was necessary. As a control, the same experiments were performed with (+DMSO) or without (-DMSO) DMSO instead of CMK-C1. (A) Cell cycle progression according to spindle and nuclear morphologies. The percentages of metaphase and anaphase cells are shown. Final data are the average of three samples (n = 3; 100 cells/each). Error bars represent the SD. (B) The percentages of cells displaying or not displaying (white bars) Spc72-mCherry localization to the SPB before its duplication (one SPB, striped bars), or subsequently, to both (symmetric, black bars) or preferentially one SPB. In the latter, it is indicated whether the protein was asymmetrically distributed to the dSPB (dark grey bars) or the mSPB (light grey bars). Final data are the average of three samples (n = 3; 100 cells/each). (C) SPB inheritance in cdc5-as1 cells expressing Spc110-dsRed and either Spc72-GFP (F4836) or the Spc72-AA-GFP mutant (F4840). Cells were grown overnight in YPAD at 26°C, diluted to OD600 = 0.2 in fresh medium, arrested in G1 with 5 µg/ml α-factor and finally released at 26°C in YPAD medium without pheromone and treated (+CMK-C1) or untreated (+DMSO) with 5 µM CMK-C1. Graph shows the percentages of cells displaying wild-type (white bars) or reversed (black bars) SPB inheritance patterns, based on Spc110-dsRed distribution, in anaphase cells (90 min after the release). Final data are the average of three experiments (n = 3; 50 cells/each). Error bars represent the SD. Statistical significance according to the Newman-Keuls multiple comparison test is indicated. (D) Tub4-mScarlet distribution in otherwise wild type (F4585), cdc5-as1-GFP (F4619), cdc5-2 (F4758) and cdc5-16 (F4700) cells. Graph shows the percentages of cells displaying the highest mScarlet fluorescence intensity in the dSPB (wild-type, white bars) or the mSPB (reversed, black bars). Cells were untreated, treated with DMSO as a control (+DMSO) or treated with 5 µM CMK-C1 (+CMK-C1) and cultured at the indicated temperatures (23 or 37°C). Final data are the average of three samples (n = 3; 50 cells/each). Error bars represent the SD.
Figure 6

Cdc5 activity facilitates recruitment of new Spc72 protein on the SPBs.
(A, B) SPB inheritance in cdc5-as1 (F3705) and cdc5-as1 tab6-1 (F4140) cells expressing Spc110-dsRed. Graphs show the percentages of cells displaying wild-type (white bars) or reversed (black bars) SPB inheritance patterns, based on Spc110-dsRed distribution, in asynchronous cultures (A) and in cells arrested in G1 with α-factor and released at 26°C in YPAD with (+CMK-C1) or without (+DMSO) CMK-C1 (B). Experiments (A) and (B) were repeated twice (n = 2; 100 cells each) and thrice (n = 3; 100 cells each), respectively, with similar results. A representative experiment is shown in each case. (C–H) Cdc5-as1 cells expressing Spc72-GFP and Spc110-dsRed (F3705) arrested in G1 with α-factor and released at 26°C in YPAD with 15 µg/ml nocodazole (+nocodazole) and with (+CMK-C1) or without (+DMSO) CMK-C1. After 90 min, the nocodazole was washed out and the cells were released in fresh medium without nocodazole (-nocodazole) and with (+CMK-C1) or without (+DMSO) CMK-C1. The experiment was repeated twice (n = 2), with similar results. A representative experiment is shown. Error bars represent the SD. (C, F) Cell cycle progression according to spindle and nuclear morphologies. The percentages of cells with depolymerized microtubules (No MTs), and metaphase and anaphase cells are shown. Final data are the average of three samples (n = 3; 100 cells each). (D, G) The percentage of cells displaying wild-type or reversed SPB inheritance patterns, based on Spc110-dsRed distribution. Final data are the average of three samples (n = 3; 50 cells each). (E, H) The percentage of cells displaying Spc72-GFP localization to one (one SPB) or both SPBs. In the latter, it is indicated whether Spc72-GFP was preferentially distributed in the mSPB, dSPB, or symmetrically localized (symmetric) on both SPBs. Final data are the average of three samples (n = 3; 50 cells each).
Figure 7 with 1 supplement

Analysis of Spc72 and Kar9 interaction on SPBs.
(A–C) SPB inheritance (A) and Spc72 localization (B) in wild-type (F3712) and kar9Δ (F3774) cells, both expressing Spc42-RFP and Spc72-GFP. Graphs show the percentages of cells displaying wild-type (grey bars) or reversed (black bars) SPB inheritance patterns, based on Spc42-RFP distribution (A), and those of cells exhibiting preferential Spc72-GFP distribution to the dSPB (grey bars) or mSPB (black bars) (B). The percentage of cells in which the distribution of these proteins could not be assessed due to spindle misorientation (white bars) is further indicated. Also shown are the percentages of cells showing coincidental (white bars) or opposite (black bars) distribution of Spc42 and Spc72 (C). (D–F) SPB inheritance based on Spc110-dsRed distribution (D) and Kar9 localization (E) in wild-type (F3754) and spc72Δ (F3836) cells expressing both Spc110-dsRed and Kar9-sfGFP. Graphs show the percentages of cells displaying wild-type (grey bars) or reversed (black bars) SPB inheritance patterns, and those of cells in which the pattern could not be assessed due to spindle misorientation (white bars) (D), and of cells not exhibiting Kar9 on SPBs (white bars) or displaying preferential Kar9-sfGFP distribution to the dSPB (grey bars) or mSPB (black bars) (E). Also shown are the percentages of cells showing coincidental (grey bars) or opposite (black bars) Spc110 and Kar9 distribution and cells with no Kar9 on SPBs (white bars) (F). (G) Western blot analyses of Kar9-13Myc in asynchronous cultures of wild-type (F3924) and spc72Δ (F4824) cells, and in the wild-type untagged control (F496, No tag). The experiment was performed thrice (n = 3); a representative image is shown. Pgk1 levels were used as the loading control. (H, I) Percentage of Kar9-13Myc and Tub4-mScarlet protein co-immunoprecipitated with Spc72 in (H) cells expressing either Spc72-GFP (F4825) or Spc72-AA-GFP (F4829) and normalized to those carrying the wild-type GFP-tagged Spc72 (F4825), and in (I) cdc5-as1 cells expressing Spc72-GFP (F4827) treated with (+CMK-C1) or without (+DMSO) with CMK-C1, and normalized to untreated cells. Final data are the average of three experiments (n = 3). Error bars represent the SEM. (J–L) Kar9-GFP and Spc72-mCherry co-localization in wild-type (F2351) and cdc5-as1 (F2845) cells. (J) Representative images showing coincidental or opposite distribution of Kar9-GFP (green) and Spc72-mCherry (red), distinguishing in the former between cells exhibiting wild-type (preferential accumulation into the bud) and reversed (retention in the mother cell) distribution patterns of both proteins. Also shown are nuclear morphology (DAPI, blue), BF, and merged images. (K, L) Percentages of cells displaying coincidental (white bars) or opposite (black bars) Kar9-GFP and Spc72-mCherry distribution (K). In each case, it is also detailed whether the proteins showed a wild-type or reversed distribution pattern (L). (A–F, K, L) Final data are the average of three experiments (n = 3; 100 cells each). Error bars represent the SD. Statistical significance according to the Newman-Keuls multiple comparison test is indicated.
Figure 7—figure supplement 1

Cdc5 establishes SPB identity during the prior cell cycle.
(A) Co-immunoprecipitation analysis in cells expressing Kar9-13Myc, Tub4-mScarlet and either Spc72-GFP (F4825), Spc72-AA-GFP (F4829) or untagged Spc72 (No tag, F4823). Cells exclusively expressing Spc72-GFP (F3696) were also included as an additional control. Western blot gel images are shown for the GFP-tagged proteins, Kar9-13Myc and Tub4-mScarlet and for both the input (INPUT) and the immunoprecipitated (IP) samples. Pgk1 was used as the loading control. The experiment was performed thrice (n = 3); a representative image is shown. (B) Co-immunoprecipitation analysis in cdc5-as1 cells expressing Kar9-13Myc, Tub4-mScarlet and either Spc72-GFP (F4825) or untagged Spc72 (No tag, F4842). cdc5-as1 cells exclusively expressing Spc72-GFP (F3699) were also included as an additional control. Western blot gel images are shown for Spc72-GFP, Kar9-13Myc and Tub4-mScarlet and for both the input (INPUT) and the immunoprecipitated (IP) samples, treated (+CMK-C1) or untreated (+DMSO) with 5 µM CMK-C1. Pgk1 was used as the loading control. The experiment was performed thrice (n = 3); a representative image is shown. (C, D) Spc72-GFP (C) and Kar9-yEGFP (D) localization to the pre-existent SPB in cdc5-as1 tab6-1-13Myc cells (F4734 (C), F4754 (D)) also expressing Spc110-dsRed. Initial cultures were grown overnight in YPAD at 26°C and then diluted to OD600 = 0.2 in fresh medium, arrested in G1 with 5 µg/ml α-factor, released at 26°C in YPAD medium without pheromone and treated (+CMK-C1) or untreated (+DMSO) with 5 µM CMK-C1. The percentages of cells displaying coincidental (white bars) or opposite (black bars) localization of Spc72-GFP (C) or Kar9-yEGFP (D) and the pre-existent SPB (strongest Spc110-dsRed signal), both during the initial cell cycle following the release and the subsequent one, are indicated. Final data are the average of three experiments (n = 3; 50 cells/each). Error bars represent the SD. (E, F) Cdc5-as1 cells expressing Kar9-sfGFP and Spc110-dsRed (F3755) were grown for 24 hr in YPAD at 26°C, diluted to OD600 = 0.2 in fresh medium, arrested in G1 with 5 µg/ml α-factor and finally released at 26°C in YPAD medium with 15 µg/ml nocodazole (+Nocodazole) and with (+CMK-C1) or without (+DMSO) 5 µM CMK-C1. After 90 min, nocodazole was washed out and cells were released in fresh medium without nocodazole (-Nocodazole) and with (+CMK-C1) or without (+DMSO) 5 µM CMK-C1. The experiment was repeated twice (n = 2) with similar results; a representative experiment is shown. Error bars represent the SD. (E) Cell cycle progression according to spindle and nuclear morphologies. The percentages of cells with depolymerized microtubules (no MTs), metaphase and anaphase cells are shown. Final data are the average of three samples (n = 3; 100 cells/each). (F) The percentage of cells displaying Kar9-sfGFP localization to one (1 SPB) or both SPBs. In the latter, it is indicated whether Kar9-sfGFP is preferentially distributed in the mSPB, the dSPB, or symmetrically localized (symmetric) on both SPBs. Final data are the average of three samples (n = 3; 50 cells/each).
Author response image 1
Additional files
-
Supplementary file 1
Table S1 including all the strains from the S. cerevisiae W303 genetic background used in this work.
- https://cdn.elifesciences.org/articles/61488/elife-61488-supp1-v2.docx
-
Supplementary file 2
Table S2 detailing the list of antibodies used for immunofluorescence and Western blot.
- https://cdn.elifesciences.org/articles/61488/elife-61488-supp2-v2.docx
-
Supplementary file 3
Excel document including spreadsheets with the source data for each of the figures of the article.
- https://cdn.elifesciences.org/articles/61488/elife-61488-supp3-v2.xlsx
-
Transparent reporting form
- https://cdn.elifesciences.org/articles/61488/elife-61488-transrepform-v2.pdf
Download links
A two-part list of links to download the article, or parts of the article, in various formats.
Downloads (link to download the article as PDF)
Open citations (links to open the citations from this article in various online reference manager services)
Cite this article (links to download the citations from this article in formats compatible with various reference manager tools)
Polo-like kinase acts as a molecular timer that safeguards the asymmetric fate of spindle microtubule-organizing centers
eLife 9:e61488.
https://doi.org/10.7554/eLife.61488


