Molecular basis for substrate specificity of the Phactr1/PP1 phosphatase holoenzyme
- Signalling and Transcription Laboratory, The Francis Crick Institute, United Kingdom
- Structural Biology Science Technology Platform, The Francis Crick Institute, United Kingdom
- Peptide Chemistry Science Technology Platform, The Francis Crick Institute, United Kingdom
- Proteomics Science Technology Platform, The Francis Crick Institute, United Kingdom
- Kinases and Brain Development Laboratory The Francis Crick Institute, United Kingdom
Figures
Figure 1 with 2 supplements
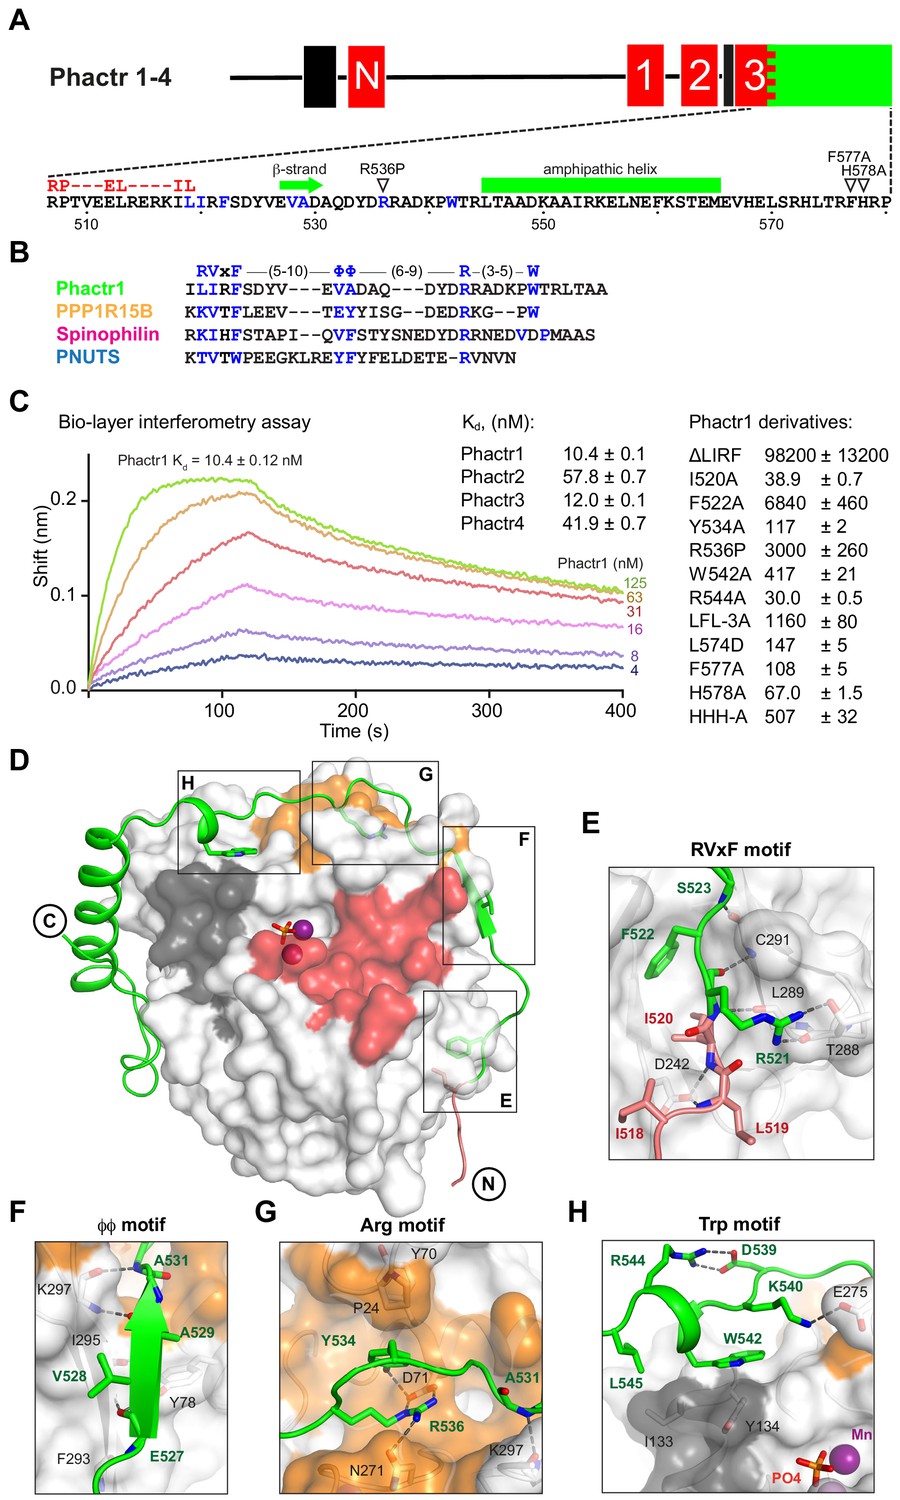
Phactr1 binds PP1 using an extended RVxF-ϕϕ-R motif.
(A) Domain structure of Phactr family proteins. RPEL motifs, red; PP1-binding domain, green; nuclear localisation sequences, black. Below, Phactr1 C-terminal sequence, indicating RVxF-ϕϕ-R-W string, RPEL consensus, secondary structure elements, and mutations known to impair Phactr/PP1 interaction (Allen et al., 2004; Kim et al., 2007). (B) Structure-based alignment of Phactr1 PP1-binding sequences with other PP1 cofactors. (C) Bio-layer interferometry assay of PP1α(7-300) binding to Phactr1(517-580), its derivatives, and analogous sequences from Phactr2-4 (data are means ± SD, n = 3). (D) Structure of the Phactr1(516-580)/PP1α(7-300) complex. Phactr1, green ribbon, with RPEL motif highlighted in red, RVxF-ϕϕ-R-W sidechains as sticks; PP1, white surface, with acidic groove in red, hydrophobic groove in dark grey and C-terminal groove in gold; manganese ions, purple spheres; phosphate, orange sticks. (E–H) Detail of the individual interactions, with important residues highlighted (Phactr1, green bold; PP1, black). For comparison with other PIPs, see Figure 1—figure supplement 2A.
Figure 1—figure supplement 1
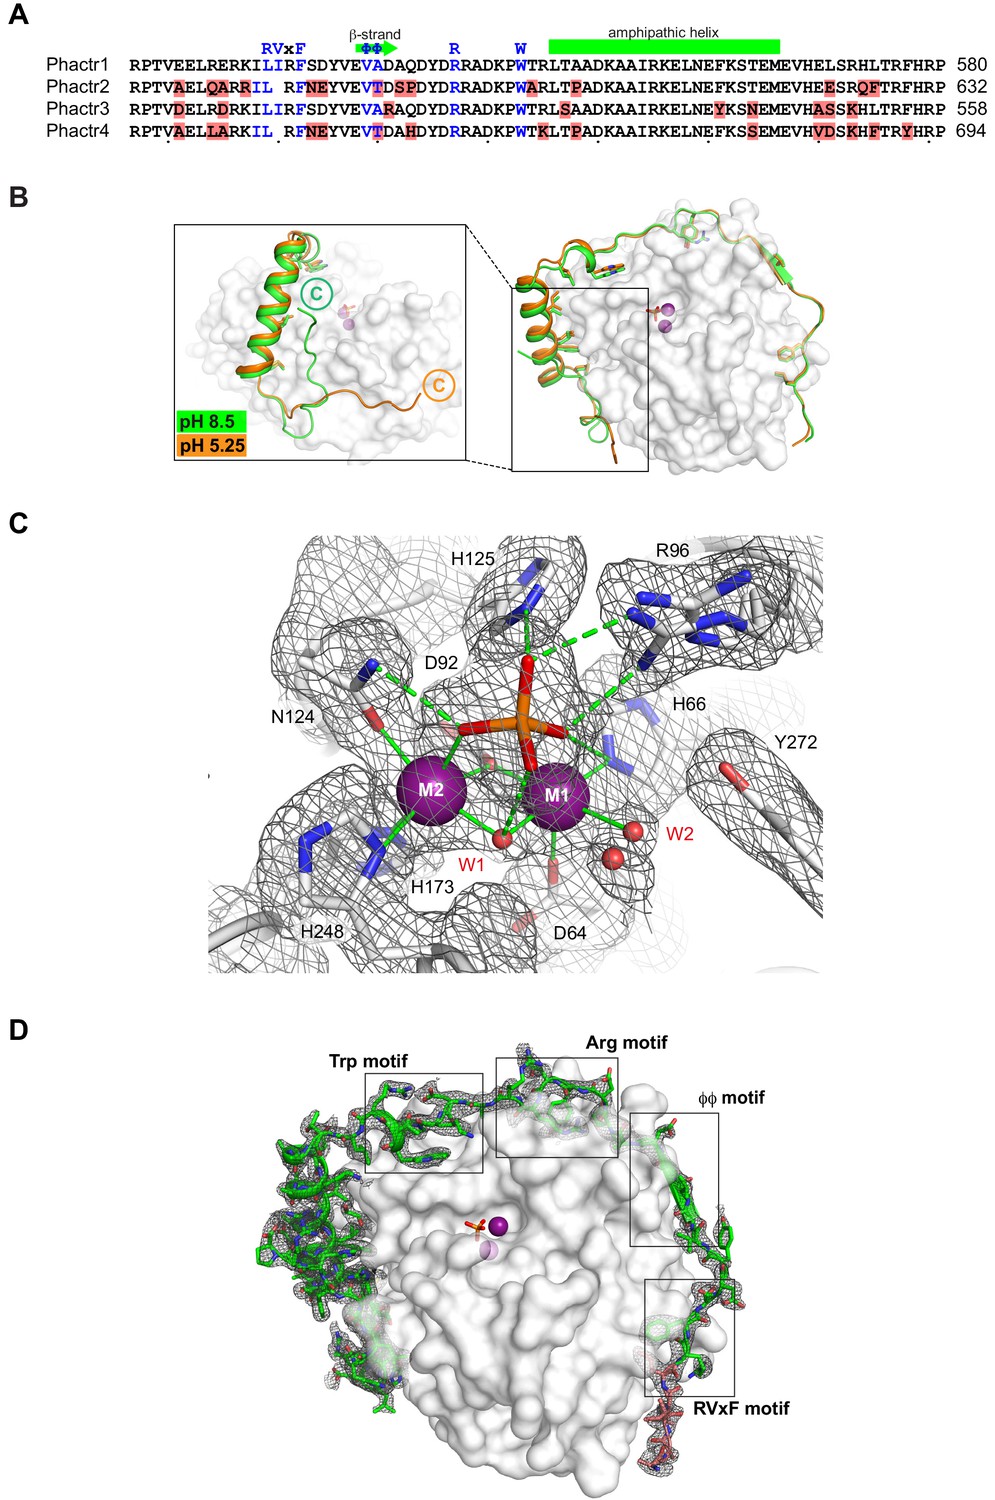
Crystallisation of Phactr1/PP1 complexes.
(A) Sequence-based alignment of Phactr-family C-terminal sequences, with differences highlighted in red. The extended Phactr1 RVxF-ϕϕ-R-W string is shown above, with presumed structurally equivalent residues indicated in blue on each sequence. Note that the sequence alignment introduces a gap into the atypical RVxF motif. (B) Structure of Phactr(507-580)/PP1α(7-300) solved at pH 8.5 (green) compared with that of Phactr1(516-580)/PP1α(7-300) solved at pH 5.25 (orange). The Phactr1 sequences C-terminal to the amphipathic α-helix (residue 467) adopt different conformations. In the pH 5.25 structure, residues 576–580 were not resolved in the density, and residues 567–575 were poorly resolved. (C) Omit map contoured at 3σ of the Phactr1/PP1 holoenzyme catalytic centre (metal ion/phosphate coordinating residues, white sticks; phosphate, orange sticks; water molecules, red spheres; coordination bonds, solid lines; hydrogen bonds, dashed lines). (D) Omit map contoured at 3σ of Phactr1 516–580 (green cartoon and sticks) across the PP1 surface (white).
Figure 1—figure supplement 2
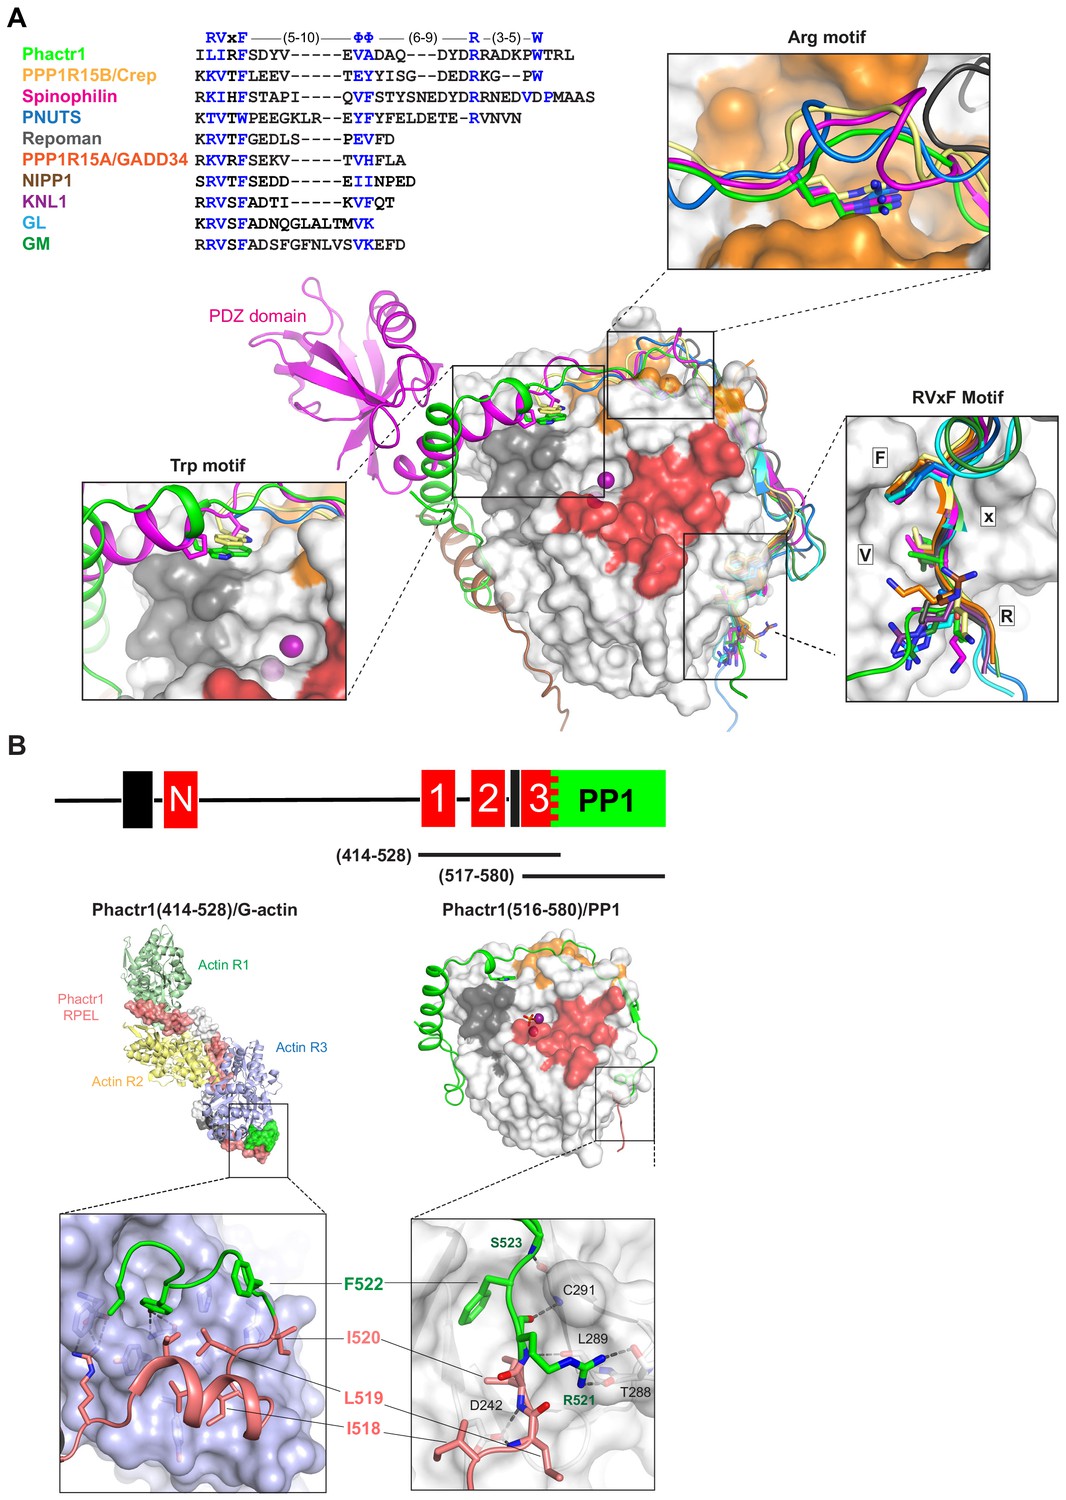
Phactr1 binds PP1 using an extended RVxF-ϕϕ-R string.
(A) Top, structure-based alignment of PIPs that bind PP1 through extended RVxF motifs including PPP1R15B (Chen et al., 2015), spinophilin (Ragusa et al., 2010), PNUTS (Choy et al., 2014), Repoman, (Kumar et al., 2016), PPP1R15A (Choy et al., 2015), NIPP1 (O'Connell et al., 2012), KNL1 (Bajaj et al., 2018), GL and GM (Yu et al., 2018). Below, comparison of the trajectories of Phactr1 (green), PPP1R15B (yellow), spinophilin (magenta; with PDZ domain), PNUTS (blue), Repoman (grey), PPP1R15A (orange), NIPP1 (brown), KNL1 (purple), GL (light blue) and GM dark green. Boxes show detail of interactions by the RVxF, Arg, and Trp motifs in each PIP. (B) Phactr1 RPEL3 (salmon) overlaps the RVxF motif LIRF(519-522) (green) and adopts different conformations when bound to G-actin (left) and PP1 (right). L519, I520 and F522 make critical but distinct hydrophobic contacts in both the G-actin and PP1 complexes.
Figure 2 with 1 supplement

Phactr1/PP1 interaction remodels the PP1 hydrophobic groove.
(A) Molecular interactions by the Phactr1 C-terminal sequences (green; residues involved in intrachain interactions or contacting PP1 are shown as sticks). (B) The novel composite surface formed by Phactr1/PP1 interaction, showing the deep hydrophobic pocket, adjacent narrow amphipathic cavity with associated waters (red spheres) and glycerol (cyan sticks), and residues constituting the Phactr1-derived basic rim (blue). (C) PP1 surface electrostatics are transformed in the Phactr1/PP1 complex. Left, surface representation of the Phactr1/PP1 complex; centre, electrostatic surface potential representation of Phactr1/PP1 complex. Right, electrostatic surface potential representation of PP1 (positive, blue; negative, red).
Figure 2—figure supplement 1

Spinophilin remodels the PP1 hydrophobic groove in a different way to Phactr1.
Top, the spinophilin/PP1 complex shown in surface representation (magenta, spinophilin; grey, PP1); bottom, the analogous region of the Phactr1/PP1 complex in the same orientation from Figure 2B, repeated for comparison.
Figure 3 with 2 supplements
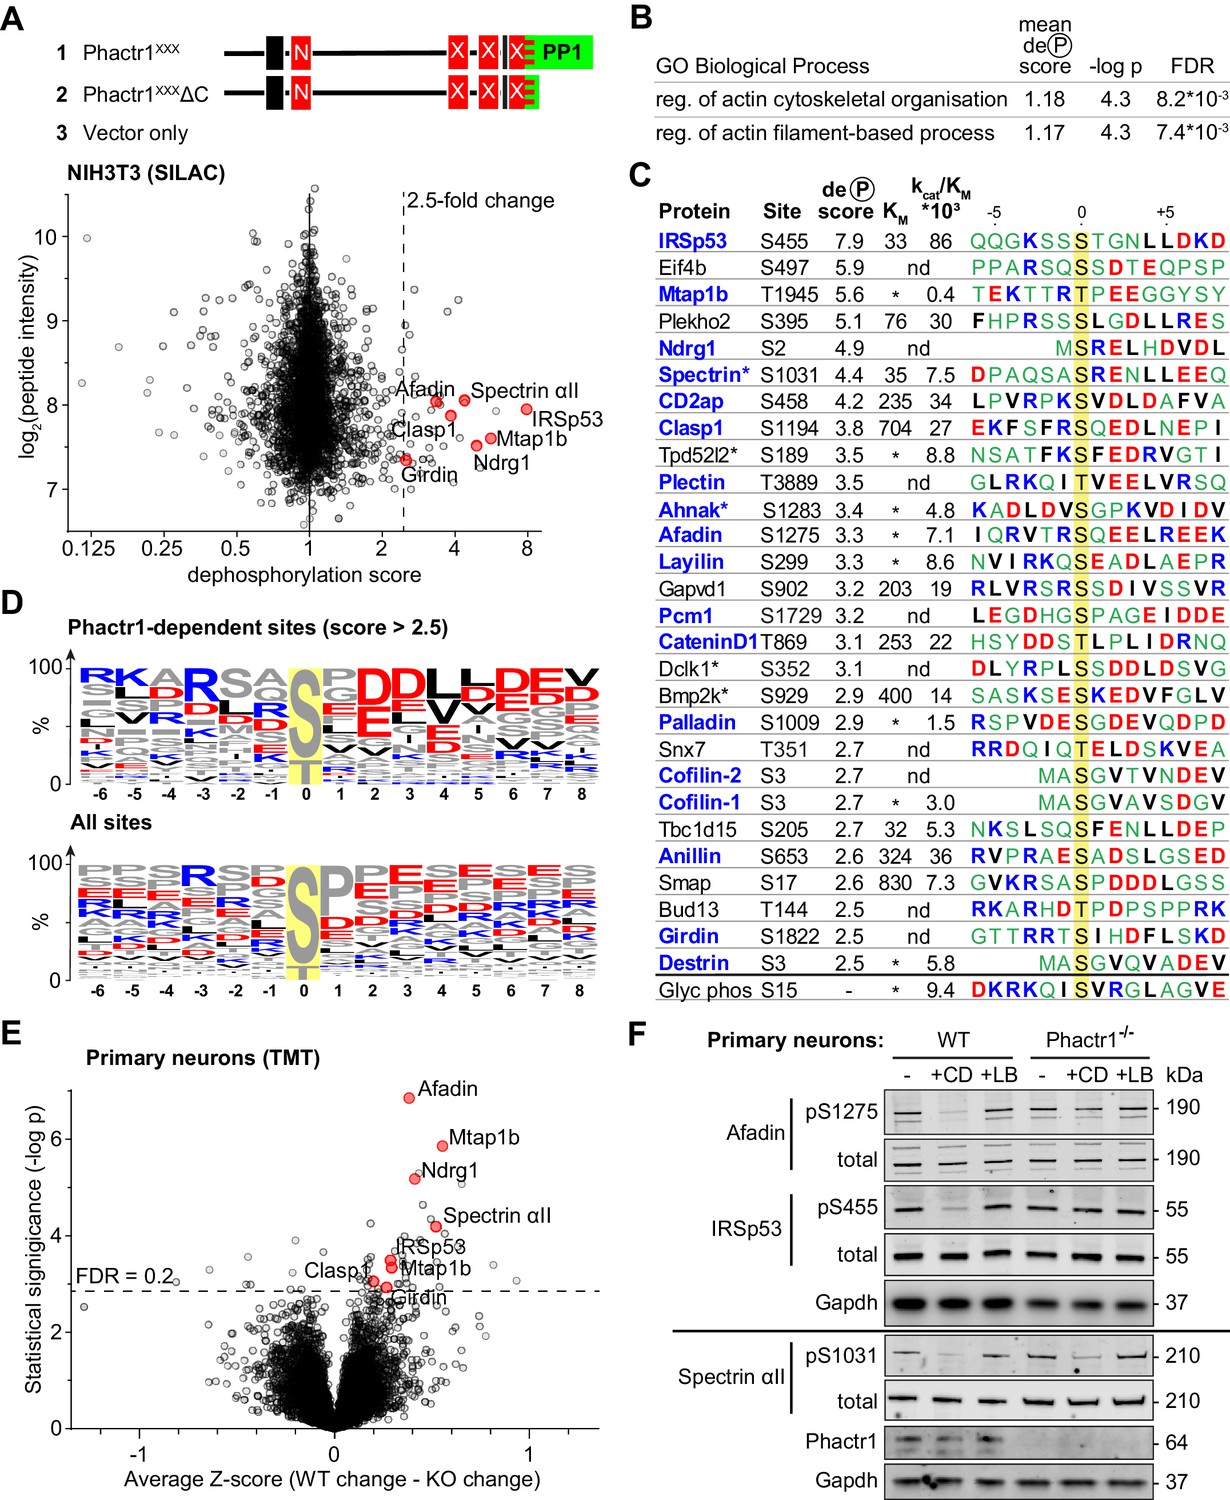
Identification of Phactr1/PP1 substrates.
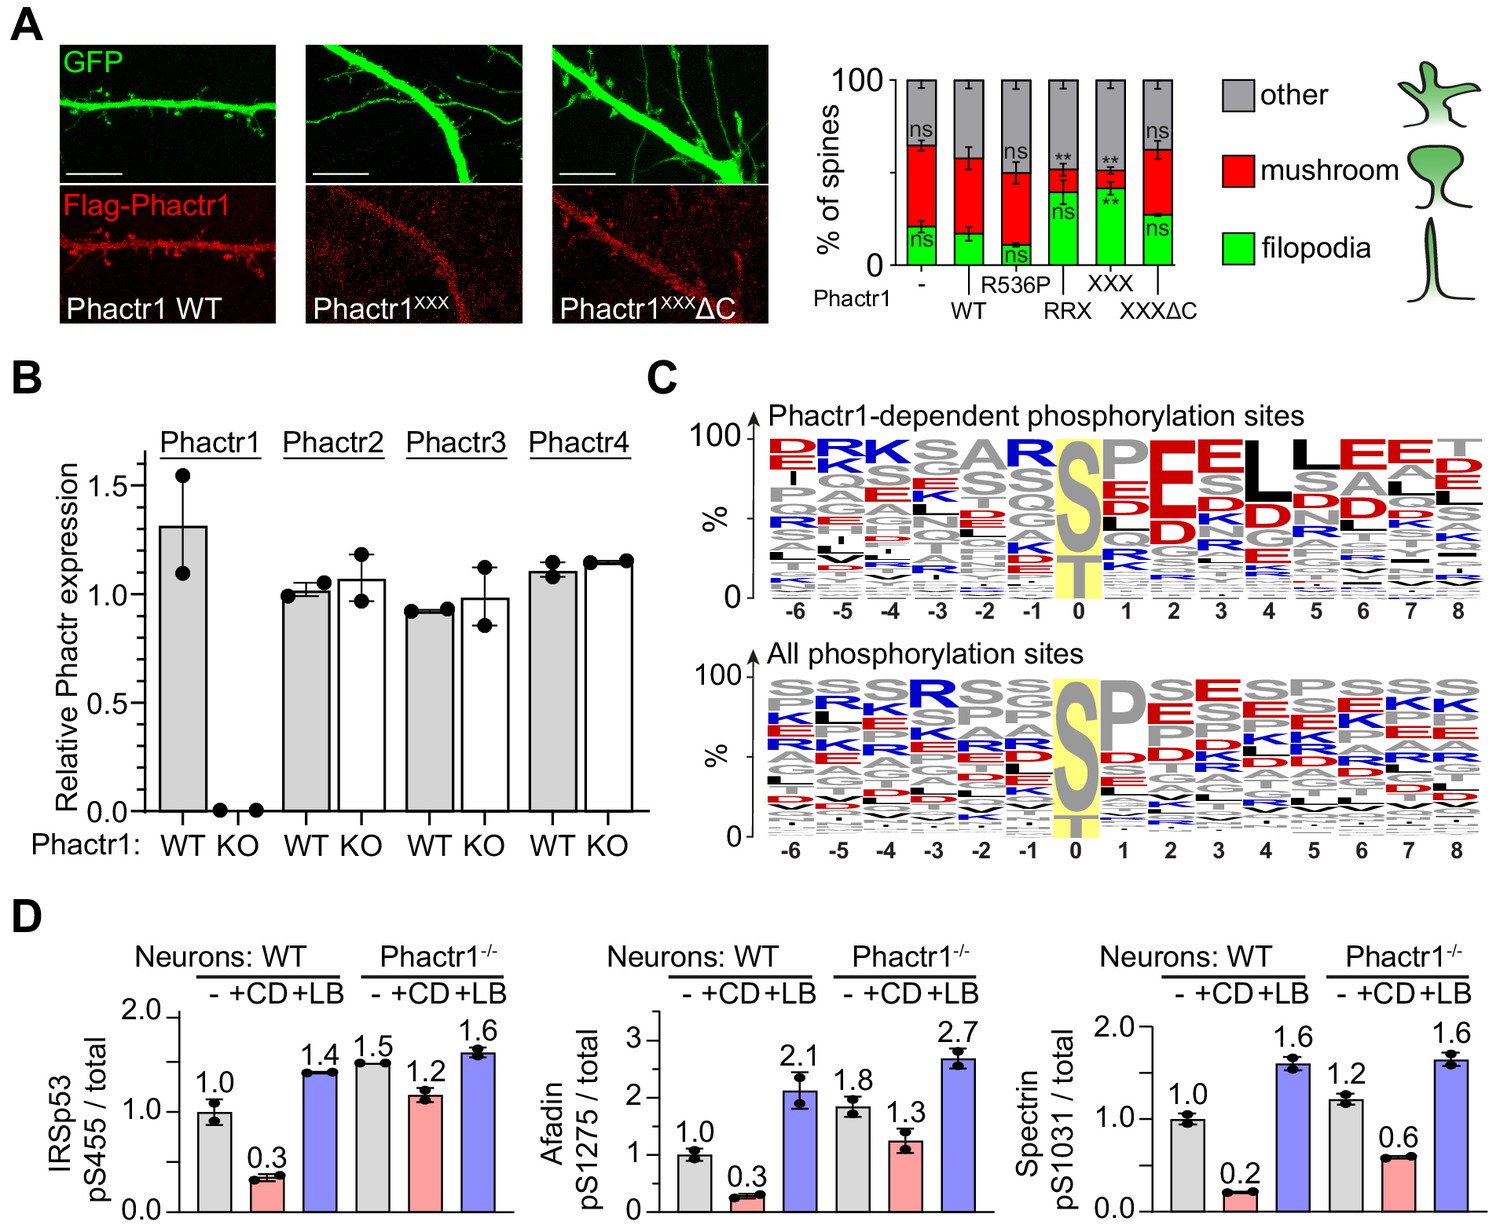
(A–D), NIH3T3 cells, (E, F) neuronal cells. (A) SILAC phosphoproteomics in NIH3T3 cells. NIH3T3 cell lines conditionally expressed Phactr1XXX (constitutively binds PP1, not G-actin), Phactr1XXXΔC (binds neither PP1 nor G-actin), or vector alone (Wiezlak et al., 2012). Forward and reverse SILAC phosphoproteomics were used to generate a dephosphorylation score, quantified below (red highlights, hits also detected as Phactr1-dependent in neurons). (B) Annotation enrichment analysis of the entire SILAC phosphoproteomics dataset for GO Biological Process terms, showing terms with dephosphorylation score >1, FDR < 0.02. (C) Candidate Phactr1/PP1 substrates ranked by dephosphorylation score (blue, cytoskeletal structural or regulatory proteins; asterisks, proteins with multiple dephosphorylation sites). Michaelis constant (KM, µM), specificity constant (kcat/KM, µM*min−1*U−1) and sequence context (blue, basic; red, acidic; black, hydrophobic) are shown. (*), KM could not be reliably determined; (nd), not done. (D) Amino acid frequency among phosphorylation sites with dephosphorylation score >2.5 (top) compared with all phosphorylation sites (bottom). (E) Phactr1-dependent protein dephosphorylation in cortical and hippocampal neurons treated with cytochalasin D (CD). Differential Z-score, the difference between the phosphorylation change observed in Phactr1-wildtype and Phactr1-null neurons, plotted versus statistical significance. Red highlights, peptides also observed in the NIH3T3 SILAC phosphoproteomics. (F) Validation of TMT phosphoproteomics data in primary cortical neurons treated for 30' with CD or latrunculin B (LB). For quantitation, see Figure 3—figure supplement 2D. See also Supplementary file 3.
Figure 3—figure supplement 1

Substrates of the Phactr1/PP1 complex in NIH3T3 fibroblasts.
(A) Expression of the Phactr1XXX(464-580), which constitutively binds PP1, induces cytoskeletal rearrangements in NIH3T3 fibroblasts. Scale bar, 20 µm. (B) Left, immunoblot analysis of Flag-Phactr1XXX and Flag-Phactr1XXXΔC expression in NIH3T3 cell lines cultured under SILAC labelling conditions. Detection was with Flag antibody. Right, dephosphorylation of endogenous IRSp53 pS455 upon expression of Flag-Phactr1XXX, detected with anti-IRSp53 p455 antibody. For protein structures, see Figure 3A. (C). Phactr1/PP1 phosphatase activity assay data for selected substrates from Figure 3D (data are ± SD, n = 3). (D, E) Immunoblot analysis of IRSp53 pS455 and afadin pS1275 in NIH3T3 cells upon overnight serum starvation and 30' serum stimulation (D), or 30' treatment with the actin-binding drugs cytochalasin D (CD) or latrunculin B (LB). Quantitation below (data are ± SD, n = 3). See also Supplementary file 1.
Figure 3—figure supplement 2
Neuronal substrates of the Phactr1/PP1 complex.
(A) Rat hippocampal neurons were transfected with plasmids expressing Phactr1 derivatives and GFP, fixed after 1 day and their morphology scored blindly. Scale bar, 10 µm. Statistical significance was assessed by unpaired t-test with Welch's correction (means ± SEM, n = 3–5; **, p<0.01). (B) RT-PCR analysis shows that Phactr1 inactivation in brain does not affect expression of other Phactr family members, relative to Rps16 expression. (C) Wildtype and Phactr1-null neurons were treated with cytochalasin D (CD) and phosphorylation changes assessed by TMT phosphoproteomics. Top, amino acid frequency table of phosphopeptides showing a statistically significant dependence on Phactr1 (FDR < 0.2), bottom, amino acid frequency table of all phosphopeptides. (D) Quantitation of immunoblot data shown in Figure 3F. Lysates from Phactr1-null or wildtype neurons were left untreated or treated with CD or LB for 30' were analysed by immunoblotting with antibodies against IRSp53 pS455 (left); afadin pS1275 (centre); and spectrin αII pS1031 (right). See also Supplementary files 1 and 3.
Figure 4 with 3 supplements
Substrate interactions with the Phactr1/PP1 holoenzyme.
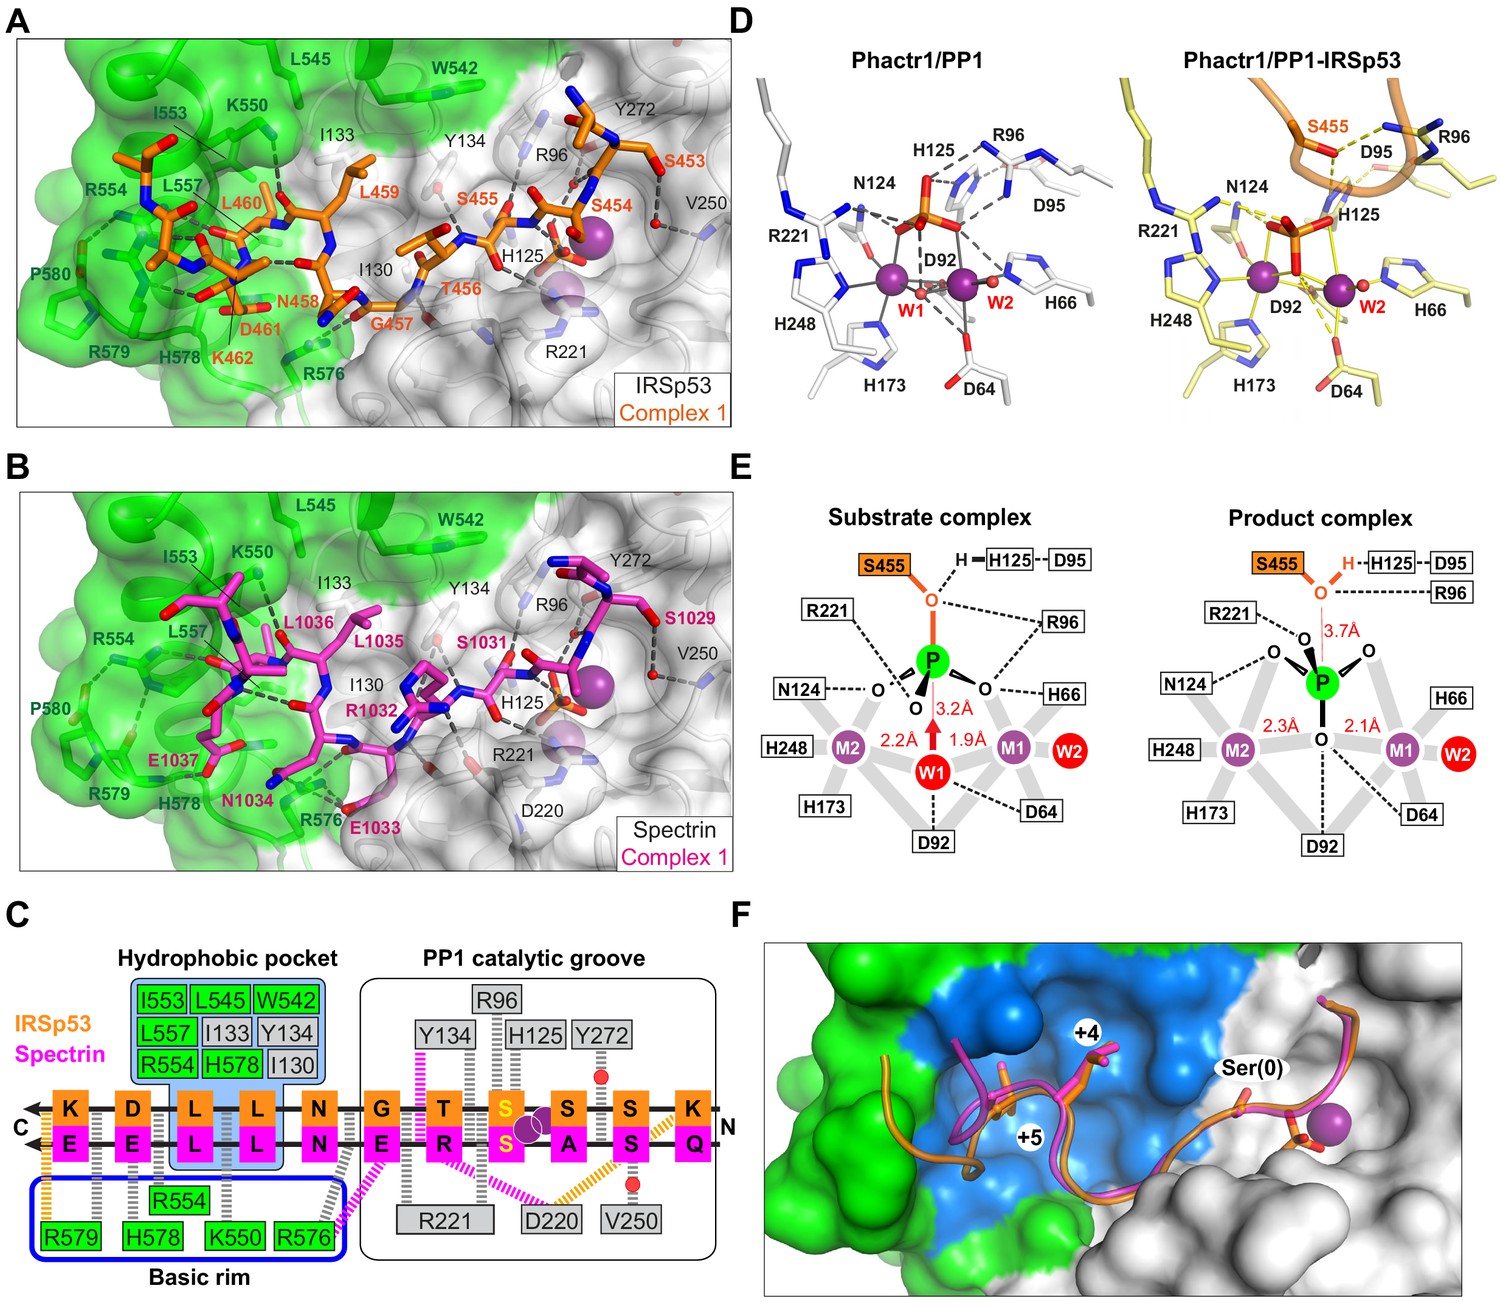
(A, B) Structures of (A) the Phactr1/PP1-IRSp53(449-465) and (B) the Phactr1/PP1-spectrin(1025–1039) complexes, displayed as in Figure 1, with IRSp53 and spectrin displayed in orange and magenta sticks, respectively. (C) Summary of substrate interactions. Hydrogen bonds are shown as thick dashed lines: grey for both substrates; colour, for specific substrate. Composite hydrophobic surface residues are highlighted in blue (see F). (D) Inversion of the recruited phosphate. Phosphate and metal ion contacts in the Phactr1/PP1 and in Phactr1/PP1-IRSp53 structures are shown. Metal coordination bonds, solid continuous lines; hydrogen bonds, dashed lines; W1 and W2, water molecules. (E) Potential catalytic mechanism. Left, a hypothetical substrate complex, based on the Phactr1/PP1 complex, assuming that its phosphate corresponds to that of IRSp53 pS455. Right, the observed Phactr1/PP1-IRSp53 product complex. W1 and W2, water molecules; grey bars, metal coordination bonds; dashes, hydrogen bonds. Proposed nucleophilic attack by activated W1 results in phosphate inversion. (F) Docking of the SxxxLL motif (sticks) with the Phactr1/PP1 hydrophobic pocket. Phactr1/PP1 in surface representation, with the composite hydrophobic surface in light blue, and other Phactr1 and PP1 surfaces in green and white, respectively.
Figure 4—figure supplement 1
Substrate interactions in the Phactr1/PP1 complex.
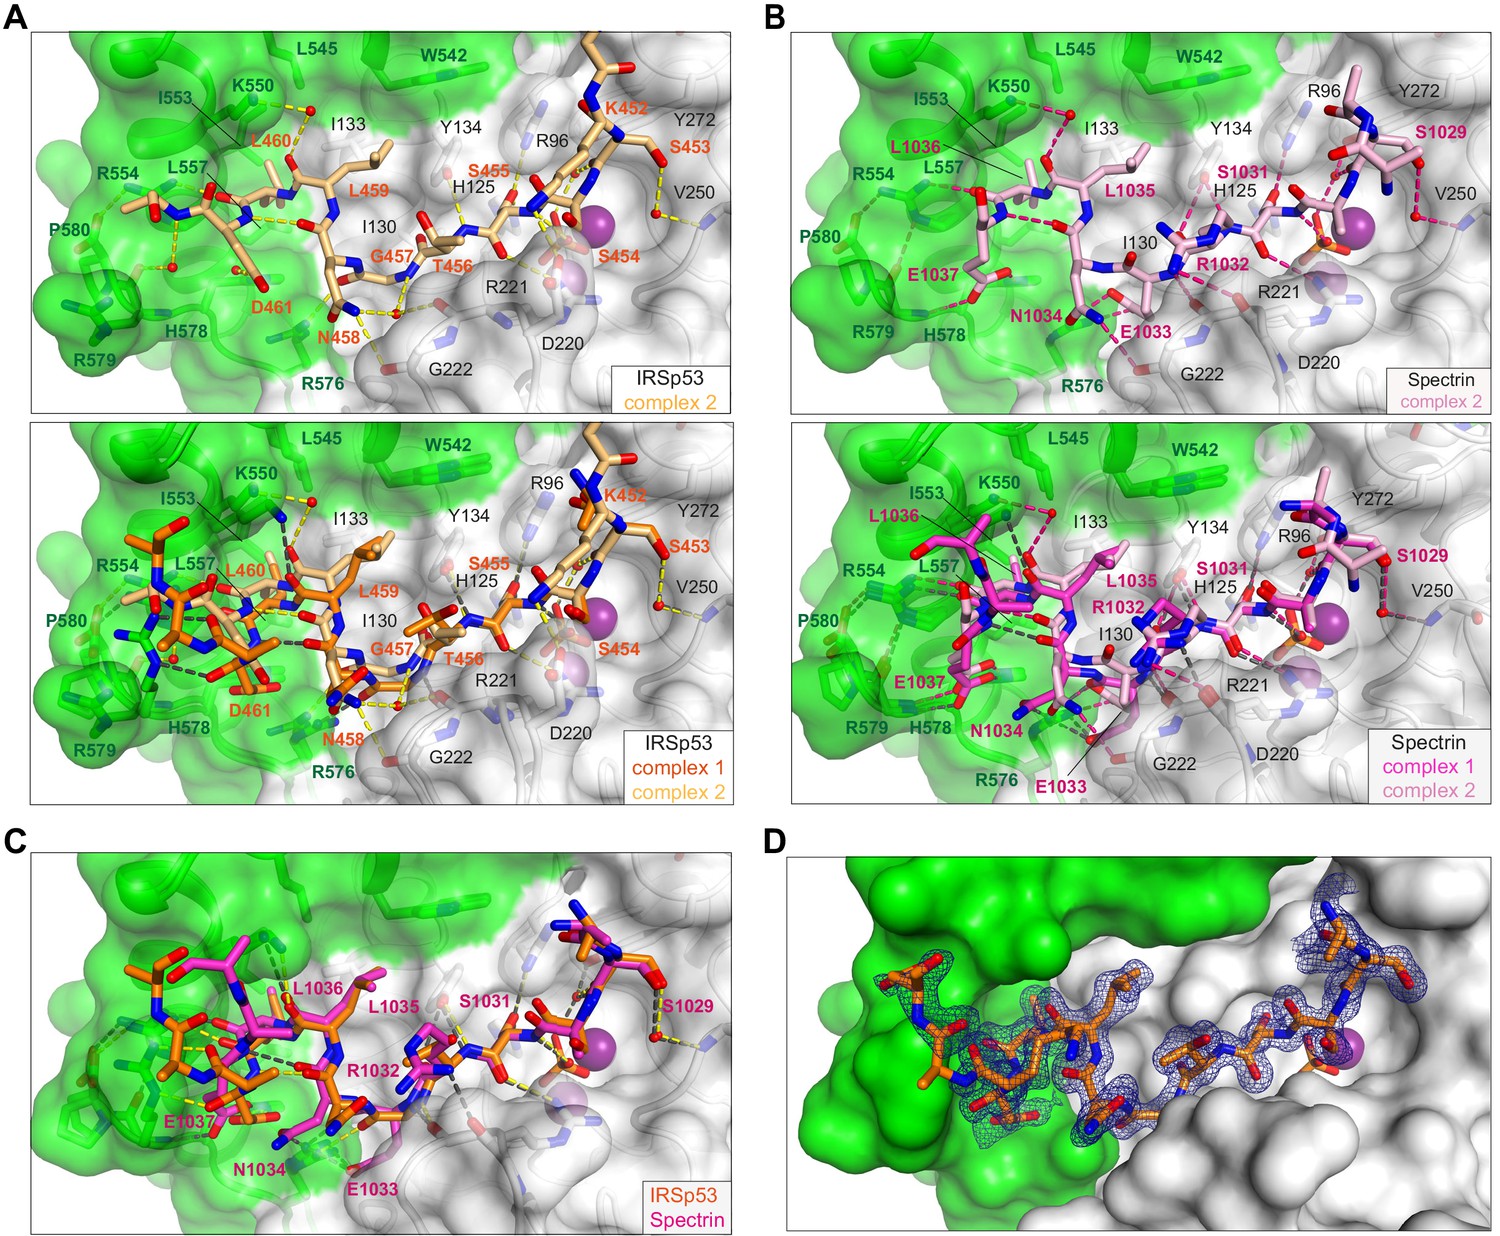
(A, B) Structure of the second copy of the Phactr1/PP1-substrate complexes in each asymmetric unit. Each structure is shown alone (top), and superimposed on the first copy (bottom; see Figure 4). (A) In IRSp53 complex 2, the electrostatic interactions between substrate residues +4, +5 and +6 and Phactr1 basic residues are water-bridged rather than direct. (B) In spectrin complex 2, the E1033/N1034spectrin peptide bond is inverted, losing the mainchain carbonyl and N1034spectrin sidechain interactions with Phactr1 R576, and the hydrogen bonding interaction between the L1035spectrin(+4) carbonyl and Phactr1 K550 is water-bridged rather than direct. (C) Superposition of the first copy of each complex (shown separately in Figure 4A and B). (D) Omit map contoured at 3σ of the first copy of the IRSp53 complex.
Figure 4—figure supplement 2

Opposite polarity of substrate binding to PP5 and Phactr1/PP1.
Left: the PP5-Cdc37(S13E) complex (Oberoi et al., 2016). White surface, PP5; lilac sticks, Cdc37(S13E). Centre, superposition of the PP5-Cdc37(S13E) and Phactr1/PP1-IRSp53 structures. Right, comparison of molecular interactions with substrates at the catalytic site residues of PP5 (lilac) and PP1 (orange). Hydrogen bonds are shown as thick dashed lines: grey for both substrates; colour, for specific substrate.
Figure 4—figure supplement 3
Comparison of the PP5-Cdc37(S13E), Phactr1/PP1 and Phactr1/PP1-IRSp53 structures gives insight into catalytic mechanism.
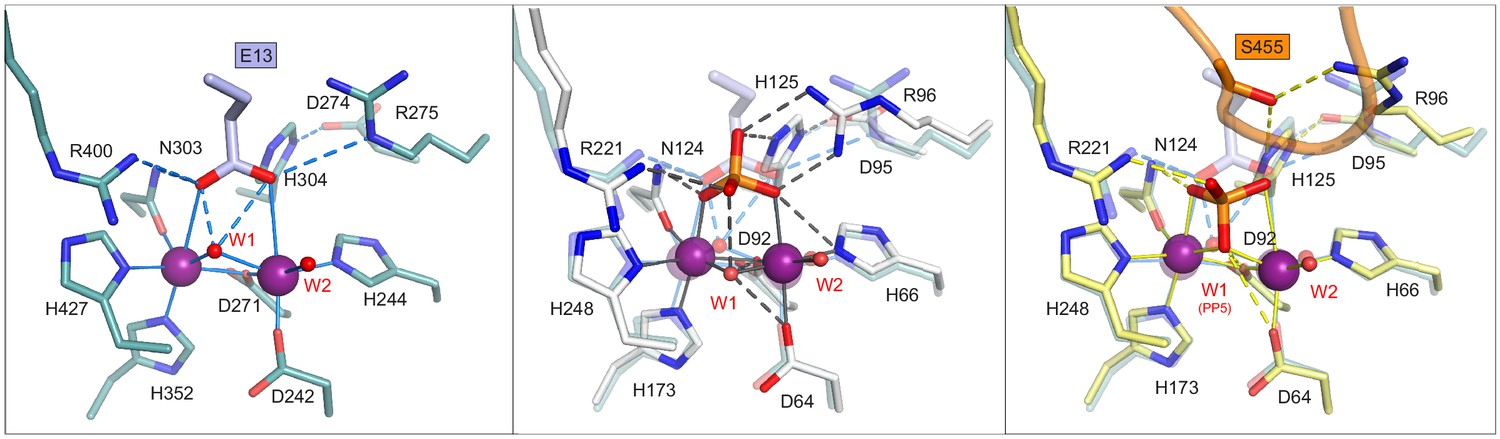
Left, stick representation of molecular interactions at the catalytic site of PP5-Cdc37(S13E). Centre, superposition of the PP5-Cdc37(S13E) (lilac) and Phactr1/PP1 complex (white) catalytic sites. Note the coincidence of the PP5-Cdc37(S13E) phosphomimetic glutamate with the oxygens of the phosphate present in the Phactr1/PP1 complex. Right, comparison of the PP5-Cdc37(S13E) and Phactr1/PP1-IRSp53 complexes (yellow). Note the inversion of the phosphate and the absence of W1.
Figure 5 with 1 supplement
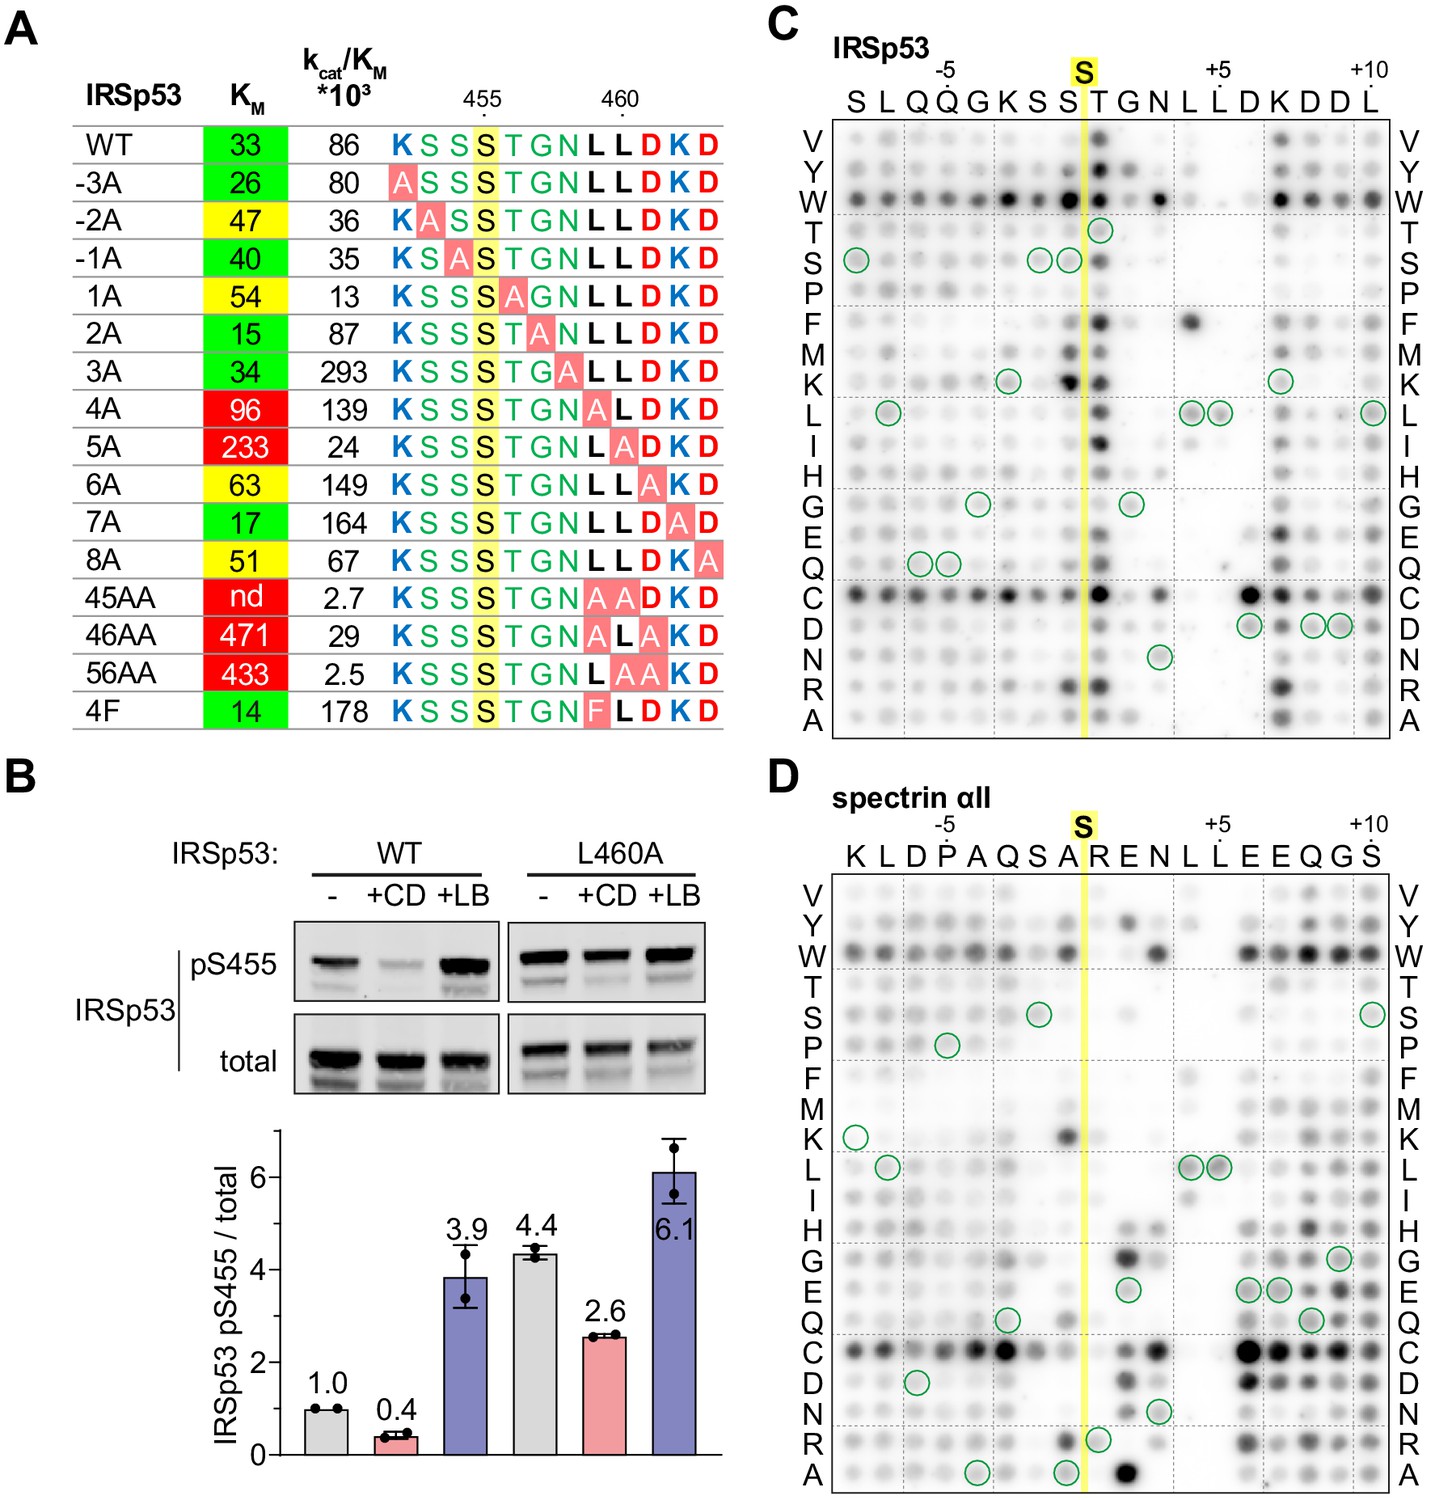
Efficient dephosphorylation involves substrate interaction with the Phactr1/PP1 composite surface.
(A) Phactr1/PP1 dephosphorylation of alanine substitution derivatives of IRSp53 S455 substrate 19mer phosphopeptides. KM values are highlighted: green,<40 µM; yellow, 40–80 µM; red,>80 µM. (B) Immunoblot analysis of total IRSp53 and IRSp53 phospho-S455 levels after expression of wild-type IRSp53 or IRSp53 L460A in NIH3T3 cells with 30' CD or LB treatment as indicated. (C,D) Overlay binding affinity assay of IRSp53 (C) and spectrin αII (D). Arrays contained the variants of the wild-type sequence, in which each amino acid is systematically changed to each other amino acid as indicated vertically, with wild-type sequence circled in green. Yellow line, position of the invariant unphosphorylated target serine.
Figure 5—figure supplement 1
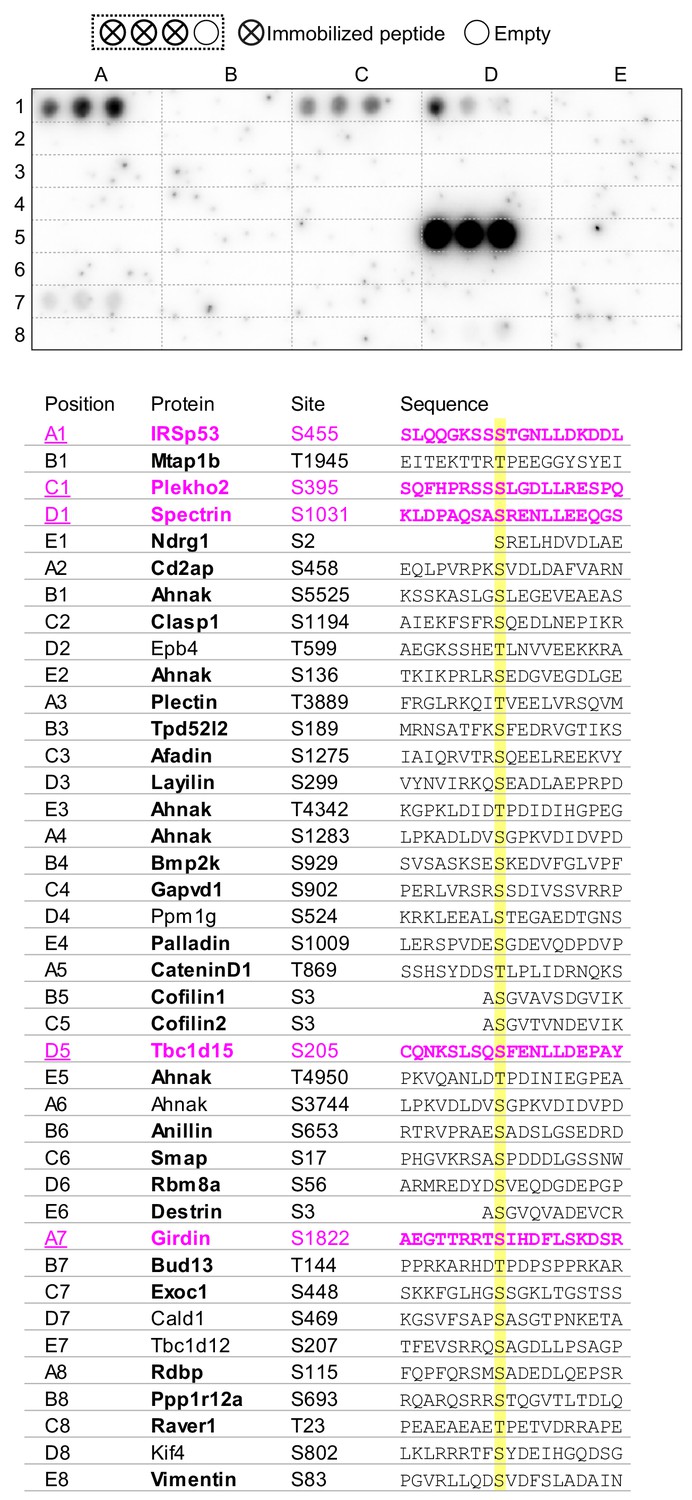
Binding of candidate Phactr1/PP1 substrates in the peptide array overlay assay.
19-mer unphosphorylated peptides from the indicated substrates were arrayed in triplicate as shown and tested for their ability to recruit GST-Phactr1(516-580)/PP1 from solution. Visualisation was with anti-GST antibody.
Figure 6 with 1 supplement
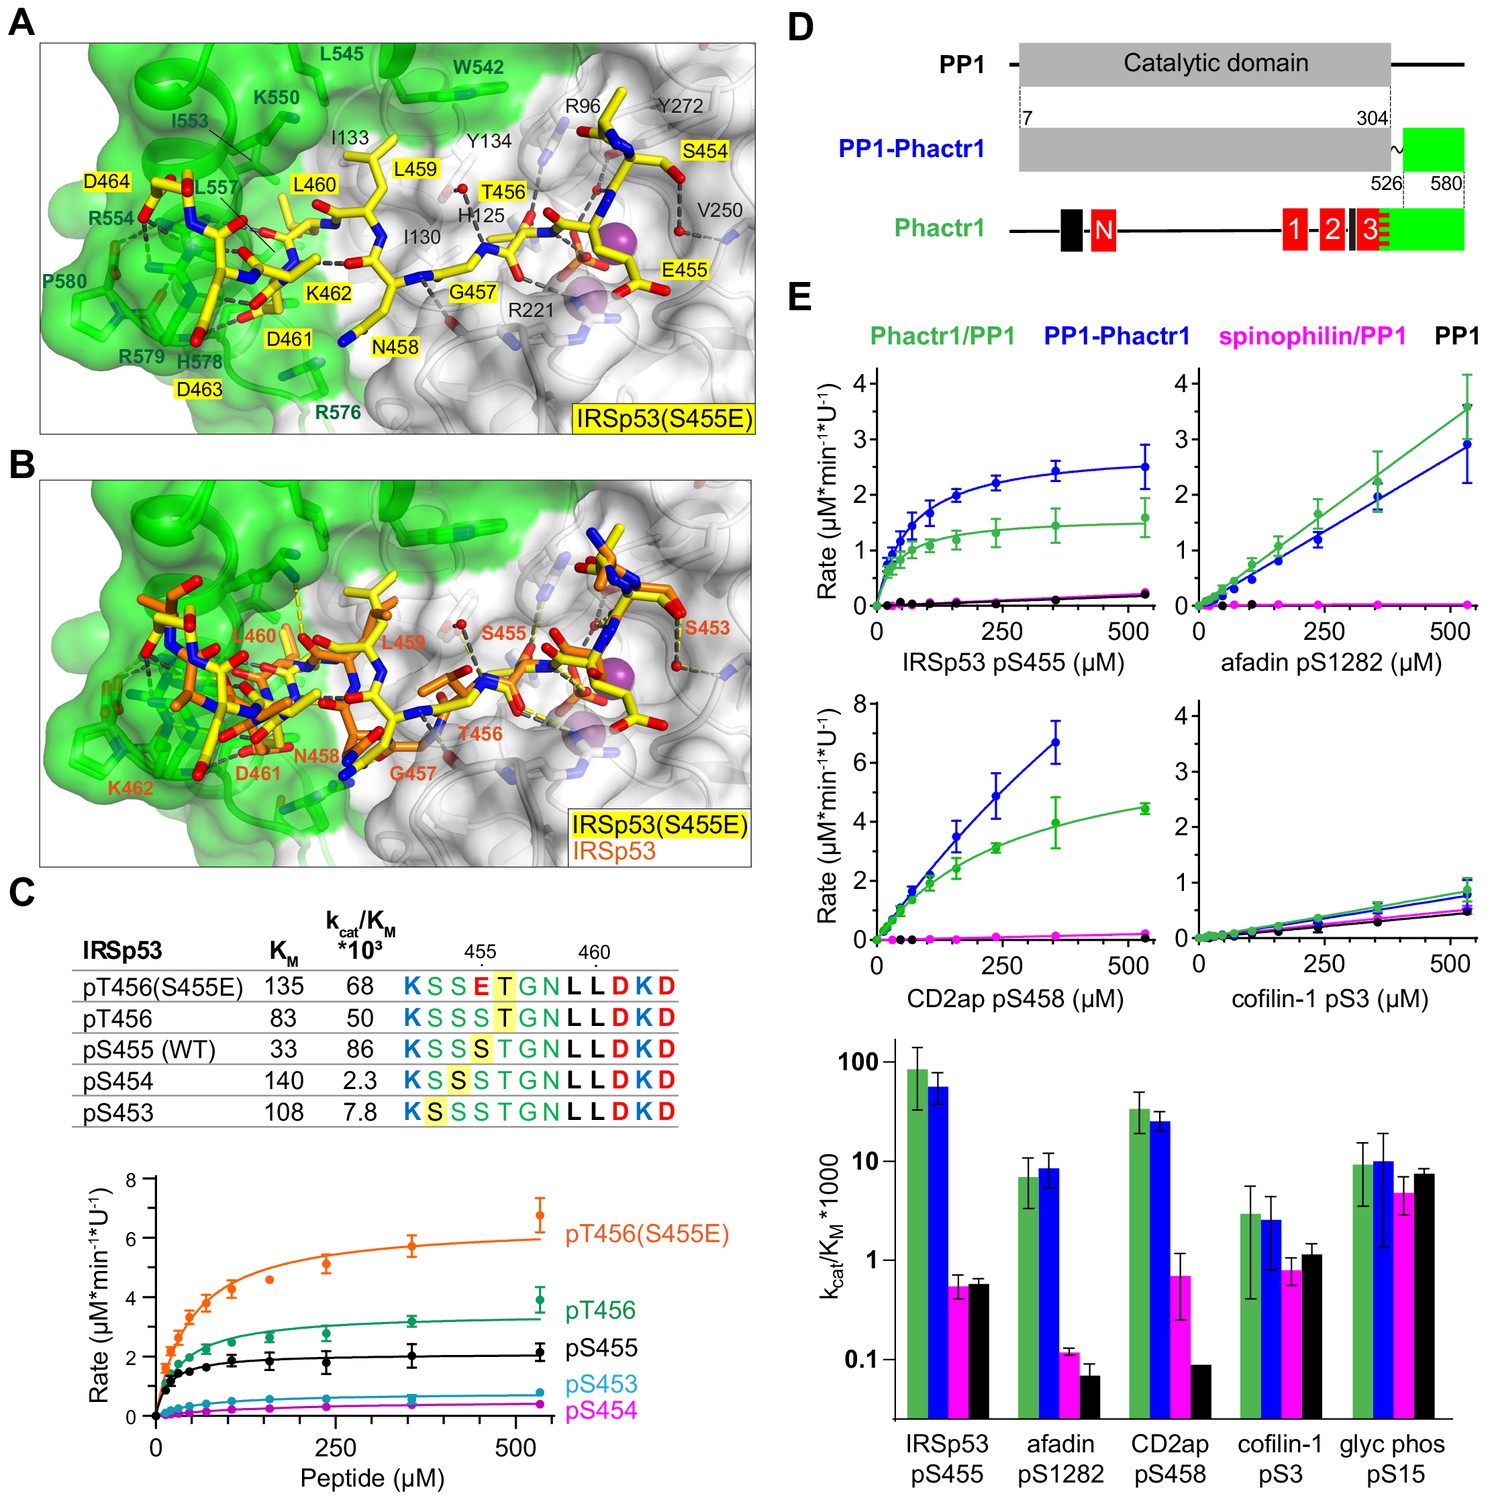
Flexible substrate interactions and substrate specificity of the Phactr1/PP1 complex.
(A, B) Flexibility in target serine-hydrophobic pocket binding residue spacing, illustrated by (A) structure of the Phactr1/PP1-IRSp53(S455E) complex, compared with (B) the Phactr1/PP1-IRSp53 wildtype complex. (C) Phactr1/PP1 dephosphorylation of derivatives of IRSp53 peptides carrying phosphate at different locations, highlighted in yellow. Phosphatase activity data is shown below (data are mean ± SD, WT n = 15, others n = 2–6) (D) Schematic of the PP1-Phactr1 fusion protein PP1-Phactr1(526-580). (E) Top, phosphatase activity data for the indicated substrates and enzymes. Bottom, relative catalytic efficiencies for the different substrates (data are mean ± SD, n = from 1 to 15).
Figure 6—figure supplement 1
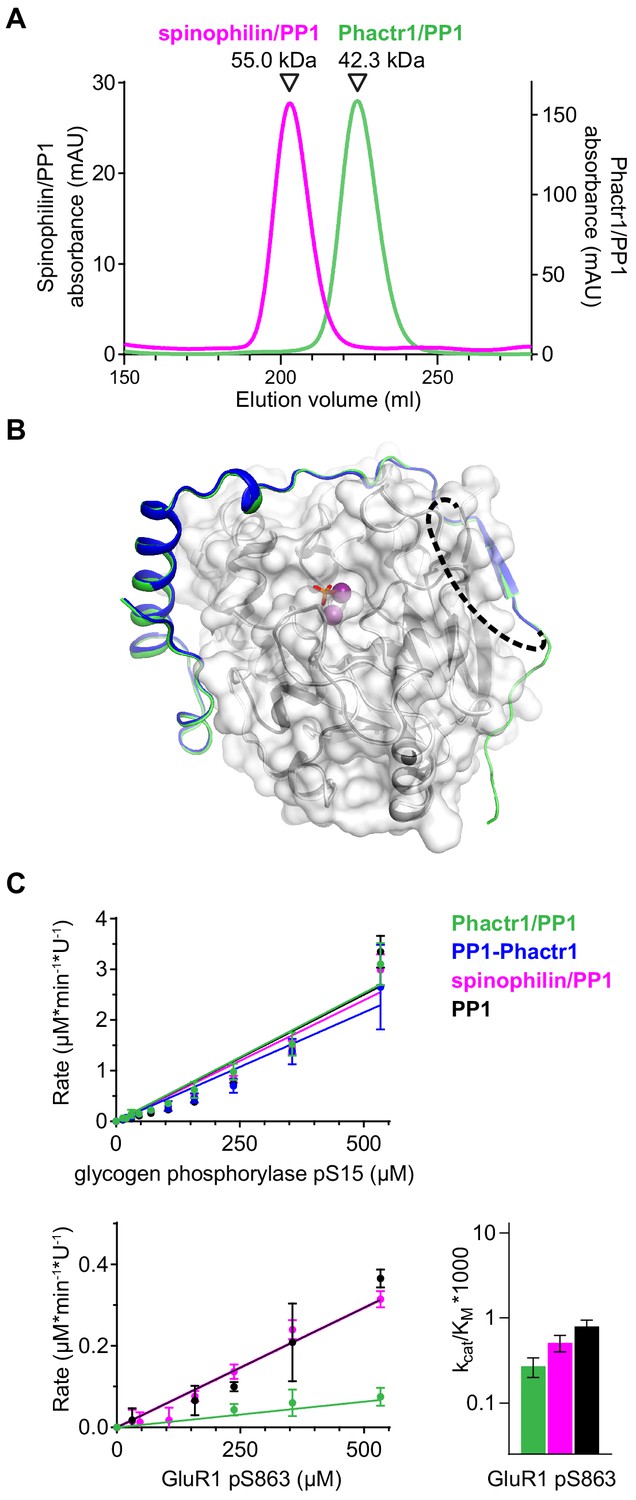
Flexible substrate interactions and substrate specificity of the Phactr1/PP1 complex.
(A) Gel filtration profiles of the Phactr1/PP1 (green line) and spinophilin/PP1 complexes (magenta line) used for the substrate-specificity analysis. (B) Structure of the PP1-Phactr1 fusion protein, solved at 1.78 Å resolution. Phactr1 residues 526–580, dark blue cartoon; PP1, white surface; unresolved SGSGS linker, dashes; trajectory of Phactr1 residues 516–580 in the Phactr1/PP1 complex, green cartoon. PP1-Phactr1 exhibited 0.25 Å RMSD over 2395 atoms compared with the equivalent region of the Phactr1/PP1 holoenzyme complex. (C) Top, phosphatase activity data for 19mer peptides containing glycogen phosphorylase pS15 (top) and GluR1 pS863 (bottom). Relative catalytic efficiencies are shown in Figure 6E (glycogen phosphorylase pS15) or at right (GluR1 pS863) (data are ±half range, n = 2).
Tables
Table 1
Crystallographic data and refinement statistics.
| Phactr1/PP1 (pH 8.5) | Phactr1/PP1 (pH 5.25) | Phactr1/PP1-IRSp53 (pH 8.5) | Phactr1/PP1-spectrin-αII (pH 8.5) | Phactr1/PP1-IRSp53-S455E (pH 8.5) | PP1-Phactr1(526-580) (pH 8.5) | |
|---|---|---|---|---|---|---|
| PDB ID | 6ZEE | 6ZEF | 6ZEG | 6ZEH | 6ZEI | 6ZEJ |
| Resolution range | 238.79–1.90 (1.93–1.90) | 56.05–1.94 (2.01–1.94) | 35.12–1.09 (1.13–1.09) | 48.47–1.30 (1.35–1.30) | 69.37–1.39 (1.44–1.39) | 59.48–1.78 (1.84–1.78) |
| Space group | P65 | P 1 | P 21 | P 21 | P 21 | P 65 |
| Unit cell a, b, c | 137.7 137.7 238.8 | 47.5 57.5 89.6 | 48.6 122.3 69.0 | 48.5 122.3 69.3 | 48.7 122.3 69.4 | 137.37 137.37 238.02 |
| α, β, γ | 90 90 120 | 78.0 74.6 81.6 | 90 92.2 90 | 90 92.1 90 | 90 92.2 90 | 90 90 120 |
| Total reflections | 2 420 272 (99 345) | 522 449 (32 609) | 664 254 (62 356) | 1 278 289 (123 745) | 1 058 251 (79 018) | 5 001 498 (505 725) |
| Unique reflections | 200 820 (9 938) | 65 136 (6 061) | 332 349 (31 383) | 196 809 (19 297) | 162 314 (15 982) | 241 814 (24 087) |
| Multiplicity | 12.1 (10.0) | 8.0 (5.4) | 2.0 (2.0) | 6.5 (6.4) | 6.5 (4.9) | 20.7 (21.0) |
| Completeness (%) | 100 (100) | 98.5 (92.0) | 99.3 (93.7) | 99.1 (96.8) | 99.6 (98.3) | 99.7 (99.6) |
| Mean I/sigma(I) | 7.5 (1.1) | 9.7 (2.7) | 15.4 (1.8) | 5.9 (1.1) | 12.5 (1.1) | 12.9 (1.1) |
| Wilson B-factor | 33.1 | 30 | 10.8 | 11.1 | 16.4 | 26.4 |
| R-merge | 0.14 (2.1) | 0.13 (0.57) | 0.01 (0.44) | 0.13 (1.78) | 0.06 (1.05) | 0.179 (3.19) |
| R-meas | 0.16 (2.3) | 0.14 (0.64) | 0.02 (0.62) | 0.15 (1.94) | 0.07 (1.18) | 0.18 (3.26) |
| R-pim | 0.04 (0.75) | 0.04 (0.26) | 0.01 (0.44) | 0.05 (0.75) | 0.02 (0.52) | 0.04 (0.70) |
| CC1/2 | 0.99 (0.70) | 0.99 (0.88) | 1.0 (0.65) | 0.99 (0.47) | 1.0 (0.54) | 1.0 (0.54) |
| Reflections used in refinement | 199 843 (6 288) | 65 085 (6 061) | 332 111 (31 289) | 195 791 (19 135) | 162 184 (15 972) | 241 401 (24 054) |
| Reflections used for R-free | 10 138 (347) | 3 132 (295) | 16 696 (1 543) | 9 611 (927) | 1 999 (197) | 12 175 (1 276) |
| R-work | 0.23 (0.34) | 0.18 (0.22) | 0.11 (0.23) | 0.13 (0.23) | 0.12 (0.24) | 0.24 (0.36) |
| R-free | 0.26 (0.37) | 0.21 (0.24) | 0.14 (0.24) | 0.16 (0.26) | 0.15 (0.27) | 0.27 (0.40) |
| Number of non-hydrogen atoms | 18 201 | 5 962 | 7 225 | 6 778 | 6 822 | 17 414 |
| Macromolecules | 17428 | 5 683 | 6 339 | 6 104 | 6 099 | 16 682 |
| Ligands | 33 | 37 | 42 | 19 | 32 | 58 |
| Solvent | 740 | 242 | 844 | 655 | 691 | 674 |
| Protein residues | 2160 | 715 | 754 | 742 | 742 | 2 094 |
| RMS(bonds) | 0.011 | 0.005 | 0.01 | 0.01 | 0.011 | 0.011 |
| RMS(angles) | 0.85 | 0.84 | 1.17 | 1.15 | 1.29 | 0.84 |
| Ramachandran favoured (%) | 96 | 95.62 | 97.15 | 96.99 | 96.99 | 95.85 |
| Ramachandran allowed (%) | 4 | 4.38 | 2.85 | 3.01 | 2.88 | 4.15 |
| Ramachandran outliers (%) | 0 | 0 | 0 | 0 | 0.14 | 0 |
| Clashscore | 2.51 | 2.65 | 4.7 | 3.05 | 3.87 | 2.7 |
| Average B-factor | 44.4 | 41 | 16.2 | 19 | 21.7 | 41 |
| Macromolecules | 44.9 | 40.8 | 14.6 | 17.6 | 20.1 | 41.1 |
| Ligands | 48.7 | 46.7 | 23.6 | 14.9 | 23.7 | 44.7 |
| Solvent | 41.6 | 43.1 | 28 | 32.8 | 35.4 | 37.1 |
Appendix 1—key resources table
| Reagent type (species) or resource | Designation | Source or reference | Identifiers | Additional information |
|---|---|---|---|---|
| Gene Mus musculus | Afdn | UniProt | Q9QZQ1 | Encodes Afadin, also known as AF6, MLLT4 |
| Gene Mus musculus | Baiap2 | UniProt | Q8BKX1 | Encodes IRSp53, also known as BAIAP2 |
| Gene Mus musculus | Sptan1 | UniProt | P16546 | Encodes Spectrin, also known as SPTA2, Fodrin, SPTAN1 |
| Gene Mus musculus | Phactr1 | UniProt | Q2M3X8 | |
| Strain E. coli | 5-alpha competent E. coli | NEB | C2992I | |
| Strain E. coli | Protein expression BL21 (DE3) | NEB | C2527H | |
| Cell line Mus musculus | NIH3T3 | ATCC | CRL-1658 | |
| Strain, strain background Mus musculus | Phactr1tm1d/tm1d | M. Prechova | Constructed from Phactr1tm1a(KOMP)Wtsihttps://www.komp.org/ M. Přechová, PhD thesis (University College London) | |
| Antibody | Rabbit polyclonal anti-Flag | Sigma | F7425, RRID:AB_439687 | WB 1:500 |
| Antibody | Goat polyclonal anti-IRSp53 | Abcam | ab15697 RRID:AB_302045 | WB 1:500 |
| Antibody | Mouse monoclonal anti-Afadin (B-5) | Santa Cruz | sc-74433 RRID:AB_1118734 | WB 1:200 |
| Antibody | anti-GST HRP Conjugate | VWR | RPN1236 RRID:AB_771429 | WB 1:1000 |
| Antibody | Mouse monoclonal anti-spectrin (D8B7) | Abcam | ab11755 RRID:AB_298540 | WB 1:500 |
| Antibody | Mouse monoclonal anti-Gapdh (G-9) | Santa-Cruz | sc-365062 RRID:AB_10847862 | WB 1:1000 |
| Antibody | Rabbit polyclonal anti-IRSp53 pS455 | This paper | WB 1:500 See Materials and methods; Figure 3F | |
| Antibody | Rabbit polyclonal anti-afadin pS1282 | This paper | WB 1:500 See Materials and methods; Figure 3F | |
| Antibody | Rabbit polyclonal anti-spectrin pS1031 | This paper | WB 1:500 See Materials and methods; Figure 3F | |
| Antibody | IRDye 680RD Secondary Antibodies | Licor | 925-68073 RRID:AB_2716687 | WB 1:10000 |
| Antibody | IRDye 800CW Secondary Antibodies | Licor | 925-32214 RRID:AB_2687553 | WB 1:10000 |
| Recombinant DNA reagent (plasmid) | pcDNA3.1 IRSp53 | Dr. Eunjoon Kim | PMID:15673667 | |
| Recombinant DNA reagent (plasmid) | pcDNA3.1 IRSp53 L460A | This paper | See Materials and methods; Figure 5B | |
| Recombinant DNA reagent (plasmid) | pEF Phactr1 | Wiezlak et al., 2012 | ||
| Recombinant DNA reagent (plasmid) | pEF Phactr1(464-580) | This paper | See Materials and methods; Figure 3—figure supplement 1A | |
| Recombinant DNA reagent (plasmid) | pEF Phactr1XXX(464-580) | This paper | See Materials and methods; Figure 3—figure supplement 1A | |
| Recombinant DNA reagent (plasmid) | pTRIPZ | Diring et al., 2019 | ||
| Recombinant DNA reagent (plasmid) | pTRIPZ Phactr1XXX | This paper | See Wiezlak et al., 2012; Materials and methods; Figure 3—figure supplement 1B | |
| Recombinant DNA reagent (plasmid) | pTRIPZ Phactr1XXXΔC | This paper | See Wiezlak et al., 2012; Materials and methods; Figure 3—figure supplement 1B | |
| Recombinant DNA reagent (plasmid) | pGEX 6P2 | GE Healthcare | 27-4598-01 | |
| Recombinant DNA reagent (plasmid) | pGEX Phactr1(517-580) | This paper | See Materials and methods; Figure 1 | |
| Recombinant DNA reagent (plasmid) | pGEX Phactr1(523-580) | This paper | See Materials and methods Figure 1 | |
| Recombinant DNA reagent (plasmid) | pET28 PP1(7-300) | Dr. Wolfgang Peti | RRID:Addgene_26566 | |
| Recombinant DNA reagent (plasmid) | pET28 PP1-(SG)9-IRSp53 S455E | This paper | See Materials and methods; Figure 6 | |
| Recombinant DNA reagent (plasmid) | pET28 PP1-(SG)9-IRSp53 | This paper | See Materials and methods; Figure 4 | |
| Recombinant DNA reagent (plasmid) | pET28 PP1-(SG)9-spectrin | This paper | See Materials and methods; Figure 4 | |
| Recombinant DNA reagent (plasmid) | pET28 PP1-Phactr1 fusion | This paper | See Materials and methods; Figure 6 | |
| Recombinant DNA reagent | pGro7 plasmid | Takara | 3340 | |
| Sequence-based reagent | Oligonucleotides | This paper | See Materials and methods; Supplementary file 4 | |
| Sequence-based reagent | Peptides | This paper | See Materials and methods; Supplementary file 4 | |
| Commercial assay or kit | Q5 Site-Directed Mutagenesis Kit | NEB | e0552s | |
| Commercial assay or kit | NEBuilder HiFi DNA Assembly Cloning Kit | NEB | e5520s | |
| Commercial assay or kit | TMT10plex Isobaric Label Reagent Set, 0.8mg | Thermo | 90111 | |
| Commercial assay or kit | High-Select Fe-NTA Phosphopeptide Enrichment Kit | Thermo | A32992 | |
| Commercial assay or kit | High-Select TiO2 Phosphopeptide Enrichment Kit | Thermo | A32993 | |
| Commercial assay or kit | High pH Reversed Phase Fractionation Kit | Pierce | 84868 | |
| Commercial assay or kit | GenElute mammalian total RNA kit | Sigma | RTN350-1KT | |
| Commercial assay or kit | Transcriptor First Strand cDNA Synthesis kit | Roche | 04897030001 | |
| Commercial assay or kit | SYBR green RT-qPCR mix | Life Technologies | A25742 | |
| Commercial assay or kit | Biomol Green reagent | Enzo Life Sciences | BML-AK111-1000 | |
| Chemical compound | doxycycline | Sigma | D9891-100G | 1 µg/ml |
| Chemical compound | cytochalasin D | Calbiochem | A25742 | |
| Chemical compound | latrunculin B | VWR | 428020-5MG | |
| Chemical compound | Lipofectamine 2000 | Invitrogen | 11668-019 | |
| Chemical compound | Texas Red-phalloidin | Invitrogen | T7471 | |
| Chemical compound | pNPP | Enzo | SV-30770-02 | |
| Chemical compound | SuperSignal West Pico Plus reagent | Thermo | 34577 | |
| Software | Octet software version 7.0 | ForteBio | https://www.fortebio.com/ | |
| Software | Xcalibur | Thermo | https://www.thermofisher.com/order/catalog/product/OPTON-30965 | |
| Software | MaxQuant | Cox and Mann, 2008 | http://coxdocs.org/doku.php?id=maxquant:start | |
| Software | Perseus | Tyanova et al., 2016 | https://www.maxquant.org/perseus/ | |
| Software | Weblogo | University of California, Berkeley | https://weblogo.berkeley.edu/logo.cgi/ | |
| Software | GraphPad Prizm | GraphPad | https://www.graphpad.com/scientific-software/prism/ | |
| Software | Image Studio Lite 5.2 | LI-COR | https://www.licor.com/bio/image-studio-lite/ | |
| Software | SnapGene software | Insightful Science | snapgene.com | |
| Chemical compound | Manganese Chloride | Fluka | 221279-500G | |
| Chemical compound | Arabinose | Biosynth limited | MA02043 | |
| Chemical compound | IPTG | Neo Biotech | NB-45-00030-25G | |
| Chemical compound | Chloramphenicol | Acros organic | 227920250 | |
| Chemical compound | Tris | SDS | 10708976001 | |
| Chemical compound | Imidazole | Sigma-Aldrich | I2399-100G | |
| Chemical compound | Sodium Chloride | Sigma Aldrich | S9888-1KG | |
| Chemical compound | Triton X100 | Sigma Aldrich | X100-100ML | |
| Chemical compound | TCEP | Fluorochem | M02624 | |
| Chemical compound | AEBSF | Melford | A20010-5.0 | |
| Chemical compound | Benzamidine | Melford | B4101 | |
| Chemical compound | Complete EDTA Free Protease Inhibitor tablet | Roche | 05056489001 | |
| Chemical compound | Glutathione Sephanrose 4B | GE Healthcare | 17-0756-05 | |
| Chemical compound | Ni-NTA Agarose | Qiagen | 30230 | |
| Chemical compound | Tween 20 | Sigma-Aldrich | P1379-100ML | |
| Chemical compound | BSA | Sigma-Aldrich | A2153-100G | |
| Chemical compound | Lithium Chloride | Hampton research | HR2-631 | |
| Chemical compound | Tri Sodium Citrate | Hampton research | HR2-549 | |
| Chemical compound | PEG 6000 | Hampton research | HR2-533 | |
| Chemical compound | PEG 3350 | Hampton research | HR2-527 | |
| Chemical compound | Sodium Bromide | Hampton research | HR2-699 | |
| Chemical compound | Potassium citrate | Hampton research | HR2-683 | |
| Chemical compound | Bis-Tris-Propane | Sigma-Aldrich | B6755-500G | |
| Chemical compound | Sodium Iodide | Sigma-Aldrich | 383112-100G | |
| Chemical compound | Glycerol | SDS | G7893-2L | |
| Chemical compound | Ethylene Glycol | Sigma-Aldrich | 324558-1L | |
| Other | Amino-PEG500-UC540 membrane | Intavis | Peptide array membrane; see Materials and methods, and Figure 5 |
Additional files
-
Supplementary file 1
Phosphoproteomics data.
(A, B) SILAC phosphoproteomics in NIH3T3 cells. (A) NIH3T3 cells expressing doxycycline-inducible Phactr1XXX, Phactr1XXXΔC or vector alone were cultured in R0K0 or R10K8 SILAC media, protein expression induced with doxycycline, and cell lysates analysed by MS proteomics. Phosphorylation sites are annotated with dephosphorylation score, raw H/L values listed. (B) 1D enrichment analysis of Gene Ontology terms and kinase motifs based on the dataset from A, table A. Terms with Benjamini-Hochberg FDR < 0.02 are shown. Gene Ontology Biological Process terms are in bold and those with positive mean value are reported in Figure 3B. (C-E) Wildtype (WT) or Phactr1-null (KO) cortical and hippocampal neurons DIV10 were treated with DMSO vehicle, CD or LB for 30' and then analysed by TMT phosphoproteomics in MS2 and MS3 modes. Reporter ion intensities were normalised using Z-score function. (C) Raw and Z-score values for MS2 mode. (D) Raw and Z-score values for MS3 mode. (E) t-test was applied to (DMSO - CD) differences in WT neurons vs KO neurons. Phosphorylation sites are described and annotated with t-test difference and significance.
- https://cdn.elifesciences.org/articles/61509/elife-61509-supp1-v2.xlsx
-
Supplementary file 2
Phosphatase activity source data.
- https://cdn.elifesciences.org/articles/61509/elife-61509-supp2-v2.xlsx
-
Supplementary file 3
Immunoblot source data.
- https://cdn.elifesciences.org/articles/61509/elife-61509-supp3-v2.pdf
-
Supplementary file 4
Peptides and oligonucleotides.
- https://cdn.elifesciences.org/articles/61509/elife-61509-supp4-v2.xlsx
-
Supplementary file 5
Summary of modelled residues for the different structures.
- https://cdn.elifesciences.org/articles/61509/elife-61509-supp5-v2.docx
-
Transparent reporting form
- https://cdn.elifesciences.org/articles/61509/elife-61509-transrepform-v2.docx
Download links
A two-part list of links to download the article, or parts of the article, in various formats.
Downloads (link to download the article as PDF)
Open citations (links to open the citations from this article in various online reference manager services)
Cite this article (links to download the citations from this article in formats compatible with various reference manager tools)
Molecular basis for substrate specificity of the Phactr1/PP1 phosphatase holoenzyme
eLife 9:e61509.
https://doi.org/10.7554/eLife.61509


