Encoding and control of orientation to airflow by a set of Drosophila fan-shaped body neurons
- Neuroscience Institute, New York University Langone Medical Center, United States
- Center for Neural Science, New York University, United States
Figures
Figure 1 with 3 supplements

Sensory responses and preferred airflow direction vary across CX columnar cell types.
(A) Experimental preparation. We targeted single neurons for patching using cell type-specific expression of GFP. Flies were placed in an arena equipped with rotatable stimulus delivery and live imaging of behavior. All data shown are from awake non-flying animals. (B) Stimulus details. Left: cue presentation directions. Front (0°, gold), rear (180°, brown), ipsilateral (90°, black), and contralateral (−90°, gray) to the recorded neuron. Right: stimulus validation. Each plot shows measurements from a photodiode (top), anemometer (middle), and photo-ionization detector (PID, bottom). PID units are arbitrary. The five stimulus combinations were: a high contrast stripe illuminated by 15 mW/cm2 ambient lighting (red), a 25 cm/s airflow stream (blue), stripe and airflow together (purple), airflow and 20% apple cider vinegar together (orange), and all three modalities simultaneously (green). Each trace is 12 s long. Simultaneous cues were presented from the same direction. (C) Rhythmic and tonic baseline activity in a subset of CX columnar neuron types. Left: raw membrane potential over time for three example neurons. P-EN2 and P-F2N3 show rhythmic activity at different frequencies, while P-F3LC fires tonically at rest. Right: resting membrane potential probability distributions for each recorded neuron of the types shown (gray). Example neurons in black. Rhythmic neurons exhibit broad distributions, while tonic neurons show tight distributions. See also Figure 1—figure supplement 1. (D) Left: CX neuropils innervated by P-F1N3 neurons (gray). PB, protocerebral bridge; FB, fan-shaped body; EB, ellipsoid body; NO, noduli. Right: PSTHs for a single P-F1N3 neuron. Each trace represents the mean of four presentations of stripe alone (red, top) or airflow alone (blue, bottom) from one direction. Colors representing different directions as illustrated in (B). Colored boxes indicate the 4 s stimulus period. Dashed line indicates 0 Hz. (E) Responses to airflow (blue) versus stripe (red) for each neuron type. Gray dots indicate the mean spiking response of each cell (1 s stimulus minus 1 s baseline) to four trials from the direction producing the strongest response (see Materials and methods). Colored bars: mean across cells. The example P-F1N3 neuron from (D) is shown in black. Significant differences (p<0.05 by sign-rank test) between modalities are marked with an asterisk. For additional detail, see Fig. S2. (F) Left: CX neuropils innervated by P-F3N2d neurons. Right: PSTHs for a single P-F3N2d neuron. Each trace represents the mean of four presentations of airflow alone (blue, top) or airflow and odor together (orange, bottom) from one direction. Plot details as in (D). (G) Responses to odorized airflow (orange) versus airflow alone (blue) for all cell types recorded. Asterisk: odor significantly reduces the response of P-F1N3. Plot details as in (E). For additional detail, see Figure 1—figure supplement 2. (H) Mean airflow response across cells as a function of airflow direction for each cell type. Cell types are plotted in groups of two (gray, black) according to broad anatomical similarities. Note different vertical axis scales. Data at −180° is replotted from 180° for clarity (orange stars). For additional detail, see Figure 1—figure supplement 2.
Figure 1—figure supplement 1
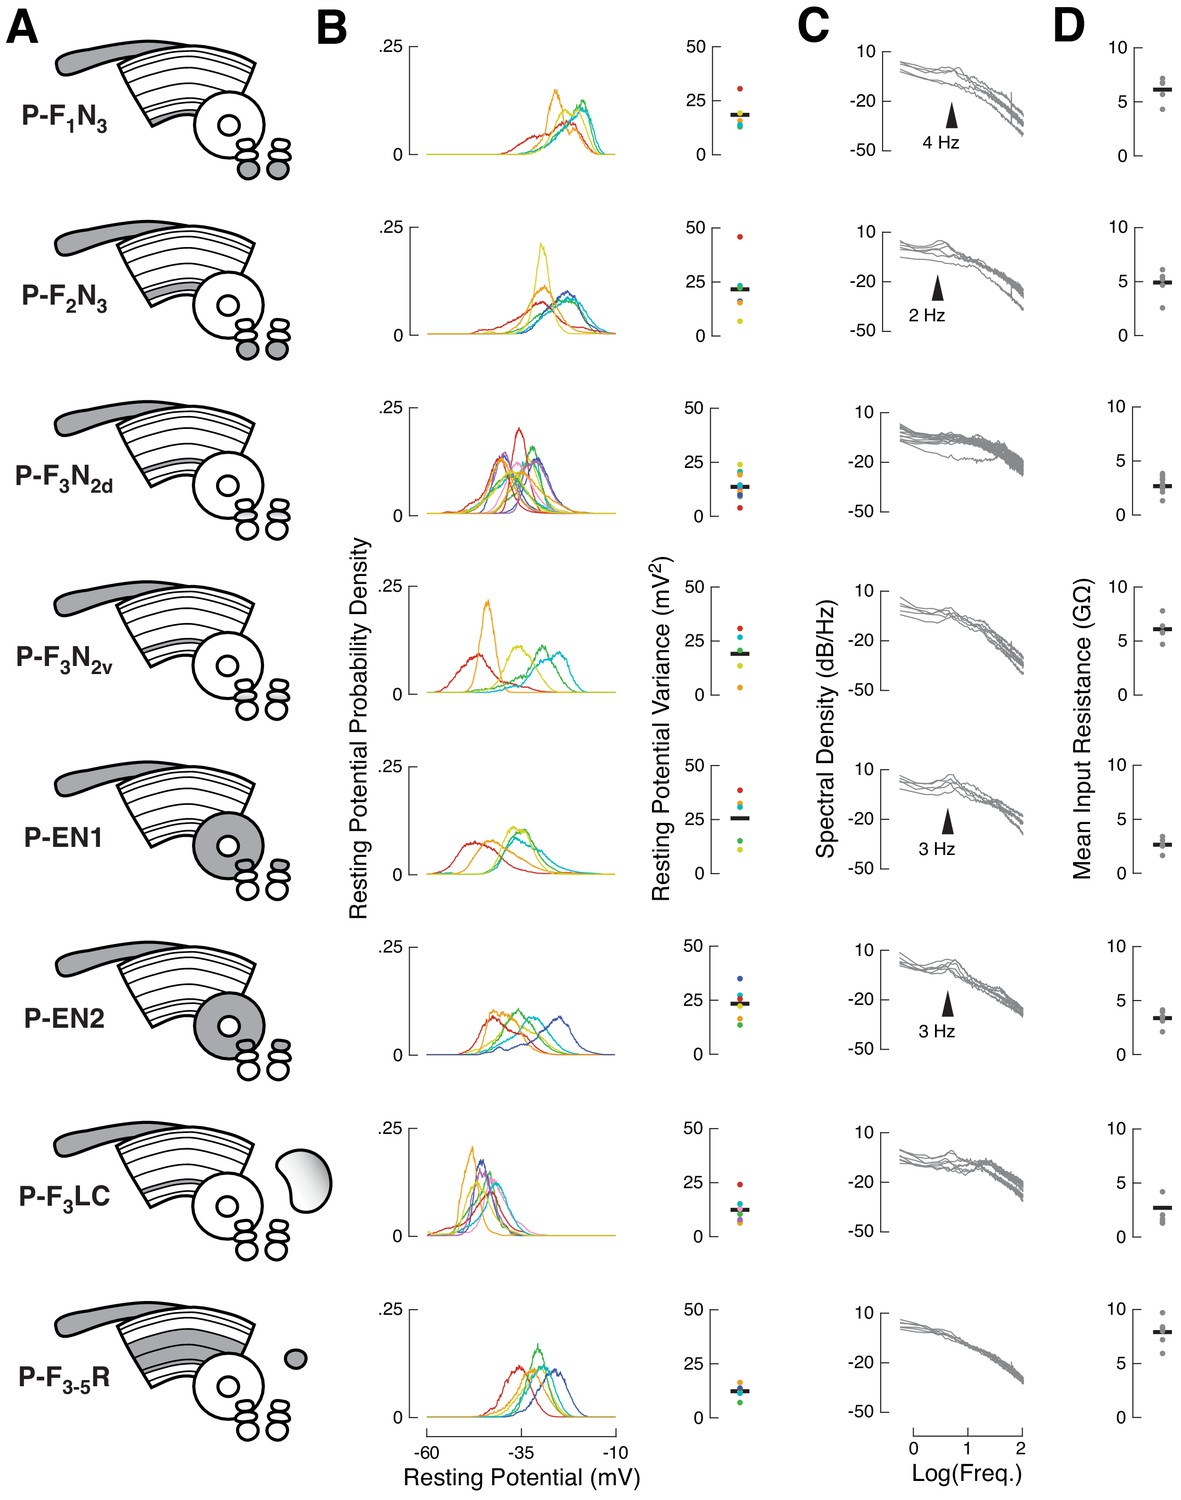
Baseline activity characterization for recorded cell types.
(A) CX neuropils innervated by each recorded cell type. Each cell type is named after standard nomenclature: single letters represent innervated neuropil (gray), with putative input regions before the dash, and putative output or mixed process regions after the dash. Each recorded neuron was filled with biocytin to confirm its identity. Previous work identified two anatomically identical but functionally distinct classes of P-ENs. PB, protocerebral bridge; FB, fan-shaped body; EB, ellipsoid body; NO, noduli; ROB, round body; LAL, lateral accessory lobe. Each row in panels (B–D) contains data from the cell type shown. (B) Left: resting membrane potential distributions for each neuron (colored lines) from the indicated cell type. Ventral P-FNs (P-F1N3 and P-F2N3) rested high (−25 mV), P-F3LC rested low (−50 mV), and all other cell types rested near −35 mV. Right: resting membrane potential variance for each neuron (colored dots) from each cell type. Black bars indicate cross-cell means. P-ENs and some P-FNs showed the greatest potential variance at rest, due to rhythmic/bursty baseline activity (see C). (C) Spectral density of the raw voltage signal for each neuron (gray lines) from the indicated cell type. Note that the x-axis is plotted on a log scale. Noteworthy deviations from 1/F density are marked with arrowheads. Both types of P-EN showed strong rhythmic/burst activity with an interval of approximately 350 msec. Ventral P-FNs displayed less regular rhythmicity at different timescales. (D) Mean input resistance for each neuron (gray dots) from each cell type. Input resistance was sampled on each trial, so each point is the mean of 40–80 Rin measurements, depending on the number of trials completed for each neuron. Black bars indicate cross-cell means.
Figure 1—figure supplement 2
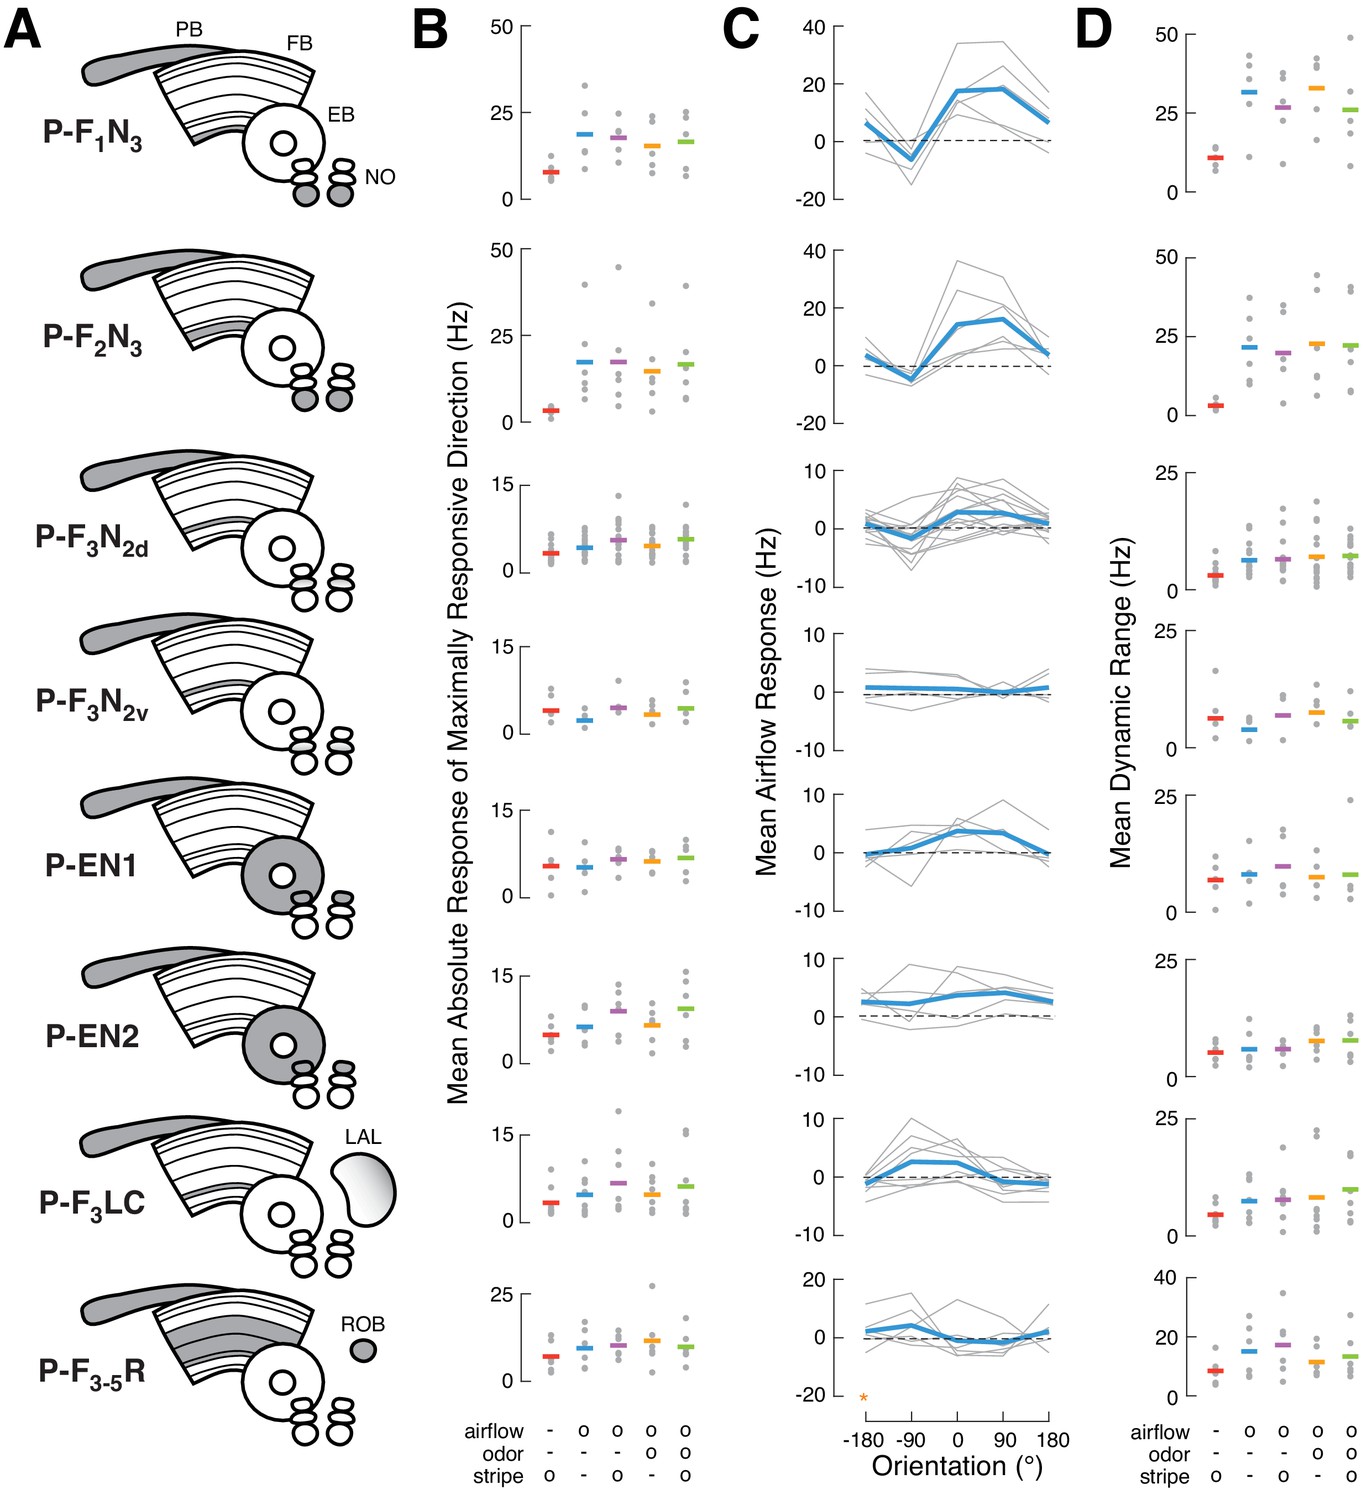
Summary of sensory responses across CX cell types.
(A) CX neuropils innervated by each recorded cell type. (B) Maximal responses to each stimulus condition. Gray dots represent the mean absolute spiking response of each cell to four presentations from the direction that elicited the largest response. Horizontal bars represent the mean across cells (colors as in Figure 1B). All responses represent changes from baseline. Note different vertical scales. (C) Tuning for airflow direction. Mean spiking response as a function of airflow direction for each neuron (gray), and across neurons of a given type (blue). Note different vertical scales. Data at −180° is replotted from 180° for clarity (orange star). (D) Dynamic range for each modality/condition, equal to the difference between the most excitatory and most inhibitory responses across directions. Larger values indicate stronger tuning. Single cells and cross-cell means as in (B).
Figure 1—figure supplement 3
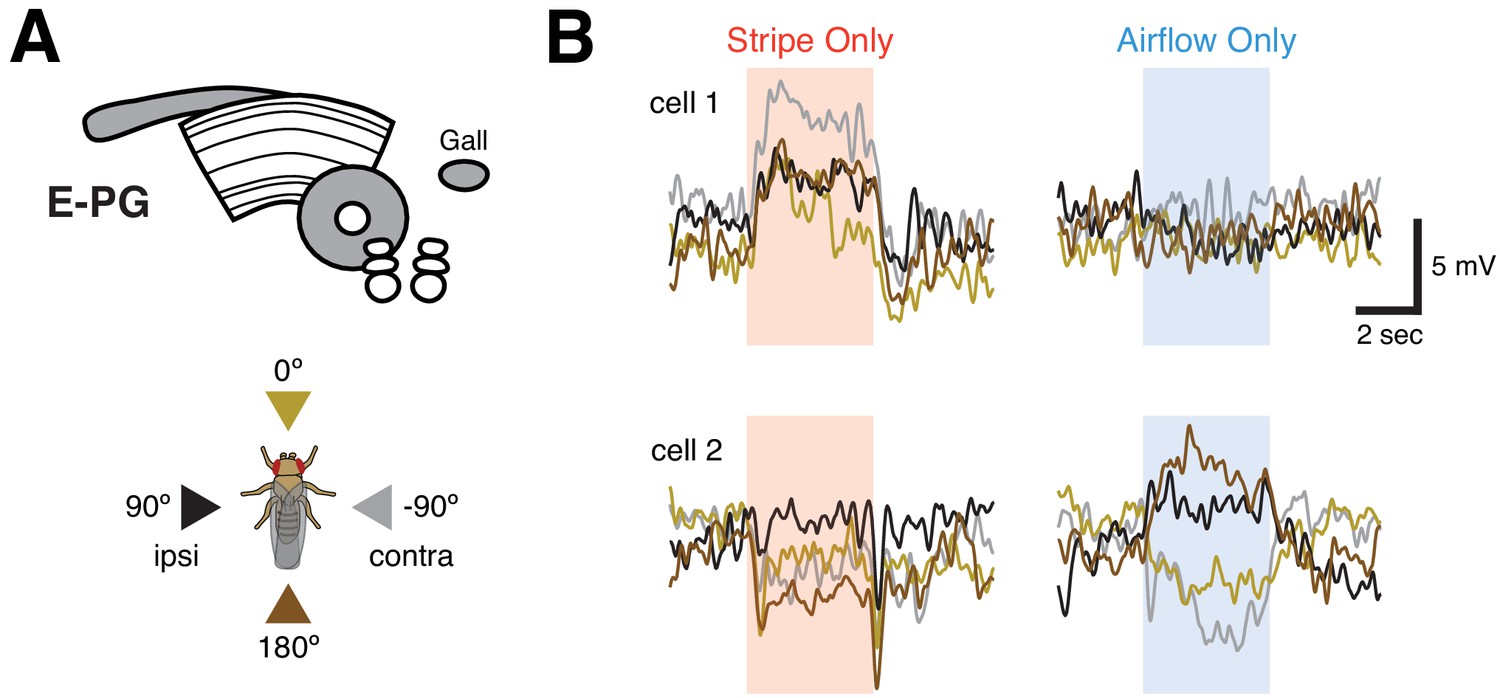
Tuned visual responses in E-PGs.
(A) Top: neuropil schematic of E-PG (‘compass’) neurons, which are known to be tuned for both visual landmark orientation (Green et al., 2017) and airflow direction (Okubo et al., 2020). Bottom: stimulus direction color key. (B) Membrane potential responses to stripe or airflow for two example E-PG neurons. Each trace is the mean of four presentations of a stimulus from a single direction. Traces are colored according to the direction schematic shown in (A). Single E-PG neurons shown directional tuning for stripe, airflow, both, or neither. Neurons that appear untuned for a stimulus likely possess off-cardinal preferred directions not captured in our stimulus set. Note that preferred airflow and stripe directions may not be identical for a single E-PG.
Figure 2 with 1 supplement
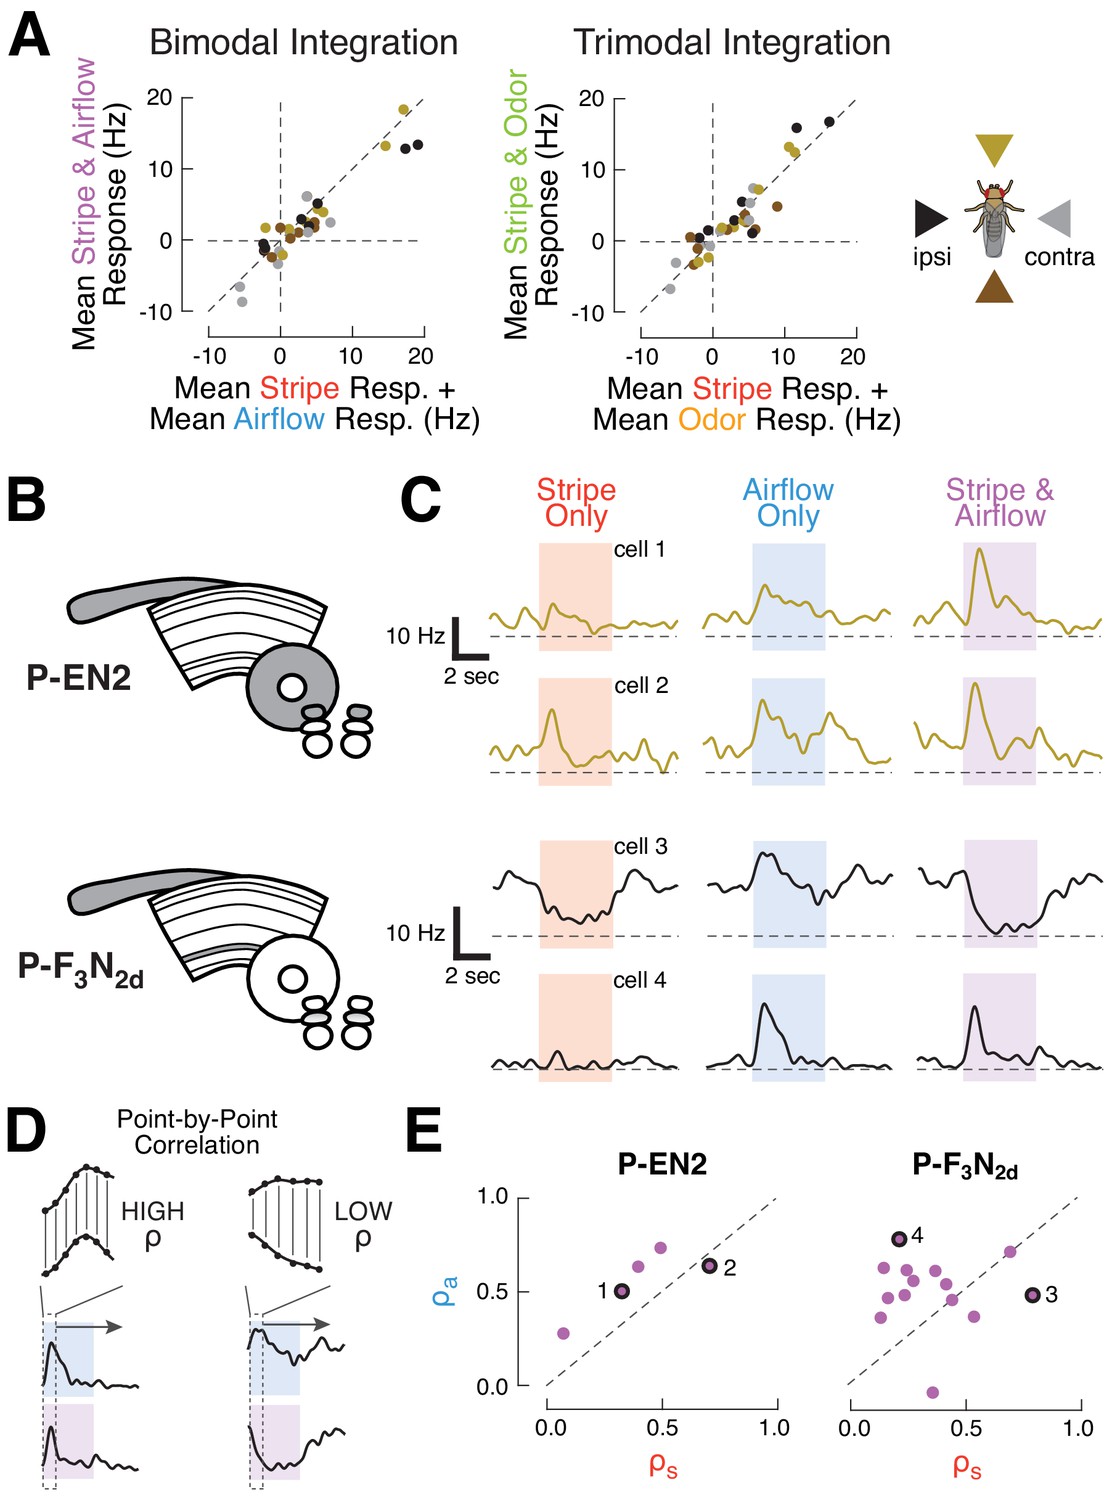
CX columnar neurons sum inputs from different modalities on average, but show diverse integration strategies at the level of single cells.
(A) Summation of multimodal cues. Left: mean spiking response to stripe and airflow together versus sum of mean stripe alone and airflow alone responses. Each point represents the response of one cell type to cues from one direction. Right: mean spiking response to stripe and airflow and odor versus sum of mean stripe alone response and mean airflow and odor response. Colors indicate cue direction (far right). Data falling along the diagonals indicate perfectly weighted summation. (B) CX neuropils innervated by example cell types P-EN2 and P-F3N2d. (C) PSTHs of two neurons from each cell type. Curves represent mean firing rate across four trials of each stimulus from a single direction. Colored boxes indicate the four second stimulus period. Dashed lines indicate 0 Hz. Top: example P-EN2 neurons responding to frontal cues. In both cases, the multi-sensory response (purple) is a weighted sum of the single modality responses (red, blue). Bottom: P-F3N2d neurons responding to ipsilateral cues. In one cell (cell 3) the stripe response dominates the multi-sensory response, while in the other (cell 4) the airflow response dominates. (D) Correlation method for computing response similarity. We computed a point-by-point correlation between the mean baseline-subtracted firing rate timecourses of multi-sensory (airflow and stripe together) responses and responses to a single modality (airflow alone, or stripe alone), across all stimulus directions. Similar traces result in high correlation coefficient (ρ). (E) Correlation coefficients (calculated as in D) of the multimodal response (stripe and airflow together) to each single modality response (airflow alone, ρa, or stripe alone, ρs). Data along the diagonal indicates that the multi-sensory response is equally similar to the stripe alone and airflow alone responses, a hallmark of summation. Data off diagonal indicates that one modality dominates the multi-sensory response. The four example cells from (C) are labeled with numbers and black rings. P-EN2 neurons consistently sum stripe and airflow responses (top), while P-F3N2d neurons integrate with greater diversity (bottom).
Figure 2—figure supplement 1
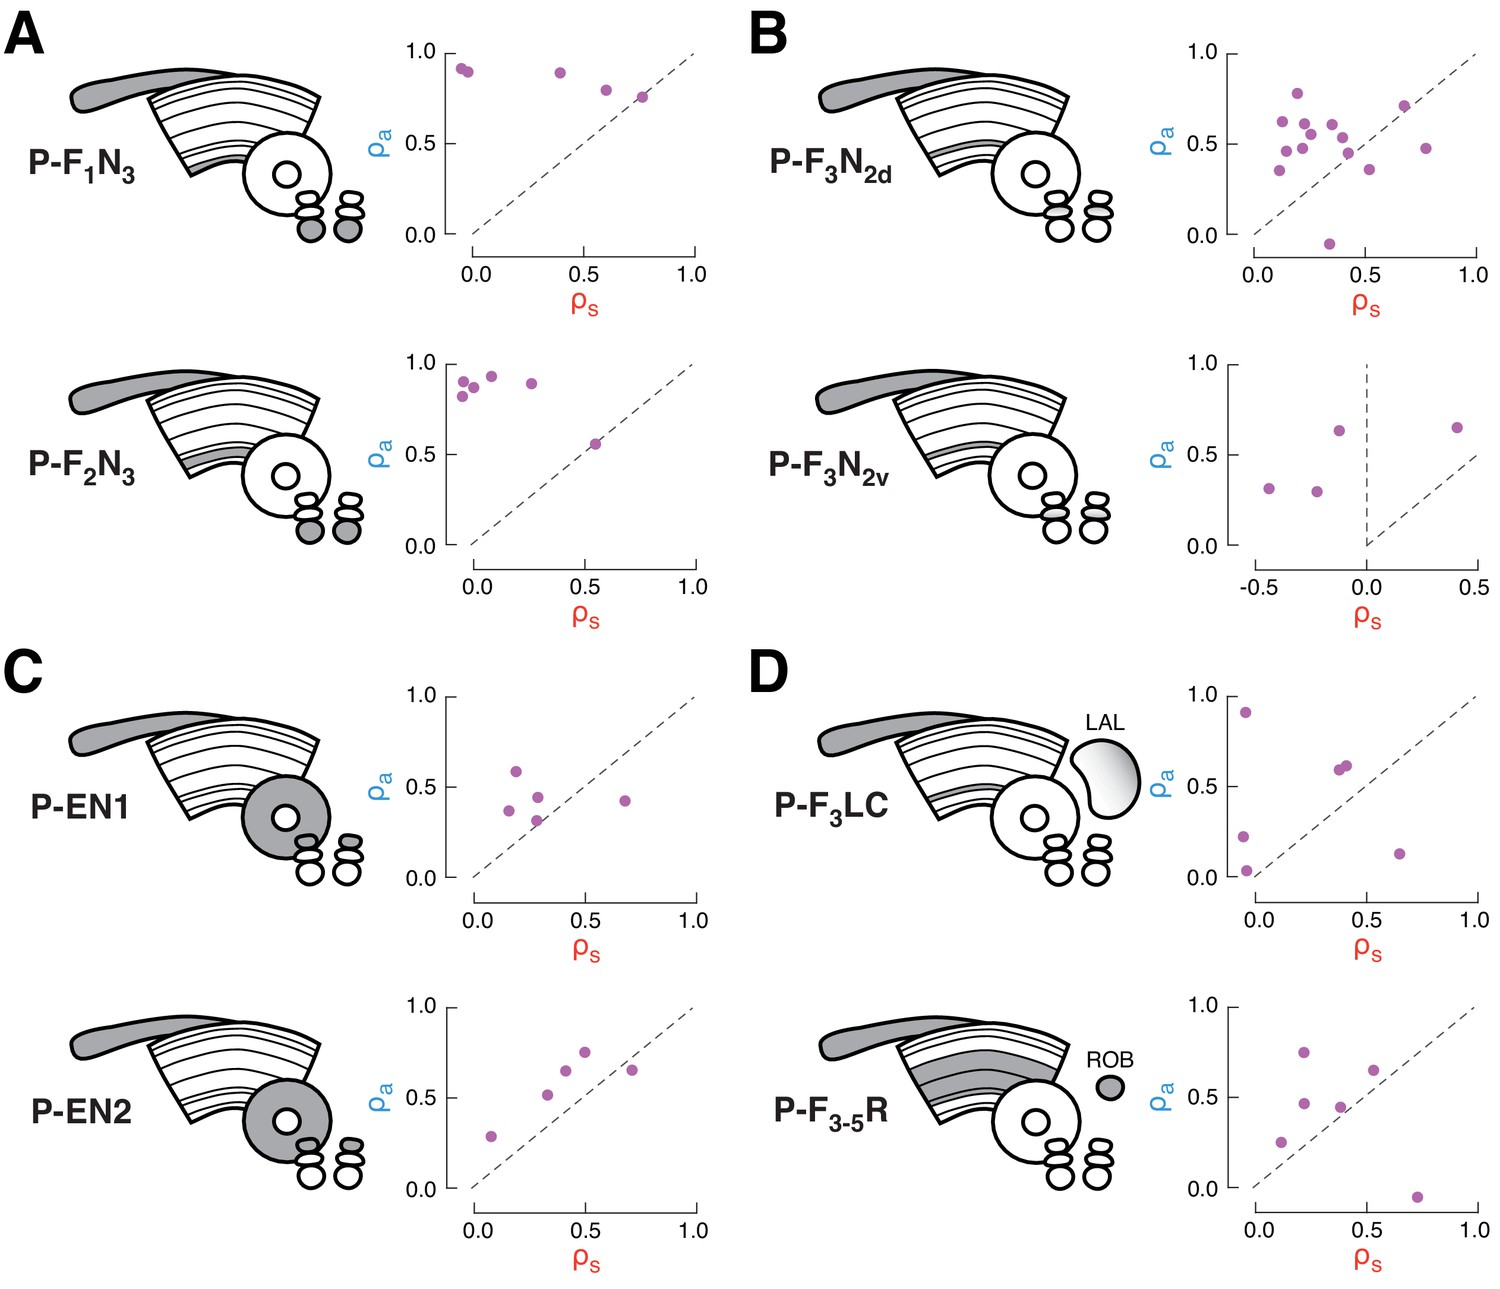
Characterization of multi-sensory integration for recorded cell types.
Each plot shows the similarity (correlation coefficient) of the response to airflow + stripe with the response to airflow alone (y-axis) versus stripe alone (x-axis), as in Figure 2 and 3. Each point represents the coefficient for one fly, calculated from the mean firing rate timecourses for all four stimulus directions. Data along the diagonal indicates that the multi-sensory response is equally similar to the stripe alone and airflow alone responses, a hallmark of summation. Data above the diagonal indicates that the multisensory response more closely resembles the airflow response and data below the diagonal indicates that the multisensory response more closely resembles the stripe response. (A) Ventral P-FNs, P-F1N3, and P-F2N3, consistently possess high airflow coefficients, indicating that the multi-sensory response is dominated by the airflow response. (B) Dorsal P-FNs, P-F3N2d, and P-F3N2v, show diverse coefficients, indicating diverse integration strategies across cells. P-F3N2v neurons even exhibit strong negative coefficients (left of vertical dashed line), indicating that the multi-sensory response can resemble inverted single modality responses. (C) P-ENs. P-EN1 integrates variably across cells, while P-EN2 integration is more consistent, as discussed in Figure 2. (D) CX extrinsic columnar neurons. Integration across P-F3LC and P-F3-5R neurons was the most variable among recorded cell types.
Figure 3
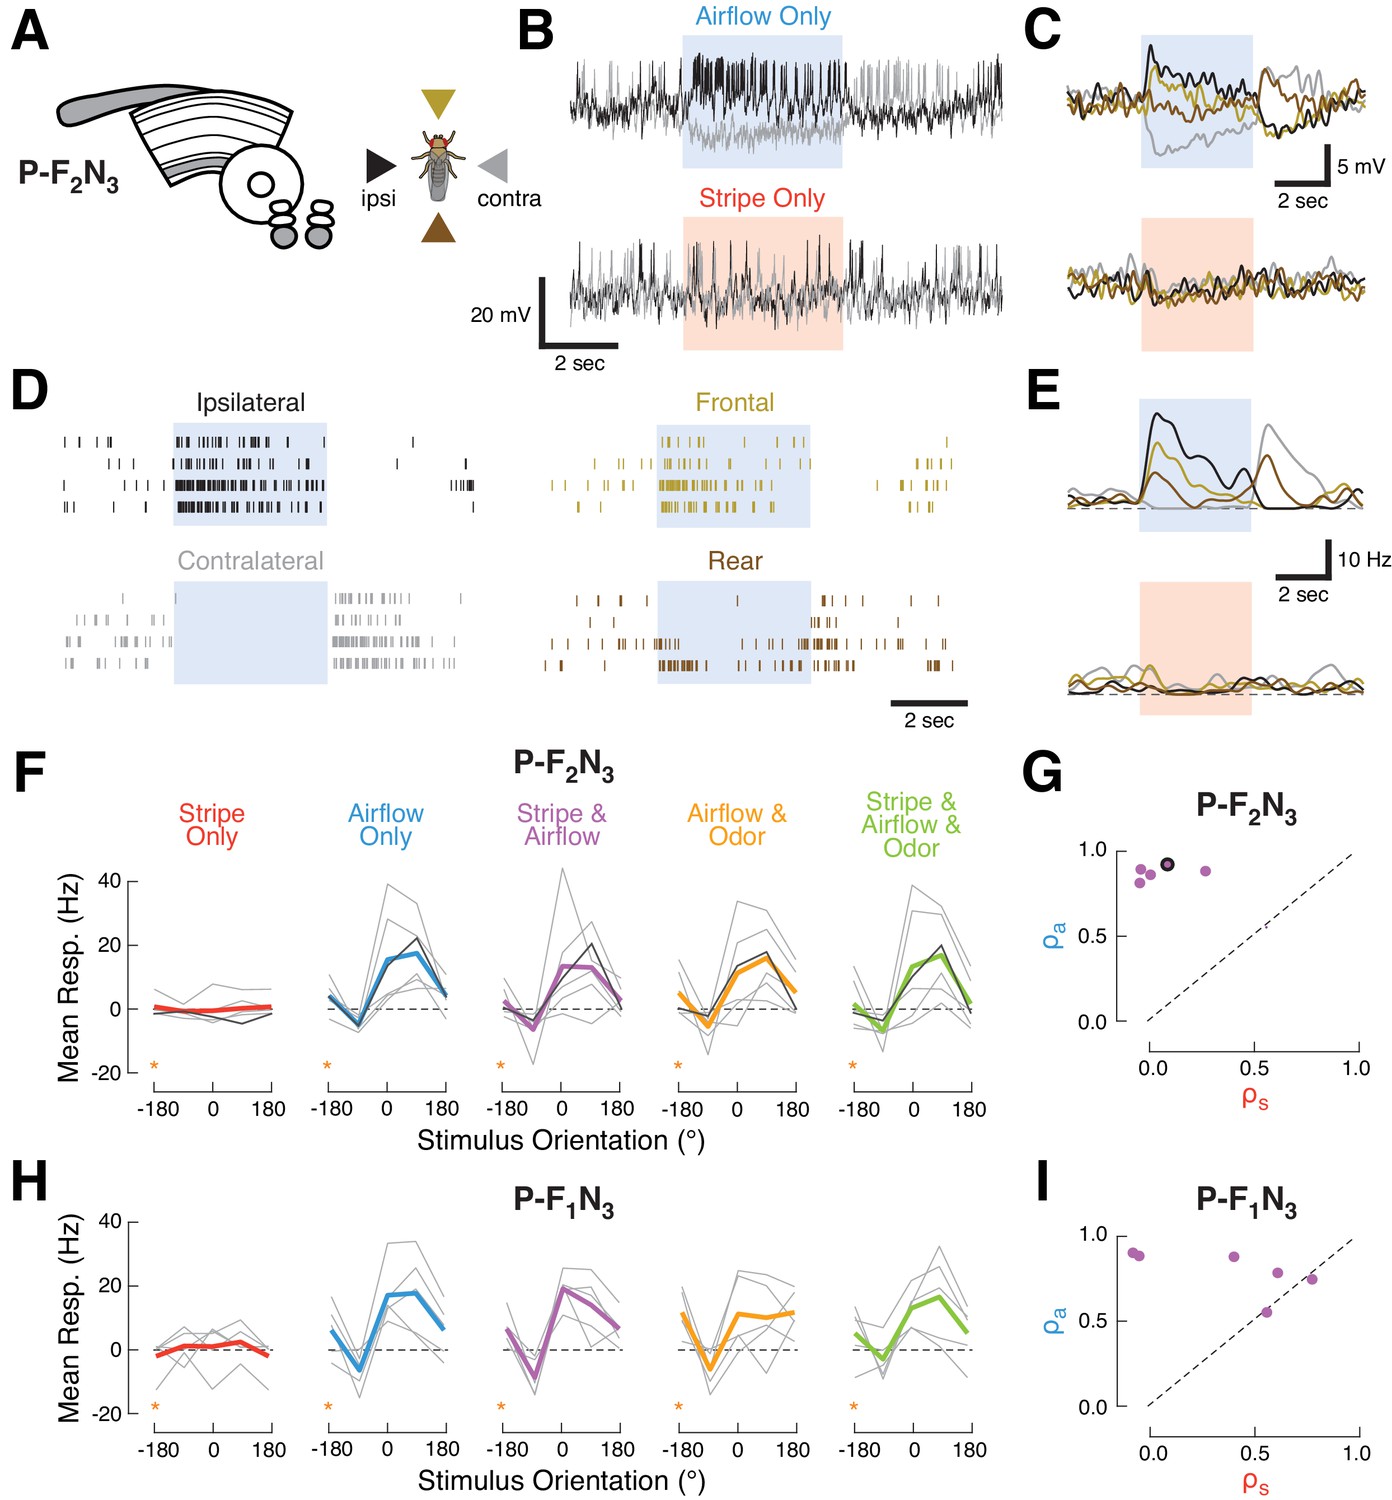
Ventral P-FNs selectively respond to directional airflow.
(A) Left: CX neuropils innervated by P-F2N3. Right: color key for directional stimuli. (B) Example trials from a single P-F2N3 neuron. Raw membrane potential for single presentations of airflow alone (blue, top) or stripe alone (red, bottom) for ipsilateral (black) and contralateral (gray) directions. Colored box indicates 4 s stimulus period. Baseline Vm = −28 mV. (C) Average Vm (over four trials) for the example neuron shown in (B). Colors represent directions as shown in (A). Stimulus period represented as in (B). (D) Spike response rasters for the example neuron shown in (B). Colors and stimulus period as in (C). (E) PSTHs for the example neuron in (B). Colors and stimulus period as in (C). (F) P-F2N3 direction tuning for each cue set showing that responses to airflow are not modulated by other modalities. Mean spiking response minus baseline for each recorded cell as a function of stimulus direction (gray lines). The example neuron in (B–E) is shown in black. Mean tuning across cells shown in thick colored lines. Data at −180° is replotted from 180° for clarity (orange stars). (G) Similarity (as in Figure 2C) of P-F2N3 multi-sensory (stripe + airflow) responses to airflow alone and stripe alone. Response to stripe + airflow is highly similar to airflow alone. Example neuron marked in black. (H) Direction tuning for the second type of ventral P-FN, P-F1N3. Note that odor subtly inhibits airflow-evoked responses (as shown in Figure 1G). Data at −180° is replotted from 180° for clarity (orange stars). (I) Same as (G), but for P-F1N3.
Figure 4
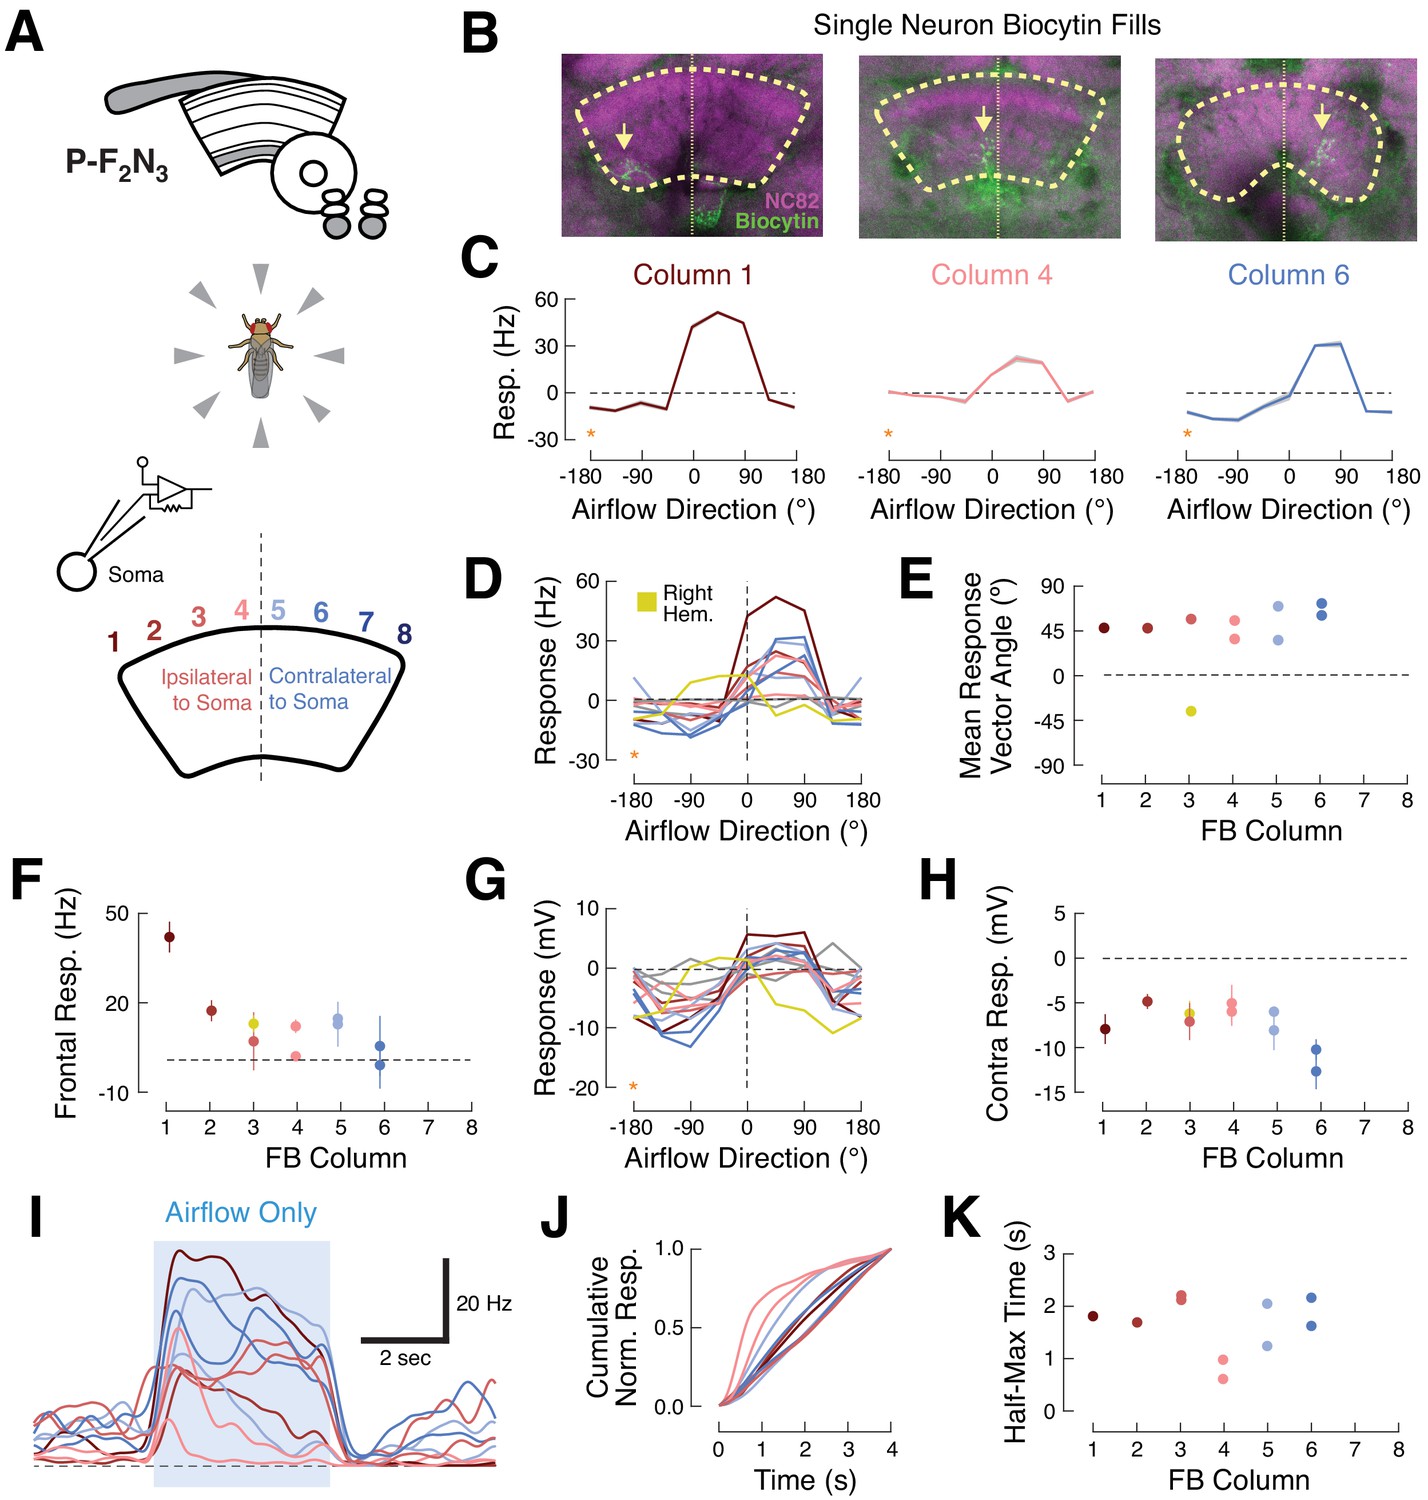
Ventral P-FNs exhibit similar ipsilateral airflow tuning across CX columns.
(A) Top: CX neuropils innervated by P-F2N3. Bottom: experimental setup. We presented airflow from eight directions and identified the column innervated by each patched neuron by filling the cell with biocytin. (B) Biocytin fills (green) for three example cells innervating columns 1 (left), 4 (middle), and 6 (right). Yellow arrows indicate FB portions of fills. Neuropil in magenta. Thick dashed line indicates the borders of the FB and thin dotted line shows the midline. (C) P-F2N3 airflow tuning is similar across FB columns. Mean +/- SEM spiking response as a function of airflow direction for the three example cells shown in (B). Data at −180° is replotted from 180° for clarity (orange stars). Colors reflect innervated column, as in (A). (D) Mean spiking response as a function of airflow direction for all recorded P-F2N3 neurons. Colors as in (A). A single right-hemisphere neuron is shown in yellow. Gray curves indicate cells for which no anatomy data could be recovered. Data at −180° is replotted from 180° for clarity (orange star). (E) Mean response vector angle as a function of column for each recorded neuron. Colors as in (D). (F) Mean +/- SEM spiking response to frontal airflow as a function of column. Colors as in (A). (G) Mean membrane potential response as a function of airflow direction for each neuron. Data at −180° is replotted from 180° for clarity (orange star). Colors as in (D). (H) Mean +/- SEM membrane potential response to contralateral airflow as a function of column. Colors as in (D). (I) Timecourse (PSTH) of airflow responses to ipsilateral airflow for the same P-F2N3 neurons (average of 4 trials). Blue box indicates 4 s stimulus. Colors as in (A). (J) Cumulative normalized response for each neuron during the 4 s stimulus, normalized to its mean integrated response. Transient responses show fast rise times and tonic responses show slower rise times. Colors as in (A). (K) Time to half-max (a measure of response transience) as a function of column. Colors as in (A).
Figure 5 with 1 supplement

LNa neurons are a likely source of airflow signals in ventral P-FNs.
(A) Experimental framework. Neurons with tuned airflow responses have recently been identified in the Antler (ATL) and Lateral Accessory Lobe (LAL). We recorded from vFBN (green) and LNa (orange) neurons to assess which input pathway might carry tuned airflow signals. (B) Max projection of the NO region of the SS47432 > UAS-GCaMP6f line used to record LNa calcium activity using tdTomato signal. Imaging ROI, highlighted in orange, is the neurite of one LNa neuron in one hemisphere that connects the LAL and NO. (C) Ventral P-FN airflow tuning is likely inherited from the LAL. Mean firing rate (top two rows) or dF/F (bottom row) as a function of time is plotted for each fly (thin gray lines). Cross-fly mean activity is plotted as thick colored lines. Responses to airflow presented contralaterally (−90°, left column), frontally (0°, middle column), and ipsilaterally (90°, right column) are shown. Directions (ipsi, contra) are relative to the hemisphere of connected ventral P-FN cell bodies. vFBNs responded to airflow, but were not sensitive to airflow direction. LNa neurons showed strong directional tuning for airflow that is sign-inverted with respect to ventral P-FN activity. Blue boxes represent stimulus period (4 s for top two rows, 30 s for bottom row), while dashed lines indicate 0 Hz or dF/F. Darker blue region in the bottom row represents a 10 s period when 10% apple cider vinegar was injected into the airstream (while maintaining constant airflow velocity). Odor did not have a statistically significant impact on LNa activity. Colors as in (A).
Figure 5—figure supplement 1

Trans-tango of VT029515 (vFBN).
P-FNs are putatively downstream of VT029515 neurons (vFBNs). vFBNs (green) receive input in the Antler (Ant) and project to layer 2 of the FB. Trans-tango signal (magenta) can be seen in all neuropil characteristic of P-FNs, including the PB, layers 1–3 of the FB, and layers 2 and 3 of the noduli.
Figure 6 with 1 supplement
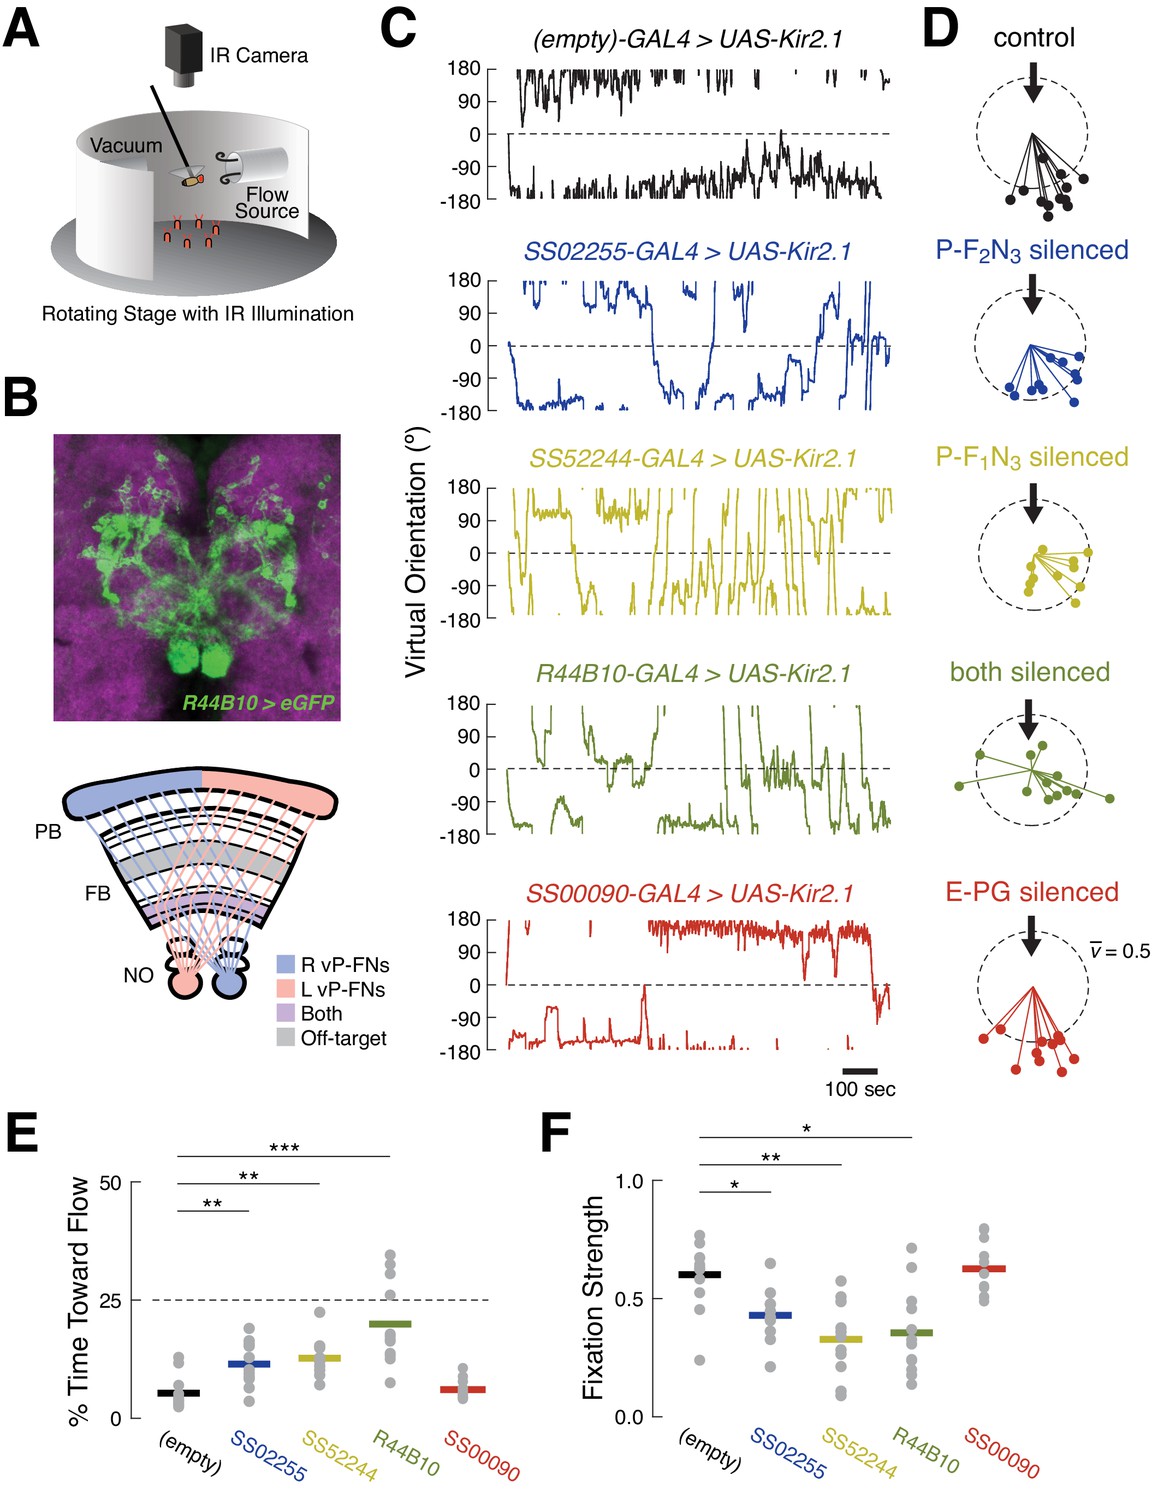
Silencing ventral P-FNs disrupts orientation to airflow.
(A) Schematic of flight simulator arena. Rigidly tethered flying flies orient in closed-loop with an airflow stream. Infrared illumination is used to track wingbeat angles which drive airflow rotation. The arena was otherwise in darkness. Modified from Currier and Nagel, 2018. (B) Anatomy of R44B10-GAL4, a driver line that targets both P-F1N3 and P-F2N3. Top: maximum z-projection of R44B10 driving 10XUAS-Kir.21-eGFP (green). Neuropil in magenta. Bottom: schematic of CX neuropils labeled by R44B10-GAL4. Right-hemisphere ventral P-FNs (blue) target the right half of the PB, the entire FB, and the left NO. Left-hemisphere ventral P-FNs (red) target the left half of the PB, the entire FB, and the right NO. Neurons from both hemispheres target all columns of FB layers 1 and 2 (purple). R44B10-GAL4 also labels non-P-FN neurons in a FB layer (‘off target,’ gray). Whole-brain expression in Fig. S5. (C) Orientation over time for example flies of each genotype. Control flies (empty-GAL4 > UAS-Kir2.1, black) fixate orientations away from the airflow sources. This fixation is reduced in flies with P-F2N3 (blue), P-F1N3 (yellow), or both (dark green) silenced. Flies with E-PGs silenced (red) show control-like orientation behavior. The entire 20 min testing period is shown for each fly. Airflow emanated from 0° (dashed line). (D) Stick-and-ball plots of mean orientation (ball angle) and fixation strength (stick length) for each fly tested in the airflow orienting paradigm. Fixation strength is the length of the mean orientation vector, which is inversely proportional to circular variance (see Materials and methods). Dashed circle corresponds to fixation strength of 0.5. All but one control fly, and all E-PG-silenced flies, showed fixation strengths near or above this value, while ventral P-FN-silenced flies displayed smaller fixation strengths. Thick arrow signifies the position and direction of the airflow stimulus (0°). Colors as in (C). (E) Percentage of time each fly (gray dots) oriented toward the flow source (between +45° and −45°), as a function of genotype. Horizontal bars indicate cross-fly means, with colors as in (C). Dashed line indicates the expected value for random orienting (chance). **p<0.01; ***p<0.001 (rank-sum test). (F) Fixation strength (as illustrated in (D)) for each fly as a function of genotype. A value of 1 indicates perfect fixation. Plot details as in (E). *p<0.05; **p<0.01 (rank-sum test).
Figure 6—figure supplement 1
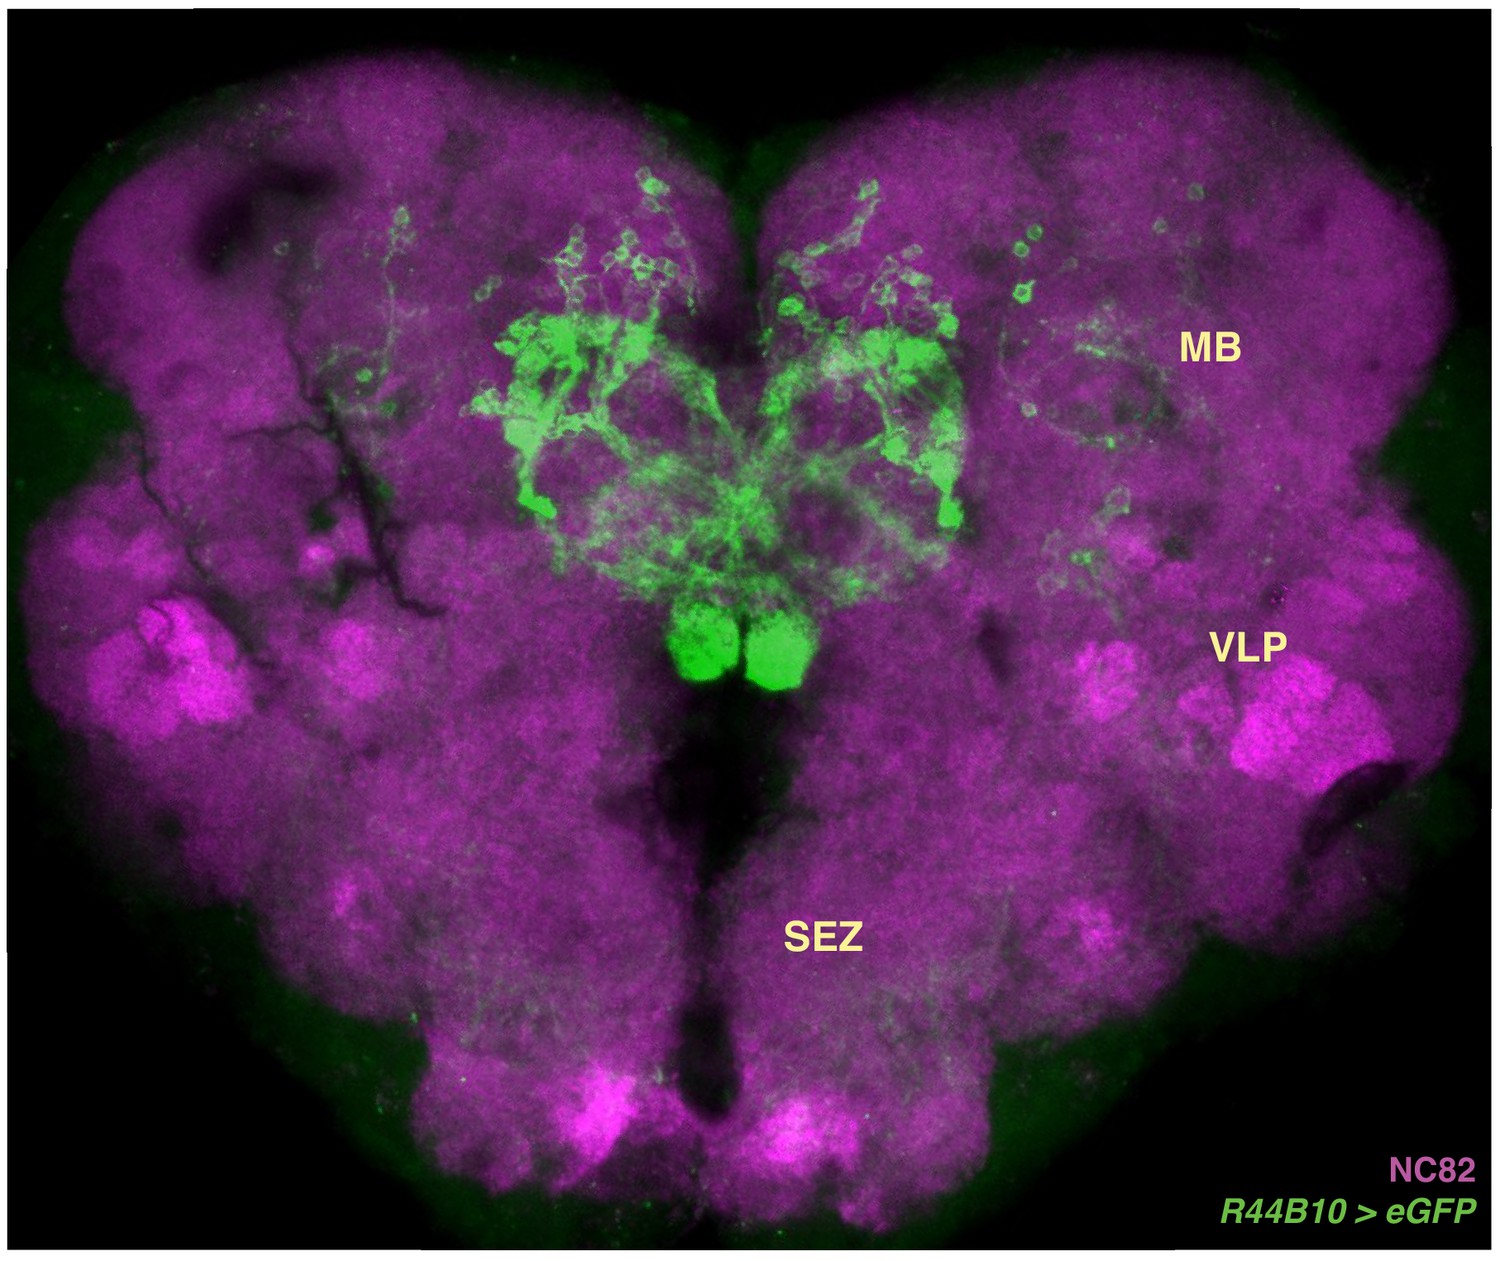
Full central brain anatomy of R44B10-GAL4.
Little GFP expression can be seen outside of the CX in R44B10-GAL4. Weak off-target signal is present in the mushroom bodies (MB), ventrolateral protocerebrum (VLP), and sub-esophageal zone (SEZ). These regions are not labeled in the split-GAL4 lines we used. Neuropil in magenta.
Figure 7
R44B10 neurons are required to convert airflow orientation changes into heading-appropriate turns.
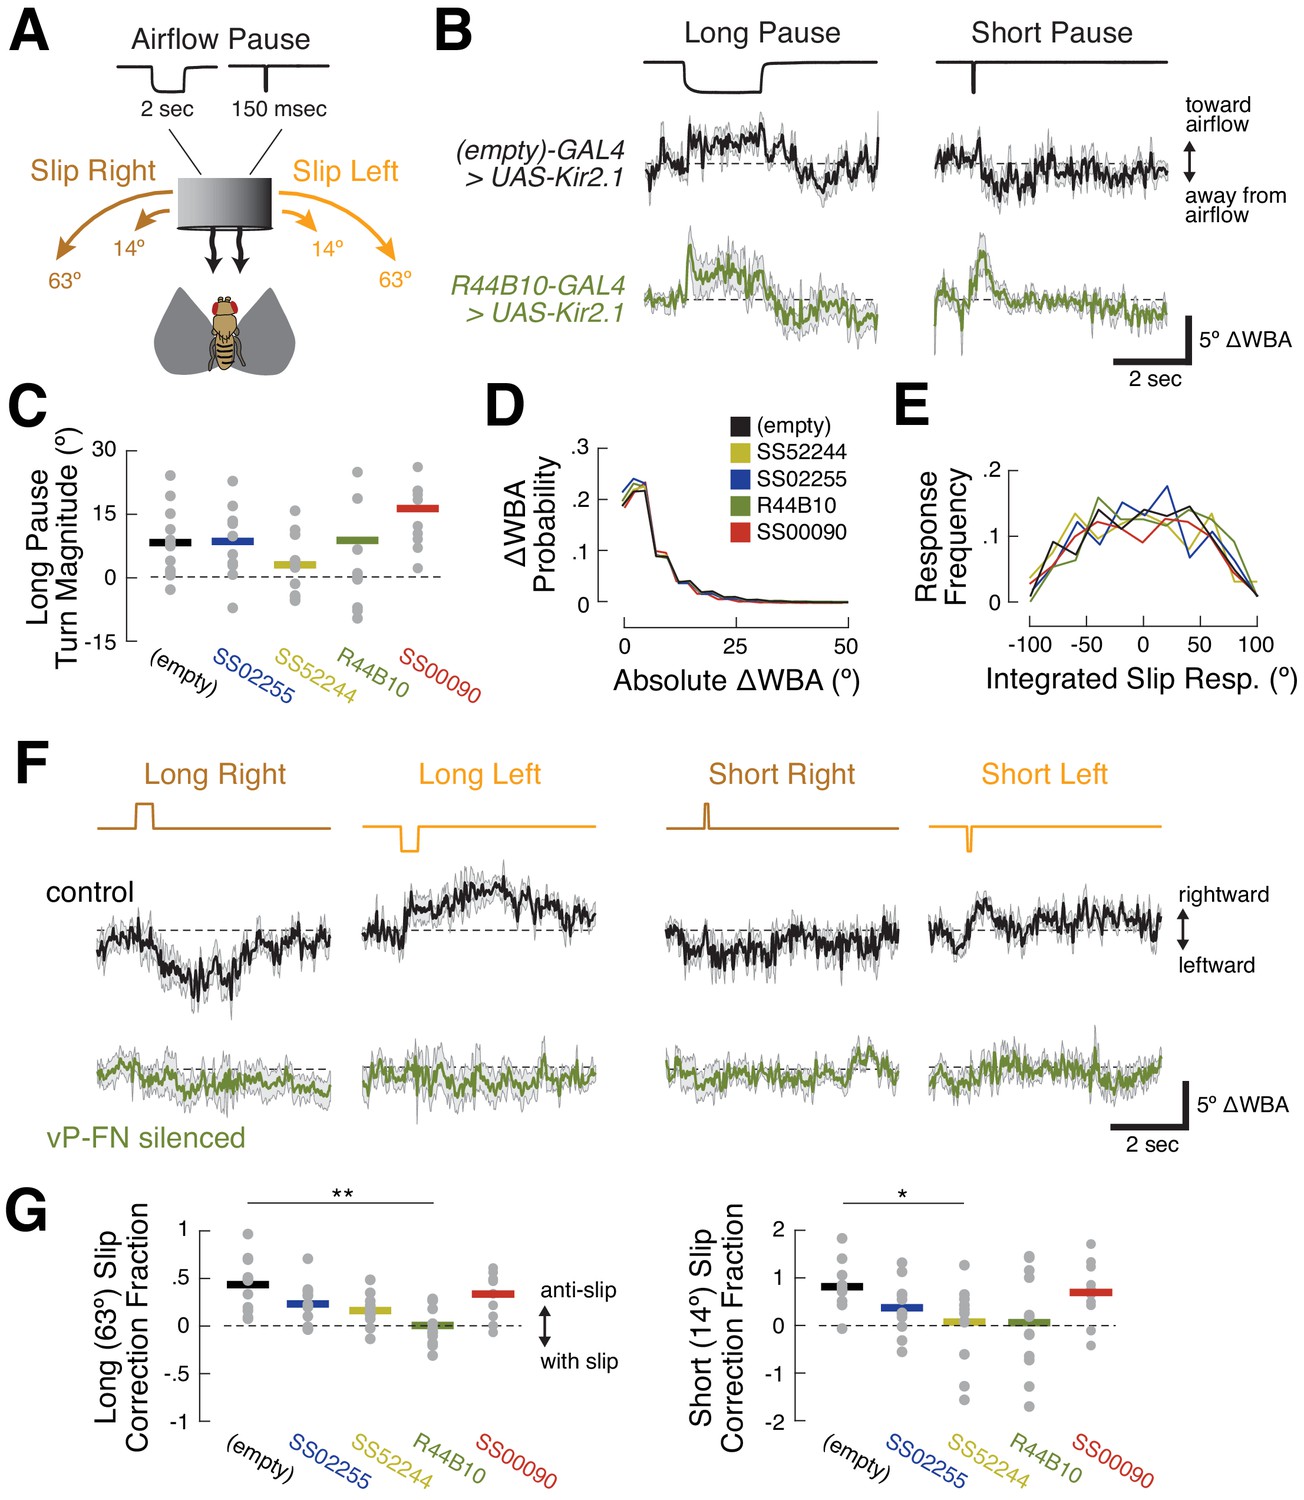
(A) Stimulus manipulations. Six manipulations were presented pseudo-randomly every 20 s during closed-loop flight: long wind pause (2 s); short wind pause (150 msec); short (14.44°) and long (63.36°) rightward slip of virtual orientation; and short and long leftward slip of virtual orientation. Slip velocity was 144 °/sec. (B) Responses to long and short airflow pauses in control flies (empty-GAL4>UAS-Kir2.1, black) and ventral P-FN-silenced flies (R44B10-GAL4>UAS-Kir2.1, dark green). Traces show mean +/- SEM difference in wingbeat angles (ΔWBA), a proxy for intended turning, for 120 trials across 12 files (10 repetitions per fly). In this plot, positive ΔWBA values indicate turns toward the airflow source and negative ΔWBA values indicate turns away from the airflow source. Dashed line represents no turning. (C) Mean ΔWBA (integrated over 2 s) in response to a long airflow pause for each fly (gray dots) of each genotype. Horizontal bars indicate cross-fly means. Positive ΔWBA values represent turns toward the airflow source. All groups are statistically indistinguishable by rank-sum test. (D) Probability distributions of ΔWBA values for control (black), P-F1N3-silenced (gold), P-F2N3-silenced (dark blue), all ventral P-FN-silenced (dark green), and E-PG silenced (red) flies. The distributions are statistically indistinguishable by KS-test. (E) Probability distributions of integrated slip responses for each genotype (colors as in (D)). Slip responses are integrated over 5 s of slip stimulus, with both leftward (negative) and rightward (positive) slips included. The distributions are statistically indistinguishable by KS-test. (F) Responses to orientation slips in ventral P-FN-silenced flies (R44B10-GAL4>UAS-Kir2.1, dark green) and control flies (empty-GAL4>UAS-Kir2.1, black). Each trace represents the mean +/- SEM of 120 trials across 12 files (10 repetitions per fly). In this plot, positive ΔWBA values indicate rightward turns and negative ΔWBA values indicate leftward turns. Traces show cross-fly mean +/- SEM with colors as in (B). (G) Fraction of slip displacement corrected by each fly (gray dots) of each genotype in response to long (left) and short (right) slips. Values represent mean integrated slip response divided by negative slip magnitude. Positive values indicate ‘corrective’ turns in the opposite direction of the slip. A correction fraction of 1 indicates that a fly steered the airflow direction to be identical before and after a slip trial. Note differing Y-axis scales for each plot. *p<0.05; **p<0.01 (rank-sum test).
Figure 8

Airflow-representing circuits in the CX.
Airflow direction is transduced via antennal deflection signals (purple), which are transmitted through the AMMC and Wedge to the LAL (Yorozu et al., 2009; Suver et al., 2019; Okubo et al., 2020). A recent study Okubo et al., 2020 found that bilateral antennal deflection signals in the LAL are transmitted to the EB via ring neurons (R1, dark red). R1 neurons are required for formation of an airflow ‘compass’ in E-PG neurons (light red), which represent all possible airflow directions across CX columns. In this study, we showed that LNa neurons (dark blue, one per side) are preferentially excited by ipsilateral airflow. LNa neurons carry airflow information from the LAL to the third comparment of the ipsilateral NO (Wolff and Rubin, 2018). Ventral P-FNs with cell bodies in one hemisphere each receive input in the third compartment of the contralateral NO. Consistent with this anatomy, ventral P-FNs (light blue) represent airflow from only two directions (appx. 45° to the left and right of midline) across CX columns. Thus, airflow information encoded in the LAL appears to be routed to two different parts of the CX, where it contributes both to a heading compass representation in the EB, and a basis vector representation in the FB.
Tables
Table 1
Intrinsic properties of surveyed neuron types.
| Cell type | Driver line | N | Resting potential (mV) | Input resistance (GΩ) | Osc. freq. (Hz) |
|---|---|---|---|---|---|
| P-F1N3 | SS52244 | 6 | −18.0 ± 1.0 | 6.21 ± 0.52 | 4 |
| P-F2N3 | SS02255 | 6 | −22.0 ± 1.3 | 4.86 ± 0.50 | 2 |
| P-F3N2d | SS00078 | 14 | −30.9 ± 0.9 | 2.58 ± 0.24 | - |
| P-F3N2v | SS52577 | 4 | −31.8 ± 3.5 | 6.00 ± 0.50 | - |
| P-EN1 | SS54295 | 4 | −32.9 ± 2.1 | 2.52 ± 0.29 | 3 |
| P-EN2 | R12D09 | 6 | −30.1 ± 1.9 | 3.30 ± 0.29 | 3 |
| P-F3LC | SS02239 | 8 | −39.7 ± 0.8 | 2.75 ± 1.11 | - |
| P-F3-5R | SS54549 | 6 | −26.3 ± 1.3 | 7.89 ± 0.51 | - |
| E-PG | SS00090 | 4 | −29.4 ± 1.5 | 2.30 ± 0.35 | - |
-
Resting potential, input resistance, and characteristic oscillatory frequency are shown for each recorded cell type. Values represent the cross-fly mean +/- SEM. See also Figure 1—figure supplement 1.
Key resources table
| Reagent type (species) or resource | Designation | Source or reference | Identifiers | Additional information |
|---|---|---|---|---|
| Genetic reagent (D. melanogaster) | SS52244-GAL4 | Bloomington Drosophila Stock Center | RRID:BDSC_86596 | |
| Genetic reagent (D. melanogaster) | SS02255-GAL4 | Bloomington Drosophila Stock Center | RRID:BDSC_75923 | |
| Genetic reagent (D. melanogaster) | SS00078-GAL4 | Bloomington Drosophila Stock Center | RRID:BDSC_75854 | |
| Genetic reagent (D. melanogaster) | SS52577-GAL4 | Bloomington Drosophila Stock Center | RRID:BDSC_86625 | |
| Genetic reagent (D. melanogaster) | SS54295-GAL4 | Bloomington Drosophila Stock Center | RRID:BDSC_86624 | |
| Genetic reagent (D. melanogaster) | SS02239-GAL4 | Bloomington Drosophila Stock Center | RRID:BDSC_75926 | |
| Genetic reagent (D. melanogaster) | SS54549-GAL4 | Bloomington Drosophila Stock Center | RRID:BDSC_86603 | |
| Genetic reagent (D. melanogaster) | SS47432-GAL4 | Bloomington Drosophila Stock Center | RRID:BDSC_86716 | |
| Genetic reagent (D. melanogaster) | R12D09-GAL4 | Bloomington Drosophila Stock Center | RRID:BDSC_48503 | |
| Genetic reagent (D. melanogaster) | R44B10-GAL4 | Bloomington Drosophila Stock Center | RRID:BDSC_50202 | |
| Genetic reagent (D. melanogaster) | (empty)-GAL4 | Bloomington Drosophila Stock Center | RRID:BDSC_68384 | |
| Genetic reagent (D. melanogaster) | 10xUAS-IVS-syn21-GFP-p10 (attP2) | Michael Dickinson | N/A | |
| Genetic reagent (D. melanogaster) | 13xUAS-Kir2.1-eGFP/TM3 | Michael Reiser | N/A | |
| Genetic reagent (D. melanogaster) | 20xUAS-GCaMP6f | Bloomington Drosophila Stock Center | RRID:BDSC_42747 | |
| Genetic reagent (D. melanogaster) | UAS-tdTomato | Bloomington Drosophila Stock Center | RRID:BDSC_36328 | |
| Antibody | (mouse monoclonal) anti-NC82 | Developmental Studies Hybridoma Bank | RRID:AB_2314866 | (1:50) |
| Antibody | (chicken polyclonal) anti-GFP | Thermo Fisher Scientific | PA1-9533 | (1:50) |
| Antibody | streptavidin Alexa Fluor 568 | Thermo Fisher Scientific | S-11226 | (1:1000) |
| Antibody | (goat polyclonal) anti-mouse Alexa Fluor 633 | Thermo Fisher Scientific | A-21052 | (1:250) |
| Antibody | (goat polyclonal) anti-chicken Alexa Fluor 488 | Thermo Fisher Scientific | A-11039 | (1:250) |
Additional files
Download links
A two-part list of links to download the article, or parts of the article, in various formats.
Downloads (link to download the article as PDF)
Open citations (links to open the citations from this article in various online reference manager services)
Cite this article (links to download the citations from this article in formats compatible with various reference manager tools)
Encoding and control of orientation to airflow by a set of Drosophila fan-shaped body neurons
eLife 9:e61510.
https://doi.org/10.7554/eLife.61510


