Increased influence of prior choices on perceptual decisions in autism
- Gonda Multidisciplinary Brain Research Center, Bar Ilan University, Israel
- The Autism Center/ALUT, Shamir Medical Center, Israel
- Sackler Faculty of Medicine, Tel Aviv University, Israel
Figures
Figure 1
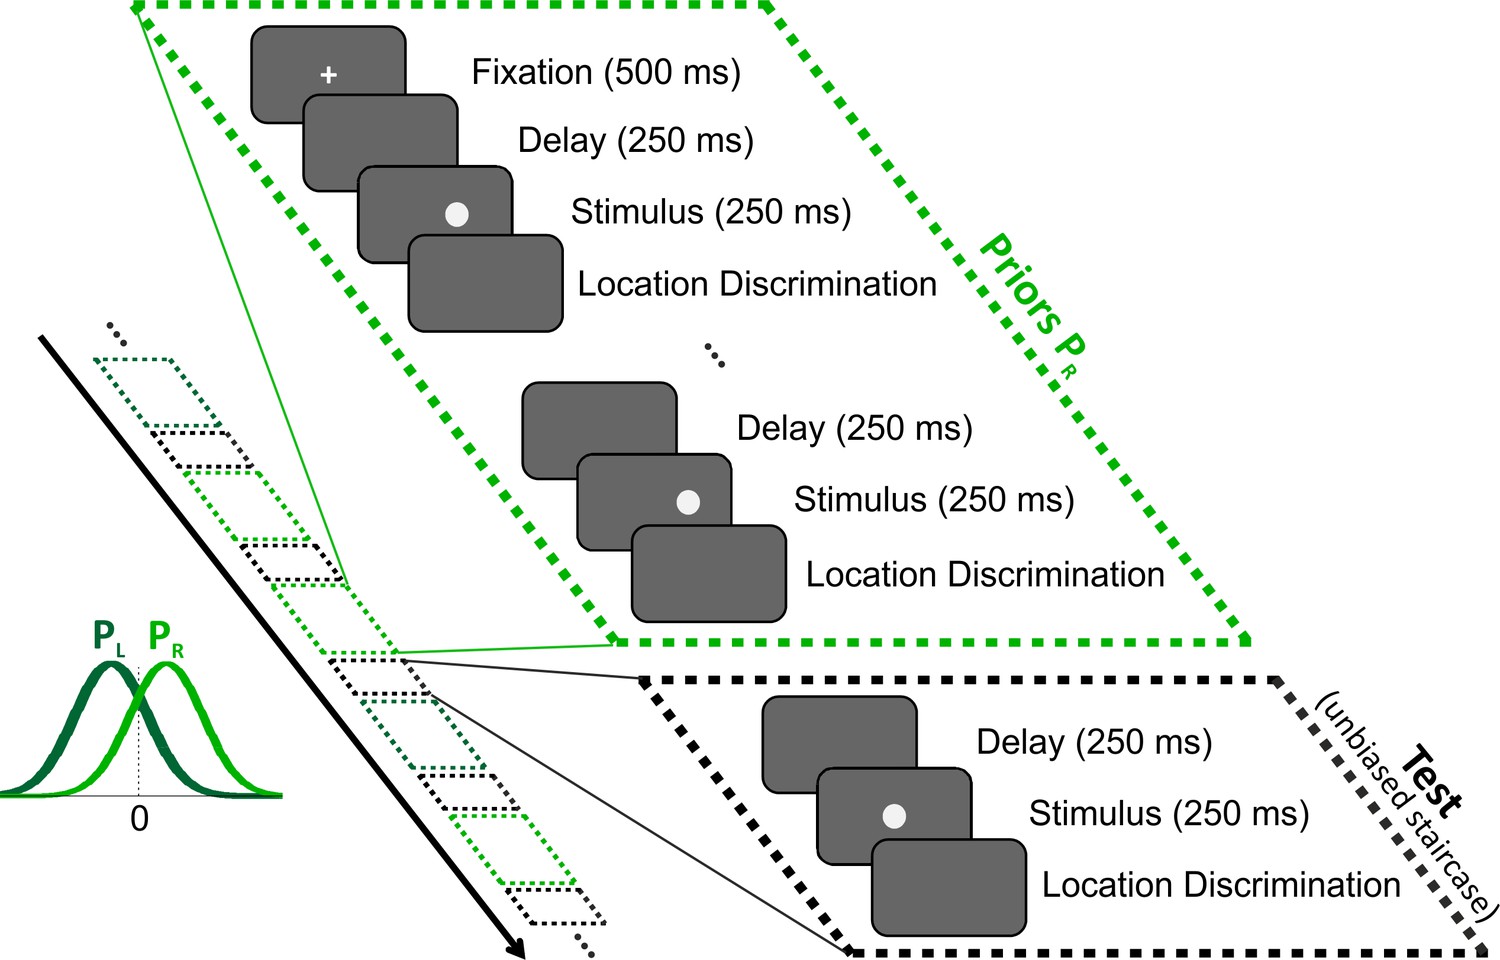
Location discrimination – event sequence within and across trials.
All stimuli (filled circles) were discriminated according to location, that is, whether the circle lay to the left or to the right of the screen center (2AFC). Each trial comprised a series of stimuli and discriminations that began with a fixation point (at the screen center), followed by a series of ‘prior’ stimuli biased to the right (light green) or left (dark green), and then by a single (unbiased) ‘test’ stimulus. The black arrow marks the timecourse across trials, which interleaved trials with right and left prior types (light and dark green dashed boxes, respectively) pseudorandomly, each ending with a test stimulus (black dashed boxes). Prior circle locations were drawn from a normal distribution either biased to the right or left of the screen center (light and dark green probability distributions, PR and PL, respectively). Test circle locations followed an unbiased staircase procedure.
Figure 2 with 1 supplement
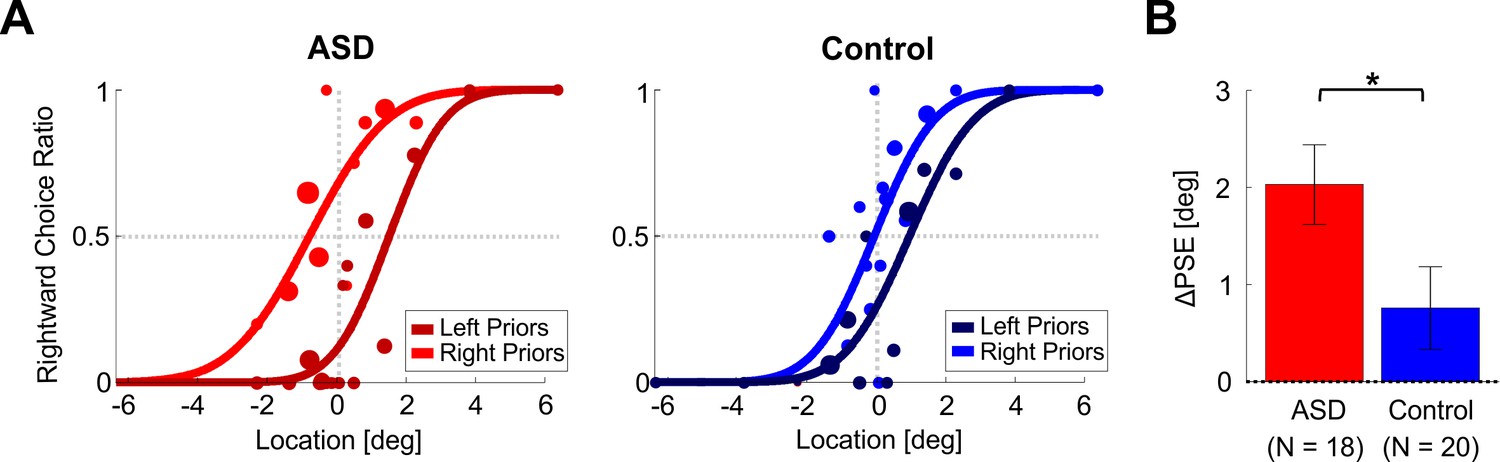
Location discrimination – psychometric function shifts.
(A) Psychometric curves for an example participant with ASD (left plot) and an example control participant (right plot) performing location discrimination. The psychometric curves represent the ratio of rightward choices as a function of stimulus location, sorted according to the prior type (left or right bias, represented by dark and light colors, respectively). The data (circles) were fit with cumulative Gaussian distribution functions (solid lines). Circle size reflects the number of trials for a given stimulus location and prior type. (B) PSE shifts (ΔPSE = PSE for left biased priors minus PSE for right biased prior). Red and blue bars represent ΔPSEs (mean ± SEM) for participants with ASD and controls, respectively. *p < 0.05.
Figure 2—figure supplement 1
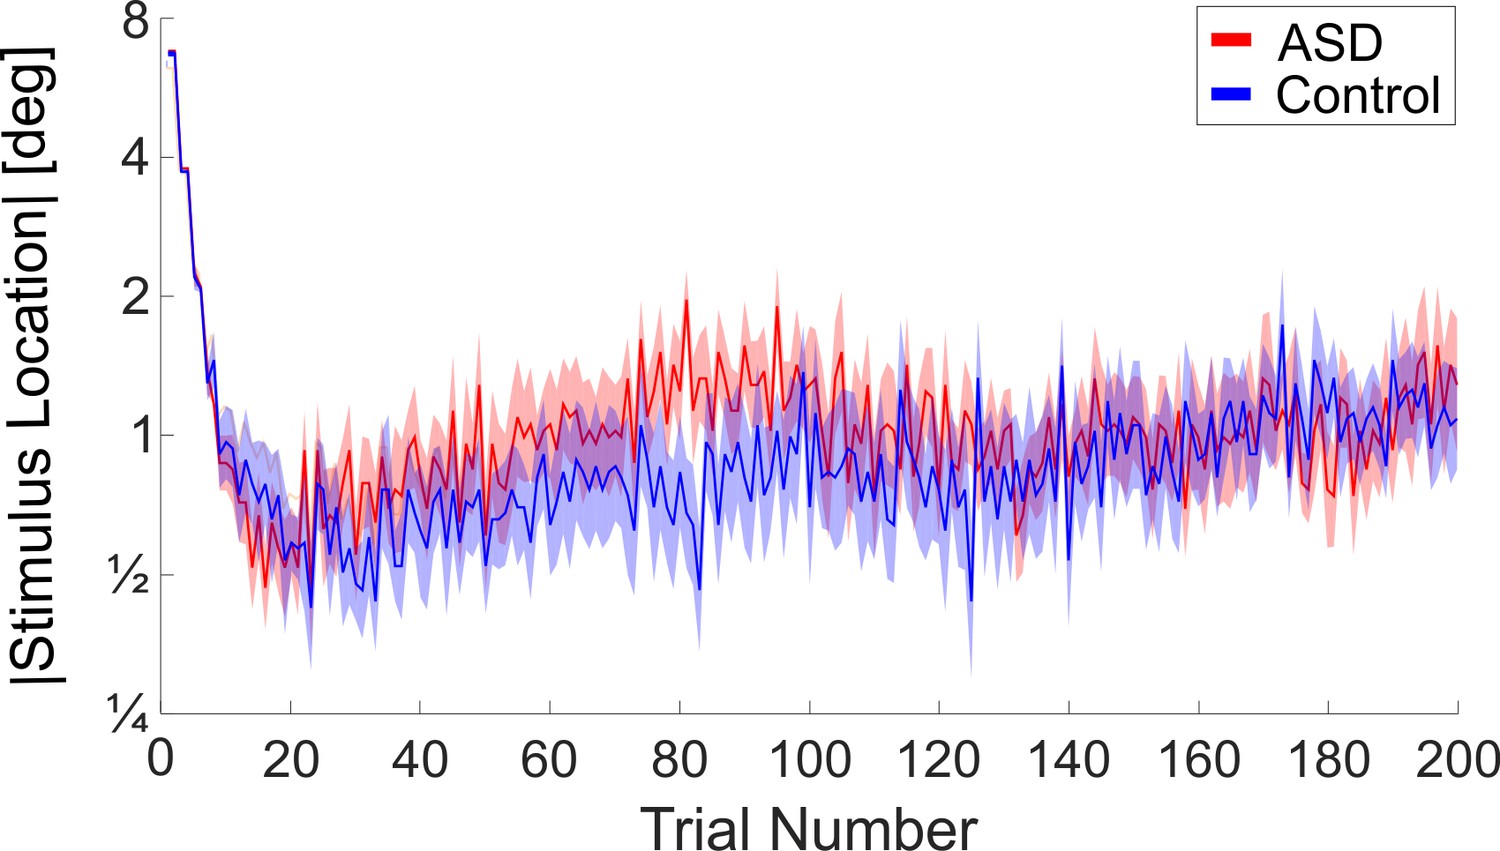
Test stimulus convergence for the location discrimination experiment, primary condition.
Magnitude (absolute value) of the ‘test’ circle location as a function of trial number. Red and blue lines (bands) represent mean stimulus location (± SEM) for the ASD and control participants, respectively.
Figure 3
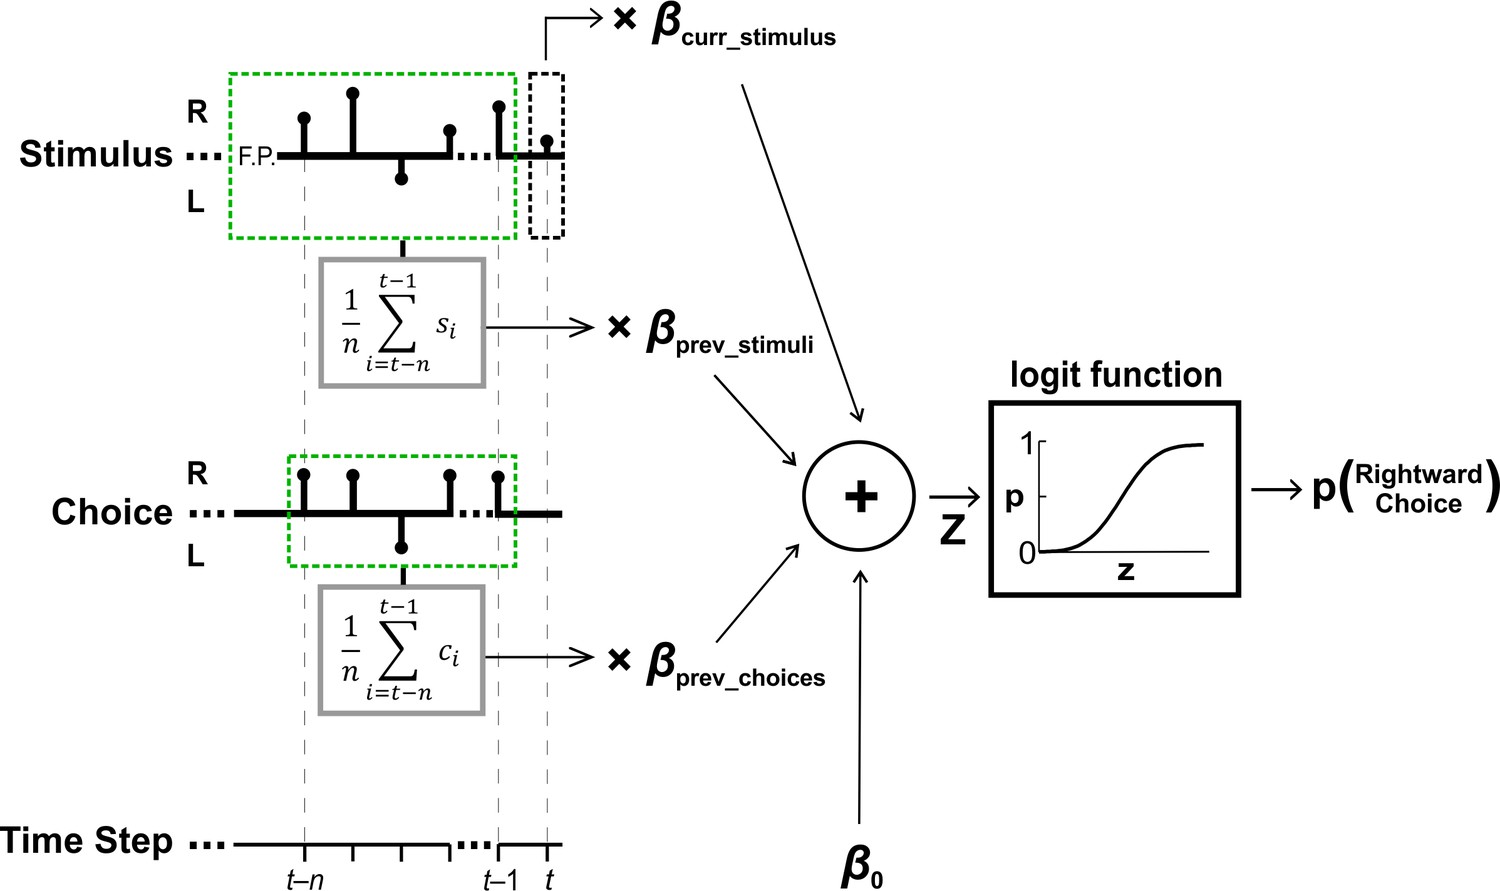
Perceptual decision model schematic.
Perceptual choices were modeled using a logistic regression with four factors (providing their respective fitted beta coefficients): (i) the current stimulus (βcurr_stimulus), (ii) previous stimuli (βprev_stimuli), (iii) previous choices (βprev_choices) and (iv) baseline bias (β0). Black stems on the stimulus and choice axes depict the stimuli (s) and choices (c) for an example trial (indexed by time step), with a test stimulus at time t (black dashed box) and prior stimuli and choices n steps back (light green dashed boxes). The sum of the product of the factors with their respective beta coefficients (z) is passed through a logistic function to yield the probability of making a rightward choice in response to the current (test) stimulus at time t.
Figure 4 with 2 supplements
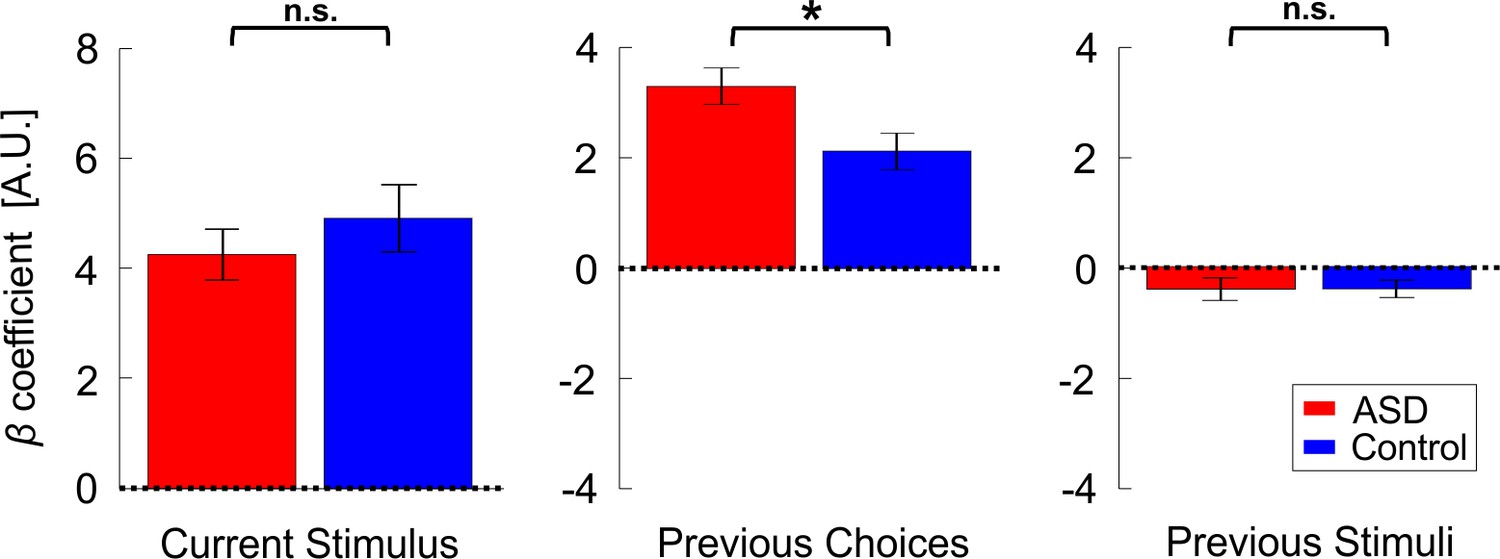
Location discrimination (primary condition) – model parameters.
Beta coefficients for model parameters: current stimulus, previous choices and previous stimuli (left, center, and right plots, respectively). Red and blue bars represent the values (mean ± SEM) for participants with ASD and controls, respectively. *p <0.05, n.s. – not significant.
Figure 4—figure supplement 1
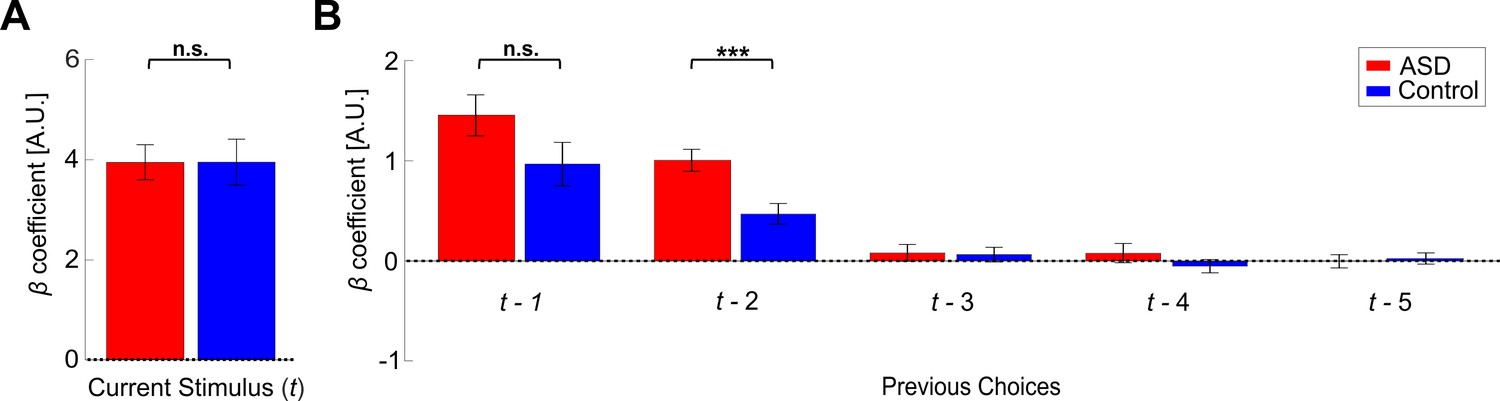
Location discrimination (primary condition) – five choices back model parameters.
Current stimulus (A) and previous choices (B) beta coefficients (mean ± SEM) for the ASD (red) and control (blue) participants. The prior choice at t-1 immediately precedes the current choice (at t). ***p = 0.004, n.s. – not significant.
Figure 4—figure supplement 2
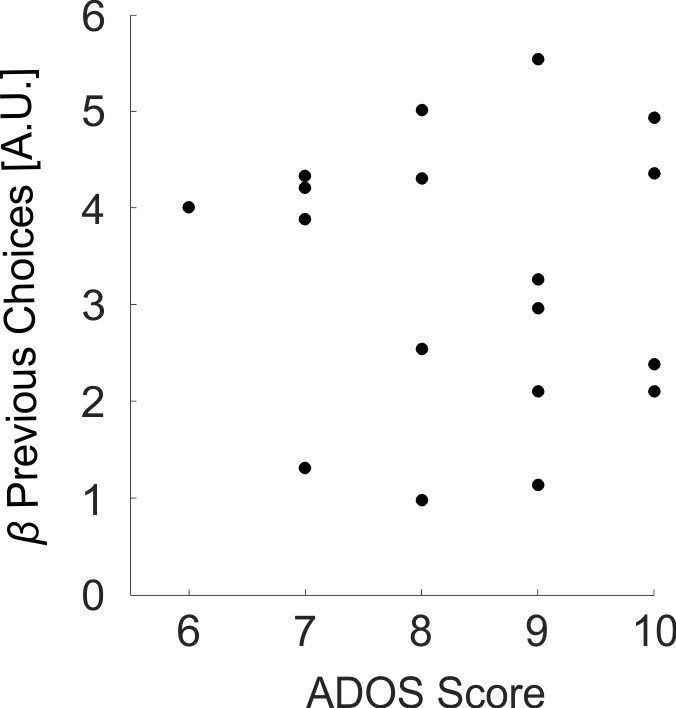
Scatter of βprev_choices coefficients (primary condition) vs. ADOS scores.
Each data point represents one ASD participant.
Figure 5 with 1 supplement
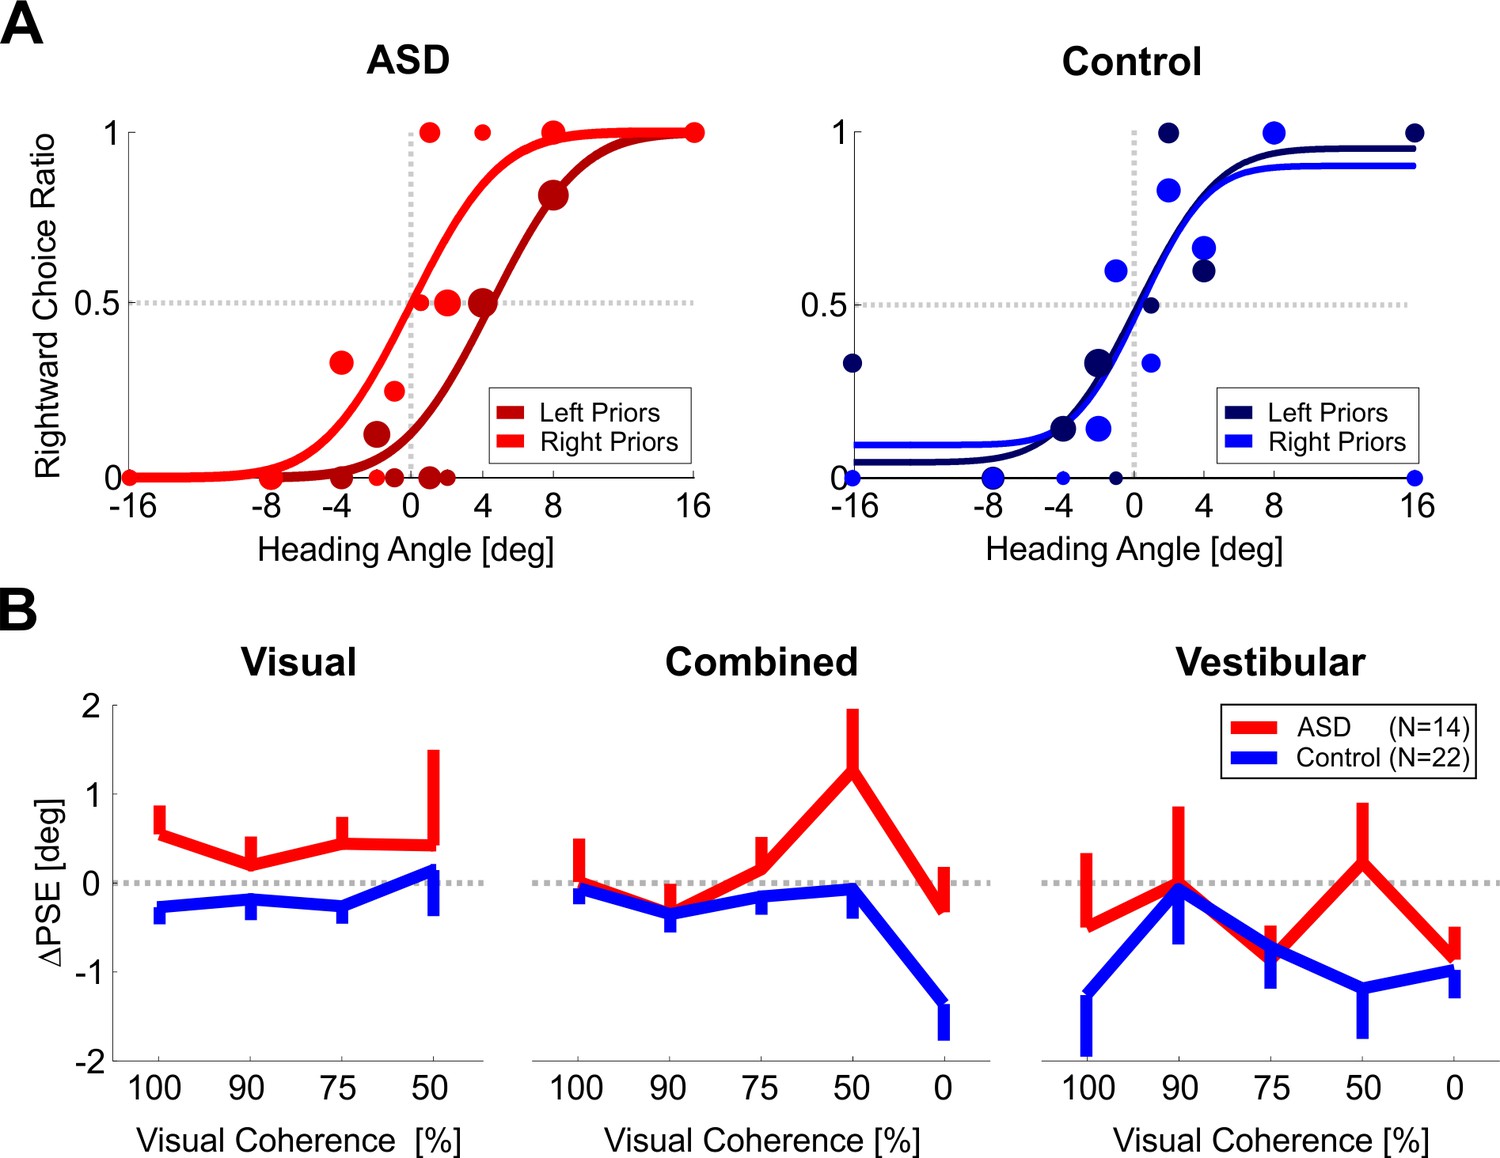
Heading discrimination – psychometric function shifts.
(A) Psychometric curves for an example participant with ASD (left plot) and an example control participant (right plot) performing heading discrimination (visual condition, with 50% coherence). The psychometric curves represent the ratio of rightward choices as a function of heading, sorted according to the prior type (left or right bias, represented by dark and light colors, respectively). The data (circles) were fit with cumulative Gaussian distribution functions (solid lines). Circle size reflects the number of trials for a given stimulus heading and prior type. (B) PSE shifts (ΔPSE = PSE for left biased priors minus PSE for right biased prior) for three stimulus conditions: visual, vestibular and combined cues (left, right, and center plots, respectively). Red and blue lines represent ΔPSEs (mean ± SEM) as a function of visual coherence for participants with ASD and controls, respectively. Overall, PSE shifts are significantly higher in ASD than in controls (p = 0.040).
Figure 5—figure supplement 1
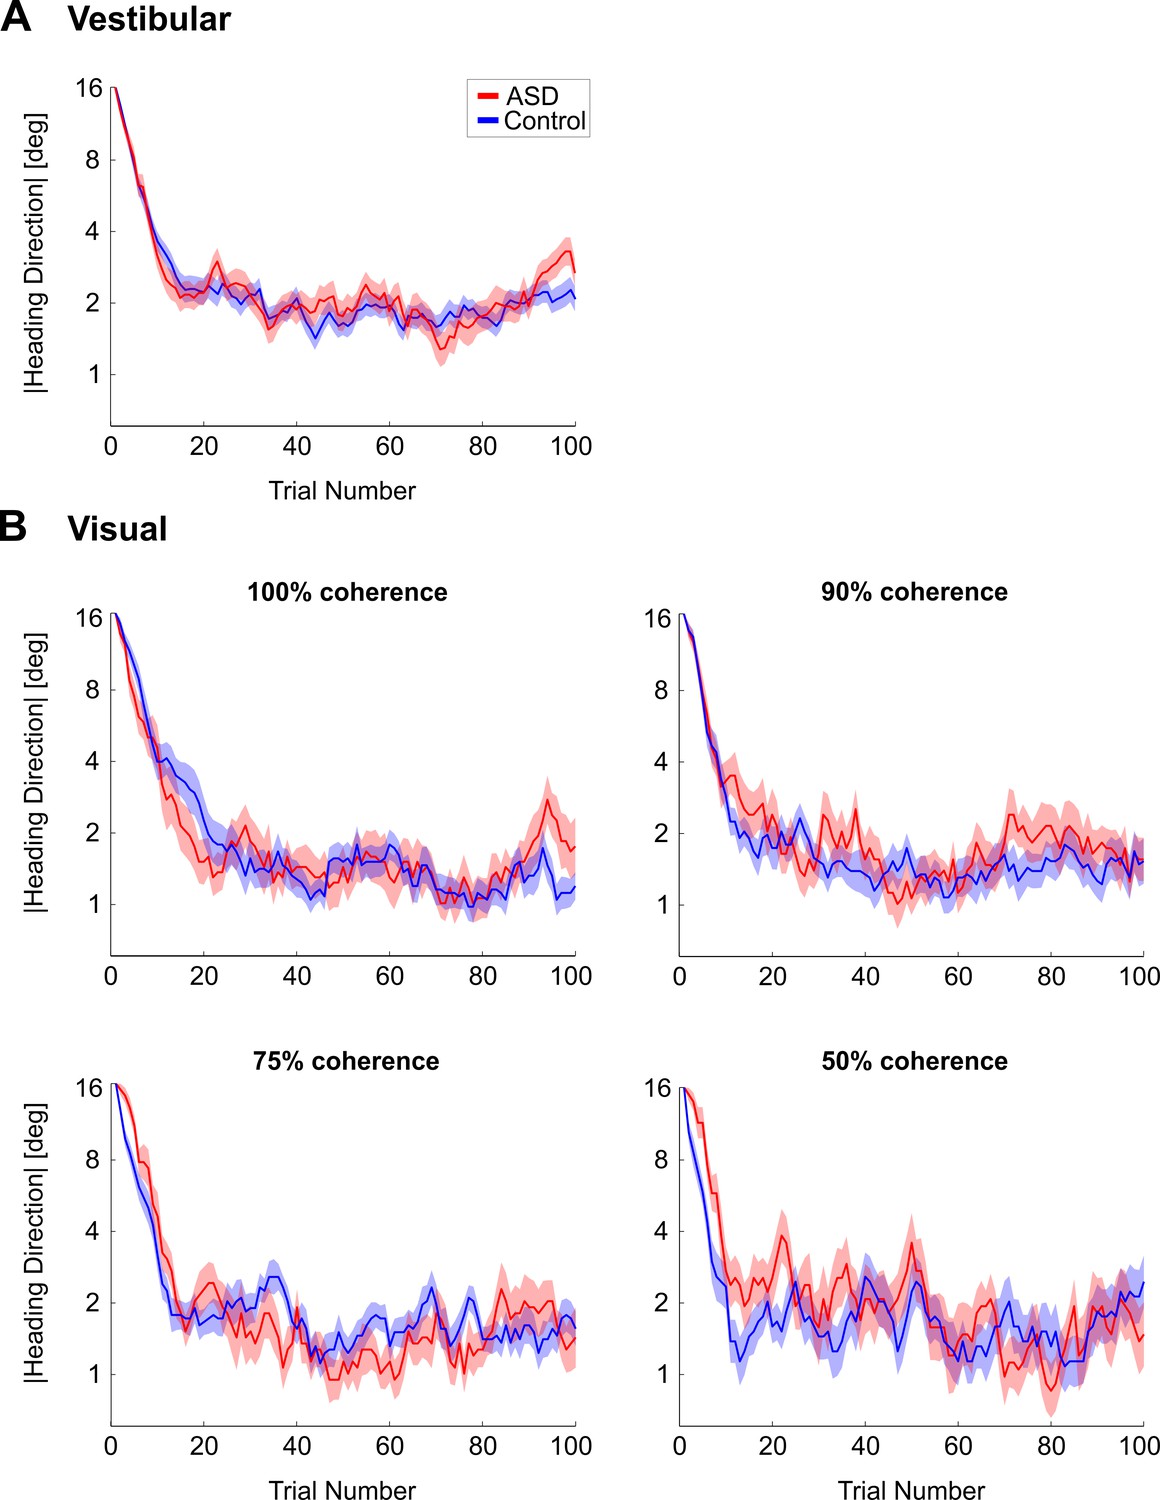
Stimulus convergence for the heading discrimination experiment.
Stimulus heading direction (absolute value) as a function of trial number for (A) vestibular and (B) visual trials (with different coherence levels). Red and blue lines (bands) represent the mean (± SEM) values for ASD and control participants, respectively.
Figure 6
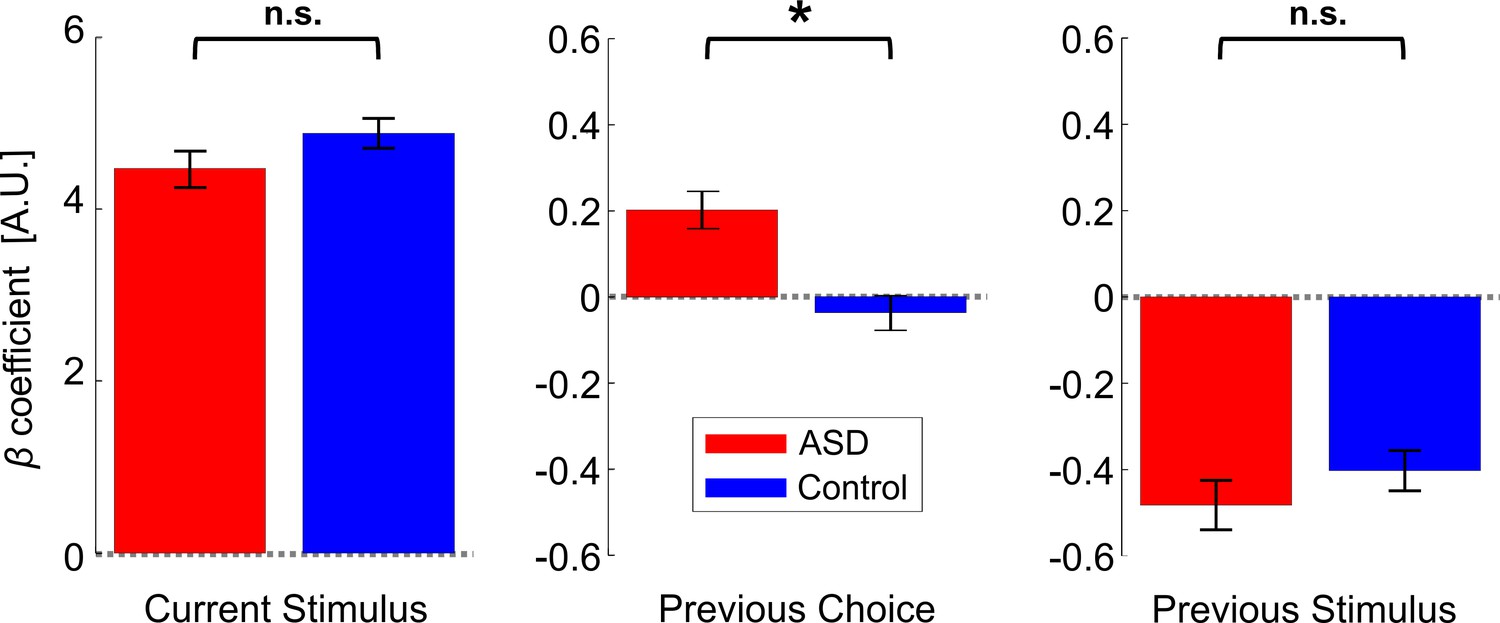
Heading discrimination – model parameters.
Beta coefficients for three model parameters: current stimulus, previous choice and previous stimulus (left, center, and right plots, respectively). These were averaged over three stimulus conditions (vestibular, visual, and combined) and five visual coherence levels. Red and blue bars represent the beta coefficients (mean ± SEM) for participants with ASD and controls, respectively. *p < 0.05, n.s. – not significant.
Figure 7 with 2 supplements
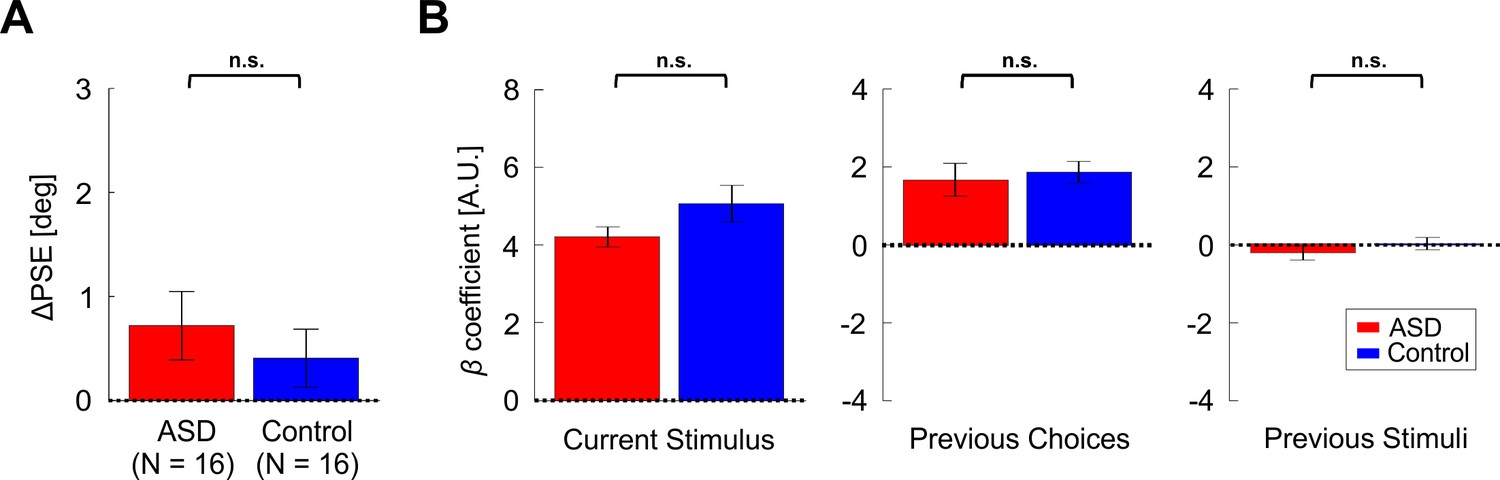
Results for the Response Invariant location discrimination condition.
(A) PSE shifts (ΔPSE = PSE for left biased priors minus PSE for right biased prior). Red and blue bars represent ΔPSEs (mean ± SEM) for participants with ASD and controls, respectively. (B) Beta coefficients for three model parameters: current stimulus, previous choices and previous stimuli (left, center, and right plots, respectively). Red and blue bars represent the beta coefficients (mean ± SEM) for participants with ASD and controls, respectively. n.s. – not significant.
Figure 7—figure supplement 1
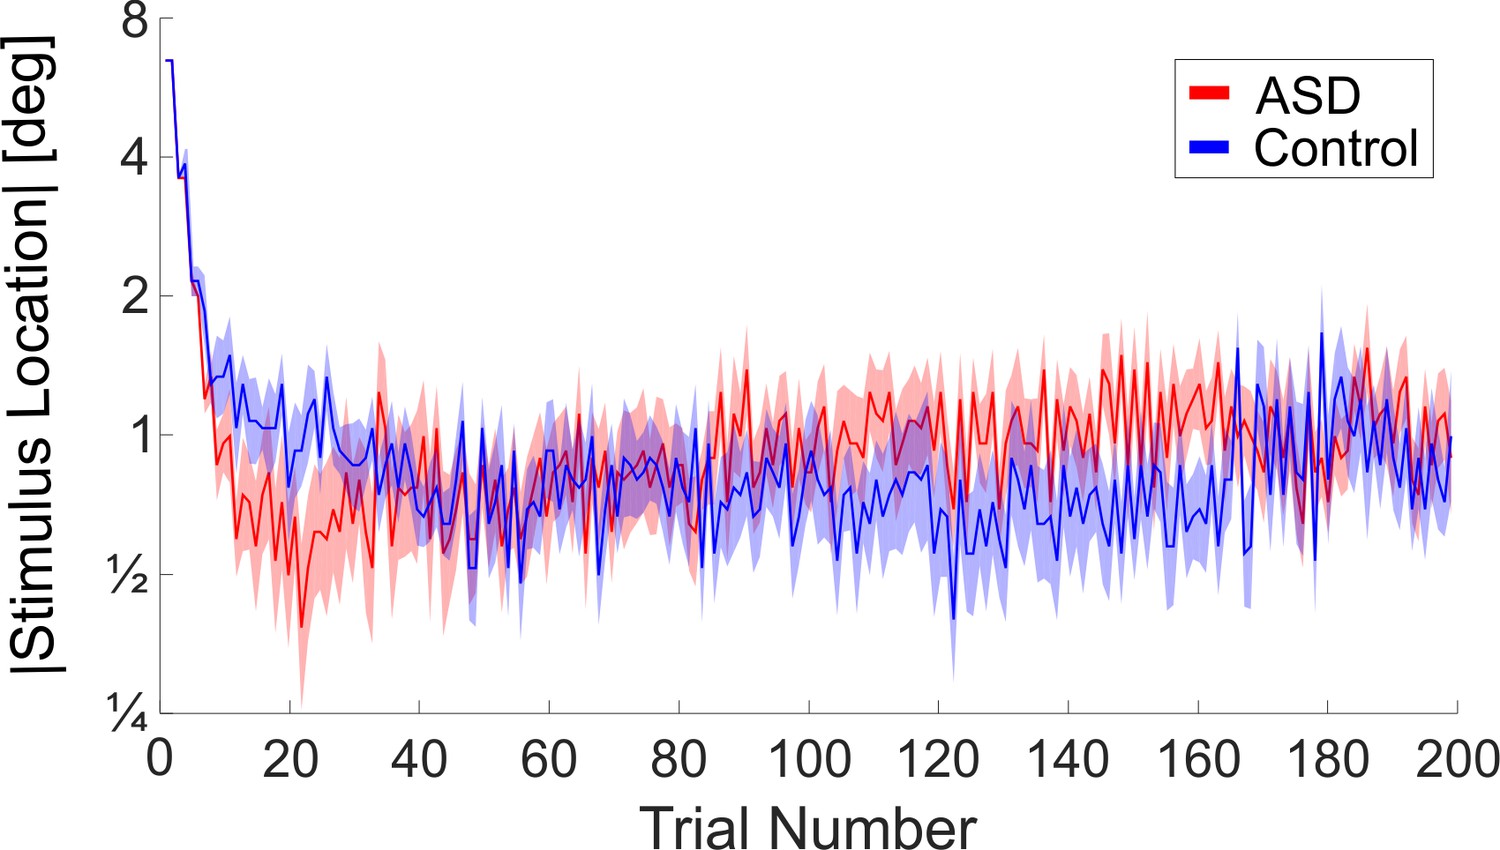
Test stimulus convergence for the location discrimination experiment, Response Invariant condition.
Magnitude (absolute value) of the ‘test’ circle location as a function of trial number. Red and blue lines (bands) represent mean stimulus location (± SEM) for the ASD and control participants, respectively.
Figure 7—figure supplement 2
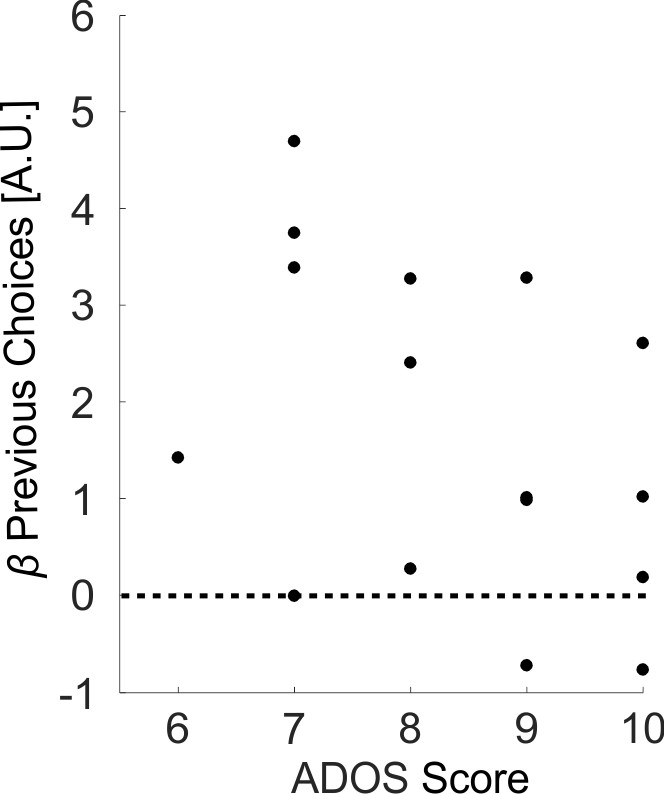
Scatter of βprev_choices coefficients (Response Invariant condition) vs. ADOS scores.
Each data point represents one ASD participant. The dashed line marks y = 0.
Tables
Table 1
ASD participant details.
| ASD participant number | Age | SCQ | IQ – WISC IV | ADOS | ADI-R | |||||||
|---|---|---|---|---|---|---|---|---|---|---|---|---|
| Block-Design | Matrix-Reasoning | Vocabulary | Similarities | Calibrated Severity Score | Social Affect | RRB | Reciprocal Social Interaction | Communication | RRB | |||
| 1 | 8 | 17 | 7 | 9 | 10 | 9 | 9 | 7 | 7 | 13 | 11 | 5 |
| 2 | 9 | 17 | 11 | 9 | 9 | 8 | 9 | 10 | 10 | 27 | 14 | 6 |
| 3 | 10 | 21 | 13 | 16 | 13 | 13 | 8 | 8 | 8 | 10 | 13 | 1 |
| 4 | 10 | 14 | 12 | 13 | 10 | 16 | 9 | 9 | 9 | 11 | 8 | 5 |
| 5 | 10 | 11 | 9 | 7 | 7 | 7 | 9 | 9 | 9 | 12 | 12 | 2 |
| 6 | 11 | 21 | 11 | 10 | 7 | 10 | 8 | 7 | 7 | 13 | 15 | 10 |
| 7 | 11 | 15 | 7 | 11 | 8 | 7 | 8 | 8 | 8 | 11 | 11 | 5 |
| 8 | 11 | 19 | 12 | 13 | 10 | 16 | 7 | 7 | 7 | 17 | 13 | 5 |
| 9 | 11 | 22 | 12 | 9 | 11 | 10 | 7 | 10 | 10 | 23 | 19 | 7 |
| 10 | 12 | 13 | 15 | 13 | 12 | 10 | 9 | 8 | 8 | 11 | 8 | 3 |
| 11 | 12 | 29 | 10 | 12 | 7 | 8 | 7 | 7 | 7 | 20 | 19 | 4 |
| 12 | 13 | 22 | 8 | 7 | 11 | 8 | 10 | 10 | 10 | 14 | 9 | 9 |
| 13 | 13 | 12 | 7 | 10 | 8 | 10 | 10 | 9 | 9 | 23 | 11 | 4 |
| 14 | 14 | 19 | 15 | 9 | 15 | 17 | 10 | 9 | 9 | 20 | 14 | 8 |
| 15 | 14 | 14 | 14 | 9 | 12 | 15 | 7 | 5 | 5 | 11 | 7 | 5 |
| 16 | 15 | 18 | 7 | 9 | 10 | 9 | 6 | 6 | 6 | 8 | 4 | 5 |
| 17 | 16 | 30 | 13 | 9 | 11 | 12 | 8 | 6 | 6 | 13 | 13 | 8 |
| 18 | 17 | 22 | 9 | 11 | 8 | 10 | 10 | 10 | 10 | 11 | 5 | 6 |
| Mean ± SD | 12.1 ± 2.4 | 18.7 ± 5.3 | 10.7 ± 2.8 | 10.3 ± 2.3 | 9.9 ± 2.2 | 10.8 ± 3.2 | 8.4 ± 1.2 | 8.1 ± 1.6 | 8.1 ± 1.6 | 14.9 ± 5.4 | 11.4 ± 4.2 | 5.4 ± 2.3 |
-
SCQ scores are current from the time of the study. Other scores are from within 0–5 years of the study. RRB - Restricted and Repetitive Behaviors.
Table 2
Control participant details.
| Control participant number | Age | SCQ | IQ – WISC IV | |||
|---|---|---|---|---|---|---|
| Block-Design | Matrix-Reasoning | Vocabulary | Similarities | |||
| 1 | 8 | 5 | 14 | 10 | 18 | 12 |
| 2 | 9 | 1 | 14 | 10 | 15 | 10 |
| 3 | 9 | 1 | 13 | 13 | 17 | 14 |
| 4 | 9 | 1 | 13 | 14 | 14 | 15 |
| 5 | 10 | 1 | 11 | 10 | 10 | 12 |
| 6 | 11 | 1 | 9 | 15 | 15 | 8 |
| 7 | 11 | 3 | 10 | 8 | 9 | 10 |
| 8 | 12 | 10 | 6 | 11 | 10 | 9 |
| 9 | 12 | 1 | 12 | 7 | 8 | 9 |
| 10 | 12 | 1 | 9 | 8 | 11 | 9 |
| 11 | 13 | 3 | 14 | 12 | 13 | 18 |
| 12 | 13 | 0 | 5 | 8 | 8 | 9 |
| 13 | 13 | 8 | 14 | 17 | 11 | 16 |
| 14 | 14 | 3 | 10 | 15 | 8 | 13 |
| 15 | 15 | 0 | 10 | 14 | 12 | 13 |
| 16 | 15 | 5 | 12 | 16 | 9 | 7 |
| 17 | 15 | 7 | 13 | 16 | 12 | 15 |
| 18 | 16 | 2 | 14 | 14 | 8 | 11 |
| 19 | 16 | 3 | 8 | 8 | 9 | 9 |
| 20 | 16 | 2 | 11 | 10 | 5 | 11 |
| Mean ± SD | 12.5 ± 2.6 | 2.9 ± 2.8 | 11.1 ± 2.7 | 11.8 ± 3.2 | 11.1 ± 3.4 | 11.5 ± 3.0 |
-
IQ and SCQ scores are current from the time of the study.
Additional files
Download links
A two-part list of links to download the article, or parts of the article, in various formats.
Downloads (link to download the article as PDF)
Open citations (links to open the citations from this article in various online reference manager services)
Cite this article (links to download the citations from this article in formats compatible with various reference manager tools)
Increased influence of prior choices on perceptual decisions in autism
eLife 10:e61595.
https://doi.org/10.7554/eLife.61595


