Stimulus-induced gamma rhythms are weaker in human elderly with mild cognitive impairment and Alzheimer’s disease
- Centre for Neuroscience, Indian Institute of Science, India
- MS Ramaiah Medical College & Memorial Hospital, India
- National Institute of Mental Health and Neurosciences, India
Figures
Figure 1 with 1 supplement
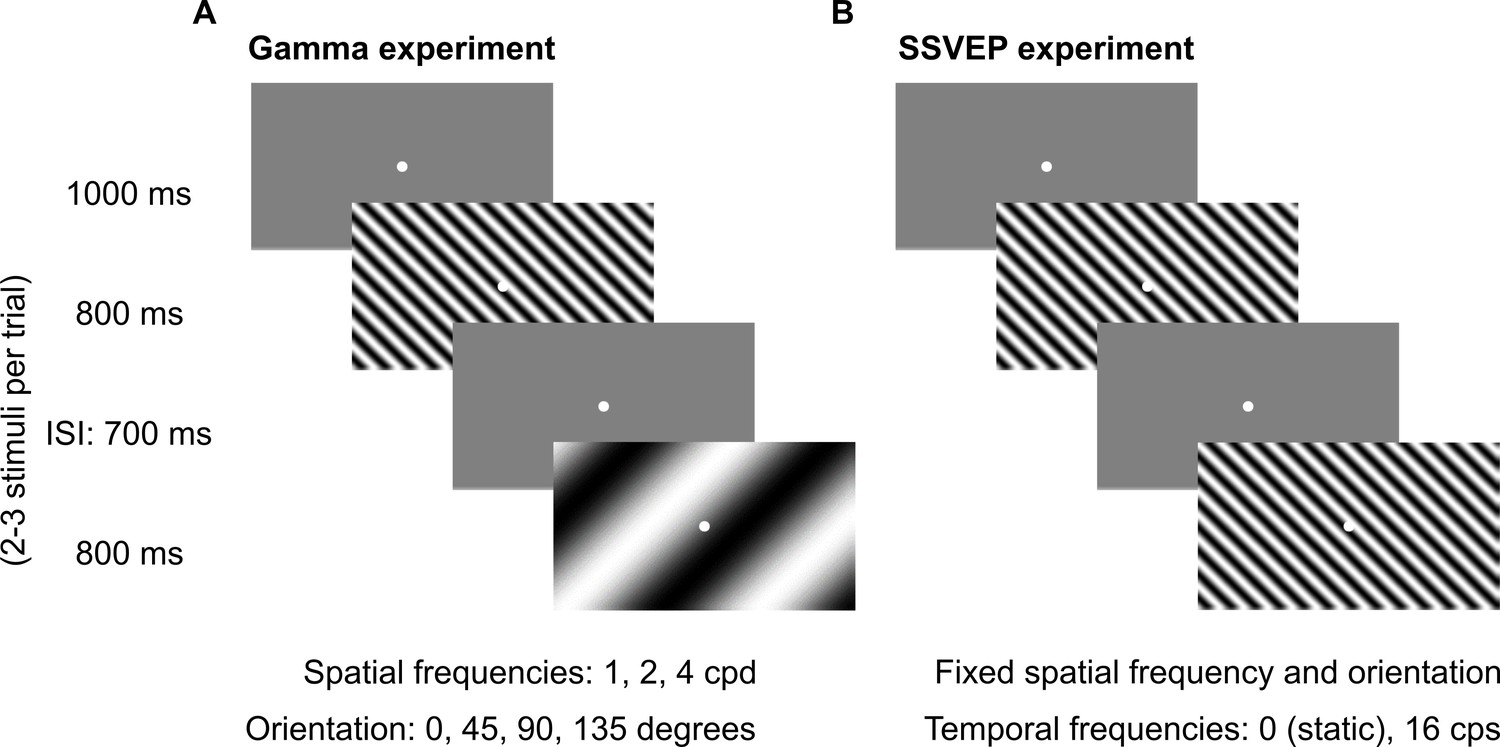
Fixation task.
Every trial started with the onset of a fixation spot (0.1°) at the center of the screen on which the subjects had to maintain fixation. After an initial blank period of 1000 ms (gray screen), 2–3 stimuli were randomly shown for 800 ms. These consisted of sinusoidal luminance gratings presented full screen at full contrast. Inter-stimulus interval (ISI) was 700 ms. Each stimulus (of a particular combination of spatial frequency, temporal frequency, and orientation) was presented for a total of ~30–40 times according to the subjects’ comfort and willingness, and is referred to as a ‘stimulus repeat’ in this paper unless otherwise stated. (A) Gamma experiment: static gratings (temporal frequency = 0 Hz) were presented at three spatial frequencies (SFs): 1, 2, and 4 cycles per degree (cpd) and four orientations: 0°, 45°, 90°, and 135°. This experiment lasted for ~25 min, with 1–2 short breaks (for 3–5 min) between blocks. (B) SSVEP experiment: gratings were randomly presented at a temporal frequency of 0 (static) or 16 cycles per second (cps). SF and orientation combination of gratings was fixed across the experiment. This was the combination that showed high change in slow and fast gamma power for each subject during preliminary analysis performed during the session. This experiment followed Gamma experiment during the same session and lasted for ~5 min completed in one block.
Figure 1—figure supplement 1
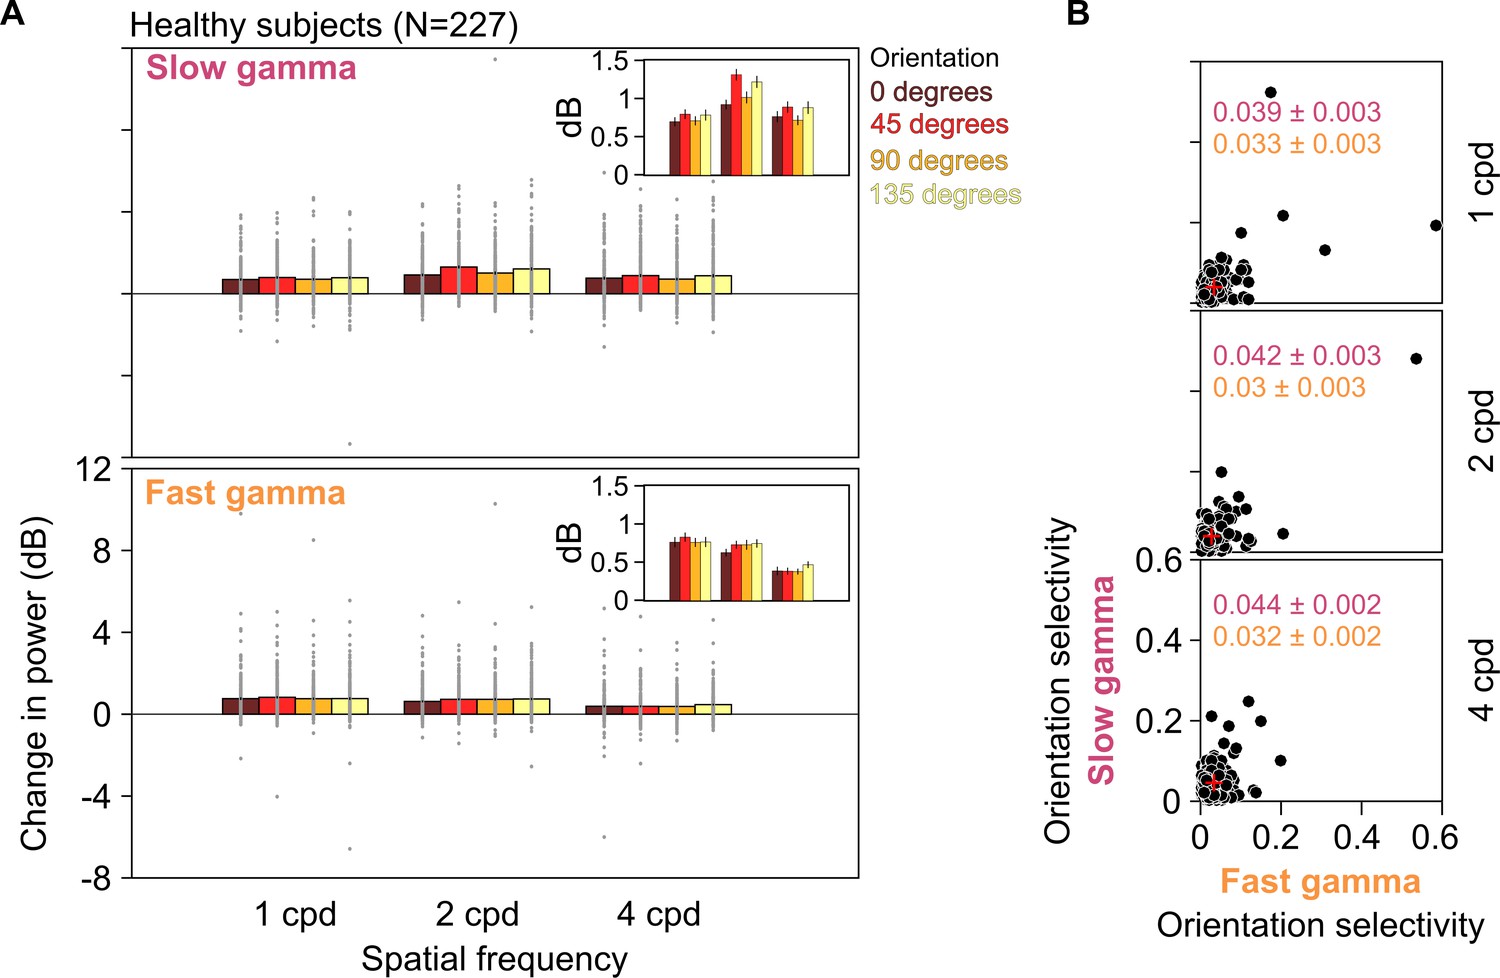
Slow and fast gamma for different orientations and spatial frequencies in healthy subjects.
(A) Stimulus-induced change in slow (top row) and fast (bottom row) gamma power for three spatial frequencies (1, 2, and 4 cpd) and four orientations (0°, 45°, 90°, and 135°). Gray dots represent data for each of the 227 healthy subjects. SEM is indicated as black vertical lines on the bars. Because of a large variability in gamma power across subjects, the SEMs are barely visible. Therefore, for clarity, we have plotted these means and SEM (error bars) separately in the insets. We statistically quantified differences in these means across orientations using one-way ANOVA at each spatial frequency. We found that these were not significant for any gamma at any spatial frequency, except for slow gamma at 2 cpd (for slow gamma, 1/2/4 cpd: F(3,904) = 0.63/5.81/1.37, p=0.59/0.0006/0.25; for fast gamma, 1/2/4 cpd: F(3,904) = 0.27/0.96/0.83, p=0.84/0.41/0.48). Specifically, for 2 cpd, change in slow gamma power was 0.92 ± 0.06, 1.31 ± 0.07, 1.01 ± 0.08, and 1.21 ± 0.08 dB (mean ± SEM) for 0°, 45°, 90°, and 135° orientations, respectively, as seen in the insets. (B) Scatter plots showing orientation selectivity for slow gamma (on ordinate) and fast gamma (on abscissa) for 227 healthy subjects at 1, 2, and 4 cpd (top, middle, and bottom rows). Mean ± SEM orientation selectivity for slow and fast gamma are mentioned in the plots in pink and orange, respectively. Mean orientation selectivity is also indicated as a red cross in the plots.
Figure 2 with 4 supplements

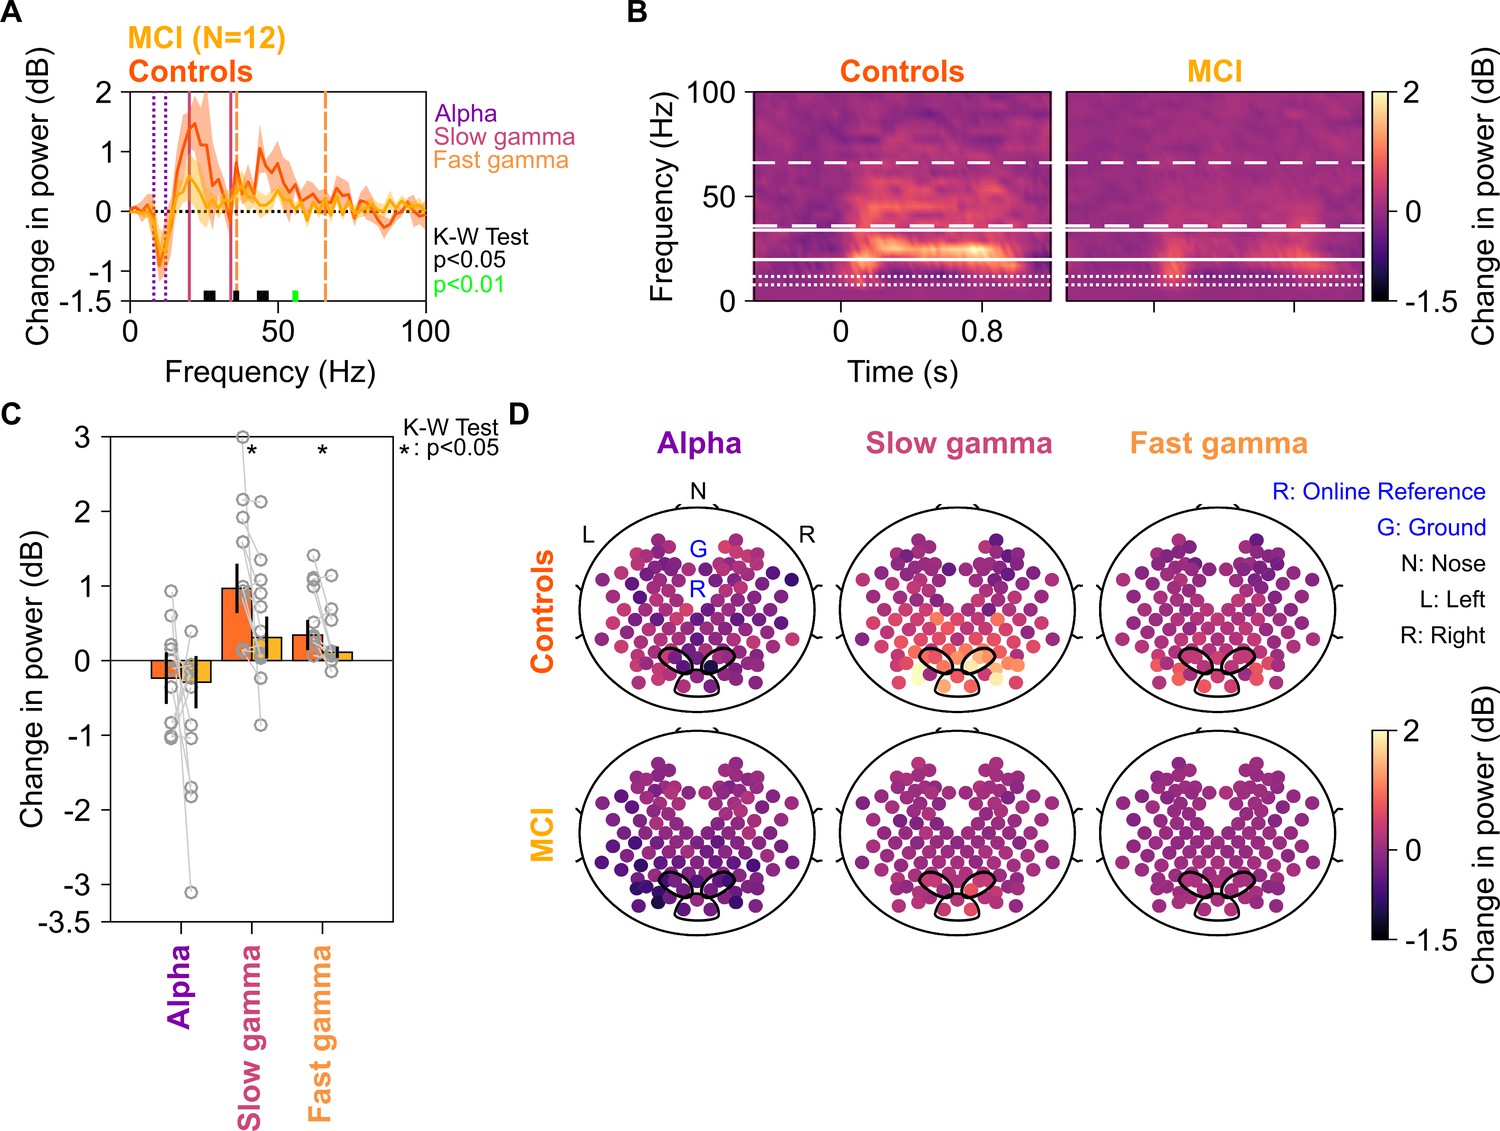
Alpha, slow, and fast gamma in mild cognitive impairments (MCIs) and controls.
(A) Change in power spectral densities (PSD) for 12 MCI subjects and their respective controls. Solid traces indicate median PSD across 12 MCIs (yellow) and median of mean PSDs for 12 sets of healthy controls (dark orange). Shaded regions indicate ± SD from medians after bootstrapping over 10,000 iterations. Vertical lines represent alpha (8–12 Hz, violet), slow (20–34 Hz, pink), and fast gamma (36–66 Hz, orange). Colored bars at the bottom represent significance of differences in medians (K-W test, black: p=0.01–0.05, green: p<0.01; not corrected for multiple comparisons). (B) Median change in power spectrograms for MCIs (right) and controls (left). White horizontal lines represent alpha (dotted), slow gamma (solid), and fast gamma (dashed) bands. (C) Median change in power in alpha, slow gamma, and fast gamma bands for MCIs (yellow) and controls (dark orange). Data of individual MCI and mean for their respective controls are represented as gray circles. Error bars indicate ± SD from medians after bootstrapping over 10,000 iterations. Black asterisks represent significance of differences in medians (K-W test, p<0.05, not Bonferroni-corrected). (D) Average scalp maps of 112 bipolar electrodes (disks) for cases (bottom row) and controls (top row) for alpha (left), slow gamma (middle), and fast gamma (right). Color of disks represents change in power in respective frequency bands. Electrode groups used for calculation of band-limited power are enclosed in black.
Figure 2—figure supplement 1

Time-frequency change in power spectrograms for MCI compared to their corresponding controls.
Change in power spectrograms for individual MCIs plotted in right column and mean spectrograms across their respective healthy controls in left column. The spectrograms are arranged by the differences in total gamma power (slow + fast, change from baseline in dB) for each MCI case and their respective age- and gender-matched controls, highest difference plotted first. Age, gender, labels of cases, and number of matched controls (N) are noted on spectrograms. White horizontal lines represent alpha (dotted), slow gamma (solid), and fast gamma (dashed) bands. Out of 12 MCI cases, only 3 (M9, M11-12) had higher slow gamma and 2 (M10, M12) had higher fast gamma than their controls. For the rest, MCI subjects had lower slow and fast gamma power than the median power for their healthy controls.
Figure 2—figure supplement 2
Alpha, slow, and fast gamma in MCI subjects and fewer controls.
Same format as in Figure 2, but only one control per MCI has been considered for analysis. Both slow and fast gamma were significantly reduced (slow gamma: K-W test, χ2(23) = 4.09, p=0.043; fast gamma: χ2(23) = 4.09, p=0.043), but not alpha (χ2(23) = 1.33, p=0.24). Similar results were obtained for N = 4 controls per case (the minimum number of controls that we had per case; slow gamma: K-W test, χ2(23) = 3.86, p=0.05; fast gamma: χ2(23) = 6.17, p=0.013; alpha: χ2(23) = 0.4, p=0.52; data not shown).
Figure 2—figure supplement 3
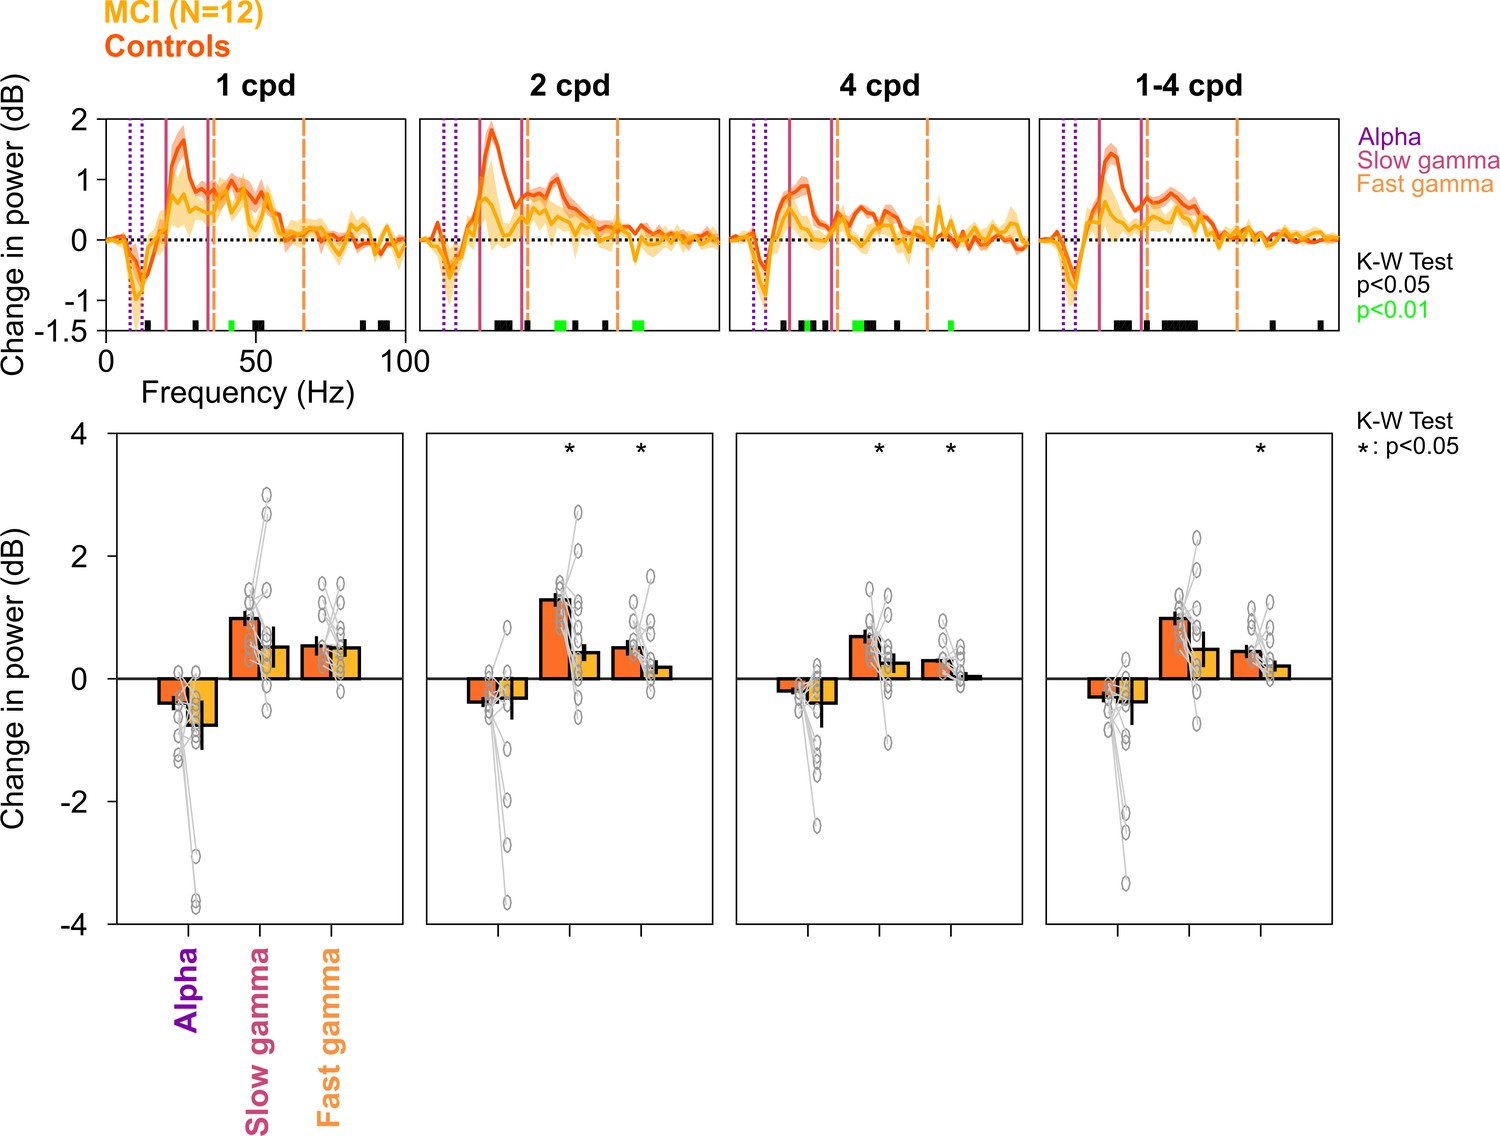
Alpha, slow, and fast gamma in MCI subjects and controls across different spatial frequencies.
Top row: Stimulus-induced change in PSDs for different spatial frequencies (mentioned above the top row, cpd: cycles per degree). Bottom row: Change in power in alpha, slow gamma, and fast gamma bands. Same format as in Figure 2A and C. PSDs and change in power values were calculated separately for each of the 12 spatial frequency/orientation combinations and were averaged across all four orientations for each spatial frequency. For rightmost column (1–4 cpd), PSDs and change in power values for each spatial frequency (averaged across orientations) were averaged. Although the PSDs and change in slow/fast gamma power were lower in MCIs compared to controls, the effect was more prominent for 2 and 4 cpd conditions (K-W test; values at different frequencies are indicated below PSDs; for bar plots: χ2(23) = 1.47/0.01/0.48, p=0.23/0.91/0.49 for alpha, χ2(23) = 1.08/4.33/5.08, p=0.30/0.037/0.024 for slow gamma, and χ2(23) = 0.96/5.89/5.61, p=0.33/0.015/0.018 for fast gamma, for 1/2/4 cpd, respectively; for 1–4 cpd condition, χ2(23) = 1.08, p=0.30 for alpha, χ2(23) = 3, p=0.08 for slow gamma, and χ2(23) = 5.89, p=0.015 for fast gamma).
Figure 2—figure supplement 4
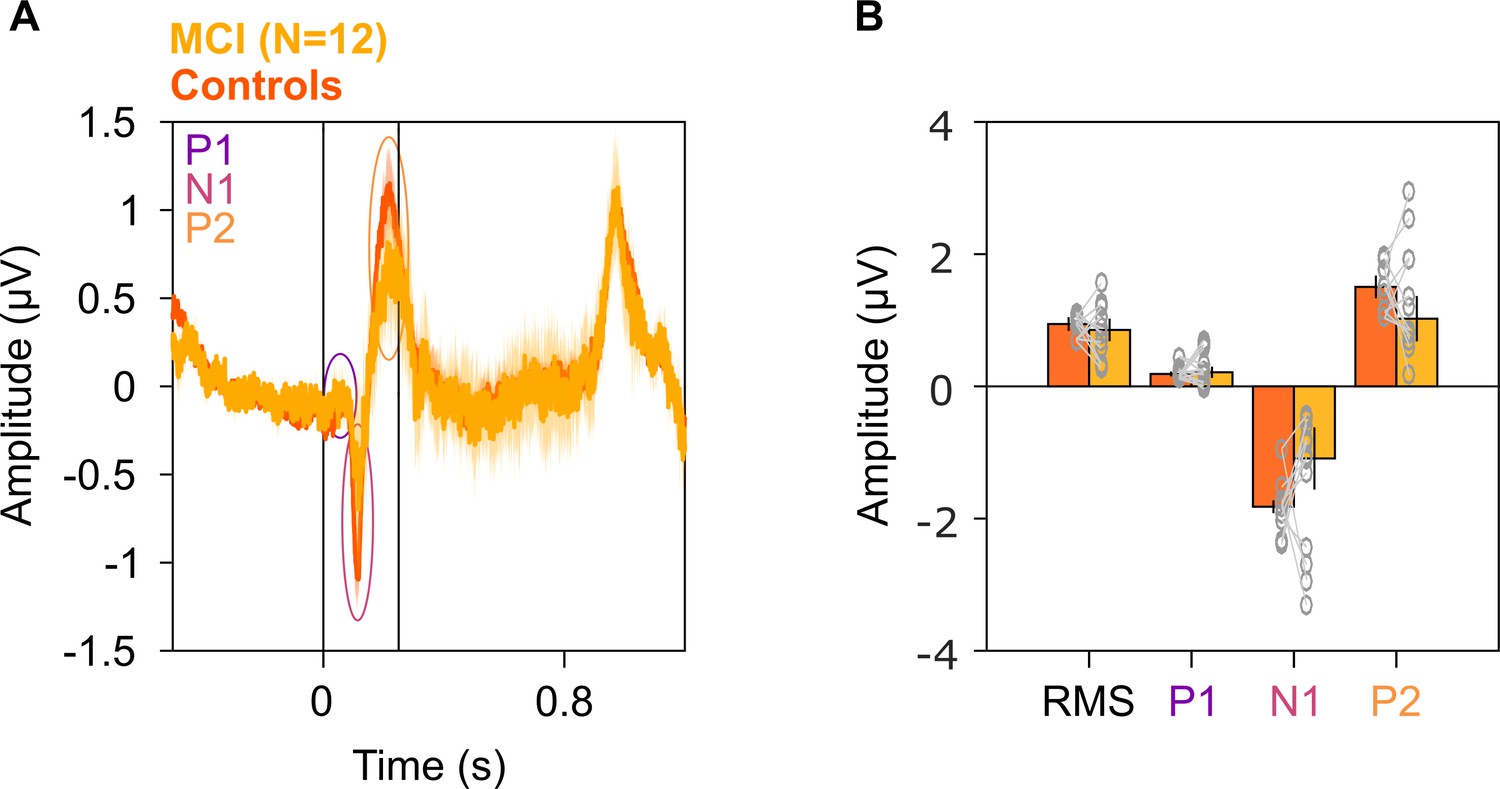
Evoked potentials in MCIs and healthy controls.
(A) Solid traces indicate median evoked potentials across 12 MCIs (yellow) and median of mean traces for 12 sets of healthy controls (dark orange). Shaded regions indicate ± SD from medians after bootstrapping over 10,000 iterations. Vertical lines represent 0–250 ms of stimulus onset. P1, N1, and P2 peaks are represented in colored ovals (violet, pink, and orange, respectively). We did not find any significant difference in the evoked potentials at any time point (K-W test, p>0.05 at all time points). (B) Median amplitudes of root mean square (RMS) values in 0–250 ms, P1, N1, and P2 peaks for MCIs (yellow) and controls (dark orange). Data of individual MCI and mean for their respective controls are represented as gray circles. Error bars indicate ± SD from medians after bootstrapping over 10,000 iterations. None of these medians were different in the MCI and control groups (K-W test, RMS: χ2(23) = 0.12, p=0.79; P1: χ2(23) = 0.03, p=0.86; N1: χ2(23) = 1.08, p=0.30; P2: χ2(23) = 1.2, p=0.27).
Figure 3 with 3 supplements

Alpha, slow, and fast gamma in AD subjects and controls.
Same format as in Figure 2, but for five AD subjects and their respective controls.
Figure 3—figure supplement 1
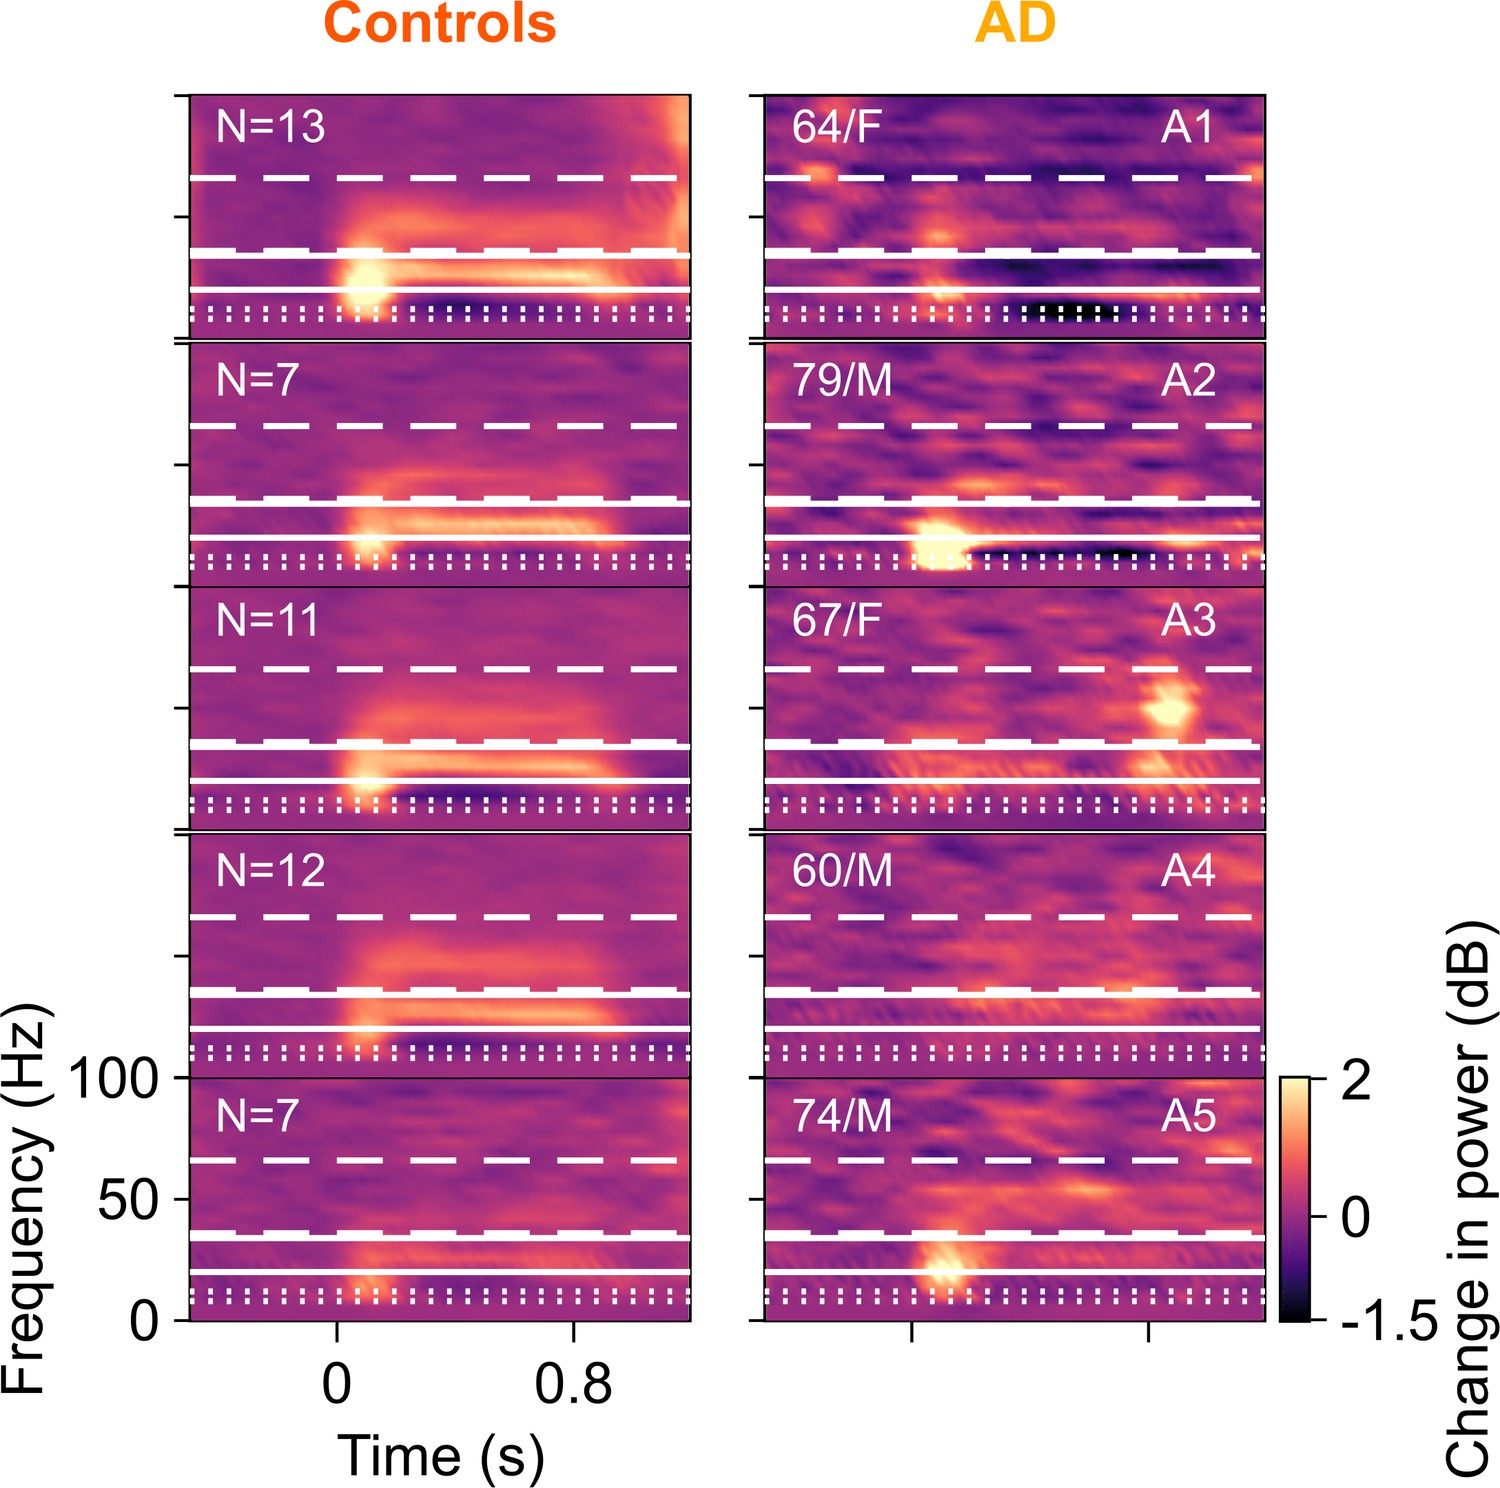
Time-frequency change in power spectrograms for AD compared to their corresponding controls.
Change in power spectrograms for individual ADs plotted in right column and mean spectrograms across their respective healthy controls in left column. Same format as in Figure 2—figure supplement 1. Out of the five AD subjects, only one (A5) had higher fast gamma than their controls. For the rest, AD subjects had lower slow and fast gamma power than the median power for their healthy controls.
Figure 3—figure supplement 2
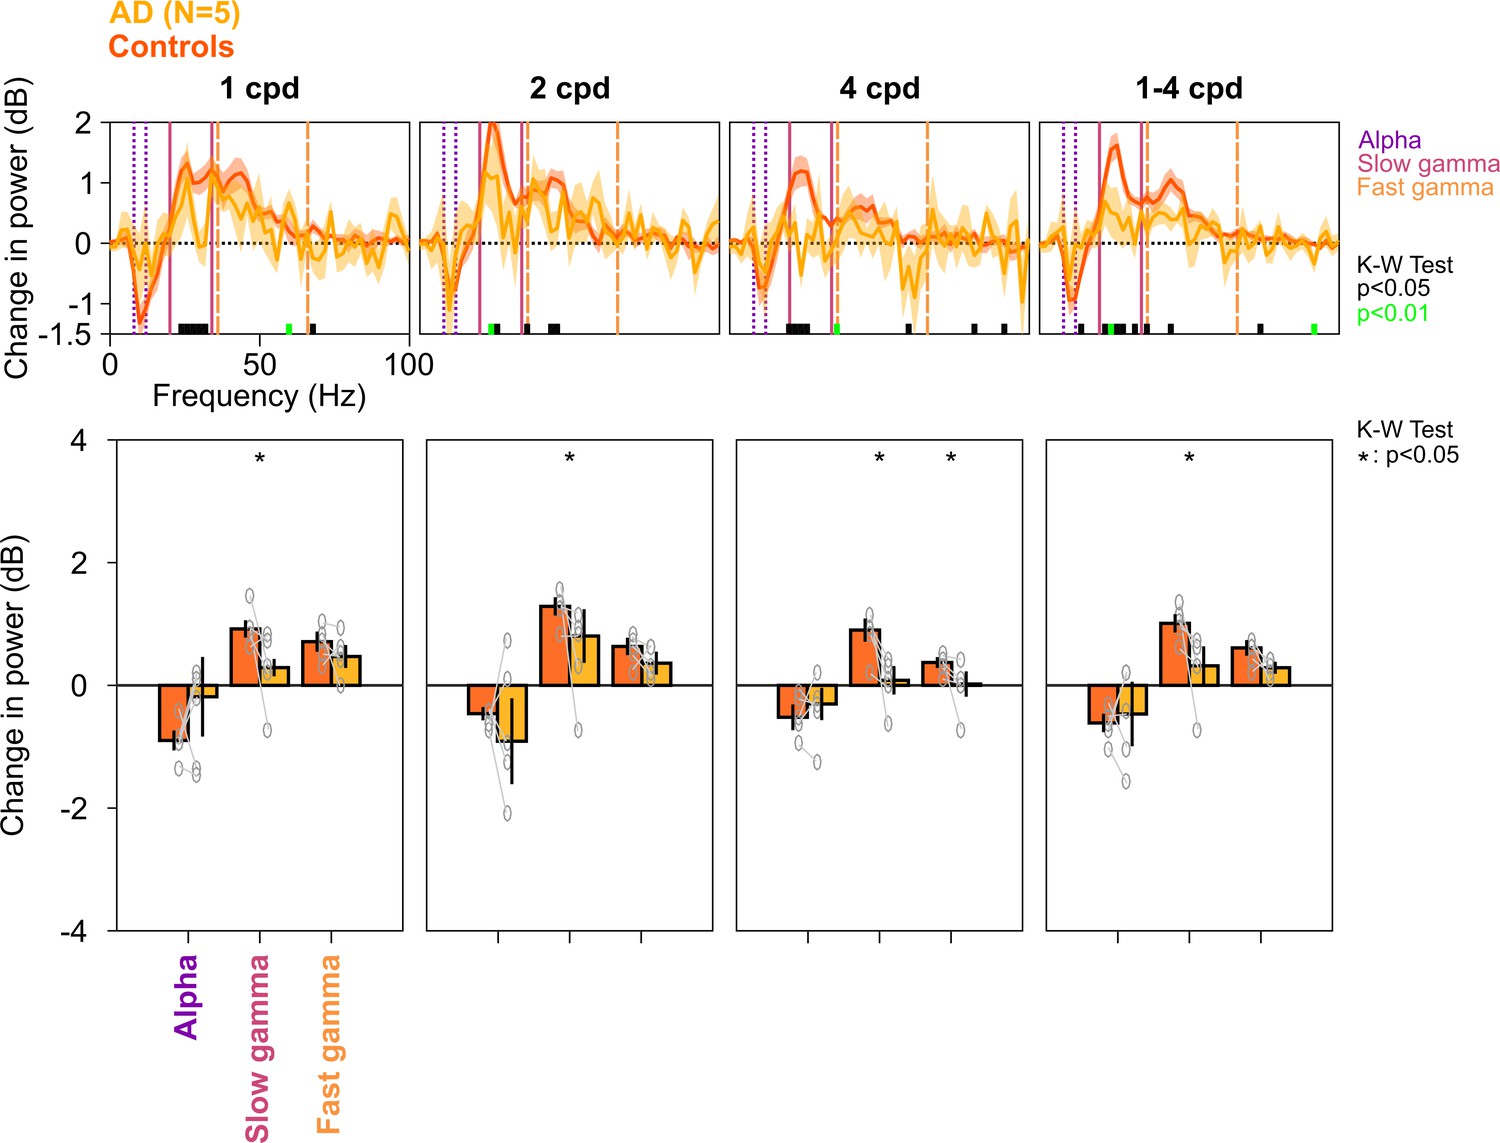
Alpha, slow, and fast gamma in AD subjects and controls across different spatial frequencies.
Same as in Figure 2—figure supplement 3, but for five AD subjects and their respective controls. Similar to MCI subjects, changes in PSDs and slow/fast gamma power were lower in ADs compared to controls. This effect was more prominent for 2 and 4 cpd conditions (K-W test; χ2(9) = 0.27/0.27/0.1, p=0.60/0.60/0.75 for alpha, χ2(9) = 3.94/3.94/4.81, p=0.047/0.047/0.028 slow gamma, and χ2(9) = 0.88/1.84/3.94, p=0.35/0.17/0.047 for fast gamma, for 1/2/4 cpd, respectively; for 1–4 cpd condition, χ2(9) = 0.27, p=0.60 for alpha, χ2(9) = 4.81, p=0.028 for slow gamma, and χ2(9) = 3.15, p=0.076 for fast gamma, respectively).
Figure 3—figure supplement 3
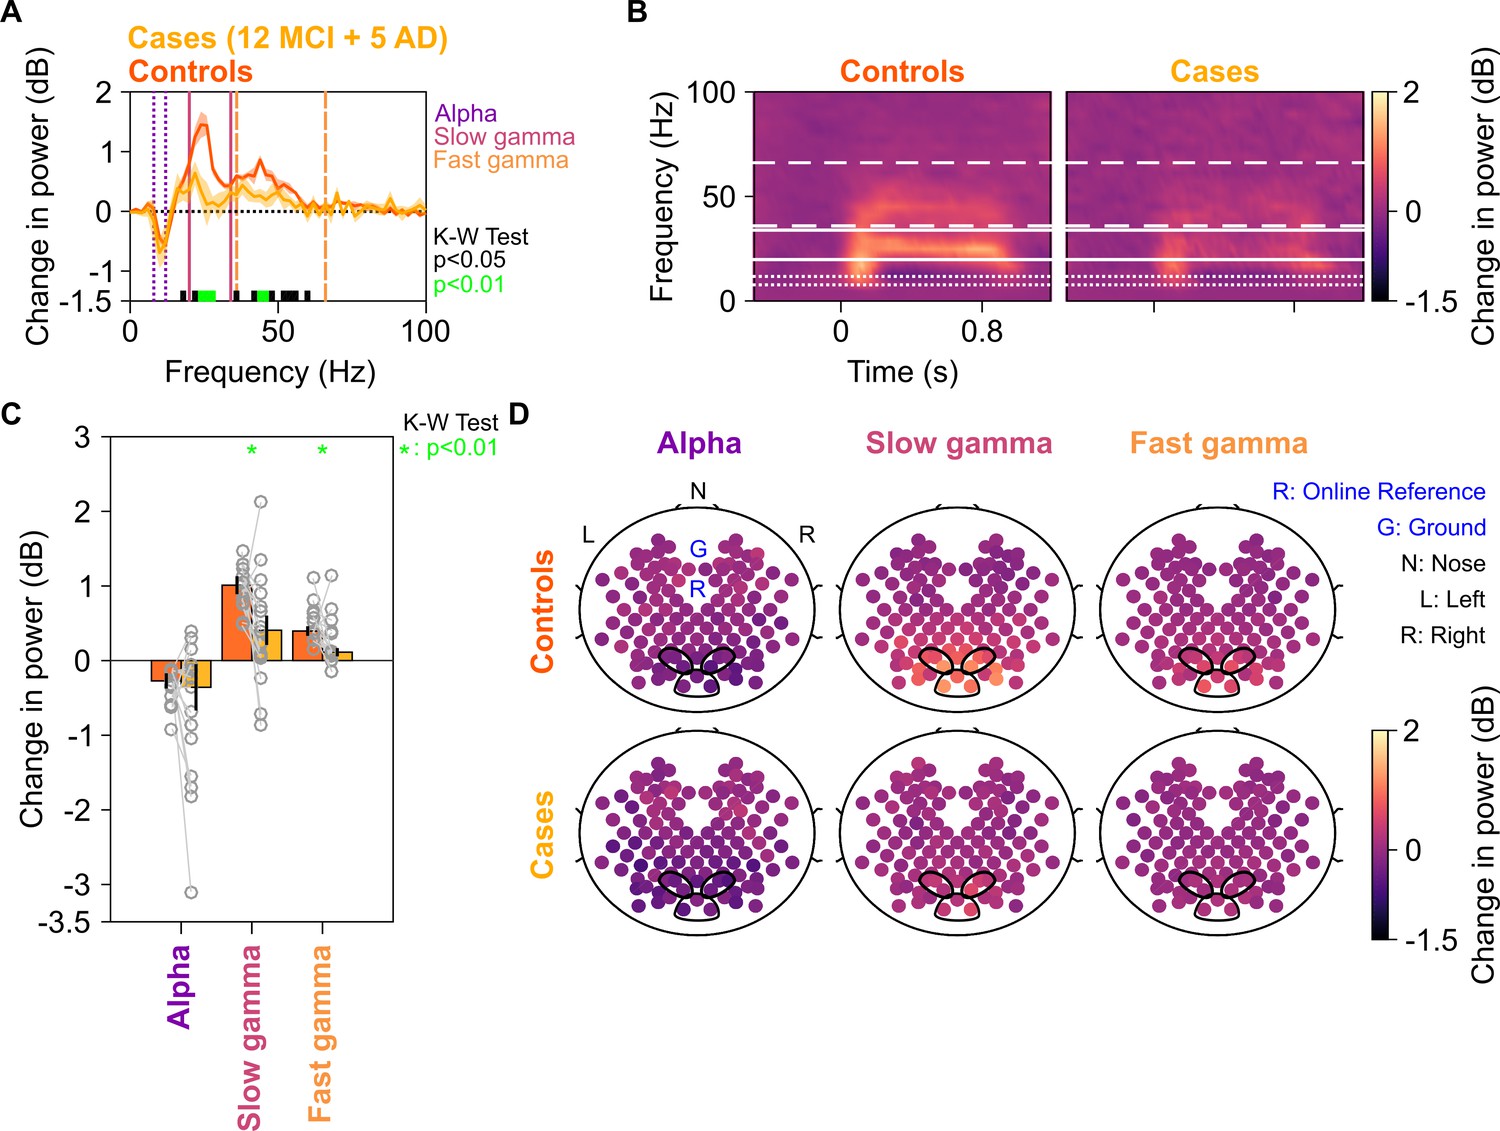
Alpha, slow, and fast gamma in all cases (MCIs and ADs) and controls.
Same format as in Figure 2, but for 12 MCI + 5 AD subjects and their respective controls.
Figure 4 with 2 supplements
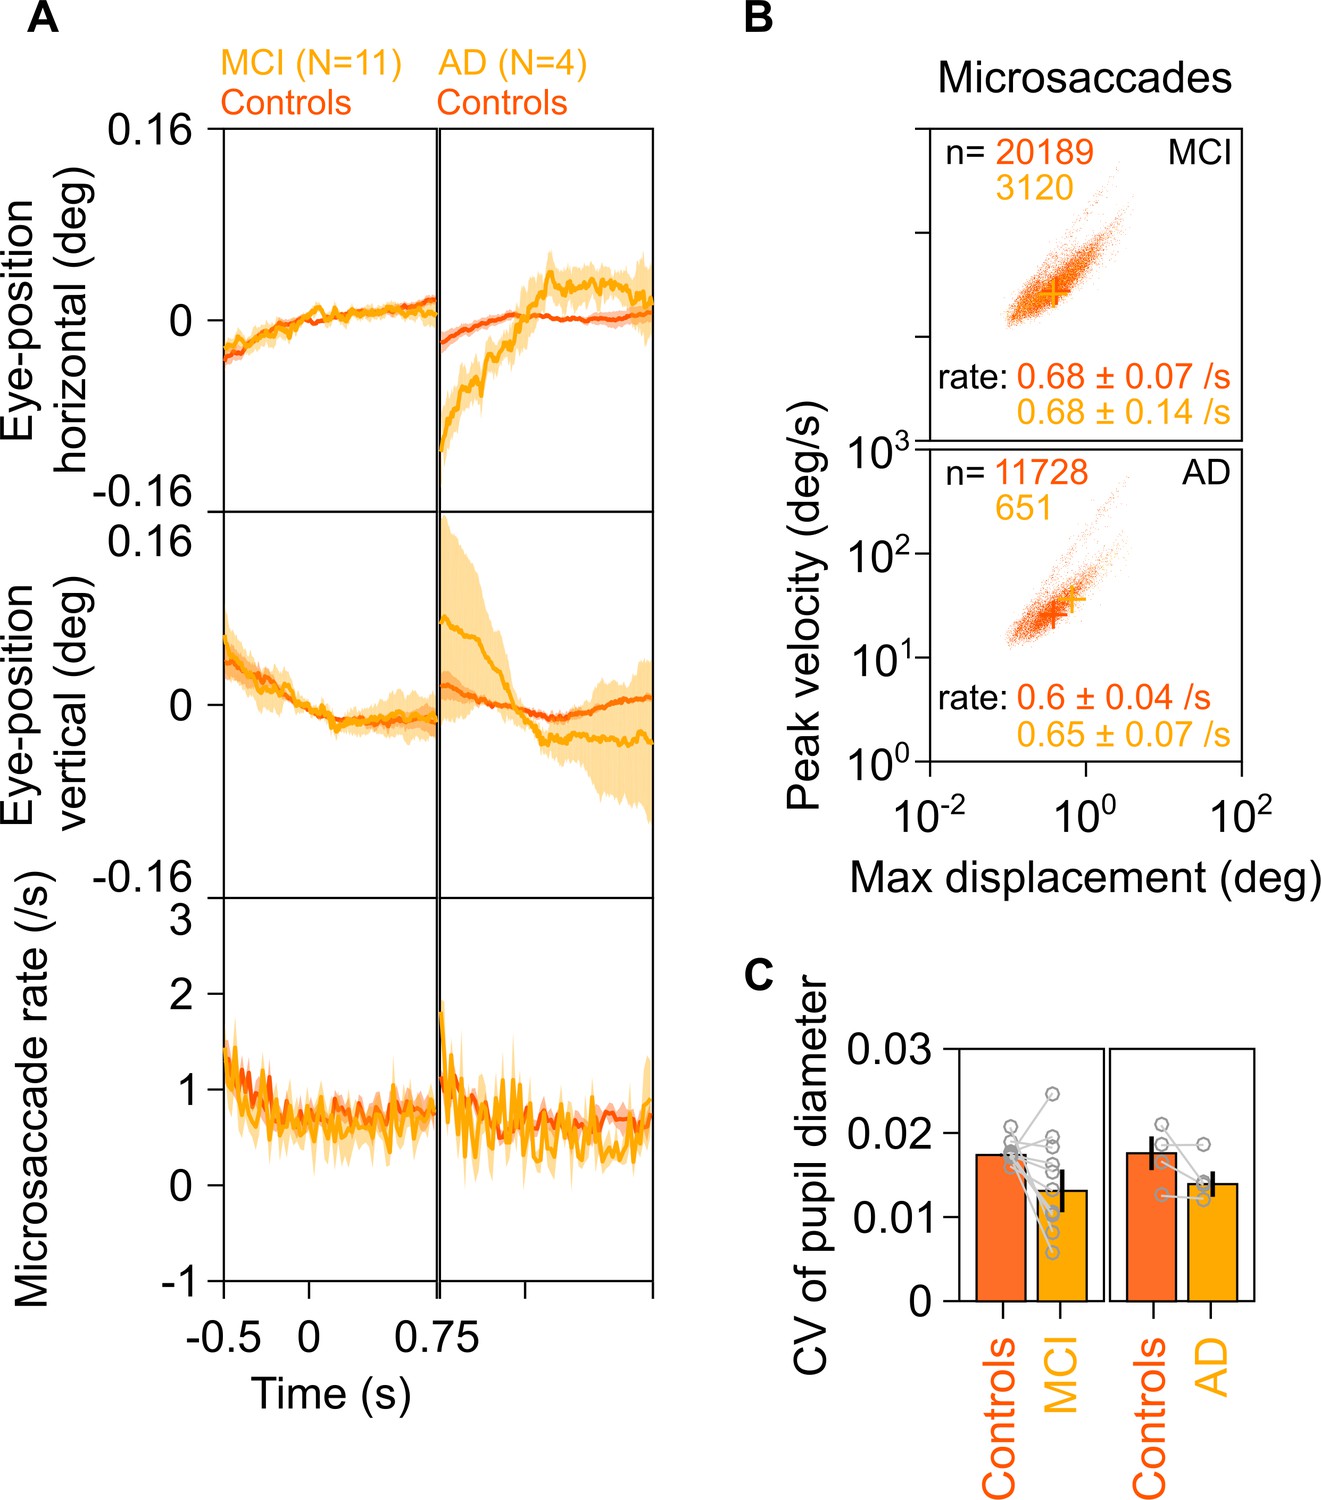
Eye position, microsaccades, and pupillary reactivity for healthy/MCI/AD subjects.
(A) Left column: Eye position in horizontal (top row) and vertical (middle row) directions; and histogram showing microsaccade rate (bottom row) vs time (−0.5–0.75 s of stimulus onset) for 11 MCI cases (yellow) and their respective healthy controls (dark orange). Solid traces indicate medians, shaded patches represent ± SD of median after bootstrapping over 10,000 samples. Right column: Same plots for four AD cases and their healthy controls. Eye position did not vary significantly across time between MCI/AD and control subjects except in the case of AD vs controls, where it varied slightly (but within ±0.1°). (B) Main sequence plots showing peak velocity and maximum displacement of all microsaccades (number indicated on top) extracted from 11 MCI (top row), 4 AD (bottom row) subjects indicated in yellow, and their corresponding healthy controls (dark orange). Average microsaccade rate (median ± SD of median of 10,000 bootstrapped samples) across all subjects for each group is also indicated at the bottom of the panels. MCI/AD cases had similar microsaccade rates (also seen in panel A) and main sequence plots compared to their healthy controls. (C) Bar plots showing coefficient of variation of pupil diameter (reactivity of pupil to stimulus presentation; see Murty et al., 2020) for 11 MCI (left), 4 AD (right), and their corresponding healthy controls. Data for individual MCIs and average across respective controls is represented by gray circles. Height of bars indicate medians and error bars indicate ± SD of median of 10,000 bootstrapped samples. We did not find any significant difference between the MCI/AD and control groups in pupil reactivity (K-W test, MCI vs controls: χ2(21) = 3.76, p=0.052; AD vs controls: χ2(7) = 0.75, p=0.39).
Figure 4—figure supplement 1
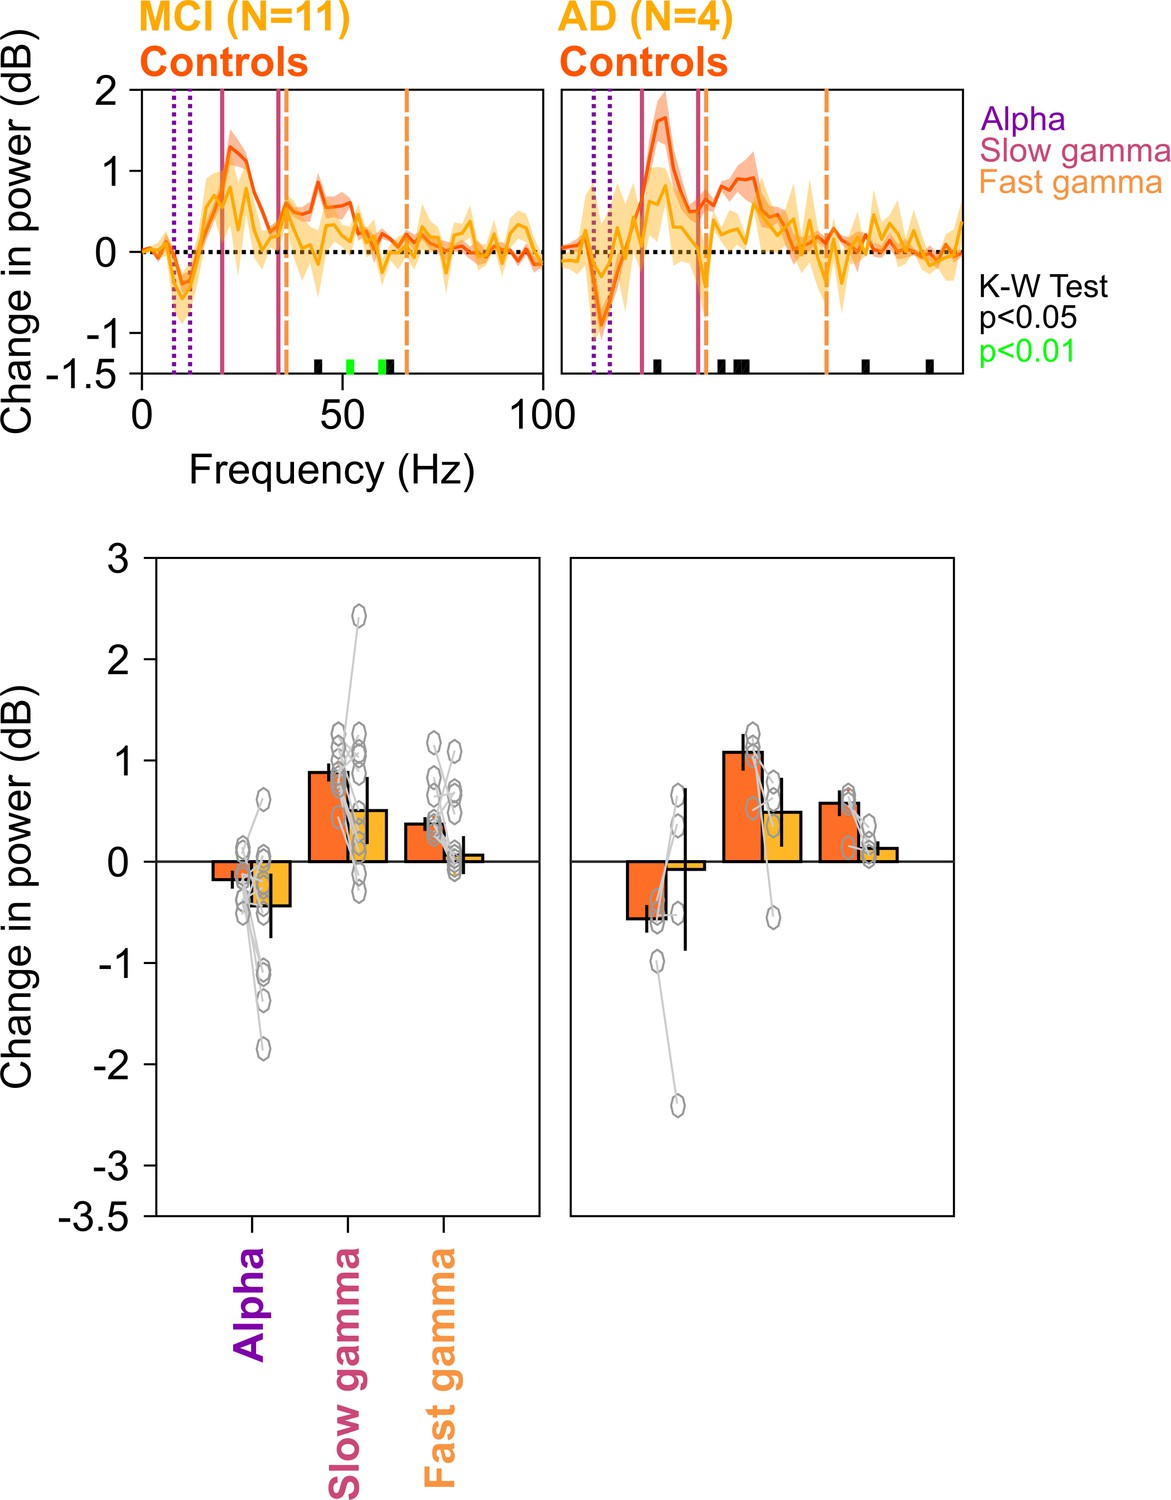
Spectral analyses for trials containing no microsaccades.
Top row: Stimulus-induced change in power spectral densities (PSDs) (top row) for MCI vs controls (left column) AD vs controls (right column). Same as in Figure 2A, but trials containing microsaccades (~55% of all trials) during the analysis period (−500 to 750 ms of stimulus onset) have been discarded from analysis. Bottom row: Change in power in alpha, slow gamma, and fast gamma bands. Left column: MCI vs controls, right column: AD vs controls. Same format as in Figure 2C. Although the differences in MCI and AD groups (compared to controls) computed over the fixed ranges were not significant (K-W test; for MCIs: χ2(21) = 2.81/3.27/1.82, p=0.09/0.07/0.18 for alpha/slow/fast gamma, respectively; for AD: χ2(7) = 0/3/1.33, p=1/0.08/0.25 for alpha/slow/fast gamma, respectively), the delta PSD curves for cases were generally below the controls in the gamma range, and results were significant for the MCI group when we chose a single gamma band between 20 and 66 Hz (χ2(21) = 4.02, p=0.045).
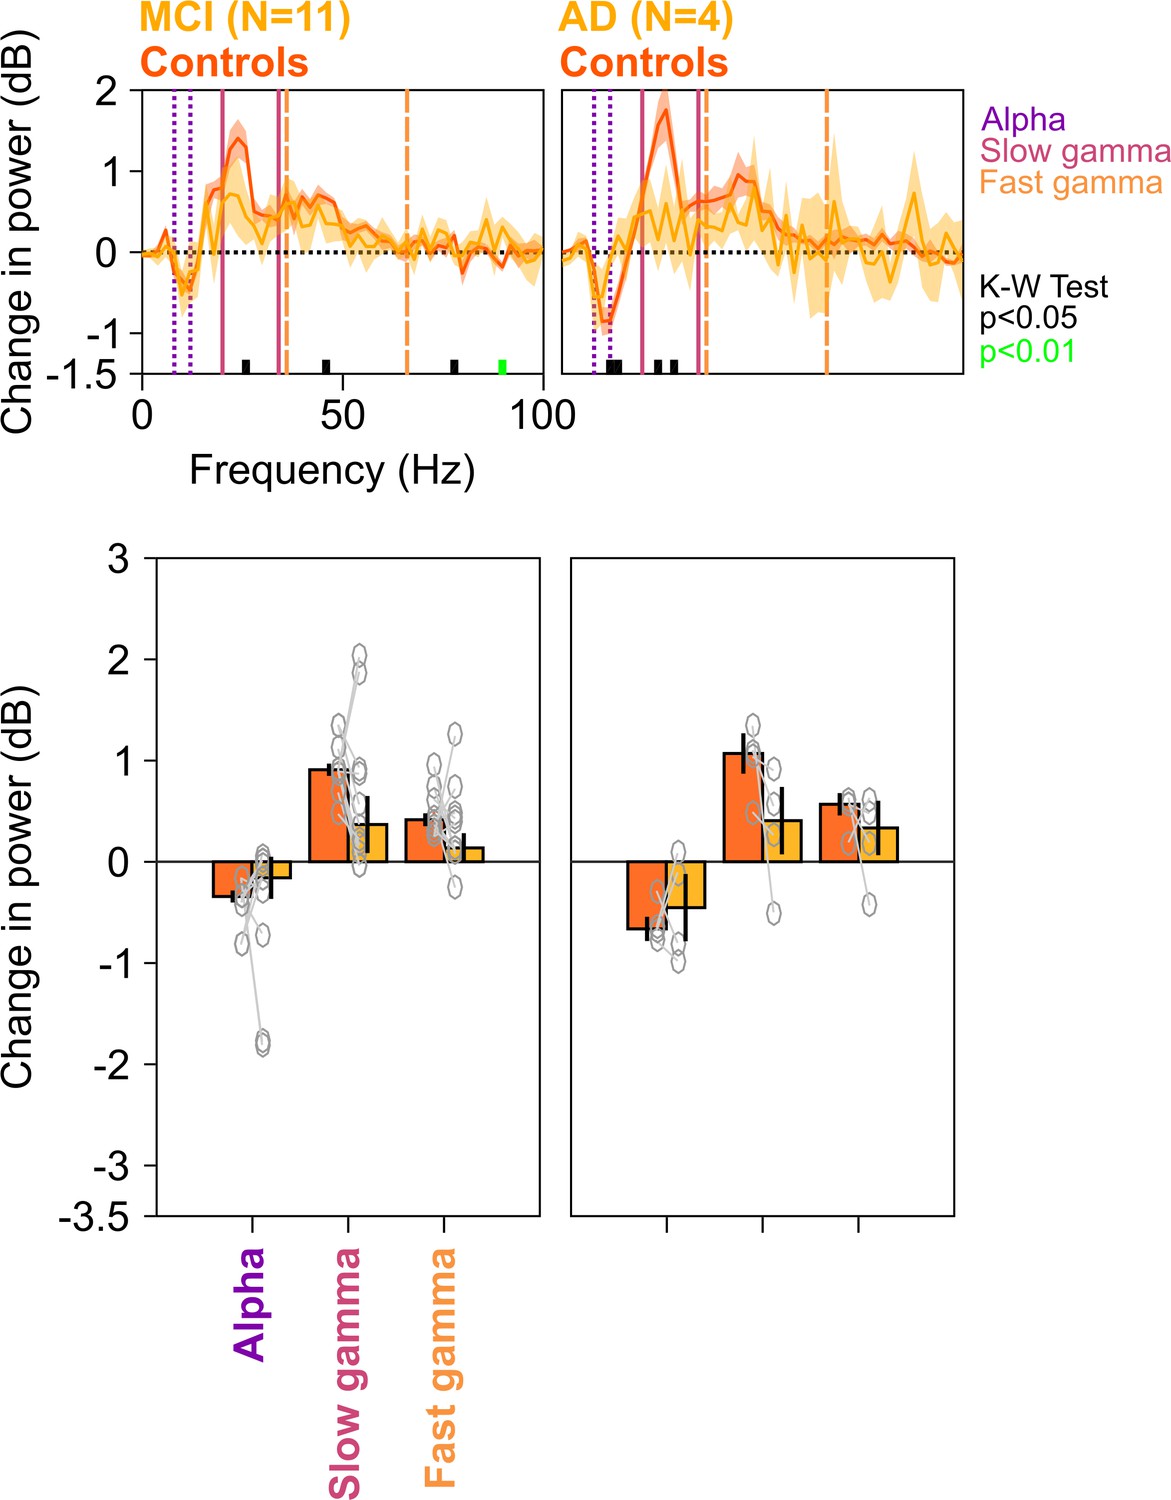
Figure 4—figure supplement 2
Spectral analyses for trials containing microsaccades.
Top row: Stimulus-induced change in PSDs (top row) for MCI vs controls (left column) and AD vs controls (right column). Same as in Figure 4—figure supplement 1, but only trials that contained microsaccades during the analysis period (−500 to 750 ms of stimulus onset) have been analyzed. Bottom row: Change in power in alpha, slow gamma, and fast gamma bands. Left column: MCI vs controls, right column: AD vs controls. Same format as in Figure 4—figure supplement 1. As before, although the differences in MCI and AD groups (compared to controls) were not significant for fixed ranges (K-W test; for MCIs: χ2(21) = 2/0.91/2.59, p=0.16/0.34/0.18 for alpha/slow/fast gamma, respectively; for AD: χ2(7) = 0.75/3/3, p=0.39/0.08/0.08 for alpha/slow/fast gamma, respectively), the delta PSD curves for cases were generally below the controls over most of the gamma range, and choosing the more sensitive slow gamma range between 26 and 34 Hz yielded a significance difference for the MCI group (χ2(21) = 5.75, p=0.016).
Figure 5 with 1 supplement

Baseline PSDs and alpha/slow/fast gamma power in cases and healthy controls.
Left column: Baseline PSDs (top row) and bar plots (bottom row) showing baseline absolute power (calculated in −500–0 ms of stimulus onset) for each of the 12 MCIs and corresponding healthy controls in alpha, slow gamma, and fast gamma bands. Same format as in Figure 2A and C. Data for individual MCIs and averages of corresponding control subjects are shown in gray circles. Corresponding analyses for five AD subjects are shown in right column. None of the differences in MCI and AD groups (compared to controls) were significant (see Results section).
Figure 5—figure supplement 1
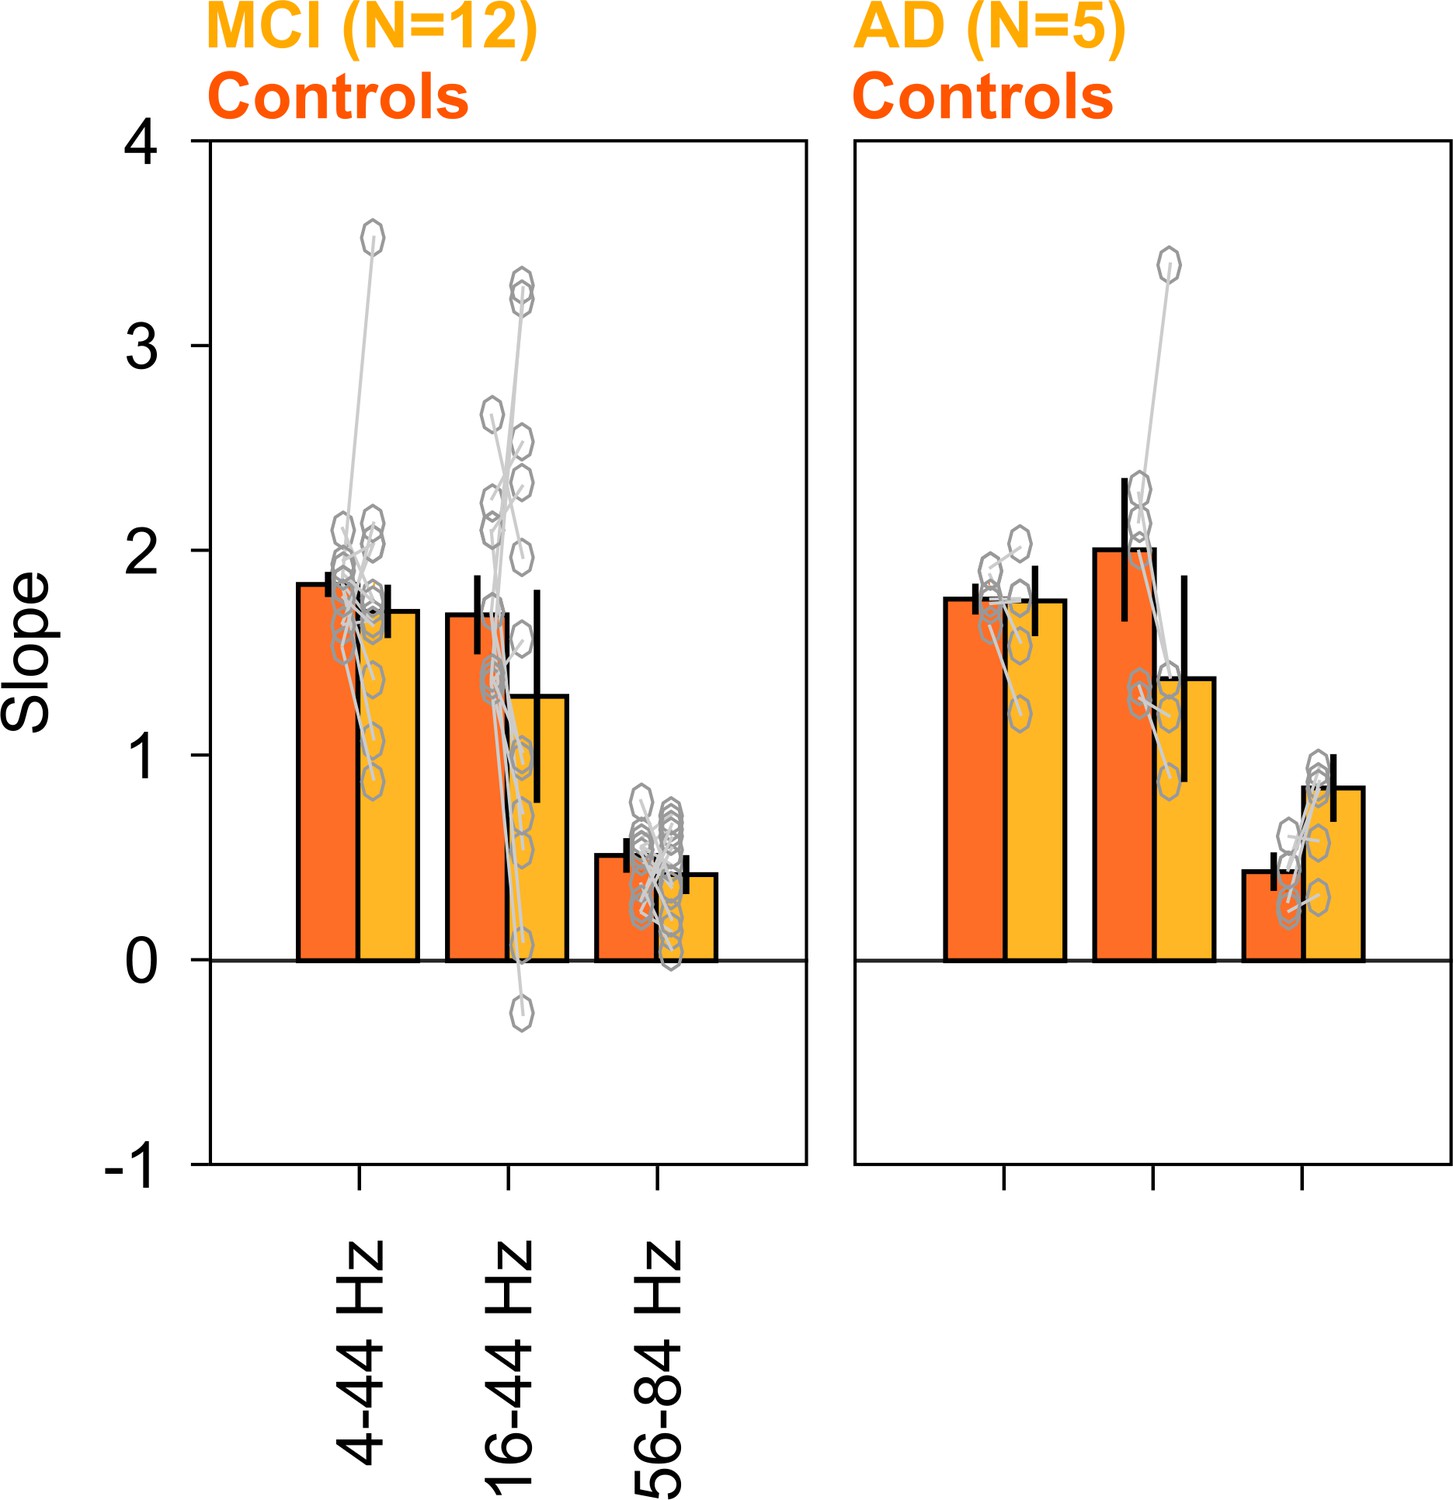
Baseline slopes in cases and healthy controls.
Bar plots showing PSD slopes for each of the 12 MCIs (left), 5 ADs (right), and corresponding healthy controls (ordinate) in baseline period (calculated in −500–0 ms of stimulus onset), in the frequencies mentioned on ordinate. Same format as in Figure 5 (bottom row). None of the differences in MCI and AD groups (compared to controls) were significant (K-W test; for MCIs: χ2(23) = 0.21/0.56/0.01, p=0.64/0.45/0.91 for alpha/slow/fast gamma, respectively; for AD: χ2(9) = 0.27/0.53/3.15, p=0.60/0.46/0.07 for alpha/slow/fast gamma, respectively).
Figure 6 with 2 supplements
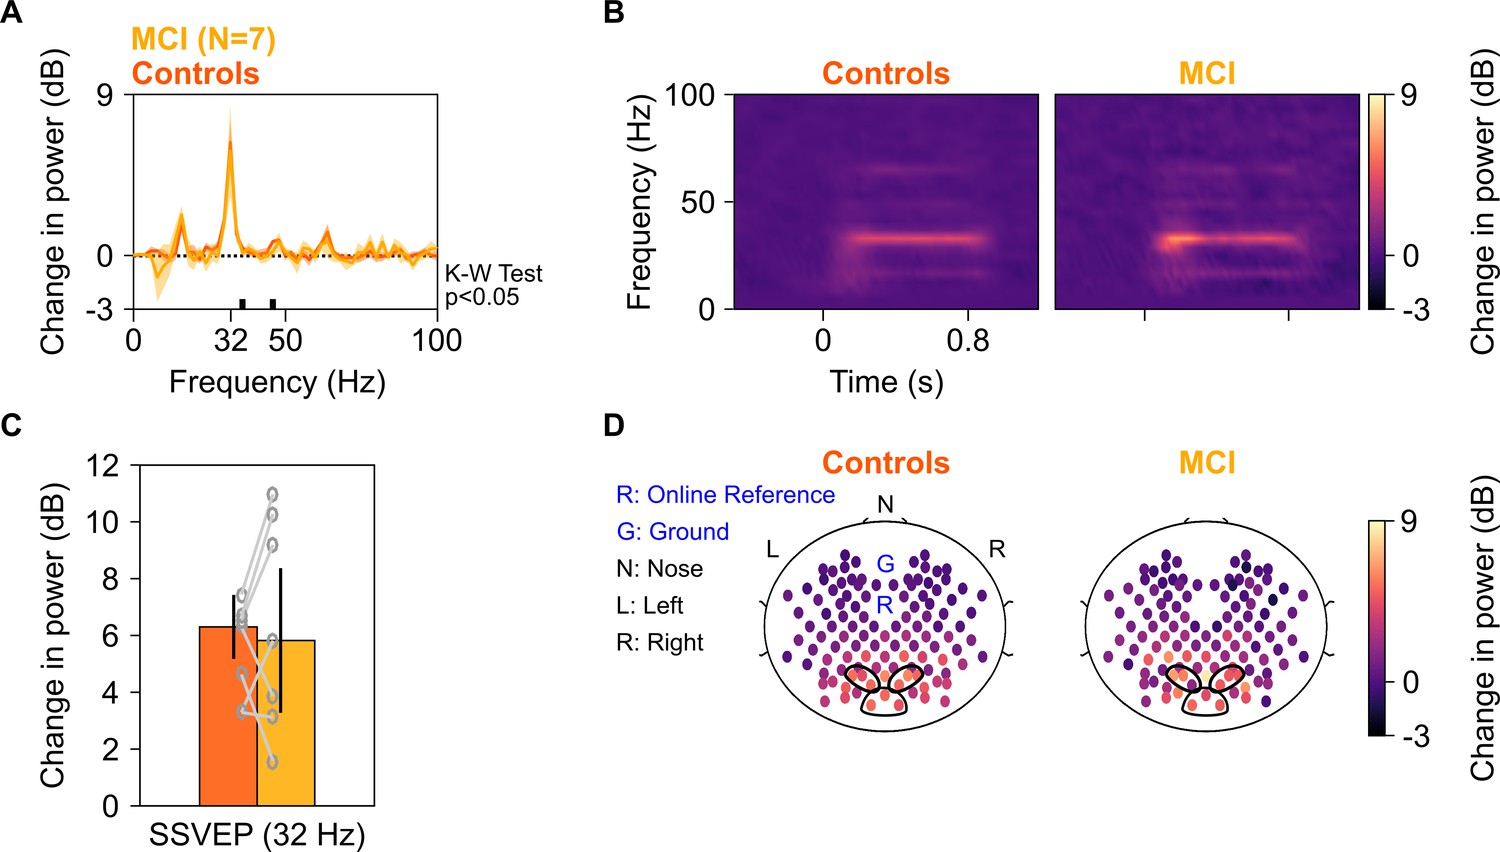
SSVEP at 32 Hz in MCIs and controls.
Median change in power spectral density (PSD) (solid traces in A) and median change in power spectrograms in (B) for seven MCIs and their respective controls. Shaded regions in (A) indicate ± SD from medians after bootstrapping over 10,000 iterations. (C) Median change in SSVEP power at 32 Hz for MCIs (yellow) and controls (dark orange). Error bars indicate ± SD from medians after bootstrapping over 10,000 iterations. (D) Median scalp maps of 112 bipolar electrodes (disks) for MCIs (bottom row) and controls (top row) for change in power at 32 Hz. Same format as in Figure 2D.
Figure 6—figure supplement 1

Alpha, slow, and fast gamma in seven MCIs and their healthy controls used for SSVEP analysis.
Median change in PSD in (A), median change in power spectrograms (B), and median change in power in alpha, slow gamma, and fast gamma bands in (C) and the respective scalp maps in (D), estimated from the Gamma experiment, for seven MCIs (yellow) and their respective healthy controls (dark orange; same set of MCIs and controls as in Figure 5A–D). Same format as Figure 2A–C.
Figure 6—figure supplement 2

Analysis of trial-averaged time-amplitude waveforms from SSVEP experiment.
Median change in PSD (A), median change in power spectrograms (B), and median change in SSVEP power (C) for seven MCIs (yellow) and their respective healthy controls (dark orange), calculated from their trial-averaged time courses (medians plotted in D). For each MCI, average response of their respective controls is considered. Shaded areas in panels A and D represent error bars (standard deviation of mean calculated by bootstrapping over 10,000 iterations). Vertical lines in (D) represent 0–250 ms of stimulus onset. The changes in spectra were not different between MCI and controls as observed in Figure 6. Further, difference in the change in SSVEP power at 32 Hz between MCIs and controls was insignificant (K-W test, χ2(13) = 0.1, p=0.75). (E) Left panel: Bar plots showing median root mean square (RMS) amplitude and median peak amplitude of stimulus-onset response (0–250 ms of stimulus onset) calculated from trial-averaged time-courses for seven MCIs (yellow) and their respective controls (dark orange). Right panel: Bar plot showing peak time of stimulus-onset response. Data for individual MCIs and average for individual set of controls are shown in gray circles. Error bars represent standard deviation of medians calculated by bootstrapping over 10,000 iterations. None of these measures were significantly different for MCIs and controls (K-W test, χ2(13) = 0.33/0.92/1.48, p=0.56/0.34/0.22 for RMS-amplitude/peak-amplitude/peak time, respectively).
Tables
Key resources table
| Reagent type (species) or resource | Designation | Source or reference | Identifiers | Additional information |
|---|---|---|---|---|
| Software, algorithm | Chronux toolbox | chronux.org | RRID:SCR_005547 | - |
| Software, algorithm | EEGLAB toolbox | https://sccn.ucsd.edu/eeglab/index.php | RRID:SCR_007292 | - |
Table 1
Demographic and clinical details for subjects.
| Healthy | MCI | AD | |
|---|---|---|---|
| Demographic details | |||
| Number of subjects (no. of females in parentheses) | |||
| Total recruited | 236 (104) | 15 (3) | 6 (2) |
| Total analyzed | 227 (101) | 12 (3) | 5 (2) |
| Age (in years, for analyzed subjects) | |||
| Range (min-max) | 50–88 | 51–81 | 60–79 |
| Mean ± SD | 66.8 ± 8.2 | 71.4 ± 9.3 | 68.8 ± 7.7 |
| Diagnostic criteria | |||
| Subjective memory complaint | Present/absent | Present | Present |
| General cognitive function* | Preserved | Preserved | Reduced |
| IADL | </=0.5 | </=0.5 | >0.5 |
| CDR | = 0 | = 0.5 | >0.5 |
| HMSE** | >27 | - | - |
| Clinical scores of analyzed subjects (no. of subjects in parentheses) | |||
| CDR | 0 (204) | 0.5 (12) | 1 (4), 3 (1) |
| HMSE (mean ± SD) | 30.3 ± 1 (216) | 29.6 ± 1.5 (12) | 23 ± 2.7 (5) |
-
MCI: mild cognitive impairment; AD: Alzheimer’s disease; IADL: Instrumental Activities of Daily Living (Mathuranath et al., 2005); CDR: Clinical Dementia Rating (Hughes et al., 1982; Morris, 1993); HMSE: Hindi Mental State Examination (Ganguli et al., 1995).
*Based on clinician’s assessment.
-
**HMSE was used as a diagnostic criterion only if CDR score was unavailable and clinical testing did not indicate any sign of dementia.
Additional files
-
Supplementary file 1
Supplementary tables.
Supplementary table 1: Criteria used for consensus diagnosis of dementia. ACE: Addenbrooke's Cognitive Examination (So et al., 2018); CDR: Clinical Dementia Rating (Hughes et al., 1982; Morris, 1993); GPCOG: General Practitioner Assessment of Cognition (Brodaty et al., 2002); HAMD: Hamilton Depression Rating Scale (Hamilton, 1960; Williams, 1988); HMSE: Hindi Mental State Examination (Ganguli et al., 1995); IADL: Instrumental Activities of Daily Living (Mathuranath et al., 2005); NIA-AA: National Institute on Aging-Alzheimer’s Association workgroups (McKhann et al., 2011); NPI: Neuropsychiatric Inventory (Cummings et al., 1994); TLSA: Tata Longitudinal Study of Aging. 1NIA-AA criteria are presented from McKhann et al., 2011. 2Cognitive decline could also be seen in delirium. So, this criterion is intended to rule out delirium. A combination of clinician assessment and HMSE is used. Acute change in cognitive status and/or HMSE <24 is suggestive of delirium. 3This criterion is intended to rule out moderate/severe depression as that can cause cognitive impairment. Supplementary table 2. Criteria used for consensus diagnosis of probable AD. WMH: white matter hyperintensities; FTD: Frontotemporal dementia. The rest of the abbreviations are as described in Supplementary table 1. Supplementary table 3. Criteria used for consensus diagnosis of MCI. 1Q4. Have there been some decline in memory in the past one year? (Hughes et al., 1982; Morris, 1993). Abbreviations are as described in Supplementary table 1.
- https://cdn.elifesciences.org/articles/61666/elife-61666-supp1-v2.docx
-
Transparent reporting form
- https://cdn.elifesciences.org/articles/61666/elife-61666-transrepform-v2.docx
-
Reporting standard 1
STROBE statement.
- https://cdn.elifesciences.org/articles/61666/elife-61666-repstand1-v2.doc
Download links
A two-part list of links to download the article, or parts of the article, in various formats.
Downloads (link to download the article as PDF)
Open citations (links to open the citations from this article in various online reference manager services)
Cite this article (links to download the citations from this article in formats compatible with various reference manager tools)
Stimulus-induced gamma rhythms are weaker in human elderly with mild cognitive impairment and Alzheimer’s disease
eLife 10:e61666.
https://doi.org/10.7554/eLife.61666


