Paternal multigenerational exposure to an obesogenic diet drives epigenetic predisposition to metabolic diseases in mice
- Université Côte d’Azur, Inserm, C3M, TeamControl of Gene Expression (10), France
- Université Côte d'Azur, CNRS, Inserm, iBV, France
- Université Côte d’Azur, Inserm, C3M, Team Cellular and Molecular Pathophysiology of Obesity and Diabetes (7), France
Figures
Figure 1 with 2 supplements
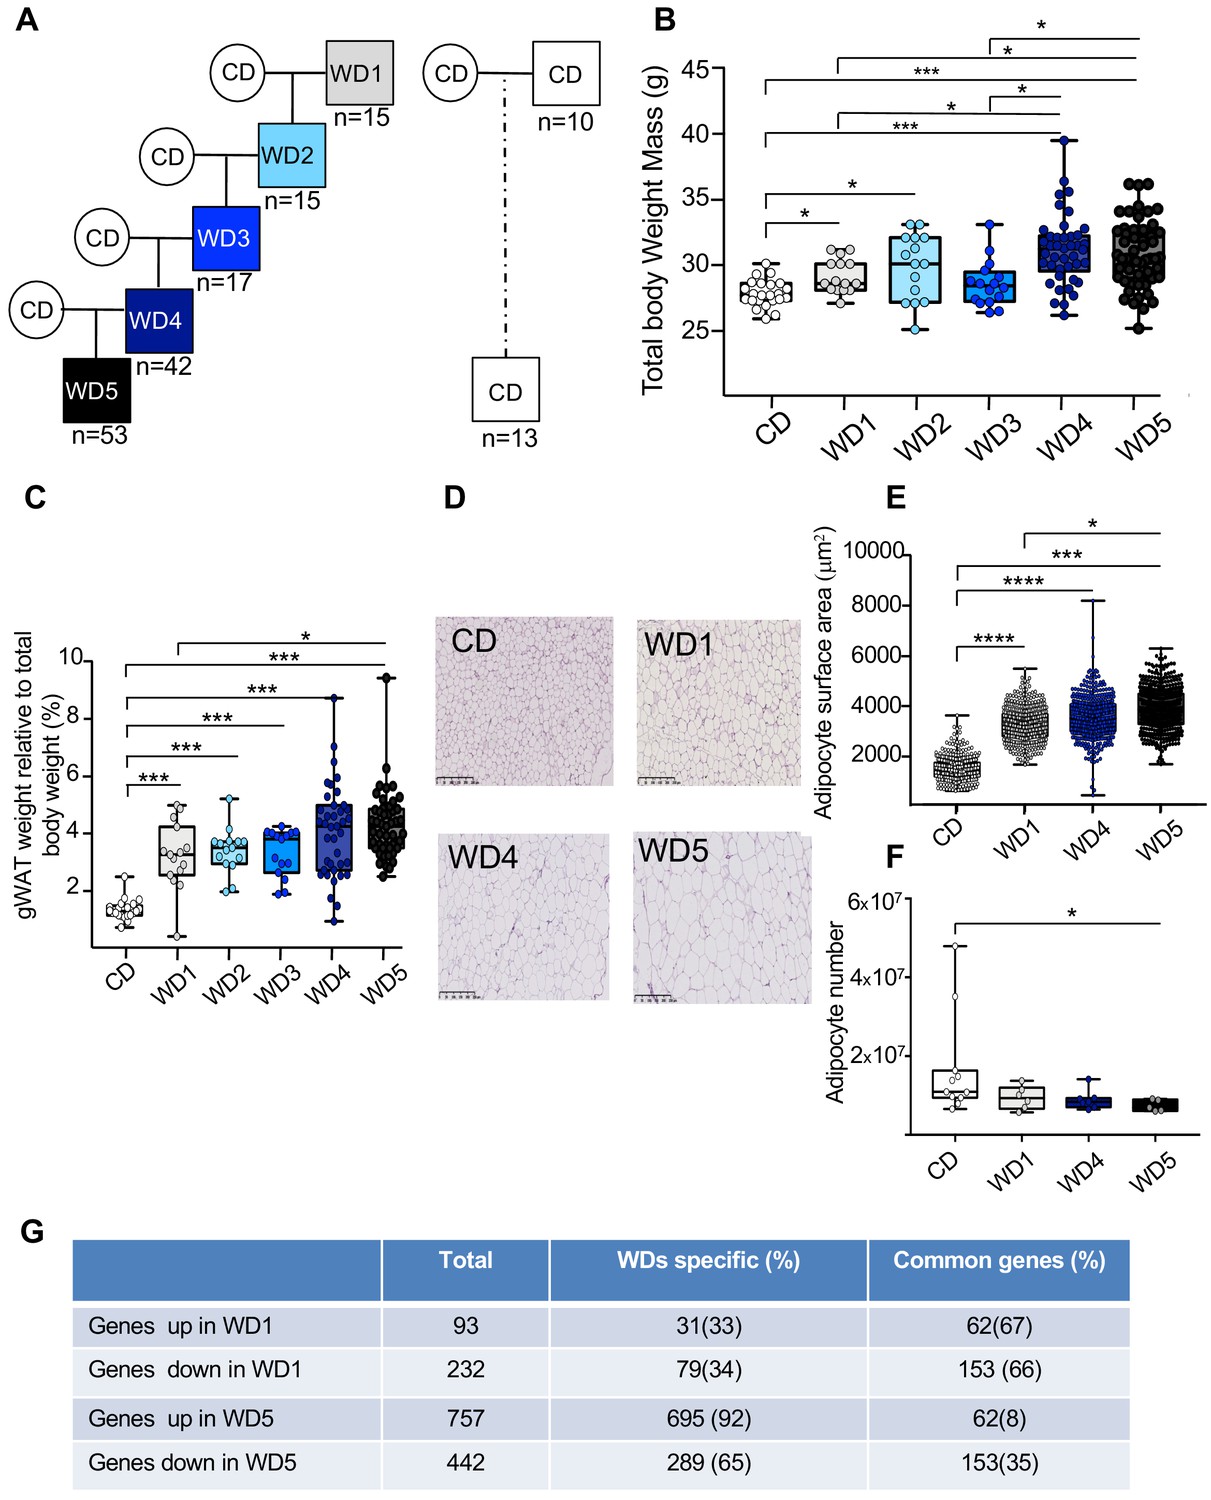
Five consecutive paternal generations of Western diet (WD) feeding exacerbate the WD-induced overweight phenotype.
(A) Study design for the maintenance of WD feeding for five consecutive generations through the paternal lineage. Male mice were randomized to receive either a control diet (CD; 5% of energy from fat) or a WD (WD1; 45% of energy from fat). After 3 months of WD feeding, four males obtained from different fathers were arbitrary chosen to generate four independent families. They were mated with CD-fed females to generate WD2 offspring. At 3 weeks old, they were fed a WD, and at 4 months, at least one WD-fed male per family was crossed with CD-fed females. This second generation of males was called WD2. This experimental design was repeated three times to obtain the WD5 group (Figure 1—figure supplement 1). (B) Box-whiskers (min-max) of the median total body weight of the different male WD cohorts (n ≥ 8 mice per group). (C) Box-whiskers (min-max) of the median perigonadal white adipose tissue (gWAT) weight relative to total body weight in the different WD cohorts. (D) H&E staining of gWAT sections (scale bar: 200 μm) in representative CD, WD1, WD4, and WD5 males. (E) Box-whiskers (min-max) of the median surface area (μm2) of the adipocytes, which was calculated using Image Analyzer software (ImageJ). The total count ranged from 3275 to 7052 cells per condition (n ≥ 4 mice per group). (F) Box-whiskers (min-max) of the number of adipocytes, which was estimated using the mathematical equation developed by Jo et al., 2009, as previously described in Gilleron et al., 2018. (G) Table showing the differentially expressed genes in WD1 and WD5 perigonadal white adipose tissue. *padj<0.05, **padj<0.01, ***padj<0.001, ****padj<0.0001.
-
Figure 1—source data 1
Physiological characteristics of different WD groups.
- https://cdn.elifesciences.org/articles/61736/elife-61736-fig1-data1-v3.docx
-
Figure 1—source data 2
Molecular signature database collection-Curated gene set enrichment from analyzing the differentially regulated genes in WD1 and WD5 males.
- https://cdn.elifesciences.org/articles/61736/elife-61736-fig1-data2-v3.xlsx
Figure 1—figure supplement 1
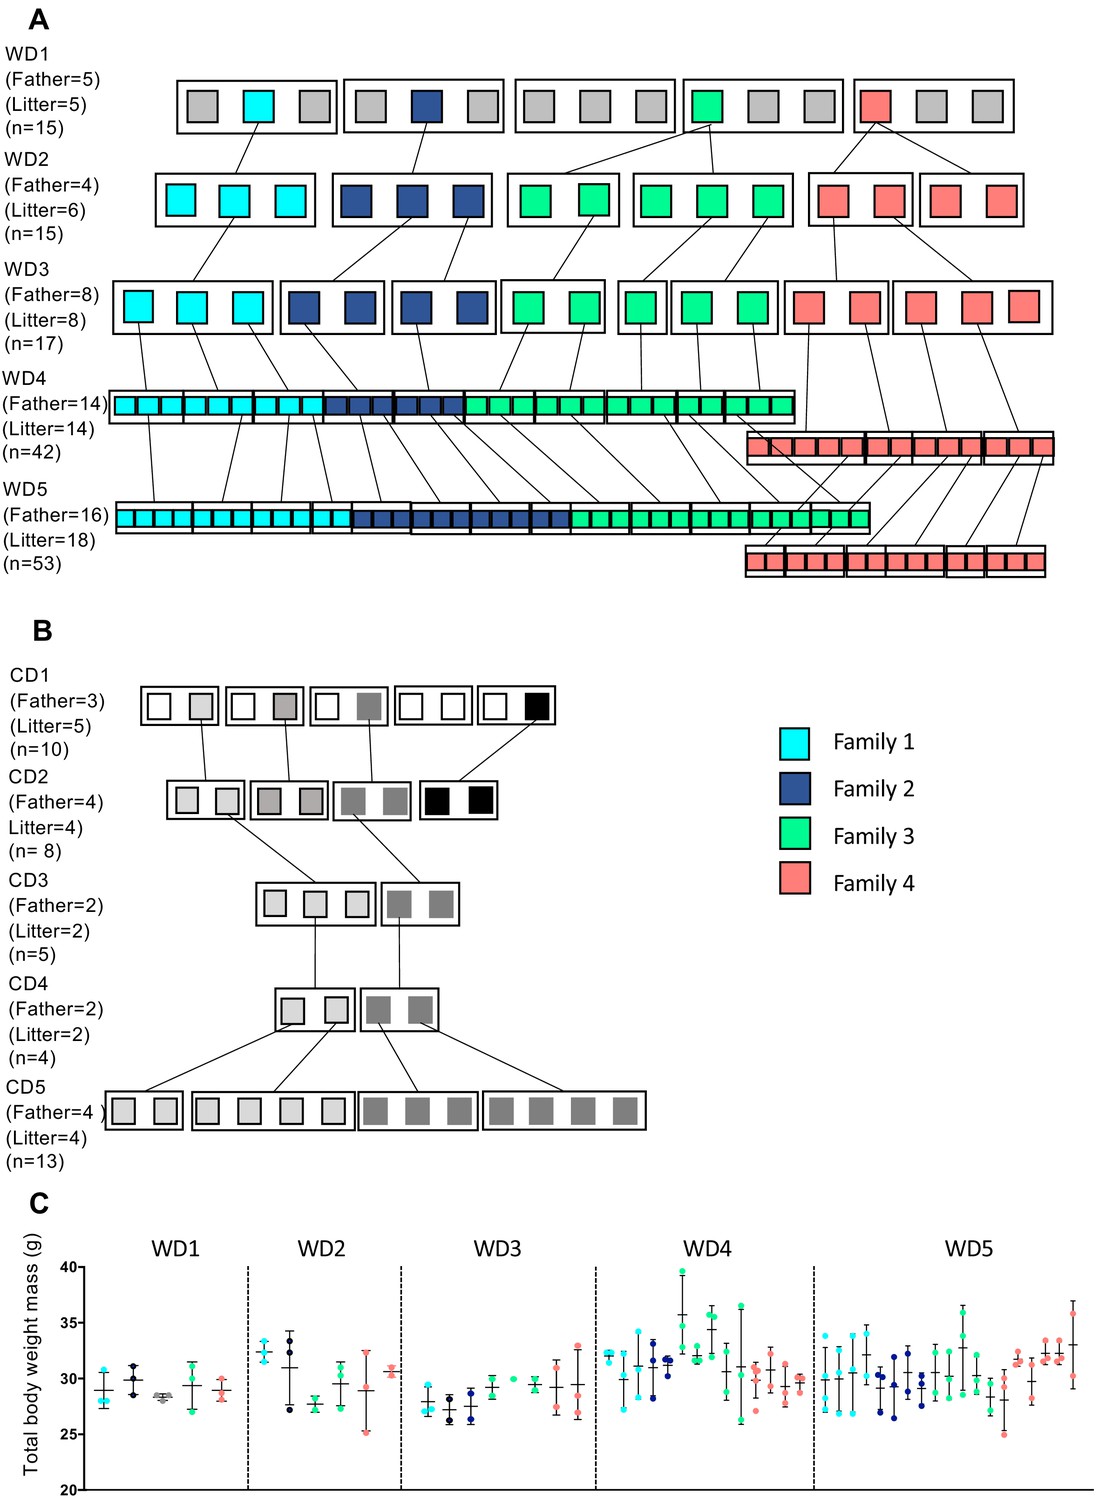
Schematic representation of the experimental procedure.
(A) Each square corresponds to one mouse. n corresponds to the number of offspring for each Western diet (WD) group. Because of the heterogeneity of the phenotype inside the same litter from the WD2 generations, more than one progenitor from the same litter were used to obtain the next generation. (B) Each square corresponds to one mouse. n corresponds to the number of offspring for each control diet (CD) group. Because of the homogeneity of the phenotype inside the same litter (Figure 1—figure supplement 2D), one progenitor per litter was used to obtain the CD2, CD3, and CD4. All CD mice were mated with a CD-fed female. (C) Scatter plot of total body weight mass for each litter of all WD generations. Each data point represents the measurements of one male.
Figure 1—figure supplement 2
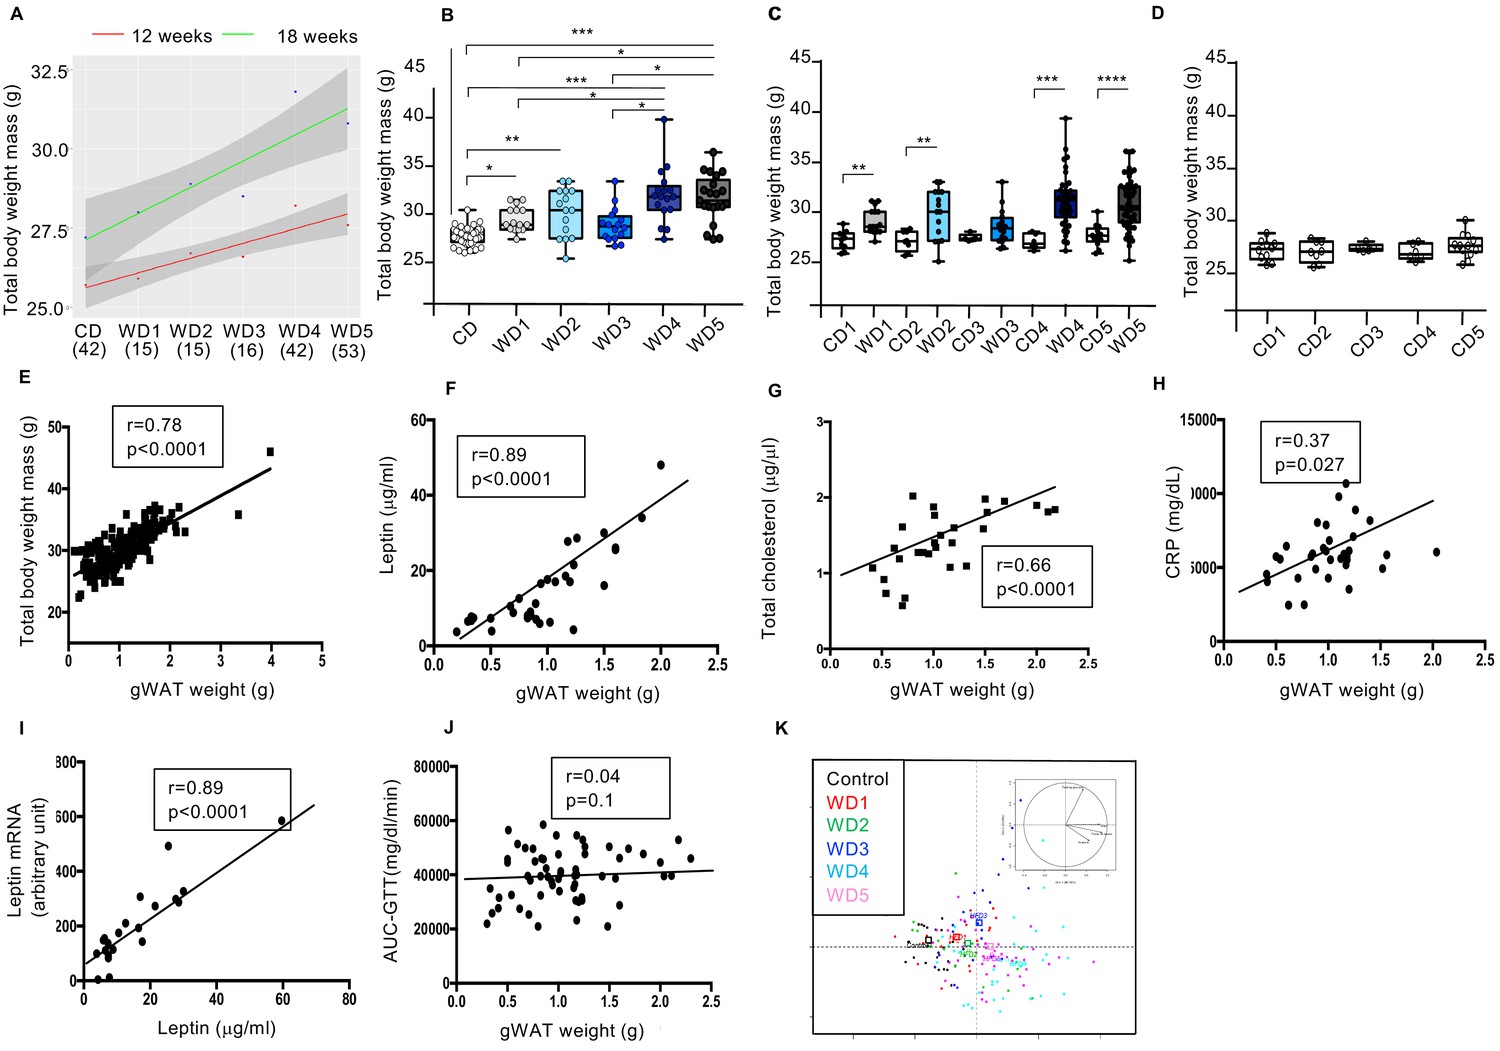
Exacerbation of the overweight phenotype upon continuous paternal Western diet (WD) feeding for multiple generations.
(A) Evolution of total body weight at 12 and 18 weeks over WD-fed generations (n ≥ 15). (B–E) Correlation analysis contains WD1–WD5 males. (B) Scatter plot of all WD litters. To demonstrate that we did not create significance with increasing the correlated sample, we selected a subset of 18 mice in WD4 and WD5 making sure that the four WD1 ancestors were equitably represented across the groups. Three combinations of 18 mice were selected and gave the same significance level with a p<0.001 when total body weight mass was compared to the corresponding weight of control diet (CD) group. This scatter plot represents one of these combinations. (C) Box-whiskers (min-max) of the median total body weights of the different male CD-fed and WD-fed cohorts. Statistical significance (p value) of differences in total body weight mass between CD-fed and WD-fed males from each generation was determined with the Mann–Whitney U test for unpaired observations (two-tailed), ∗p<0.05; ∗∗p<0.01; ∗∗∗p<0.001. (D) Box-whiskers (min-max) of the median total body weights of the CD-fed males in each generation. ns: not significant. (E) Positive linear correlation between perigonadal white adipose tissue (gWAT) and total body weight. Statistically significant positive linear correlation between gWAT and plasma leptin concentration (F), between gWAT and plasma total cholesterol (G), between gWAT and plasma C-reactive protein concentration (H), and between plasma leptin concentration and gWAT leptin mRNA (I). (D–H) Each data point represents the measurements of one male from generation 1 (WD1) to generation 5 (WD5). (J) There was no statistically significant linear correlation between epididymal fat mass and area under the curve–glucose tolerance test. (K) Principal component analysis analysis of fasting blood glucose, total body weight, epididymal fat mass, and kCal in the different WD cohorts visualizing the pattern of WD males depending on the number of WD-fed ancestors.
Figure 2

Five consecutive paternal generations of Western diet (WD) feeding exacerbate WD-induced overweight pathologies.
(A, B) Evolution of glucose parameters in male mice fed a WD for five successive generations. Blood glucose and insulin tolerance tests were performed on 16-week-old males (n ≥ 6). Plasma glucose (inserted box-whiskers [min-max] of the median area under the curve [AUC] and above baseline for glucose from time point 0 to 120; glucose tolerance test) (A); (inserted box-whiskers [min-max] of the median AUC and above baseline for glucose from time point 0 to 100; insulin tolerance test) (B). Glucose tolerance and insulin tolerance tests were conducted in the morning in overnight-fasted mice. (C) Box-whiskers (min-max) of the median liver weight relative to total body weight in the different WD cohorts (n ≥ 8 mice per group). (D) Liver triglyceride contents in the control diet (CD), WD1, and WD5 groups (n ≥ 6). (E) Percentage of normal hepatocytes, hepatocytes with microvesicular steatosis, hepatocytes with macrovesicular steatosis, and ballooning degenerative hepatocytes in CD, WD1, and WD5 livers (n ≥ 6). (F) H&E staining of liver sections (scale bar: 250 μm) from representative CD, WD1, and WD5 males. *padj<0.05, **padj<0.01, ***padj<0.001.
Figure 3 with 2 supplements

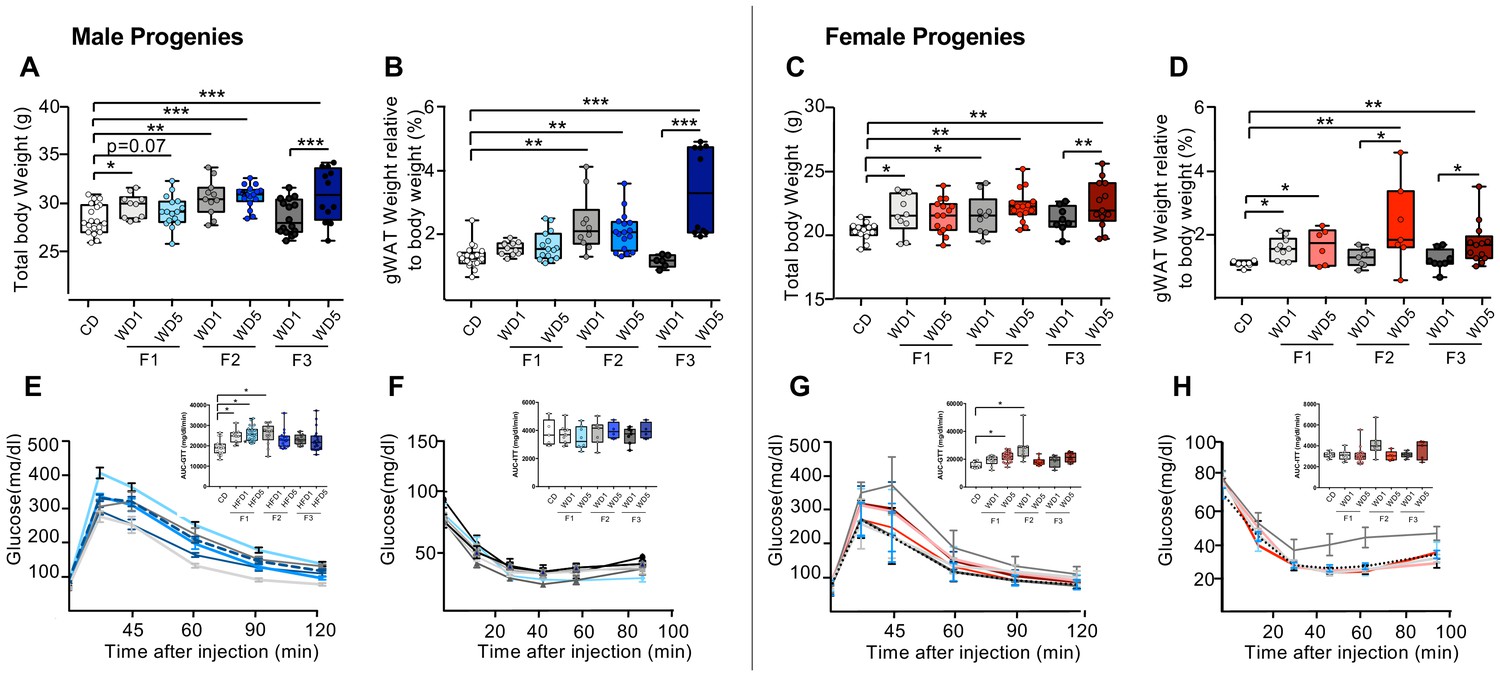
Maintenance of the overweight phenotype after four generations on the control diet (CD) in the progenies generated from Western diet (WD)5-fed males.
(A) Study design for the inheritance of WD-induced metabolic alterations in WD1- and WD5-fed animals. Four WD1 and nine WD5 male mice from different litters (arbitrary selected from the four different families) were mated with CD-fed females to generate F1-WD1 and F1-WD5 offspring, respectively. Each offspring was fed the CD. This crossing scheme was repeated three times to obtain the F2-, F3-, F4-WD1 and F2-, F3-, F4-WD5 offspring. The number of mice is indicated. Box-whiskers (min-max) of the median total body weights of 16-week-old males (B, D) and females (F, H) of progenies from WD-fed animals. Box-whiskers (min-max) of the median perigonadal white adipose tissue (gWAT) of males (C, E) and females (G, I) of progenies from WD-fed animals. The unimodality/multimodality of distributions for body weight for all groups was tested using the Hartigan’s Dip Test for unimodality/multimodality. All groups, except the F1-WD1 male progenies, followed a unimodal distribution. Gray rectangles and circles represent the male and female progenies, respectively, from WD1-fed animals. Blue rectangles and red circles represent the male and female progenies, respectively, from WD5-fed animals. *padj<0.05, **padj<0.01, ***padj<0.001.
-
Figure 3—source data 1
Physiological characteristics of F1, F2 and F3 male progenies from either WD1 or WD5 males.
- https://cdn.elifesciences.org/articles/61736/elife-61736-fig3-data1-v3.docx
-
Figure 3—source data 2
Physiological characteristics of F1, F2 and F3 female progenies from either WD1 or WD5 males.
- https://cdn.elifesciences.org/articles/61736/elife-61736-fig3-data2-v3.docx
Figure 3—figure supplement 1
Long-term epigenetic inheritance of a ‘healthy’ overweight phenotype in control diet (CD)-fed progenies from Western diet (WD)5 males.
Box-whiskers (min-max) of the median total body weight of the male (A) and female (C) F1-, F2-, F3-WD progenies (n ≥ 8 mice per group). Box-whiskers (min-max) of the median gonadal fat mass (gWAT) weight relative to total body weight in the male (B) and female (D) F1-, F2-, F3-WD progenies (n ≥ 8 mice per group). The evolution of glucose parameters in CD-fed male (E, F) and female (G, H) WD progenies. Above the glucose tolerance curves are representative corresponding box-whiskers (min-max) of the median area under the curve–glucose tolerance test (AUC-GTT) of each group (E, G). Above the insulin tolerance curves are representative corresponding box-whiskers (min-max) of the median AUC-ITT of each cohort (F, H) measured in each WD cohort. ∗p<0.05, ∗∗p<0.01, ∗∗∗p<0.001.
Figure 3—figure supplement 2
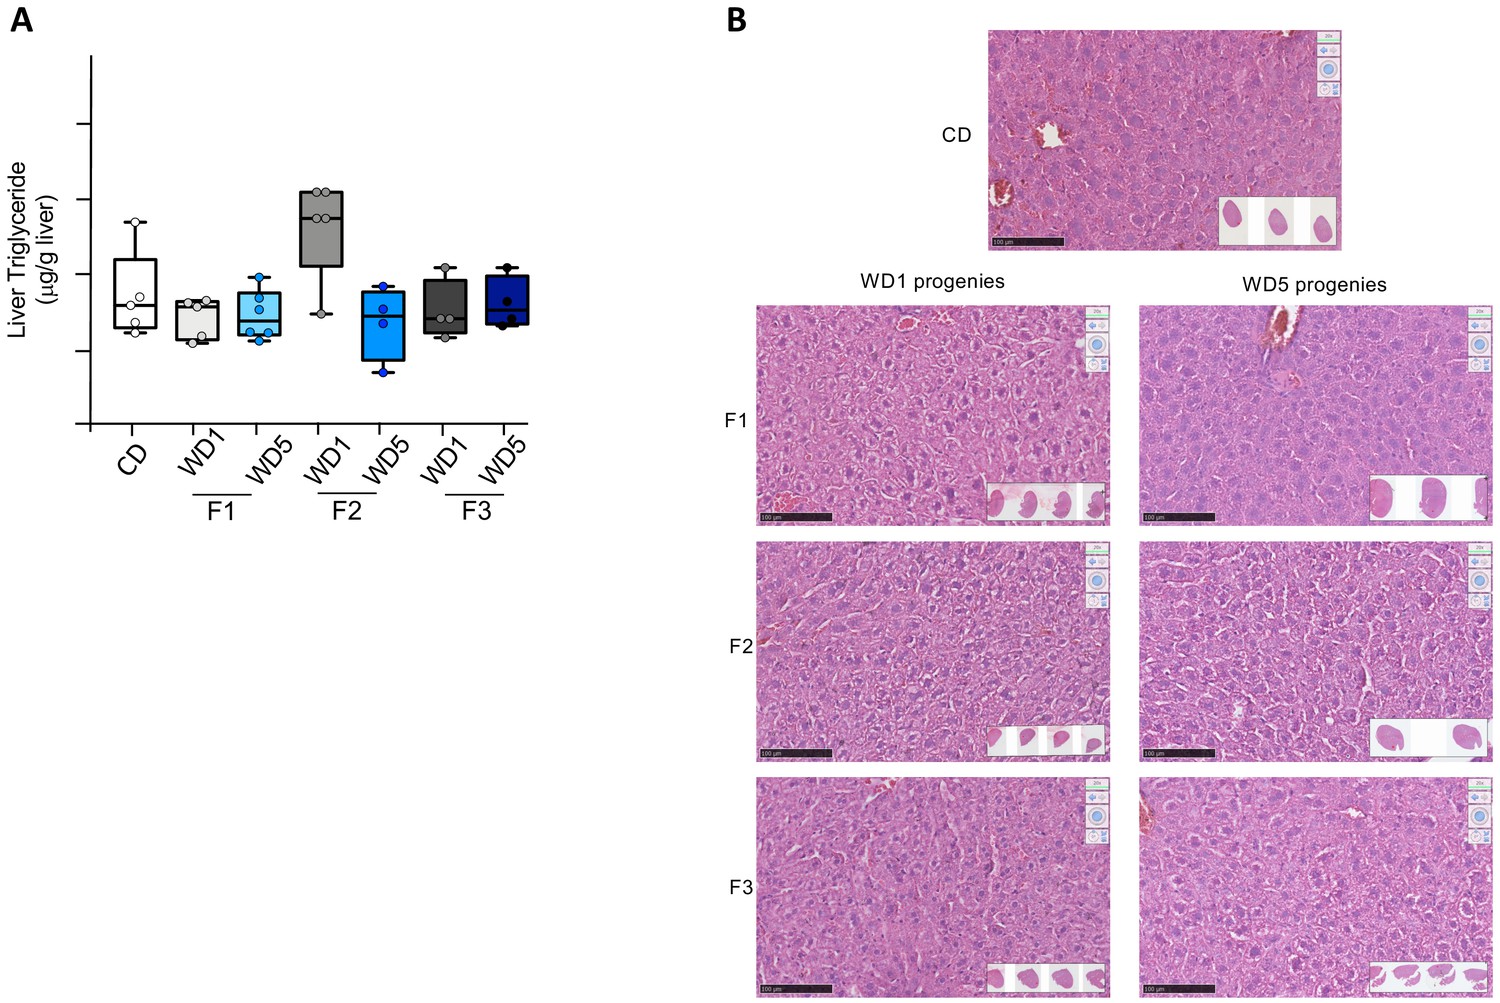
No liver alteration was observed in the control diet (CD)-fed progenies from Western diet (WD)1 and WD5 males.
(A) Liver triglyceride contents in CD, WD1, and WD5 CD-fed progenies, n ≥ 4/group. (B) H&E staining of liver sections (scale bar: 250 μm) in representative F1, F2, and F3 CD-fed progenies of CD, WD1, and WD5 males.
Figure 4

Sperm small non-coding RNAs (sncRNAs) signature modulated by the ancestors’ diet.
(A) Representative bioanalyzer profiles of control diet (CD), Western diet (WD)1, and WD5 sperm total RNAs. (B) Length distribution and pattern changes of sperm sncRNA different populations (miRNAs piRNAs, tsRNAs, and rsRNA) in one representative CD, WD1, and WD5. Each graph was generated by SPORTS1.0 (27). (C) Small RNA-seq profiles of each CD, WD1, and WD5 male. (D) Mean proportion of each small RNA population across each group. (E) The normalized small RNA levels from the CD (blue spots), WD1 (red spots), and WD5 (green spots) sperm were analyzed by principal component analysis (PCA). One WD5 fell outside the PCA cluster and was arbitrarily removed for differential expression analysis. (F) Venn diagram of small RNA sequences differentially expressed in WD1 and WD5 sperm. The numbers of small RNAs that are unique for each WD1 and WD5 male are shown in each circle. The numbers of genes in overlapping (common) are indicated at the intersections of the sets in the Venn diagram (Padj<0.05 Log2FC≥|0.6|). (G) Scatter plots of microRNAs or piRNAs, tRNA fragments, and other small RNAs differentially expressed (Padj<0.05 |Log2FC| ≥ 0.6) in WD1 (left panel) and WD5 (right panel) sperm compared to their expression in the CD sperm cohort.
-
Figure 4—source data 1
Differentially expressed small RNAs in WD1 sperm.
- https://cdn.elifesciences.org/articles/61736/elife-61736-fig4-data1-v3.xlsx
-
Figure 4—source data 2
Differentially expressed small RNAs in WD5 sperm.
- https://cdn.elifesciences.org/articles/61736/elife-61736-fig4-data2-v3.xlsx
Figure 5 with 1 supplement

Zygotic microinjection of sperm total RNA from either Western diet (WD)1 or WD5 males induces metabolic alterations in the F1 and F2 control diet (CD)-fed progenies that are not maintained in the F3 and F4 CD-fed progenies.
(A) Study design for the inheritance of metabolic alterations induced after the microinjection of sperm total RNA from CD-, WD1-, or WD5-fed males into C57BL/6J zygotes. Five F1 CD-fed males from each set of RNA microinjections were mated with CD-fed females to generate F2-RNA offspring. Each offspring was fed a control diet. This crossing scheme was repeated twice to obtain the F3-RNA offspring and then the F4-RNA offspring. (B) Box-whiskers (min-max) of the median total body weight of the F1-, F2-, F3-, and F4-RNA male progenies (n ≥ 8 mice per group). (C) Box-whiskers (min-max) of the median perigonadal white adipose tissue (gWAT) weight relative to total body weight in the different RNA progenies. The evolution of glucose parameters in male mice from RNA-injected progenies. (D) Box-whiskers (min-max) of the median area under the curve–glucose tolerance test (AUC-GTT) of each cohort. (E) Box-whiskers (min-max) of the median AUC-ITT of each group. (F) Bivariate correlation between the body weight of the F2-RNA-CD, F2-RNA-WD1, and F2-RNA-WD5 progenies and the AUC-GTT (n = 38). This correlation was similar using parametric (Pearson, r = 0.4, p=0.01) or nonparametric (Spearman, r = 0.4, p=0.01) correlations. *padj<0.05, **padj<0.01, ***padj<0.001.
-
Figure 5—source data 1
Physiological characteristics of male and female F1-RNA-progenies.
- https://cdn.elifesciences.org/articles/61736/elife-61736-fig5-data1-v3.docx
-
Figure 5—source data 2
Physiological characteristics of male and female F2-RNA- progenies.
- https://cdn.elifesciences.org/articles/61736/elife-61736-fig5-data2-v3.docx
-
Figure 5—source data 3
Physiological characteristics of male and female F3-RNA- progenies.
- https://cdn.elifesciences.org/articles/61736/elife-61736-fig5-data3-v3.docx
-
Figure 5—source data 4
Physiological characteristics of male and female F4-RNA- progenies.
- https://cdn.elifesciences.org/articles/61736/elife-61736-fig5-data4-v3.docx
Figure 5—figure supplement 1
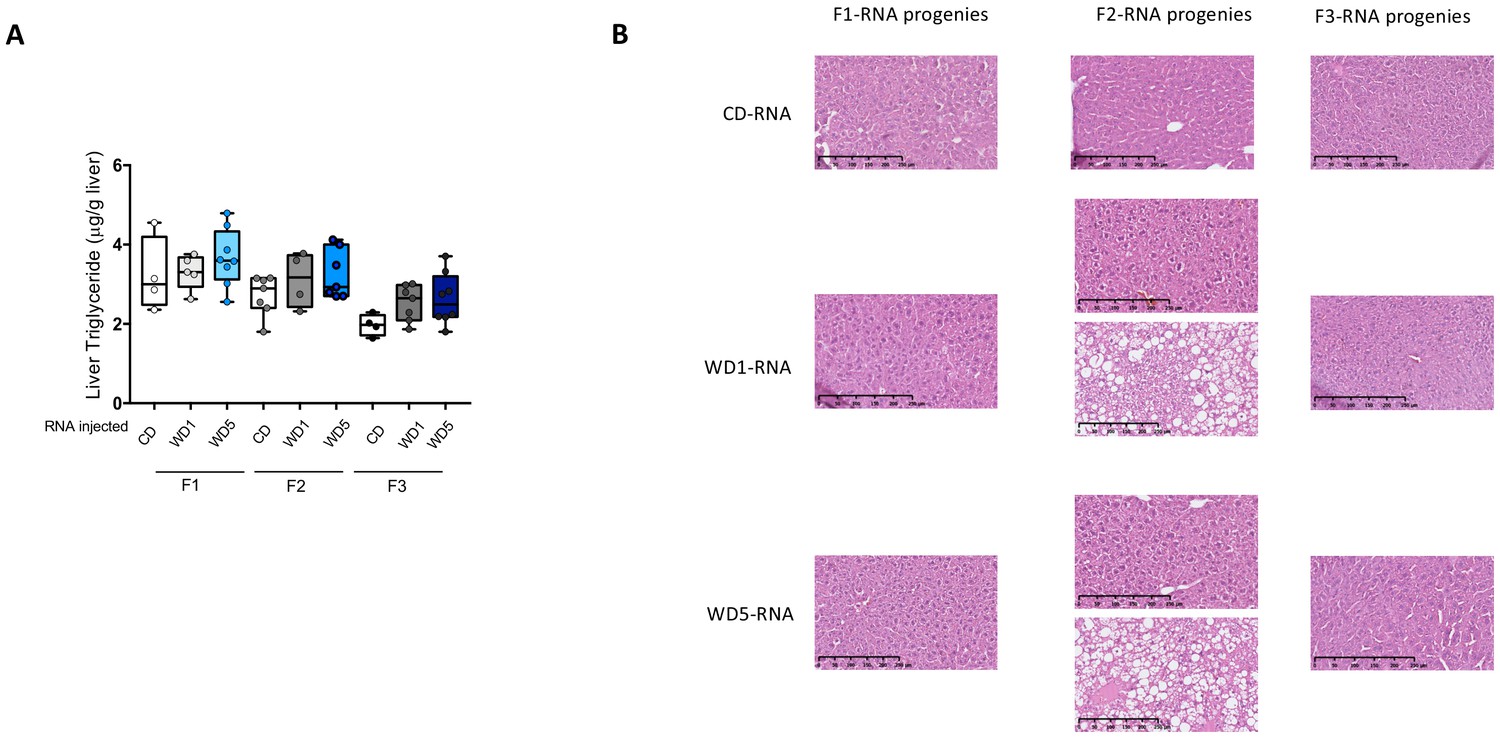
Sperm RNA microinjection did not fully recapitulate the fatty liver phenotype of the WD5 father.
(A) Liver triglyceride contents in F1, F2, and F3 progenies of CD-RNA-, WD1-RNA-, and WD5-RNA-injected groups. (B) H&E staining of liver sections (scale bar: 250 μm) in representative F1, F2, and F3 CD-fed progenies of CD-RNA-, WD1-RNA-, and WD5-RNA-injected groups. WD: Western diet; CD: control diet.
Tables
Table 1
Evolution of serum biomarker parameters in different WD groups.
| Parameters | Control n = 6 | WD1 n = 4 | WD2 n = 5 | WD3 n = 7 | WD4 n = 7 | WD5 n = 7 |
|---|---|---|---|---|---|---|
| Adiponectin (ng/ml) | 4.4 (4.9–5.2) | 5.2 (3.3–6.9) | 3.5 (2.8–4.7) | 3.4 (2.8–5.5) | 3.6 (2.9–4.2) | 4.6 (3.5–5.0) |
| Leptin (ng/ml) | 6.7 (5.1–7.5) | 10.2 (6.2–11) | 8.2 (6.2–11.6) | 11.5 (7.9–28) | 19 (13–32)**2 | 21 (12–26)**2 |
| CRP (g/ml) | 4.2 (3.2–5.0) | 5.8 (5.1–6.2) | 5.7 (5.4–6.2) | 7.1 (5.7–9.8)** | 5.7 (3.5–7.9)* | 5.8 (4.6–7.4)** |
| Total cholesterol (mg/dl) | 1.1 (0.9–1.2) | 1.8 (1.3–2.0)** | 1.4 (1.0–1.6) | 1.6 (1.5–1.9)* | 1.9 (1.6–2.4)***2 | 1.9 (1.6–2.4)***2 |
-
Values are expressed as median (IQR). Numbers are in bold if padj<0.05.
* and 2 denote the WD groups significantly different from that of the CD and WD2 groups, respectively.
-
*padj<0.05, **padj<0.01.
WD: Western diet; CD: control diet; CRP: C-reactive protein.
Additional files
Download links
A two-part list of links to download the article, or parts of the article, in various formats.
Downloads (link to download the article as PDF)
Open citations (links to open the citations from this article in various online reference manager services)
Cite this article (links to download the citations from this article in formats compatible with various reference manager tools)
Paternal multigenerational exposure to an obesogenic diet drives epigenetic predisposition to metabolic diseases in mice
eLife 10:e61736.
https://doi.org/10.7554/eLife.61736


