Non-canonical Hedgehog signaling regulates spinal cord and muscle regeneration in Xenopus laevis larvae
- Department of Physiology & Membrane Biology Shriners Hospitals for Children Northern California, University of California, Sacramento, School of Medicine, United States
Figures
Figure 1 with 2 supplements
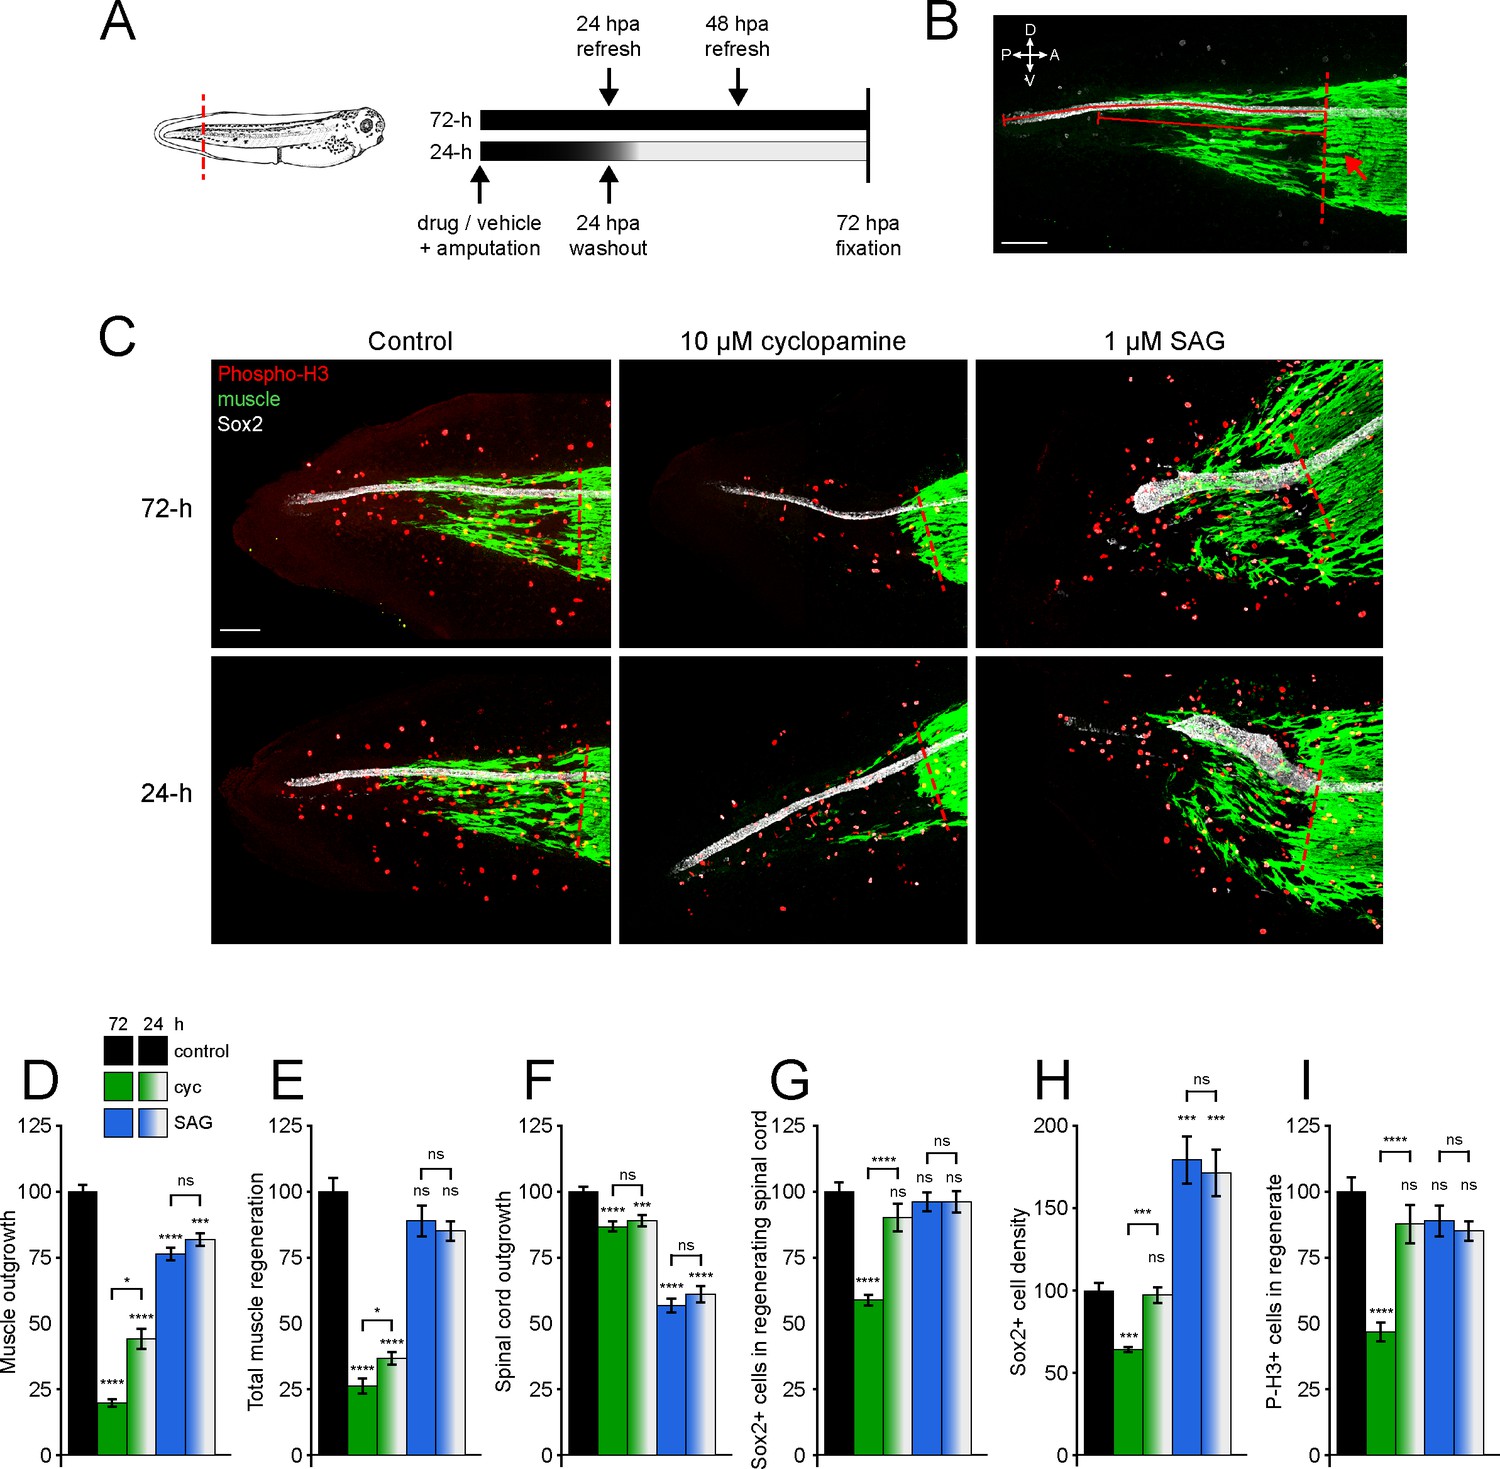
Hedgehog signaling regulates spinal cord and muscle regeneration.
Stage 39–40 Xenopus laevis larvae were incubated for 24 or 72 h after tail amputation in vehicle (0.1% DMSO, Control), antagonist (10 µM cyclopamine, cyc), or agonist (1 µM SAG) of Smoothened (Smo), and immunostained at 72 h post amputation (hpa). (A) Schematics of tail amputation and 24 vs. 72 h treatments. (B) Measurement of outgrowth for regenerated spinal cord and muscle (solid lines) from amputation plane (dashed line), identified by the posterior-most close-packed band of muscle fibers (arrow). (C) Representative z-projections of whole-mount immunostained samples for each group at 72 hpa. Transverse red dashed line indicates amputation plane. Scale bars in (B, C), 100 µm. (D–I) Graphs show mean ± SEM regenerated muscle outgrowth (D) and total new muscle volume (E), regenerated spinal cord outgrowth (F), total number (G), and per length density (H) of Sox2+ cells in the regenerated spinal cord, and number of phospho-histone H3+ (P-H3+) cells (I) in the regenerate at 72 hpa as % of cohort-matched control. n of larvae: 25–42 per group, N of experiments ≥ 3. *p<0.05, ***p<0.001, ****p<0.0001, ns: not significant, ordinary one-way ANOVA, Brown–Forsythe and Welch ANOVA, or Kruskal–Wallis test, followed by Tukey’s, Dunnett’s T3, or Dunn’s multiple comparisons test, respectively, according to prior normality and equality of SDs tests within and between groups.
-
Figure 1—source data 1
Hedgehog signaling regulates spinal cord and muscle regeneration.
- https://cdn.elifesciences.org/articles/61804/elife-61804-fig1-data1-v2.xlsx
Figure 1—figure supplement 1
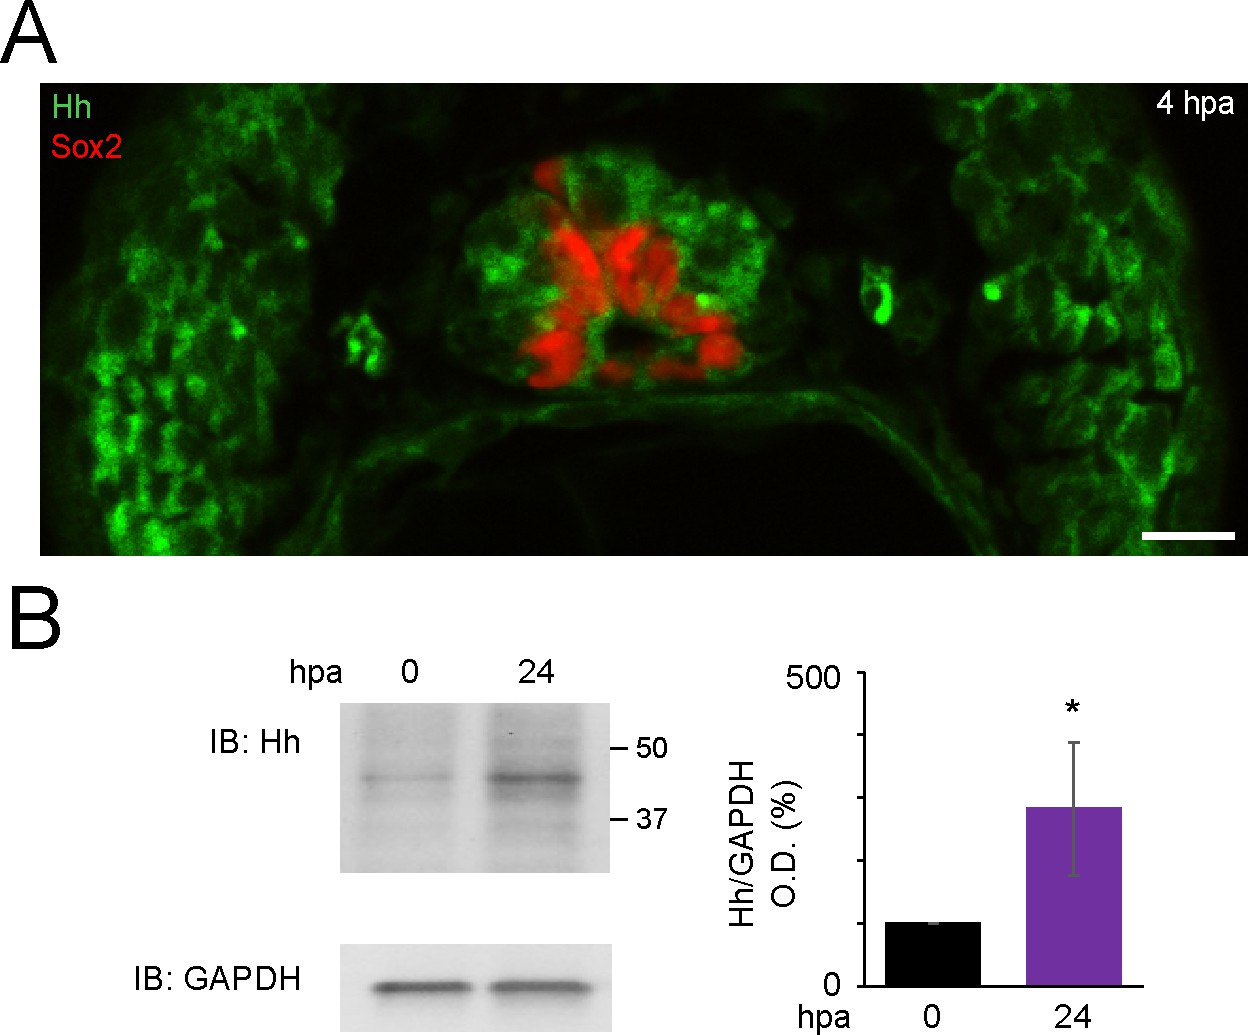
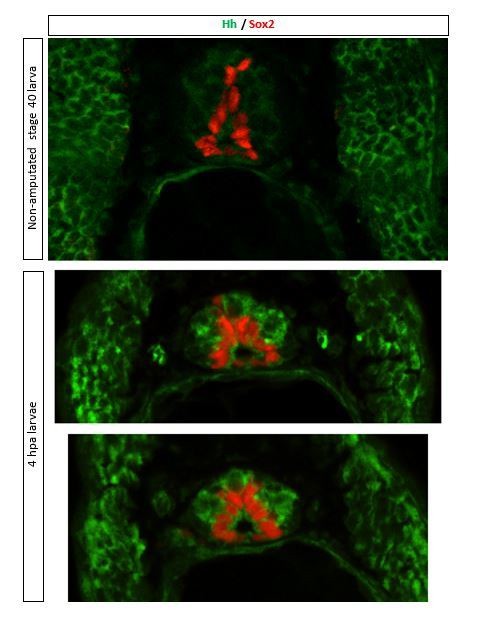
Expression of Hedgehog (Hh) ligands is apparent in stage 40 larvae and increases after amputation in the regenerating tail.
(A) Representative image of transverse section of tail from 4 h post amputation (hpa) stage 40 larva, stained for Sox2 and Hh (5E1 antibody that recognizes Xenopus Sonic hedgehog [Shh] and Ihh). Scale bar, 10 μm. (B) Representative western blot assay of whole-cell lysates from 500-μm-long most posterior tail from stage 40 larvae right after (0 hpa) and 24 hpa. Predicted full-length Hh MW 45–47 kD. GAPDH (bottom) was used as loading control. Graph shows mean ± SEM% of 0 hpa Hh/GAPDH optical density (O.D.), n = 18 larvae per group, N = 3 experiments, *p<0.05, paired t-test.
-
Figure 1—figure supplement 1—source data 1
Treatment with Smoothened (Smo) antagonist vismodegib reduces muscle and spinal cord regeneration.
- https://cdn.elifesciences.org/articles/61804/elife-61804-fig1-figsupp1-data1-v2.xlsx
Figure 1—figure supplement 2
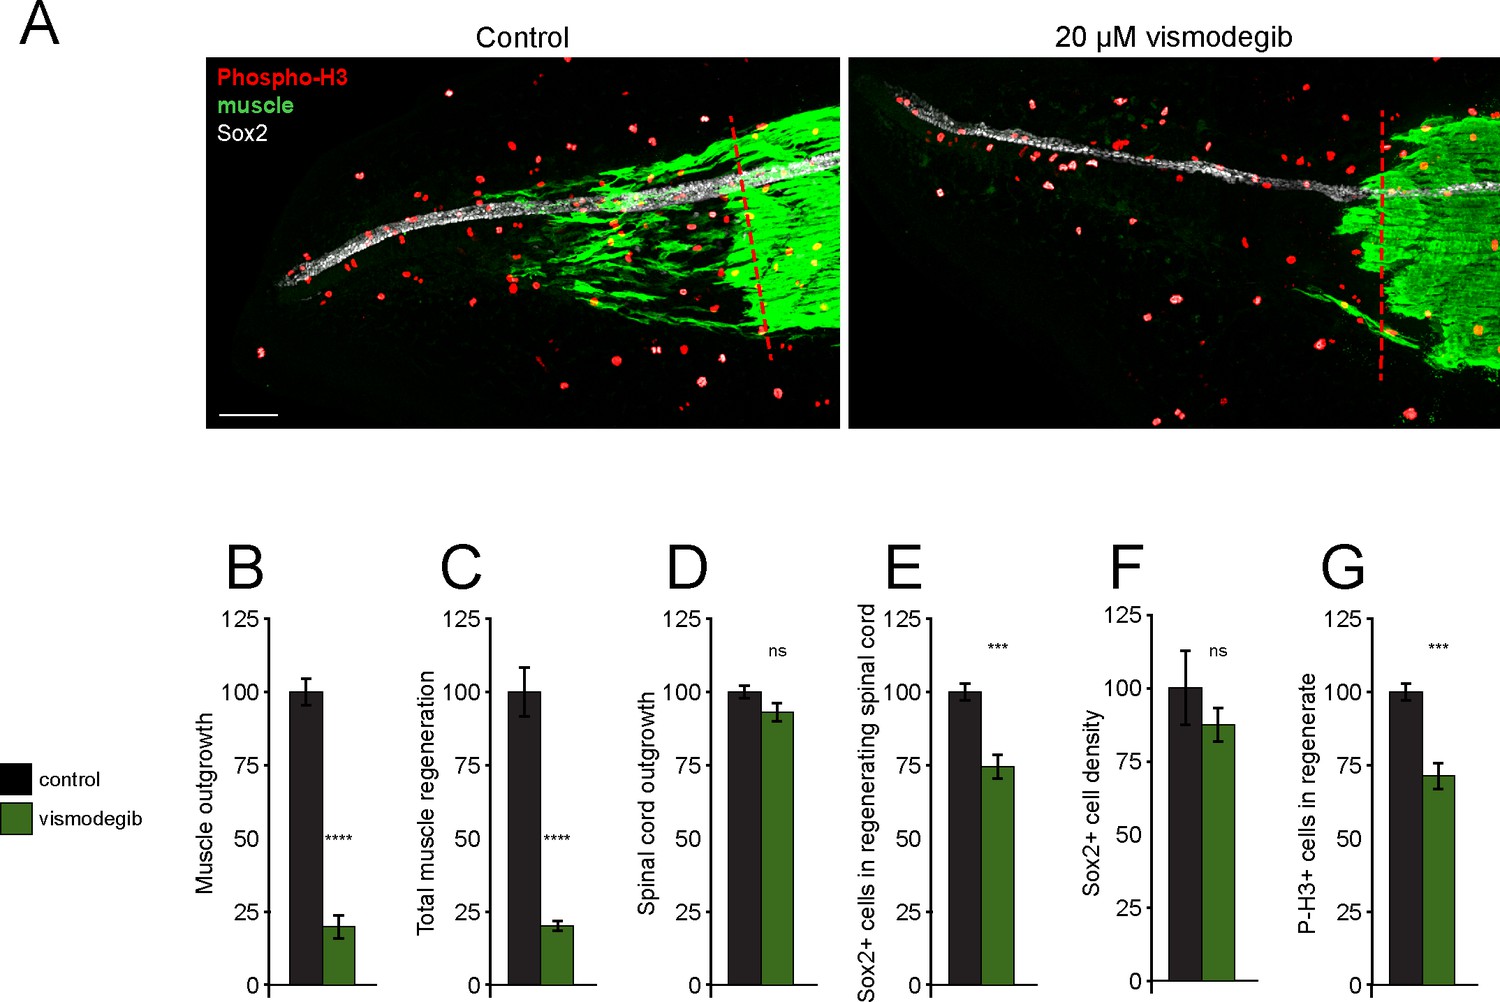
Treatment with Smoothened (Smo) antagonist vismodegib reduces muscle and spinal cord regeneration.
Stage 39–40 X. laevis larvae were incubated with vehicle (0.1% DMSO, Control) or 20 µM vismodegib for 72 hr, then immunostained. (A) Representative z-projections of whole-mount immunostained samples for both groups at 72 h post amputation (hpa). Transverse red dashed line indicates amputation plane. Scale bar 100 µm. (B–G) Graphs show mean ± SEM regenerated muscle outgrowth (B) and total new muscle volume (C), regenerated spinal cord outgrowth (D), total number (E) and per length density (F) of Sox2+ cells in the regenerated spinal cord, and number of phospho-histone H3+ (P-H3+) cells (G) in the regenerate at 72 hpa as % of cohort-matched control. N of larvae: 8–10 samples per group. ***p<0.001, ****p<0.0001, ns: not significant, two-tailed t-test.
Figure 2 with 1 supplement
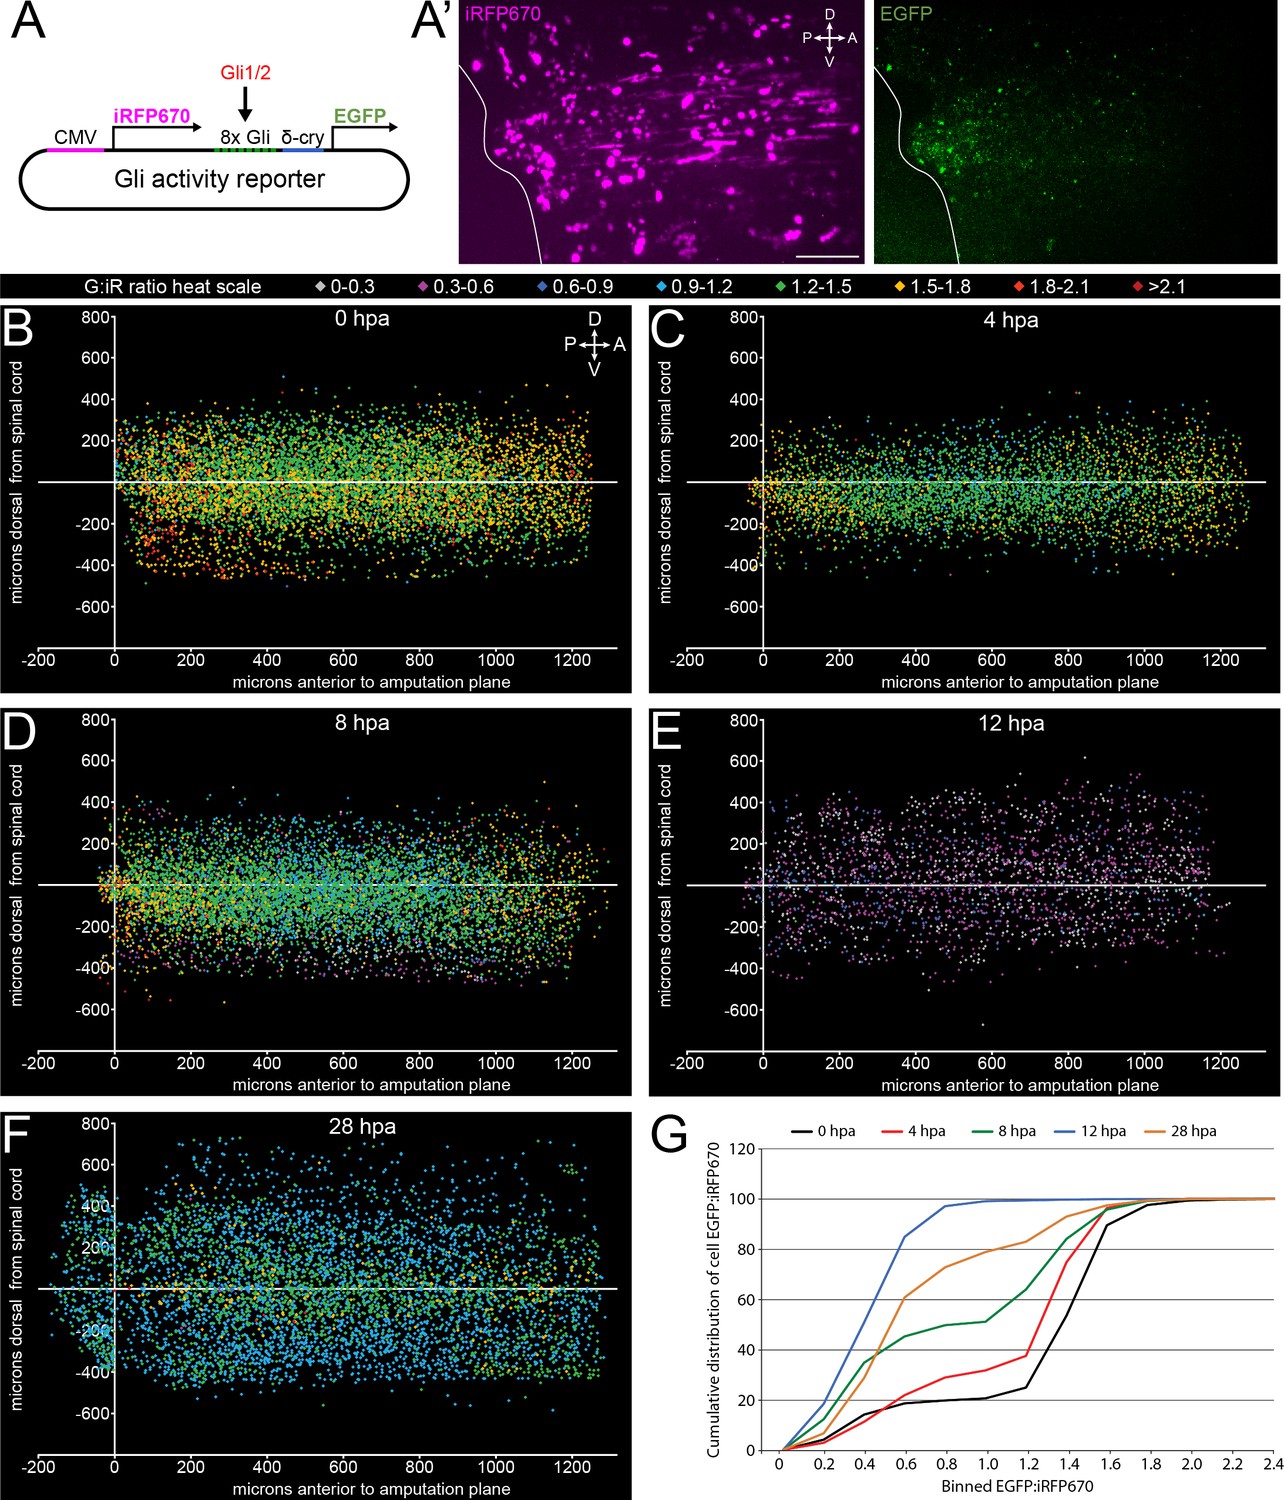
Canonical, Gli-dependent Hedgehog signaling is downregulated following tail amputation.
Tails of stage 39–40 larvae expressing the Gli transcriptional activity reporter were amputated, and larvae imaged live at intervals from 0 to 28 h post amputation (hpa). (A) Schematic of bicistronic reporter plasmid. Constitutive promoter CMV drives expression of iRFP670, and minimal δ-crystallin promoter juxtaposed to eight Gli-binding sites drives expression of enhanced green fluorescent protein (EGFP). (A’) Representative z-projections of normalizing factor (iRFP670) and Gli transcriptional activity reporter (EGFP) in amputated larval tail at 12 hpa. White outline represents the edge of the tail. Scale bar, 100 µm. (B–F) 2D composite of EGFP:iRFP670 (G:iR ratio) intensity displayed by heat scale at indicated hpa from combined iRFP670+ cells. Cell location displayed by position relative to amputation plane (x) and dorsal or ventral to the spinal cord (y). (G) Cumulative distribution of EGFP:iRFP670 ratios by time point. All cumulative distribution curves significantly different from control (0 hpa); N of larvae ≥12; p<0.001, all time points compared to 0 hpa, Kolmogorov–Smirnov post-hoc test.
-
Figure 2—source data 1
Canonical, Gli-dependent Hedgehog signaling is downregulated following tail amputation.
- https://cdn.elifesciences.org/articles/61804/elife-61804-fig2-data1-v2.xlsx
Figure 2—figure supplement 1
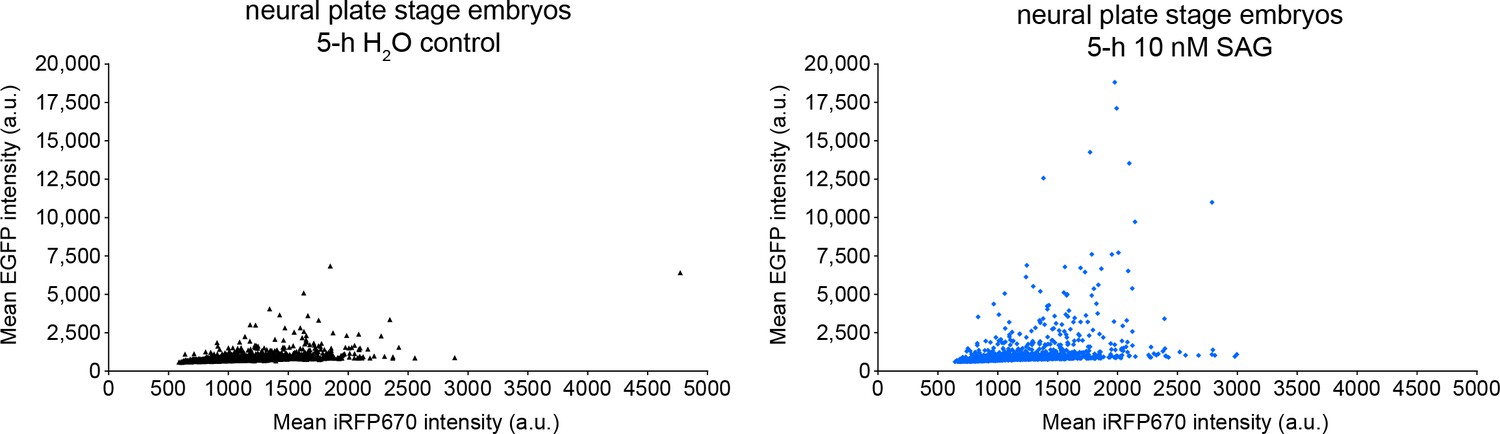
Positive control for Gli transcriptional activity reporter.
Neural plate stage embryos (18 h post-fertilization) expressing Gli transcriptional activity reporter were incubated in the presence or absence of 10 nM SAG for 5 h followed by live confocal imaging with 488 and 647 nm lasers to acquire the signal corresponding to Gli transcriptional activity (enhanced green fluorescent protein [EGFP]) and expression level for the reporter (iRF670). Individual cells displayed by iRFP670 (x) vs. EGFP (y) fluorescence intensities in control and experimental embryos. Distribution of control vs. SAG EGFP:iRFP670 values significantly different by Kolmogorov–Smirnov test (p<0.0001; N of embryos per condition: 8).
-
Figure 2—figure supplement 1—source data 1
Positive control for Gli transcriptional activity reporter.
- https://cdn.elifesciences.org/articles/61804/elife-61804-fig2-figsupp1-data1-v2.xlsx
Figure 3 with 1 supplement
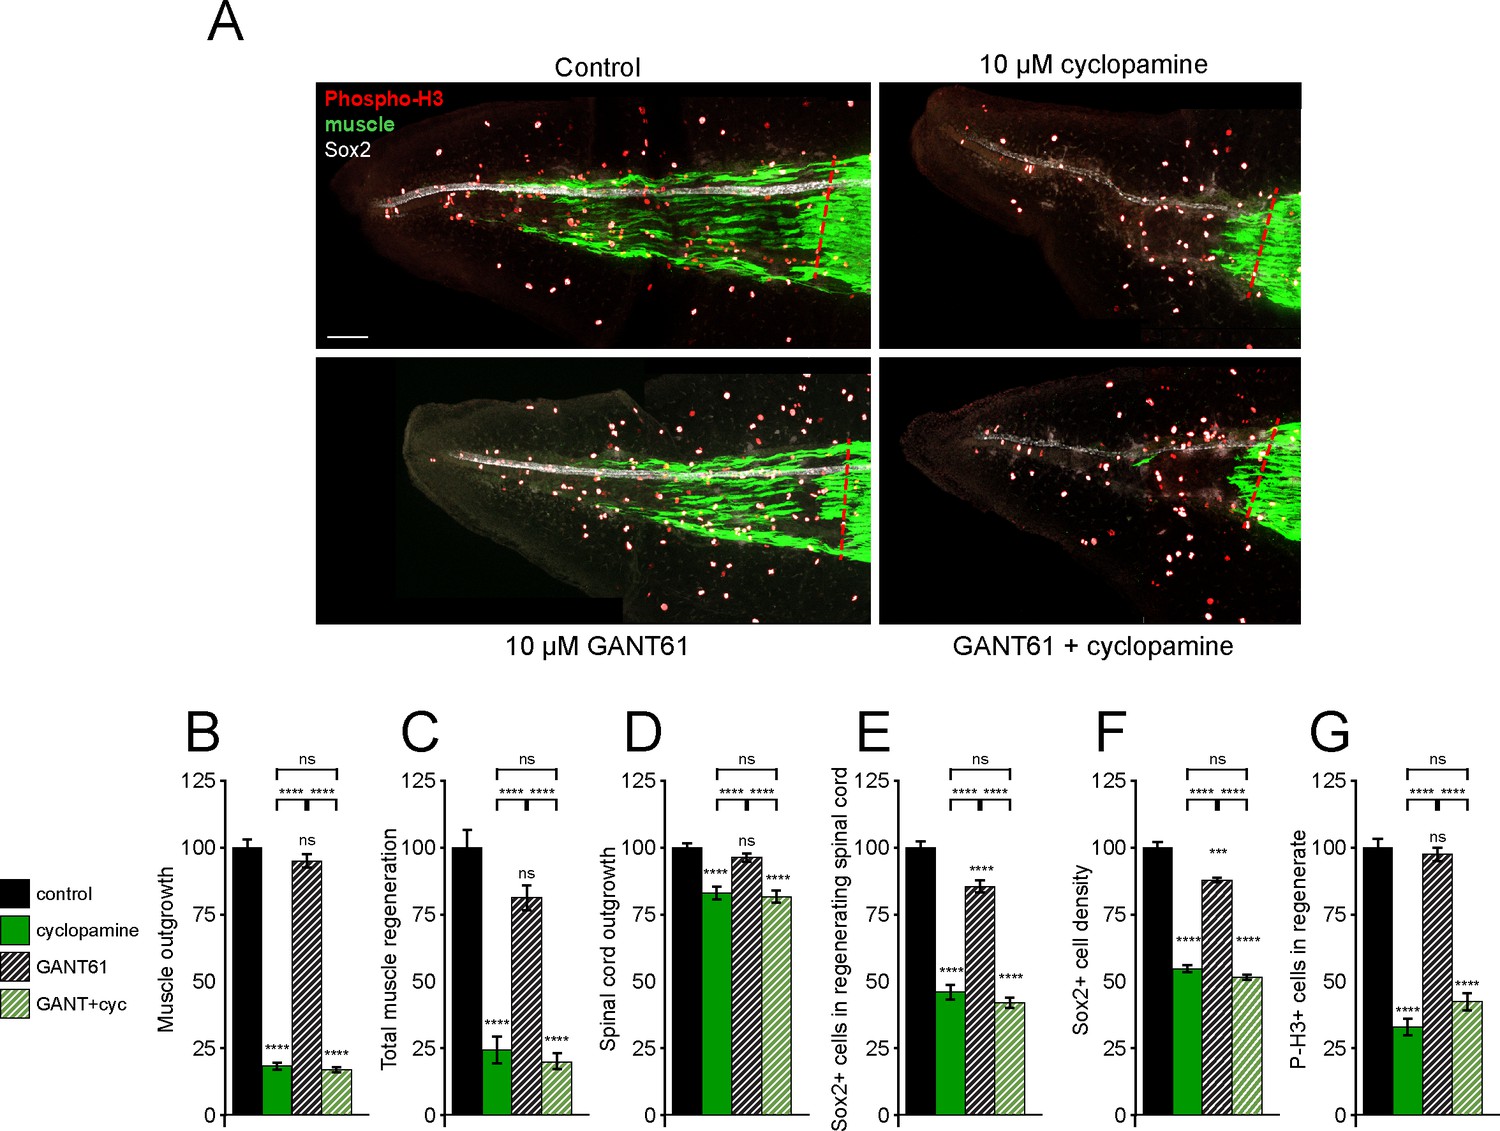
Gli1/2 transcriptional activity is not necessary for spinal cord and muscle regeneration.
Stage 39–40 larvae were incubated for 72 h after tail amputation in vehicle (0.1% DMSO, Control) or Gli1/2 antagonist (10 µM GANT61, GANT) and/or 10 µM cyclopamine (cyc), then whole-mount immunostained. (A) Images show representative z-projections for each group at 72 h post amputation (hpa). Transverse red dashed line indicates amputation plane. Scale bar, 100 µm. (B–G) Graphs show mean ± SEM regenerated muscle outgrowth (B) and total volume (C), regenerated spinal cord outgrowth (D), total number (E) and per length density (F) of Sox2+ cells in the regenerated spinal cord, and overall number of phospho-histone H3+ (P-H3+) cells (G) in the regenerate at 72 hpa as % of cohort-matched control, n of larvae: 13–31 per group, N of experiments ≥ 3. ***p<0.001, ****p<0.0001, ns: not significant, ordinary one-way ANOVA, Brown–Forsythe and Welch ANOVA, or Kruskal–Wallis test, followed by Tukey’s, Dunnett’s T3, or Dunn’s multiple comparisons test, respectively, according to prior normality and equality of SDs within and between groups.
-
Figure 3—source data 1
Gli1/2 transcriptional activity is not necessary for spinal cord and muscle regeneration.
- https://cdn.elifesciences.org/articles/61804/elife-61804-fig3-data1-v2.xlsx
Figure 3—figure supplement 1
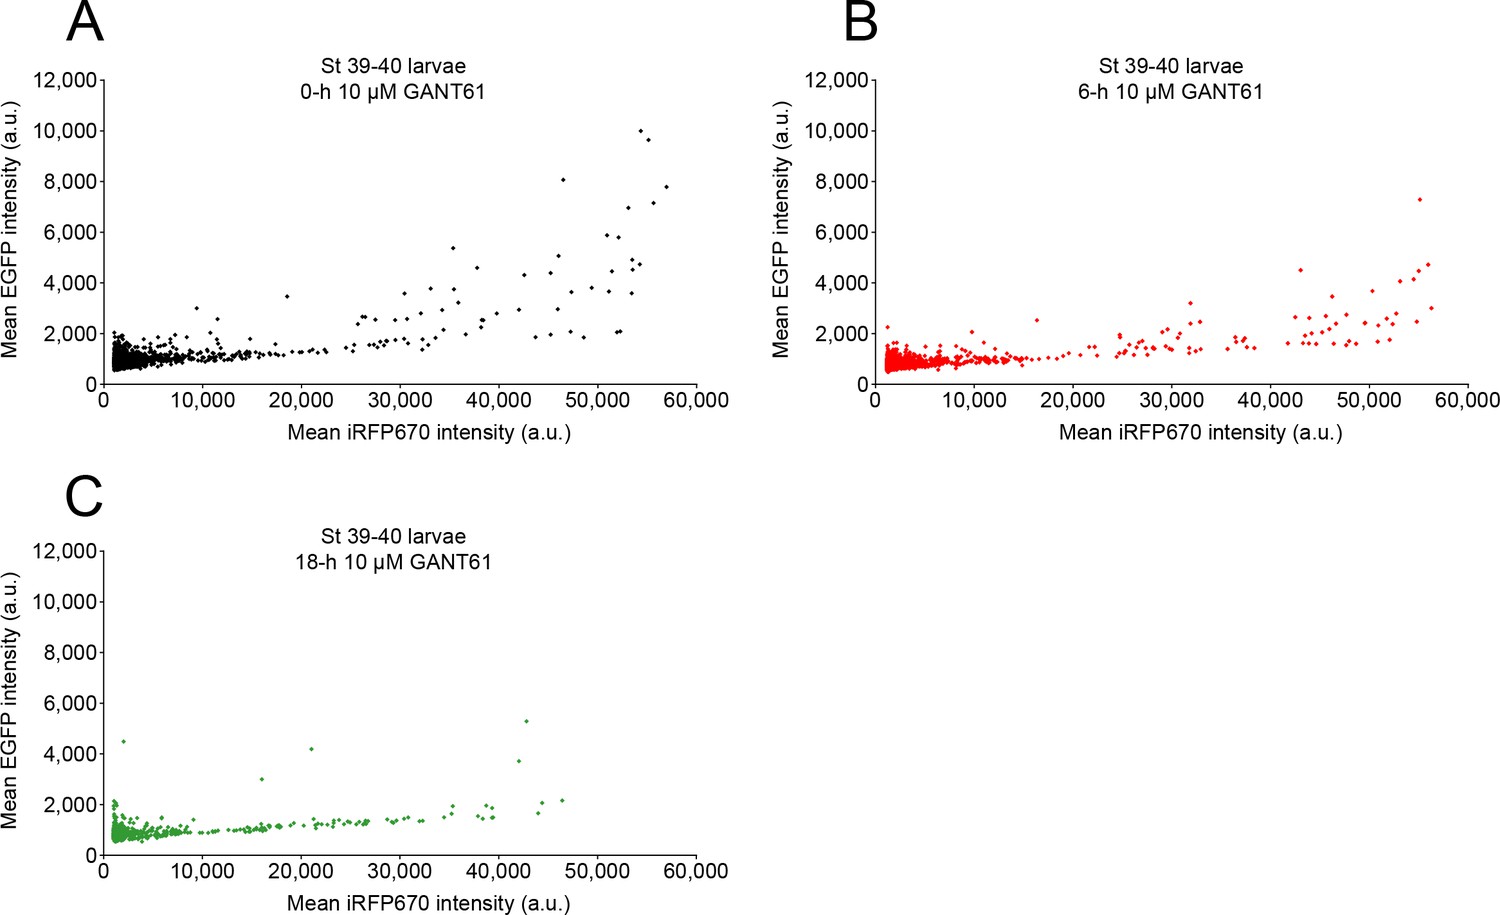
Treatment with GANT61 inhibits Gli1/2 transcriptional activity.
Stage 39 larvae expressing the Gli transcriptional activity reporter were incubated with 10 µM GANT61 and confocally live-imaged with 488 and 647 nm lasers to acquire the signal corresponding to Gli transcriptional activity (enhanced green fluorescent protein [EGFP]) and expression level for the reporter (iRF670), at 0 (A), 6 (B), and 18 h (C) of incubation. Shown are paired EGFP and iRFP fluorescence intensities for individual cells at the indicated time points. Both 6 h (p=0.015) and 18 h (p<0.0001) time points showed significantly different distribution of EGFP:iRFP670 values from 0 h (Kolmogorov–Smirnov test; N of larvae: 8).
-
Figure 3—figure supplement 1—source data 1
Treatment with GANT61 inhibits Gli1/2 transcriptional activity.
- https://cdn.elifesciences.org/articles/61804/elife-61804-fig3-figsupp1-data1-v2.xlsx
Figure 4 with 1 supplement
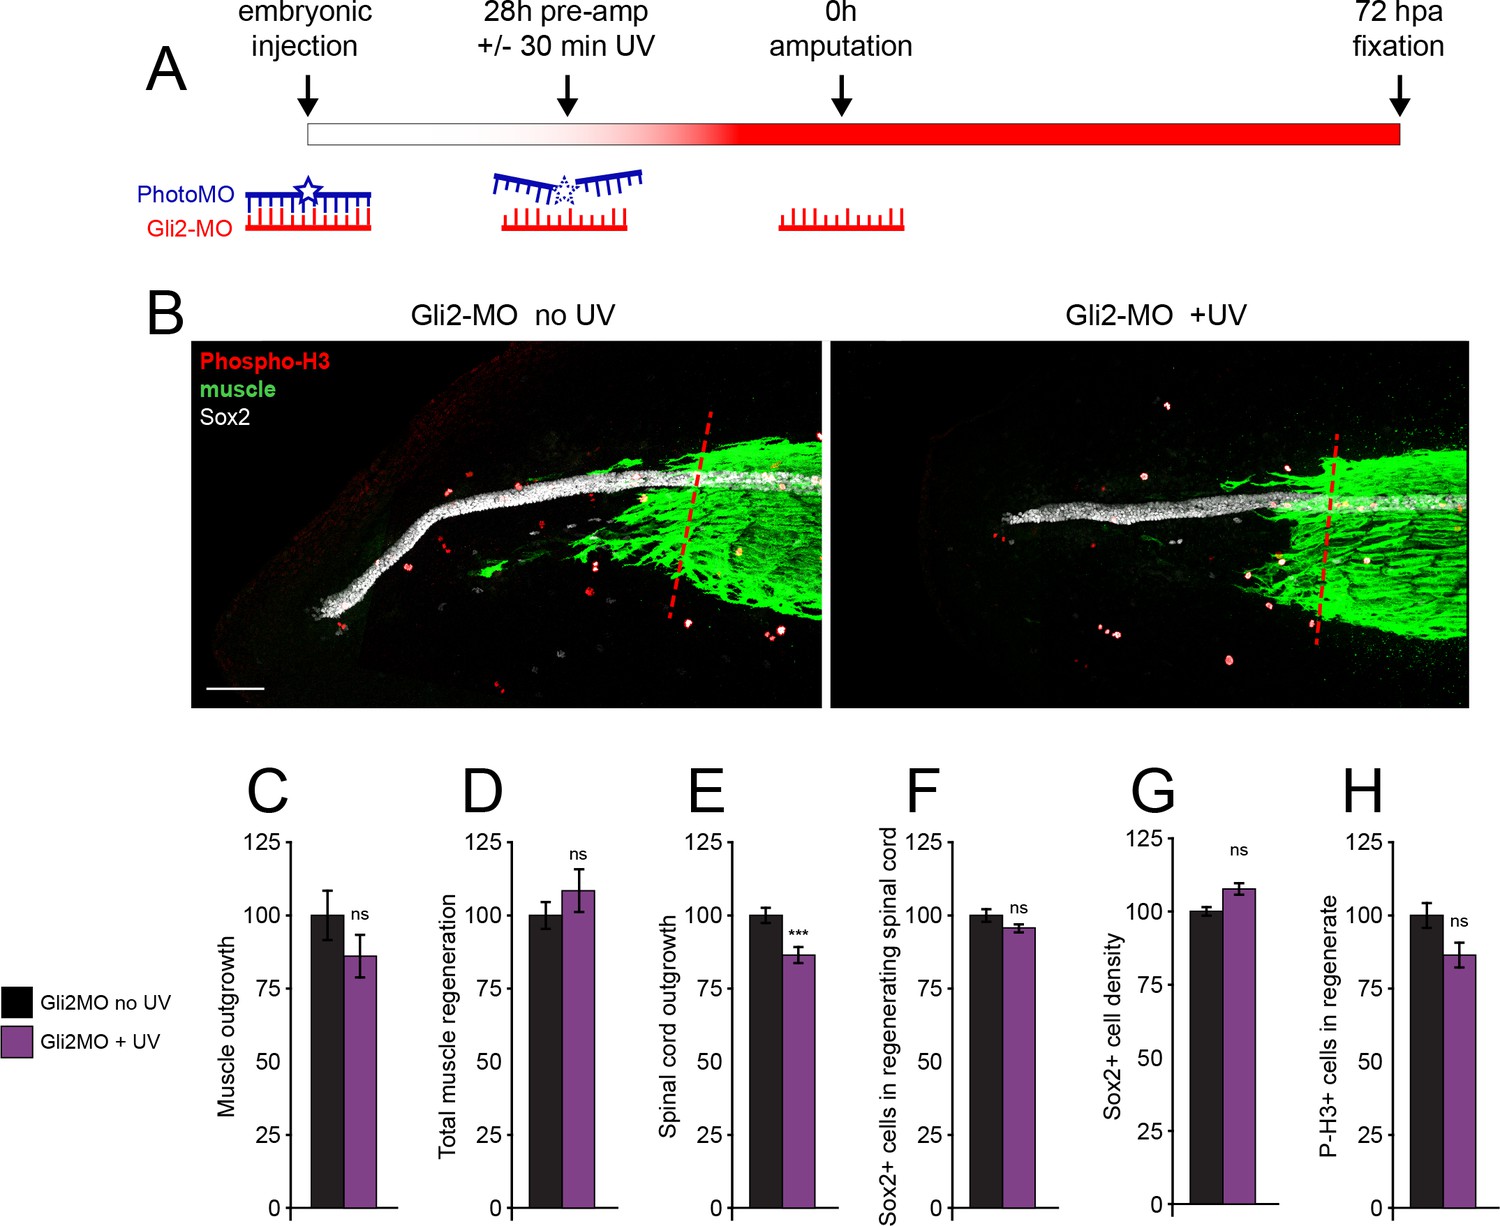
Genetic downregulation of canonical Hedgehog-Smoothened (Hh-Smo) signaling does not affect spinal cord and muscle regeneration.
Larvae containing Gli2 morpholino (Gli2-MO) bound to photo-morpholino were UV illuminated (+UV) or not (control, no UV) for 30 min, 28 h before (stage 28) amputation (stage 39–40), to uncage morpholino and induce downregulation of Gli2 expression. (A) Schematic of time course of morpholino activation and amputation. (B) Images show representative z-projections of samples for each group at 72 h post amputation (hpa). Transverse red dashed line indicates amputation plane. Scale bar, 100 µm. (C–H) Graphs show mean ± SEM regenerated muscle outgrowth (C) and total volume (D), regenerated spinal cord outgrowth (E), total number (F) and per length density (G) of Sox2+ cells in the regenerated spinal cord, and overall number of phospho-histone H3+ (P-H3+) cells (H) in the regenerate at 72 hpa as % of cohort-matched control, n of larvae: 16–35 per group, N of experiments ≥ 3. ***p<0.001, ns: not significant, unpaired t-test, Welch’s t-test, or Kolmogorov–Smirnov test, according to prior normality and equality of SDs tests within and between groups.
-
Figure 4—source data 1
Genetic downregulation of canonicalHedgehog-Smoothened(Hh-Smo)signaling does not affect spinal cord and muscle regeneration.
- https://cdn.elifesciences.org/articles/61804/elife-61804-fig4-data1-v2.xlsx
Figure 4—figure supplement 1
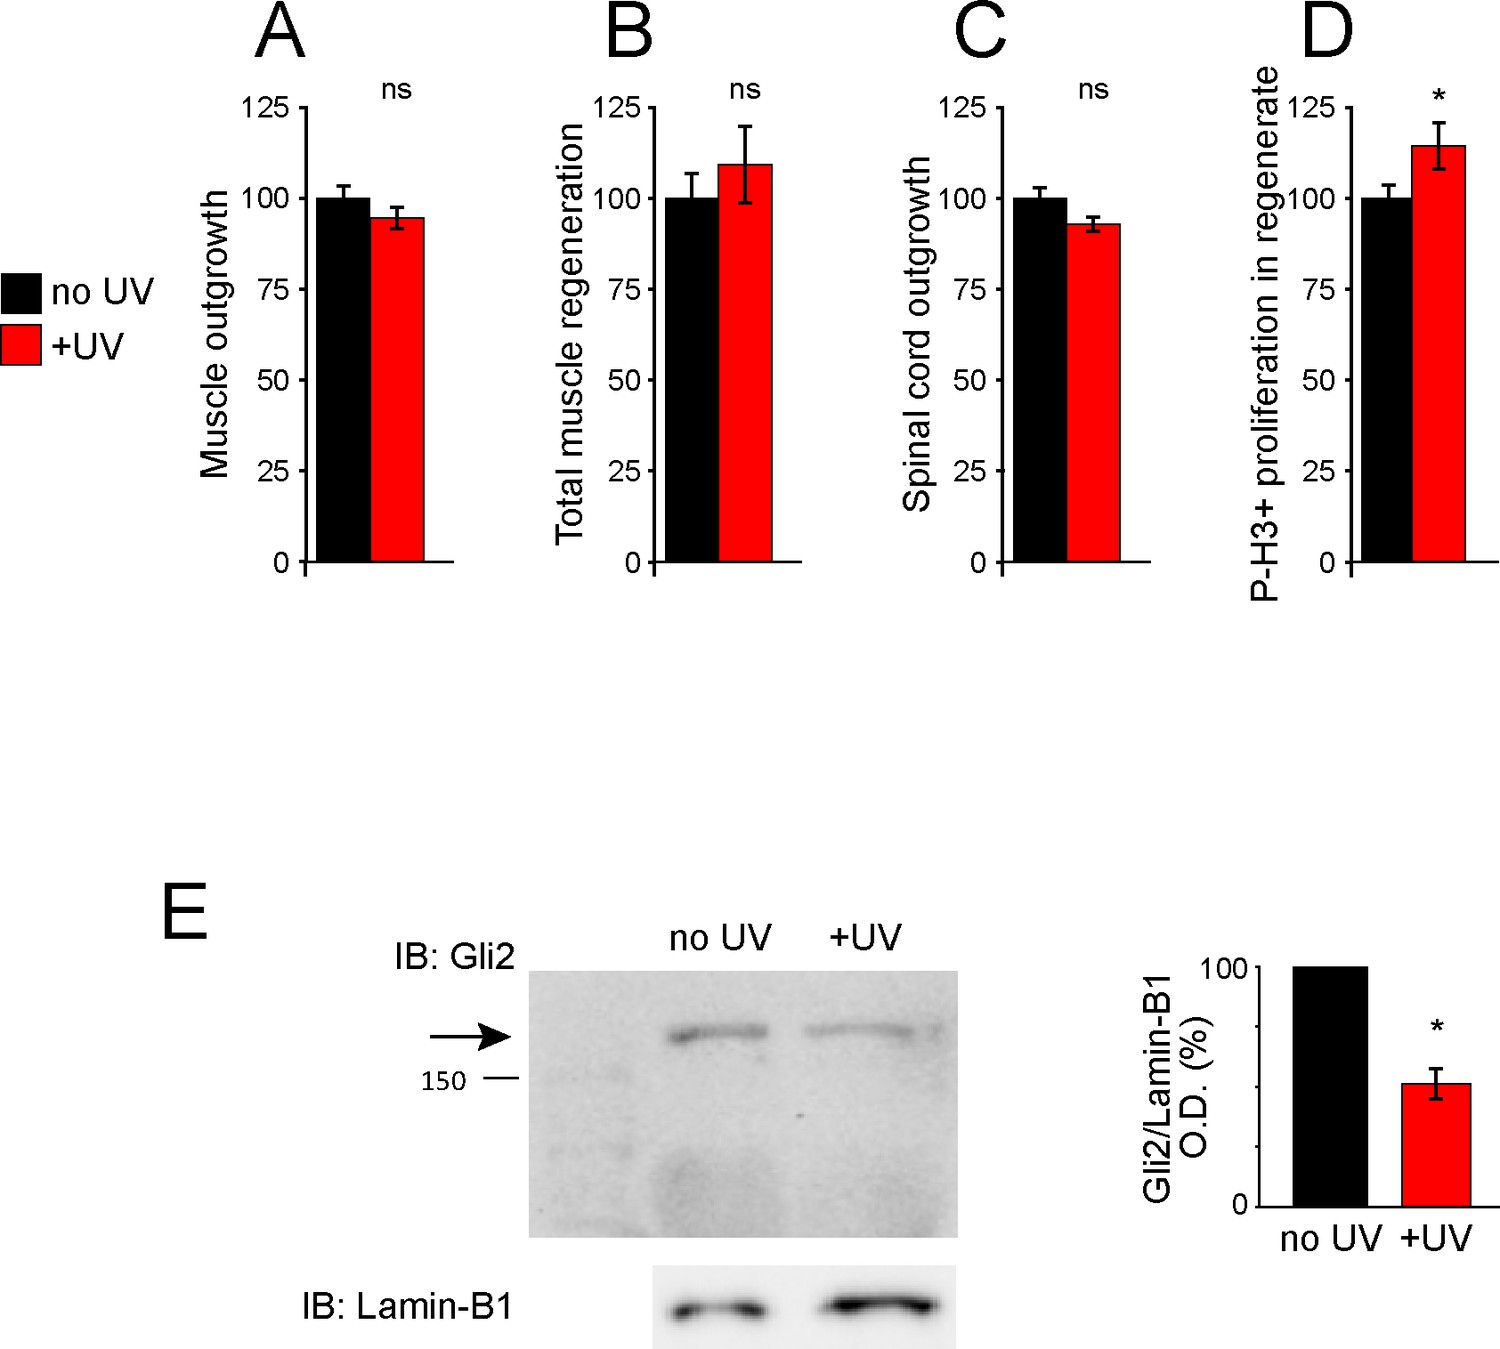
UV treatment does not reduce regeneration and uncages Gli2-MO, knocking down Gli2 expression.
Uninjected larvae (A–D) or larvae containing Gli2-MO bound to photo-morpholino (E) were UV illuminated (+UV) or not (control, no UV) for 30 min, 28 h (stage 28) before amputation (stage 39–40). Amputated samples were processed at 72 h post amputation (hpa) for whole-mount immunostaining (A–D) or frozen immediately for western blot assays (E). (A–D) Graphs show mean ± SEM regenerated muscle outgrowth (A) and total volume (B), regenerated spinal cord outgrowth (C), and overall number of phospho-histone H3+ (P-H3+) cells (D) in the regenerate at 72 hpa as % compared to control, n of larvae: 12–19 per group. *p<0.05, ns: not significant, unpaired t-test. (E) Representative western blot assay of whole-larva nuclear fraction lysates. Predicted full-length Gli2 MW ≥168 kD indicated by arrow. Lamin B1 (bottom) was used as loading control for nuclear fraction. Graph shows mean ± SEM% of control (no UV) Gli2/Lamin-B1 optical density (O.D.), n = 18 larvae per group, N = 3 separate experiments, *p=0.01, two-tailed t-test, resulting in a mean ± SEM% knockdown of 49 ± 6%.
-
Figure 4—figure supplement 1—source data 1
UV treatment does not reduce regeneration and uncages Gli2-MO, knocking down Gli2 expression.
- https://cdn.elifesciences.org/articles/61804/elife-61804-fig4-figsupp1-data1-v2.xlsx
Figure 5

Tissue-specific interaction between PKA and Smoothened (Smo) signaling in regulation of spinal cord and muscle regeneration.
Stage 39–40 larvae were incubated for 72 h after tail amputation in vehicle (0.1% DMSO, Control), PKA antagonist (10 µM KT5720, KT), or/and 10 µM cyclopamine (cyc). (A) Images show representative samples for each group at 72 h post amputation (hpa). Transverse red dashed line indicates amputation plane. Scale bar, 100 µm. (B–G) Graphs show mean ± SEM regenerated muscle outgrowth (B) and total volume (C), regenerated spinal cord outgrowth (D), total number (E) and per length density (F) of Sox2+ cells in the regenerated spinal cord, and overall number of phospho-histone H3+ (P-H3+) cells (G) in the regenerate at 72 hpa as % of cohort-matched control, n of larvae: 11–29 per group, N of experiments ≥ 3. *p<0.05, **p<0.01, ***p<0.001, ****p<0.0001, ns: not significant, ordinary one-way ANOVA, Brown–Forsythe and Welch ANOVA, or Kruskal–Wallis test, followed by Tukey’s, Dunnett’s T3, or Dunn’s multiple comparisons test, respectively, according to prior normality and equality of SDs within and between groups.
-
Figure 5—source data 1
Tissue-specific interaction between PKA and Smoothened(Smo)signaling in regulation of spinal cord and muscle regeneration.
- https://cdn.elifesciences.org/articles/61804/elife-61804-fig5-data1-v2.xlsx
Figure 6 with 1 supplement
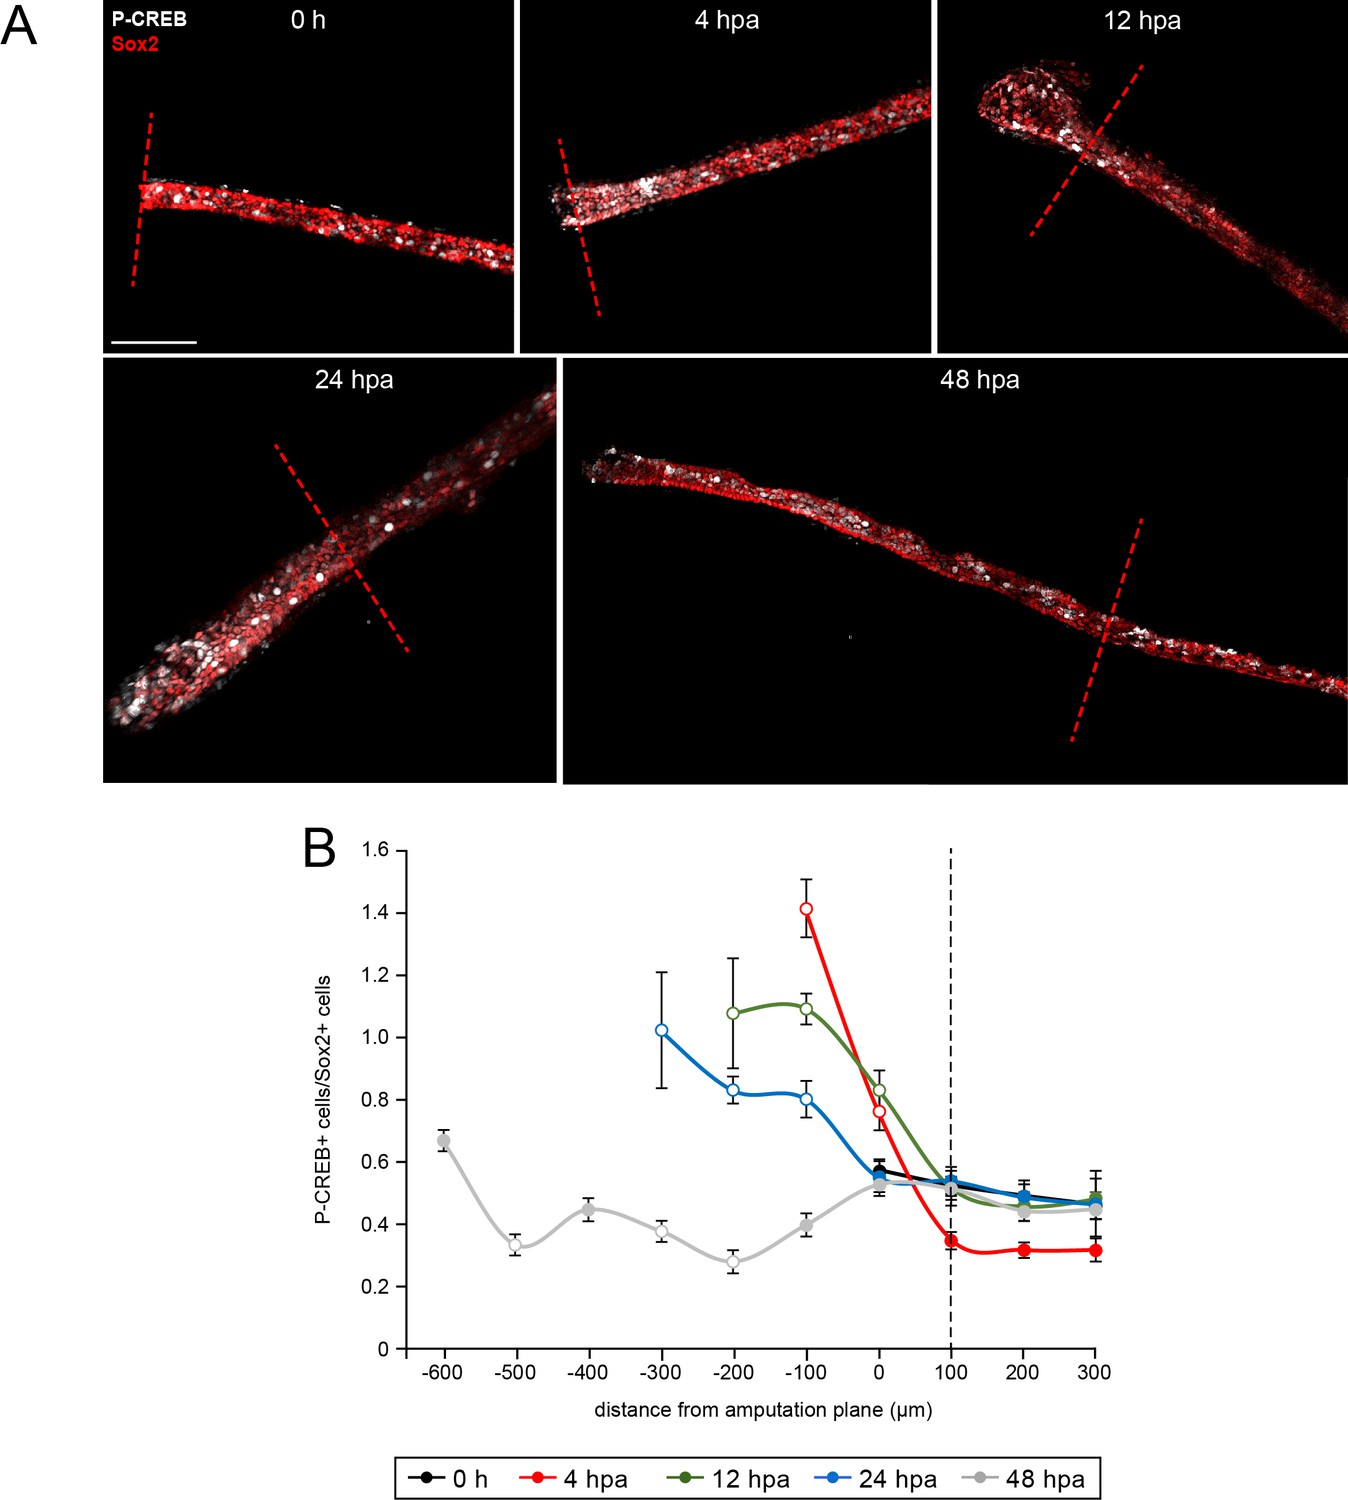
Spatiotemporal activation of CREB in the injured and regenerated spinal cord.
Stage 39–40 larvae were amputated and processed for whole-mount immunostaining at the indicated hour post amputation (hpa), with the exception of the 0 h group, which was first fixed and then amputated to represent the pre-amputation group. (A) Images show representative z-projections of immunostained samples for each group that were digitally processed to isolate spinal-cord associated P-CREB. Transverse red dashed line indicates amputation plane. Scale bar, 100 µm. (B) Graph shows mean ± SEM number of total P-CREB+ cells normalized to number of Sox2+ cells in 100 µm sections of spinal cord anterior (positive) and posterior (negative) to the amputation plane (0). N of larvae ≥5 per group. Open circles denote p<0.05 vs. time-matched average number of P-CREB+/Sox2+ cells within the region 100–200 µm anterior (100 µm, dashed black line) to the amputation plane (0 µm), one-way ANOVA.
-
Figure 6—source data 1
Spatiotemporal activation of CREB in the injured and regenerated spinal cord.
- https://cdn.elifesciences.org/articles/61804/elife-61804-fig6-data1-v2.xlsx
Figure 6—figure supplement 1
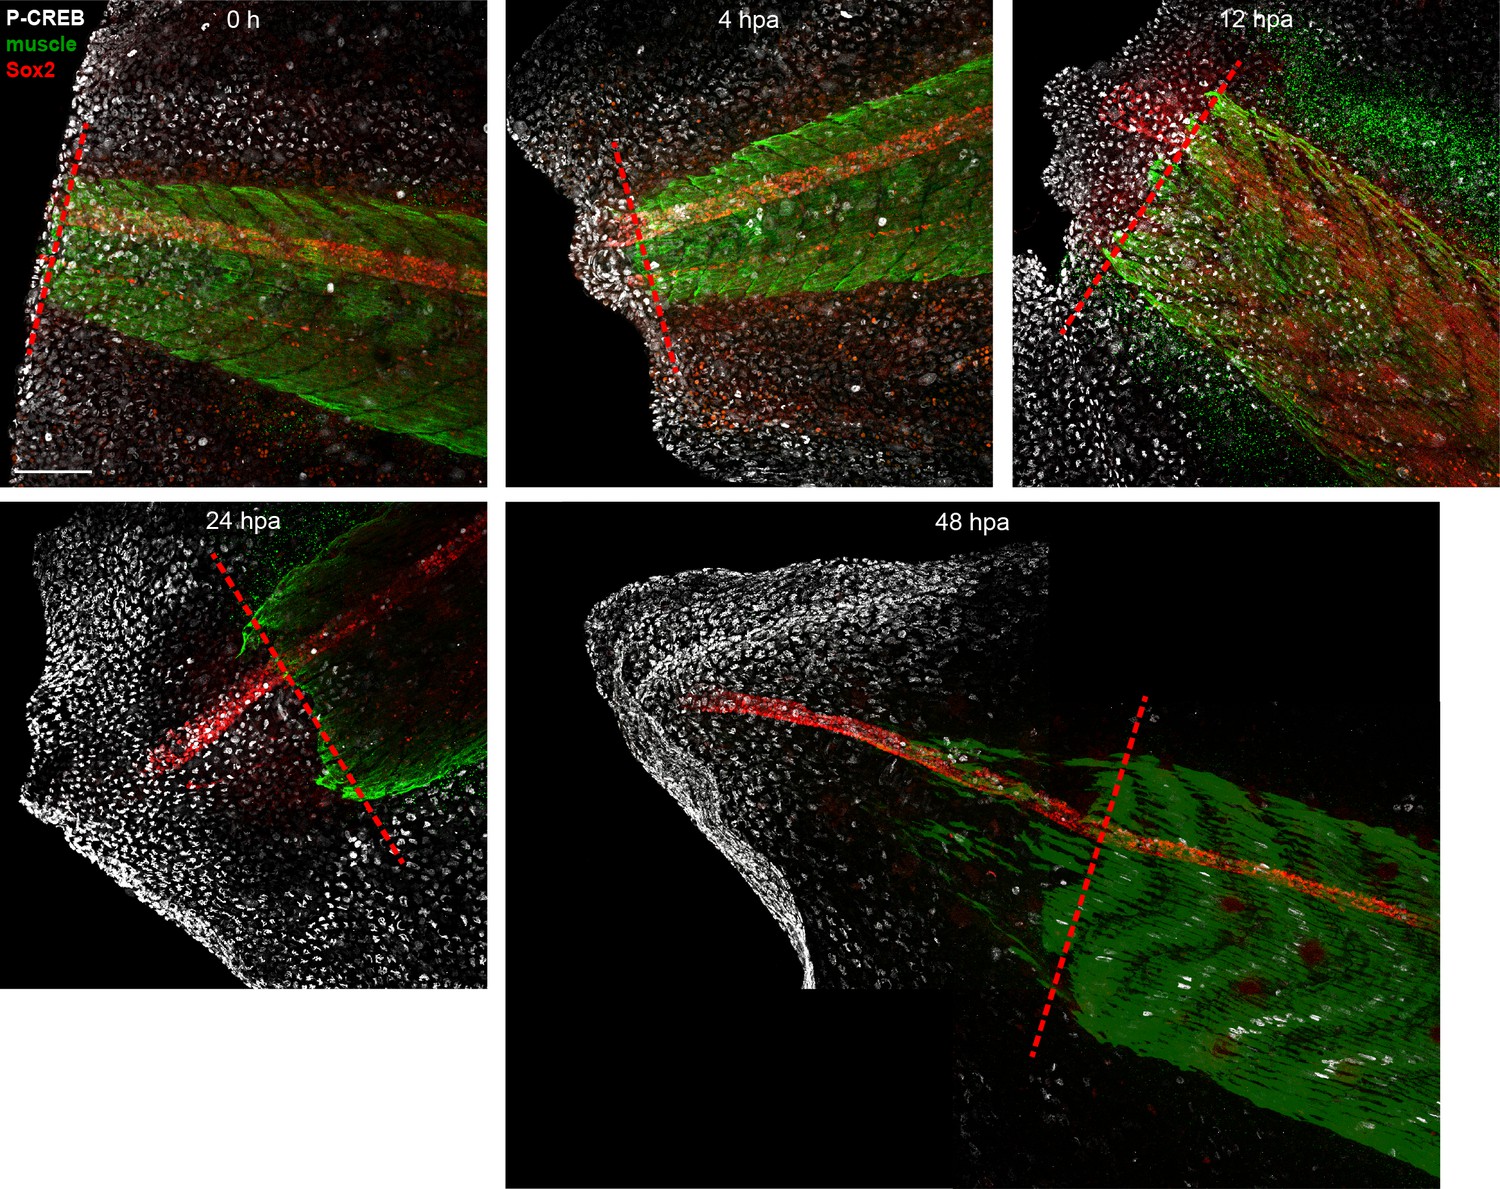
Unedited images from samples featured in Figure 6.
Stage 39–40 larvae were amputated and processed for whole-mount immunostaining at the indicated hour post amputation (hpa), with the exception of the 0 h group, which was first fixed and then amputated to represent the pre-amputation group. Images show representative total z-projections of whole-mount immunostained samples for each group corresponding to the edited images shown in Figure 6. Transverse red dashed line indicates amputation plane. Scale bar, 100 µm.
Figure 7
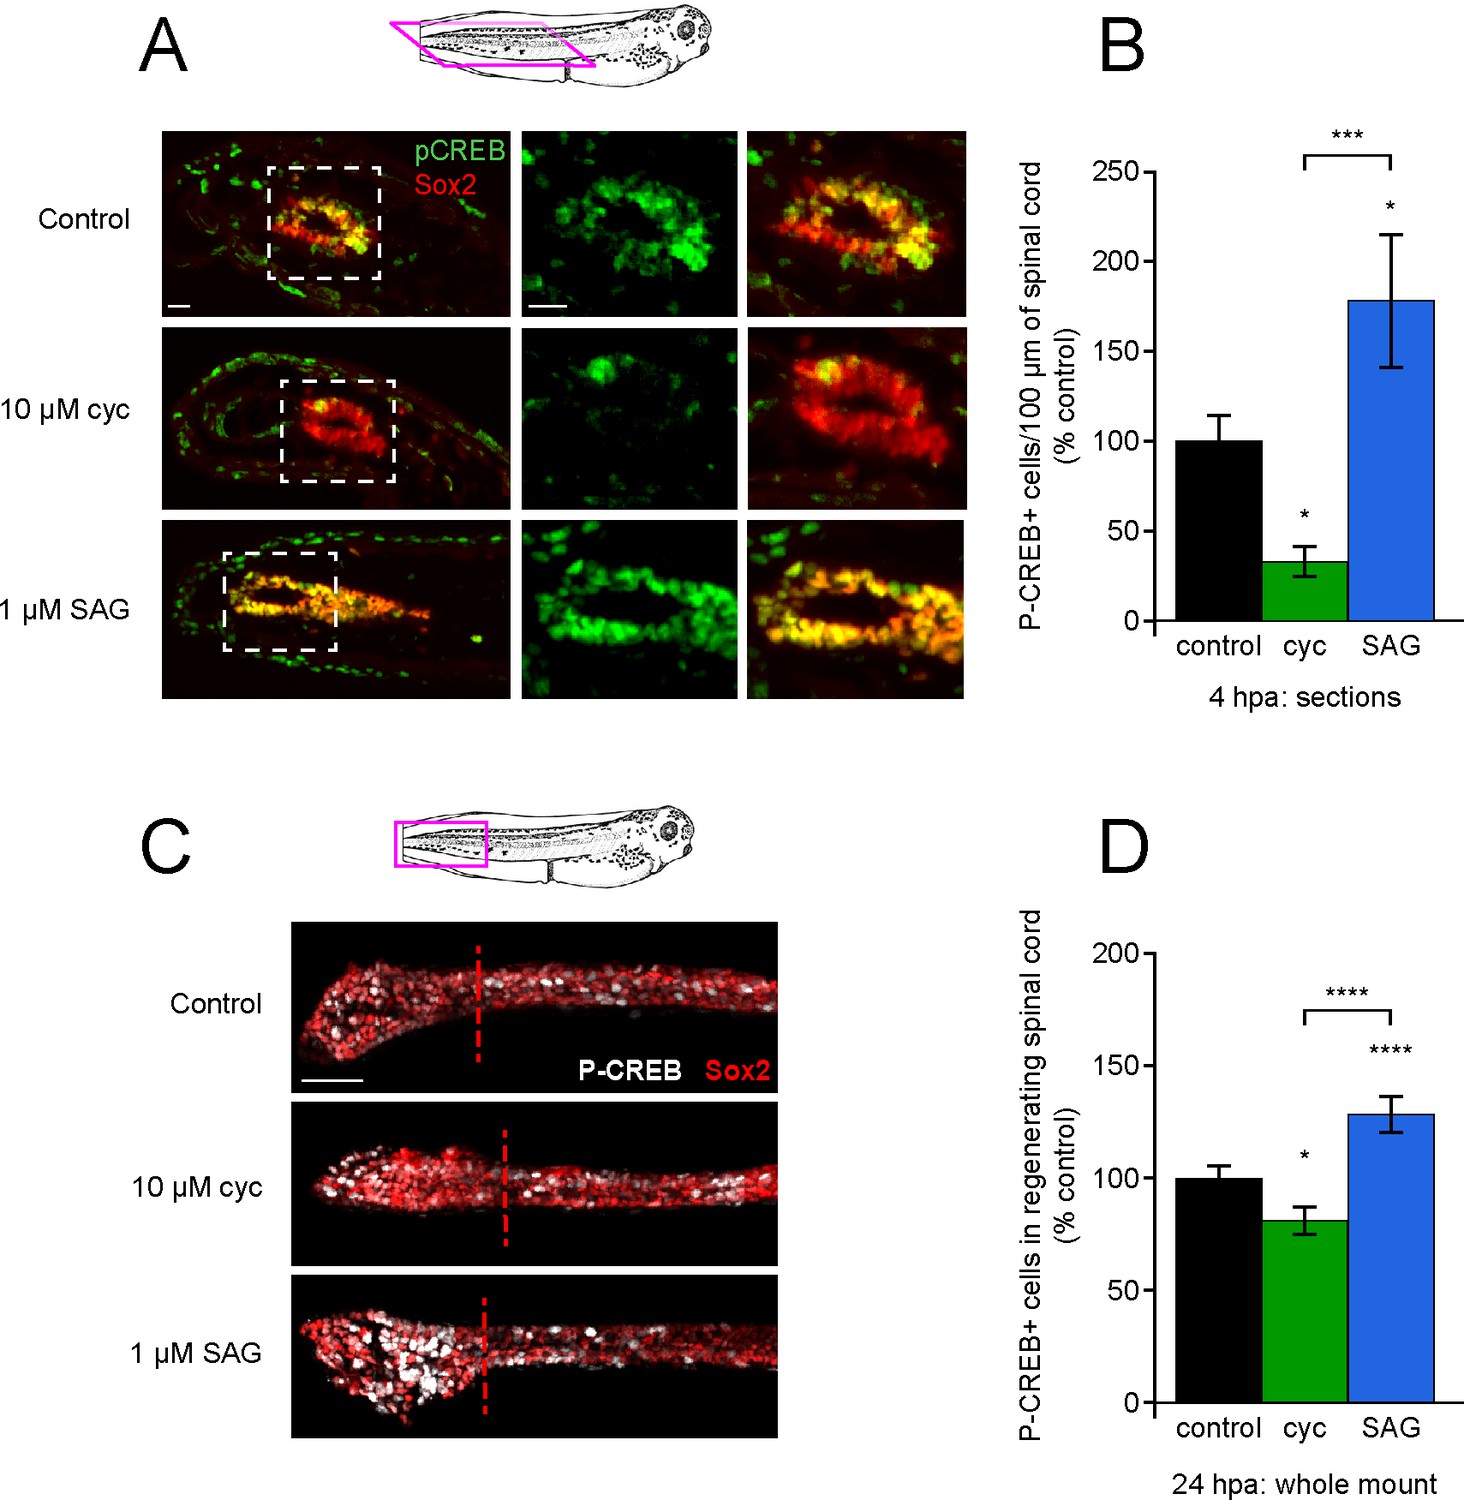
Post-amputation activation of CREB is regulated by Hedgehog (Hh) signaling.
Stage 39–40 larvae were amputated in vehicle (0.1% DMSO, control), 10 µM cyclopamine, or 1 µM SAG, then fixed at either 4 or 24 h post amputation (hpa) and processed for immunostaining in either paraffin sections (A, B), or whole-mounts (C, D), respectively. (A) Representative longitudinal sections from 4 hpa. Sample orientation displayed in schematic. Scale bars, 20 µm. (B) Graph shows mean ± SEM P-CREB+ cell count in 100-µm-long spinal cord within 400 µm of the amputation plane as % of control, n of larvae ≥5 per group from N = 3 independent experiments. (C) Representative whole-mount sections from 24 hpa. Sample orientation displayed in schematic. Scale bar, 50 µm. (D) Graph shows mean ± SEM P-CREB+ cell count in the regenerated spinal cord, normalized to cohort matched controls, n of larvae ≥12 per group from N = 3 separate experiments. In (B, D), *p<0.05, ***p<0.001, ****p<0.0001, one-way ANOVA + Holm–Sidak’s multiple comparison.
-
Figure 7—source data 1
Post-amputation activation of CREB is regulated by Hedgehog(Hh)signaling upon injury.
- https://cdn.elifesciences.org/articles/61804/elife-61804-fig7-data1-v2.xlsx
-
Figure 7—source data 2
Post-amputation activation of CREB is regulated by Hedgehog(Hh)signaling in the regenerating spinal cord.
- https://cdn.elifesciences.org/articles/61804/elife-61804-fig7-data2-v2.xlsx
Figure 8
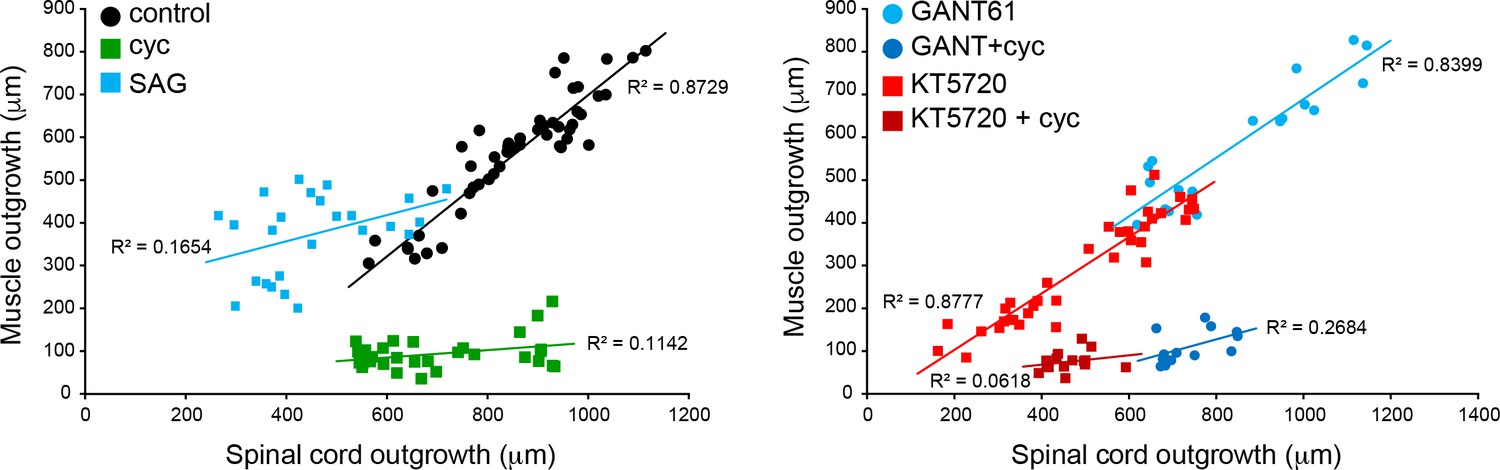
Coordination of spinal cord and muscle outgrowth in the regenerating tail is dependent on Smoothened (Smo) signaling.
Individual samples for each treatment are displayed by total outgrowth for spinal cord (X) and muscle (Y). Simple linear regression lines are fit for each treatment, and R2 goodness-of-fit values displayed by each line. N = 13–39 samples per group.
-
Figure 8—source data 1
Coordination of spinal cord and muscle outgrowth in the regenerating tail is dependent on Smoothened(Smo)signaling.
- https://cdn.elifesciences.org/articles/61804/elife-61804-fig8-data1-v2.xlsx
Figure 9
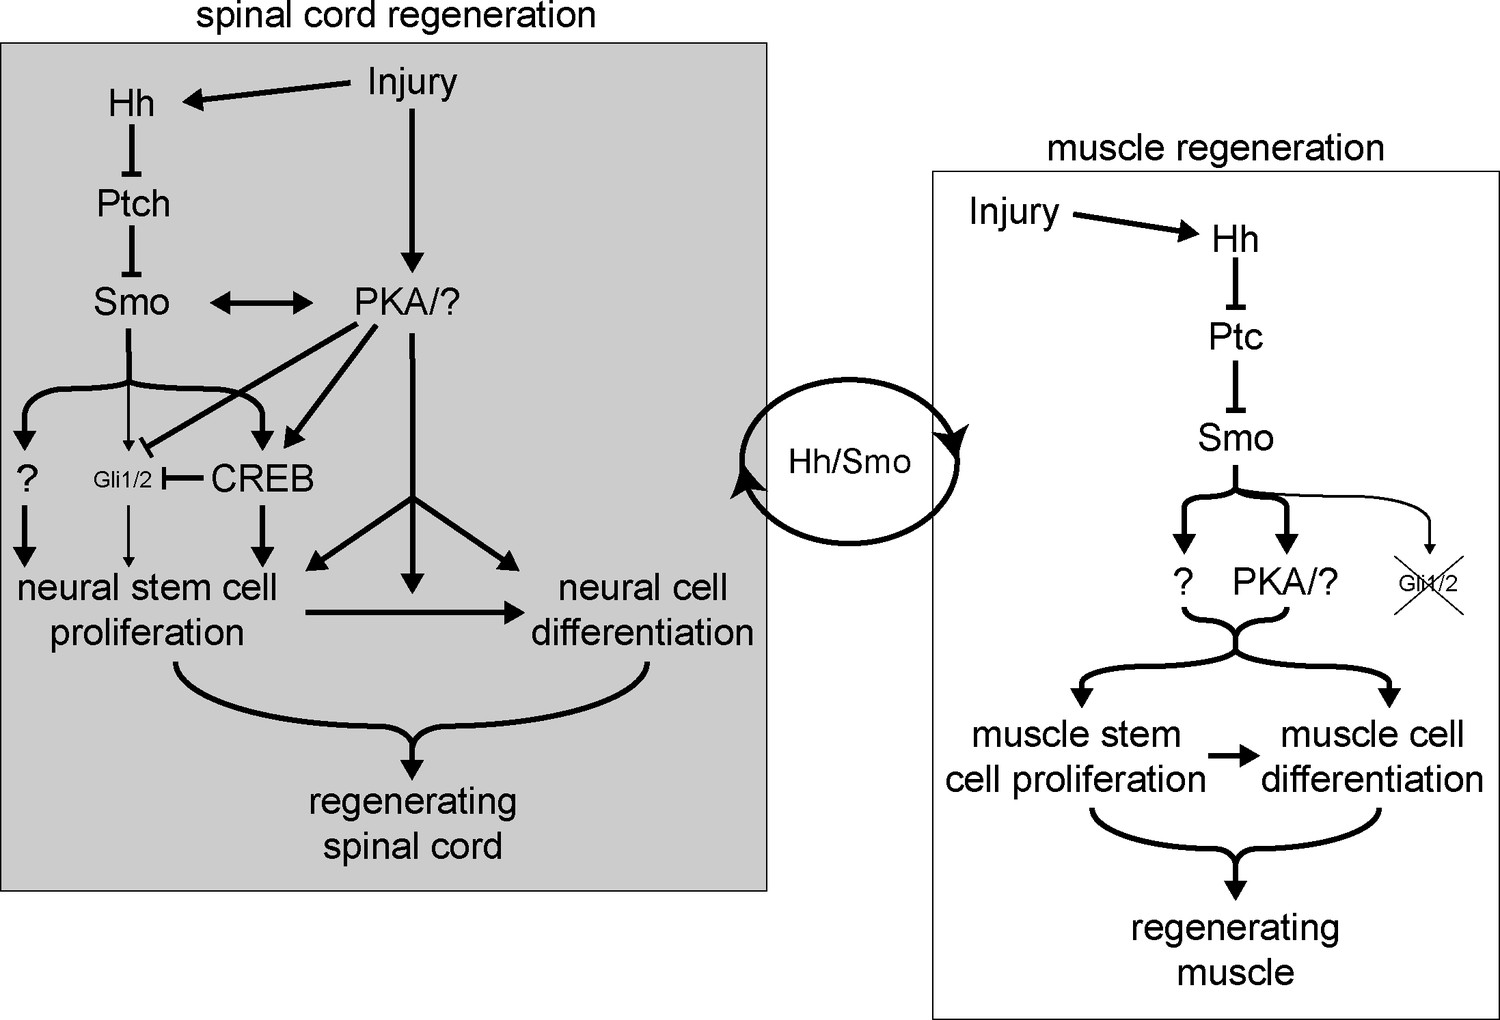
Model for Hedgehog (Hh)-dependent regulation of spinal cord and muscle regeneration.
Injury recruits non-canonical Hh signaling in the spinal cord to activate neural stem cells for replenishing the regenerating spinal cord. Injury also activates PKA which acts independently from Smoothened (Smo) on neural stem cell proliferation to promote spinal cord regeneration. Non-canonical Hh signaling is also essential for muscle regeneration starting from the initial stages post injury, where PKA appears to be downstream of Smo activation. The coordination between the magnitude of regenerating spinal cord and muscle outgrowth is dependent on non-canonical Hh/Smo signaling.
Author response image 1
Author response image 2
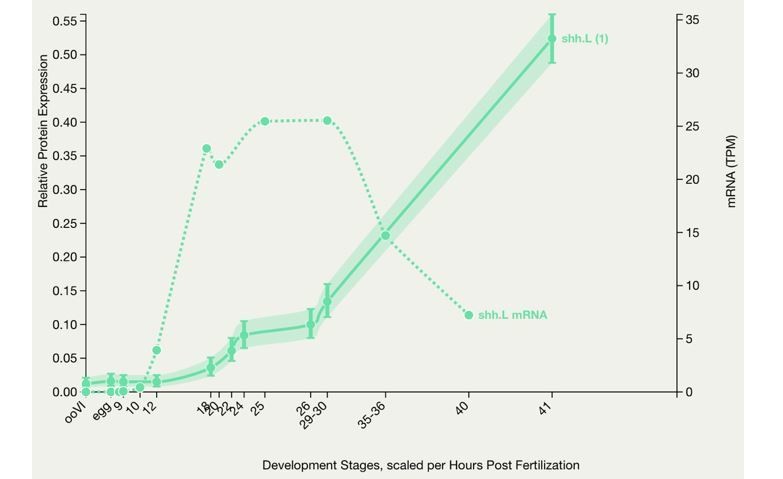
X. laevis embryonic protein expression.
This graph shows protein expression in Xenopus laevis. Optionally the mRNA expression is also charted for comparison. The number in brackets after the gene symbol indicates the number of peptides. (Peshkin et al., 2019)
Tables
Key resources table
| Reagent type (species) or resource | Designation | Source or reference | Identifiers | Additional information |
|---|---|---|---|---|
| Antibody | 5E1 (mouse monoclonal) | Developmental Studies Hybridoma Bank | RRID:AB_528466 | Shh; (1:50) |
| Antibody | GAPDH (goat polyclonal) | SICGEN | RRID:AB_0049-200 | Loading control whole-cell lysates, western blots (1:1000) |
| Antibody | 12/101 (mouse monoclonal) | Developmental Studies Hybridoma Bank | RRID:AB_531892 | Skeletal muscle; (1:100) |
| Antibody | Sox2 (goat polyclonal) | R&D | AF2018, RRID:AB_355110 | Neural stem cells; (1:300-1:400) |
| Antibody | P-H3 (rabbit polyclonal) | Millipore | 06-570, RRID:AB_310177 | Mitotic marker; (1:400) |
| Antibody | P-CREB (rabbit polyclonal) | Cell Signaling | 9198 | Phosphorylated transcription factor; (1:800-1:1500) |
| Antibody | Gli2 (goat polyclonal) | R&D | AF3635; RRID:AB_211902 | Transcription factor; (1:800) |
| Antibody | Lamin-B1 (rabbit monoclonal) | Cell Signaling | 9087; RRID:AB_10896336 | Nuclear protein for loading control in western blot assays; (1:500) |
| Recombinant DNA reagent | p8xGli-EGFP_CMV-iRFP670 | This paper | Gli activity reporter; design described in Materials and methods/Gli activity reporter section of this paper | |
| Sequence-based reagent | Gli2-morpholino | Gene Tools | GCACAGAACGCAGGTAATGCTCCAT | |
| Sequence-based reagent | Gli2-photo-morpholino | Gene Tools | ATGGAGCATTACPTGCGTTCT | |
| Chemical compound, drug | Cyclopamine | Sigma-Aldrich | C4116 | 10–20 mM stock in DMSO |
| Chemical compound, drug | SAG | Calbiochem | 566660 | 5 mM stock in H2O |
| Chemical compound, drug | Vismodegib | Sigma | 879085-55-9 | 50 mM in DMSO |
| Chemical compound, drug | KT5720 | Tocris | 1288 | 10 mM stock in DMSO |
| Chemical compound, drug | GANT61 | Tocris | 3191 | 10 mM srock in DMSO |
| Chemical compound, drug | Tricaine-S | Syndel | MS 222 | Anesthetic |
Additional files
Download links
A two-part list of links to download the article, or parts of the article, in various formats.
Downloads (link to download the article as PDF)
Open citations (links to open the citations from this article in various online reference manager services)
Cite this article (links to download the citations from this article in formats compatible with various reference manager tools)
Non-canonical Hedgehog signaling regulates spinal cord and muscle regeneration in Xenopus laevis larvae
eLife 10:e61804.
https://doi.org/10.7554/eLife.61804


