In-host population dynamics of Mycobacterium tuberculosis complex during active disease
- Department of Systems Biology, Harvard Medical School, United States
- Department of Biomedical Informatics, Harvard Medical School, United States
- Center for Genes, Environment and Health, Center for Genes, National Jewish Health, United States
- Department of Genetics and Genomic Sciences, Icahn School of Medicine at Mount Sinai, United States
- Icahn Institute of Data Sciences and Genomics Technology, United States
- Mycobacteriology Reference Laboratory, Advanced Diagnostic Laboratories, National Jewish Health, United States
- College of Public Health, University of South Florida, United States
- Morsani College of Medicine, University of South Florida, United States
- Pulmonary and Critical Care Medicine, Massachusetts General Hospital, United States
Figures
Figure 1 with 1 supplement
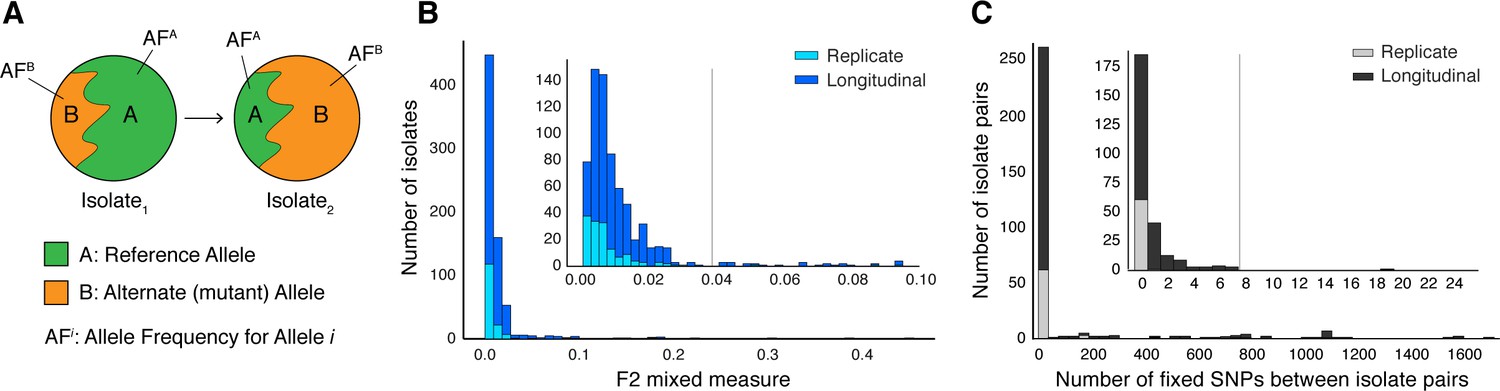
Selection of patients with longitudinal clonal infection.
(A) Allele frequency change between paired isolates . (B) The F2 measure >0.04 (Materials and methods) was used to identify and exclude isolate pairs with evidence for mixed strain growth at any time point. (C) Replicate and longitudinal pairs with fixed SNP (fSNP) distance of >7 were excluded. For longitudinal isolates, fSNP >7 was assessed as consistent with Mtbc reinfection with a different strain.
Figure 1—figure supplement 1

Filtering out laboratory-contaminated samples and patients with mixed infections.
We implemented several filters to mitigate the effects of contamination from laboratory error or samples from co-infected hosts (Materials and methods). Our analysis included three types of replicate pairs (S2, C2, P3) and longitudinal pairs from eight studies (P, C, W, T, B, G, X, H) (Materials and methods). At each step, we filtered out any pair of isolates if at least one isolate failed to pass the filter in place (indicated by dashed arrows). First, we used Kraken to filter out isolates that had less than 95% of reads taxonomically classified under MTBC. Second, we filtered out isolates that did not meet the F2 threshold. Third, we filtered out isolate pairs that had a genetic distance greater than seven fixed SNPs. Our final filtered isolate pair sets included 62 replicate isolate pairs and 200 longitudinal isolate pairs.
Figure 2 with 1 supplement
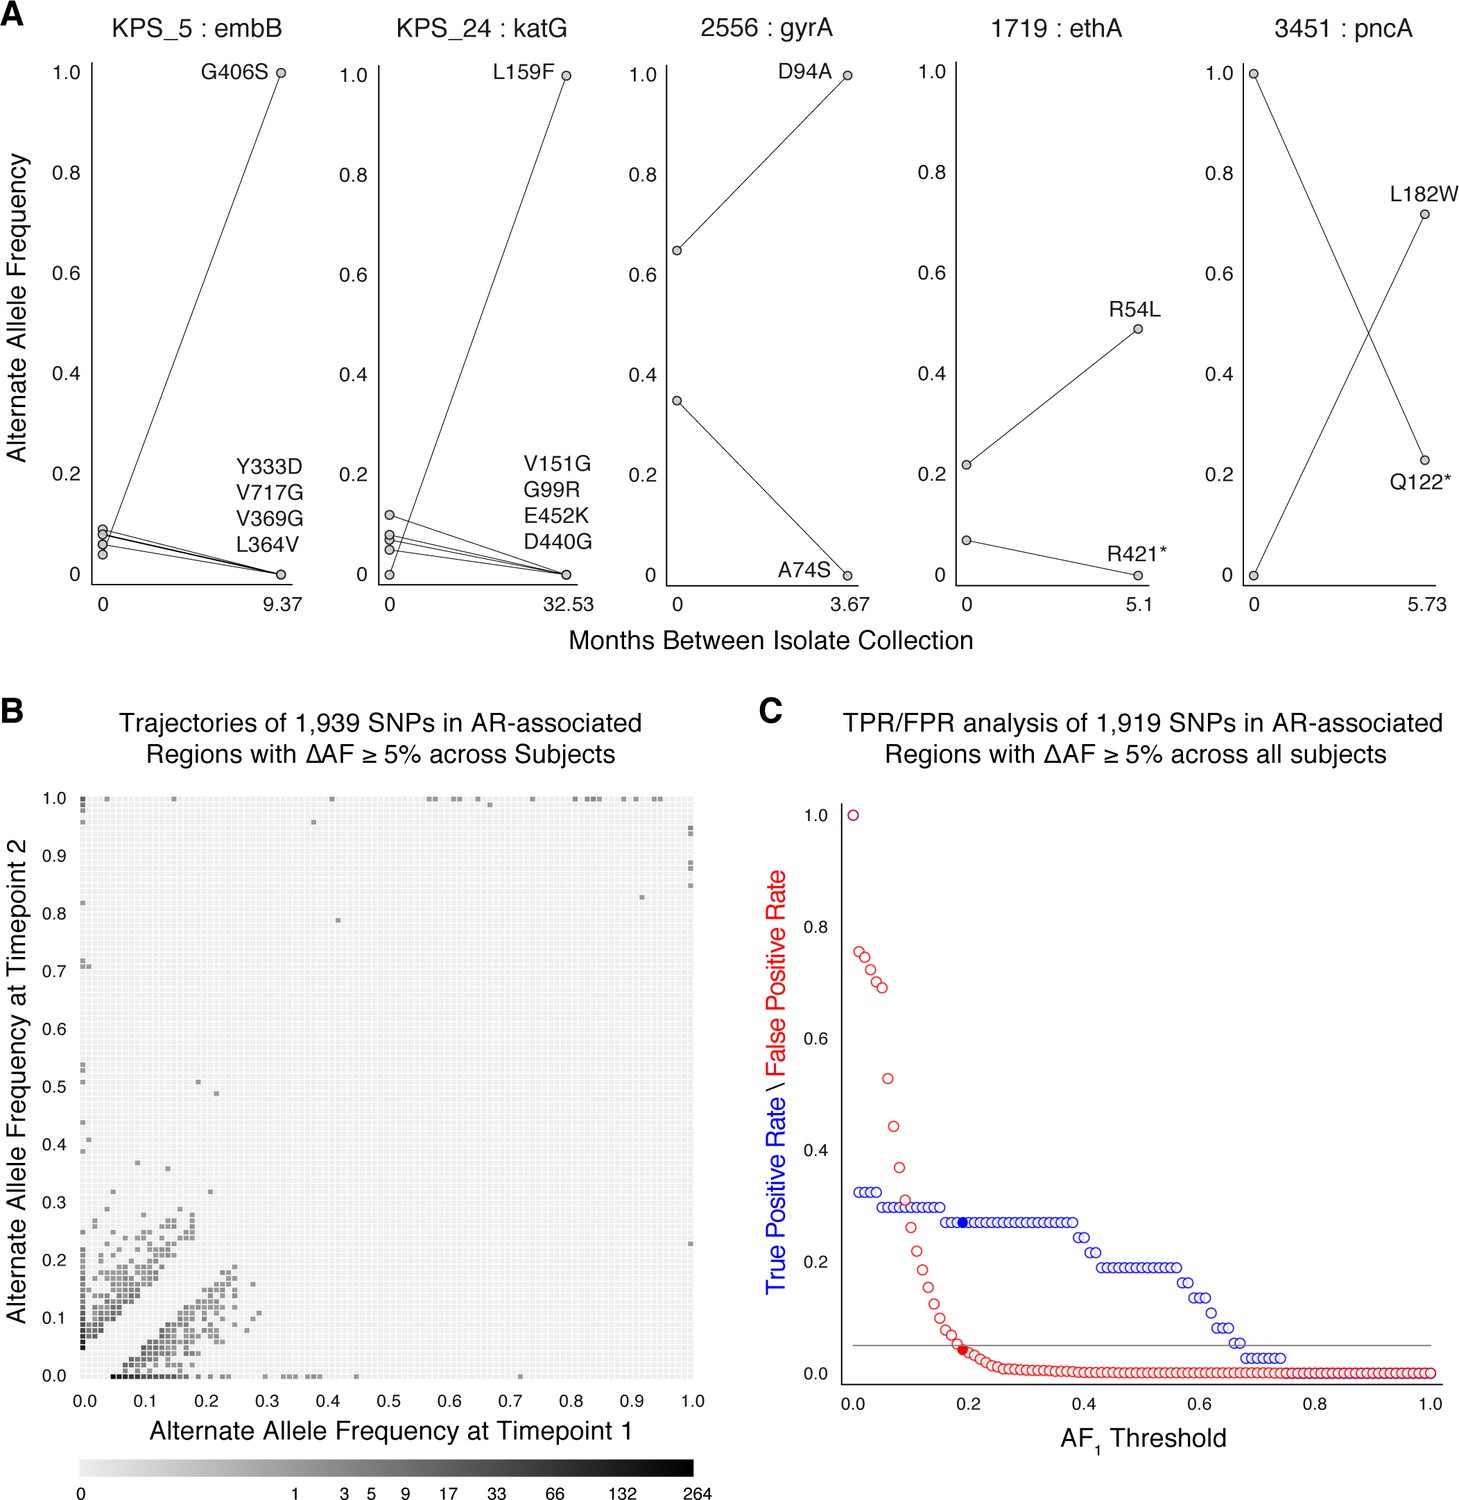
Allele frequency dynamics within antibiotic resistance loci.
(A) The antibiotic resistance genes embB, katG, gyrA, ethA, and pncA demonstrate evidence for competing clones during infection (other examples found are displayed in Figure 2—figure supplement 1). Each mutant allele is labeled with amino acid encoded by the reference allele, H37Rv codon position, and amino acid encoded by the mutant allele. (B) The allele frequency trajectories for SNPs that occur in patients over the course of infection can be used to study the prediction of further antibiotic resistance using the frequency of alternate alleles detected in the longitudinal isolates collected from patients. (C) Plot of true positive rate (TPR) and false positive rate (FPR) for detecting eventual fixation of a resistance allele ( 75%) as a function of initial allele frequency ().
Figure 2—figure supplement 1
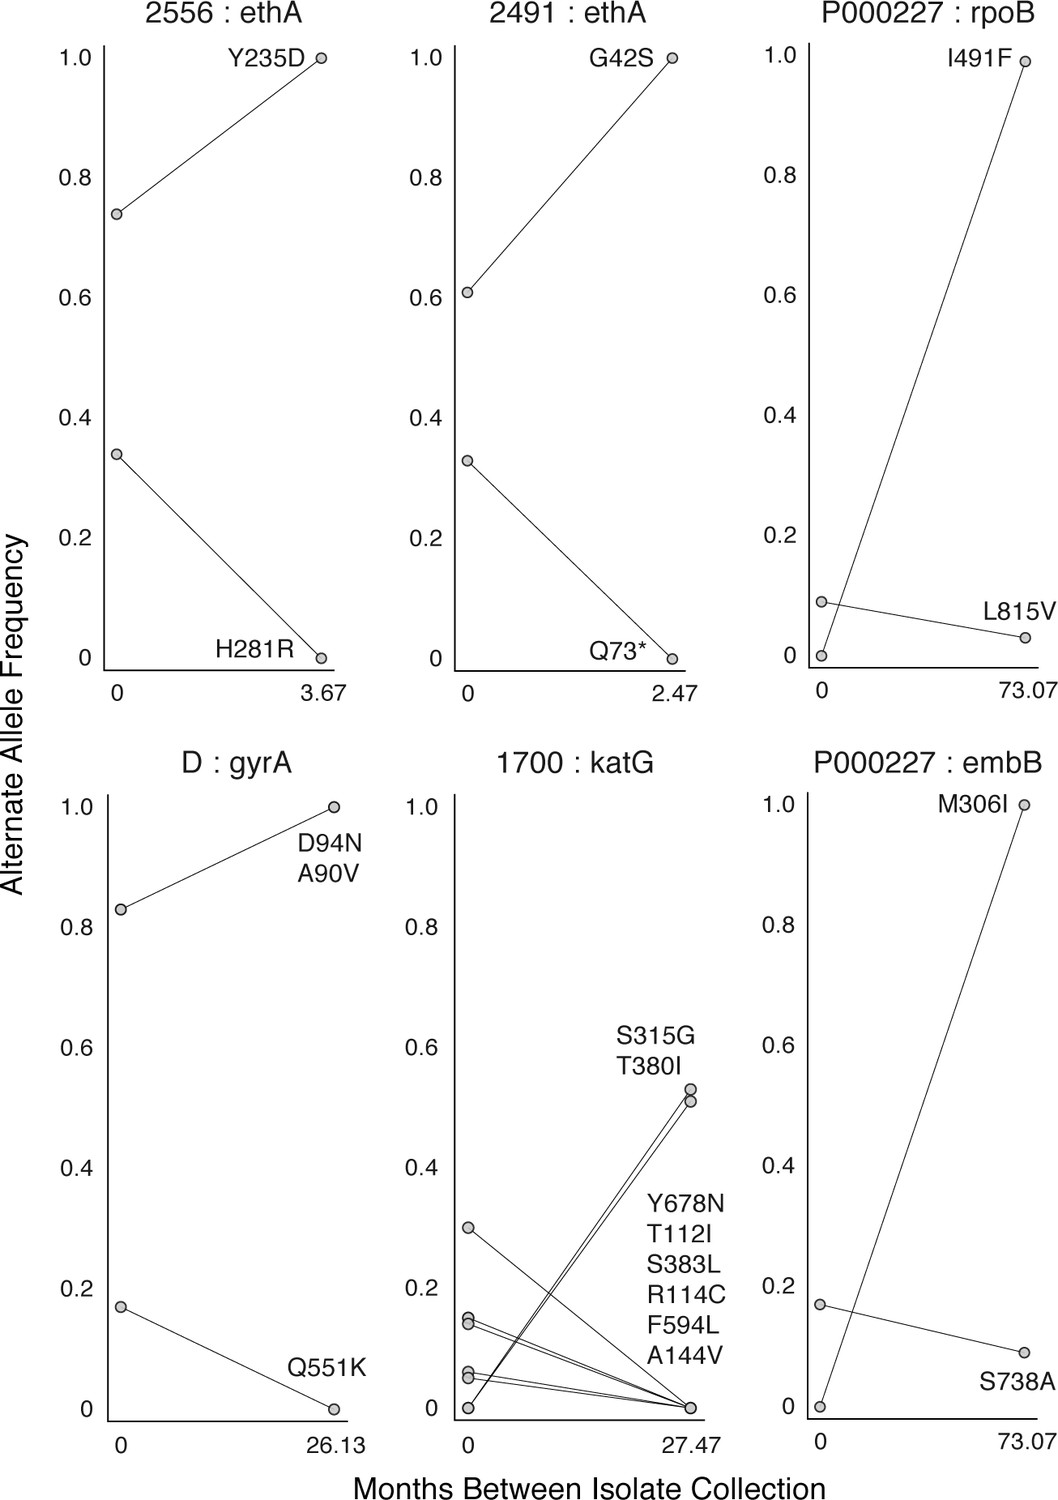
Mutant allele trajectories consistent with clonal interference.
Several examples of co-occurring mutant alleles and their allele frequency trajectories between longitudinal isolate collection demonstrate genetic diversity patterns consistent with competing clones in-host. Each mutant allele is labeled with amino acid encoded by the reference allele, H37Rv codon position, and amino acid encoded by the mutant allele.
Figure 3
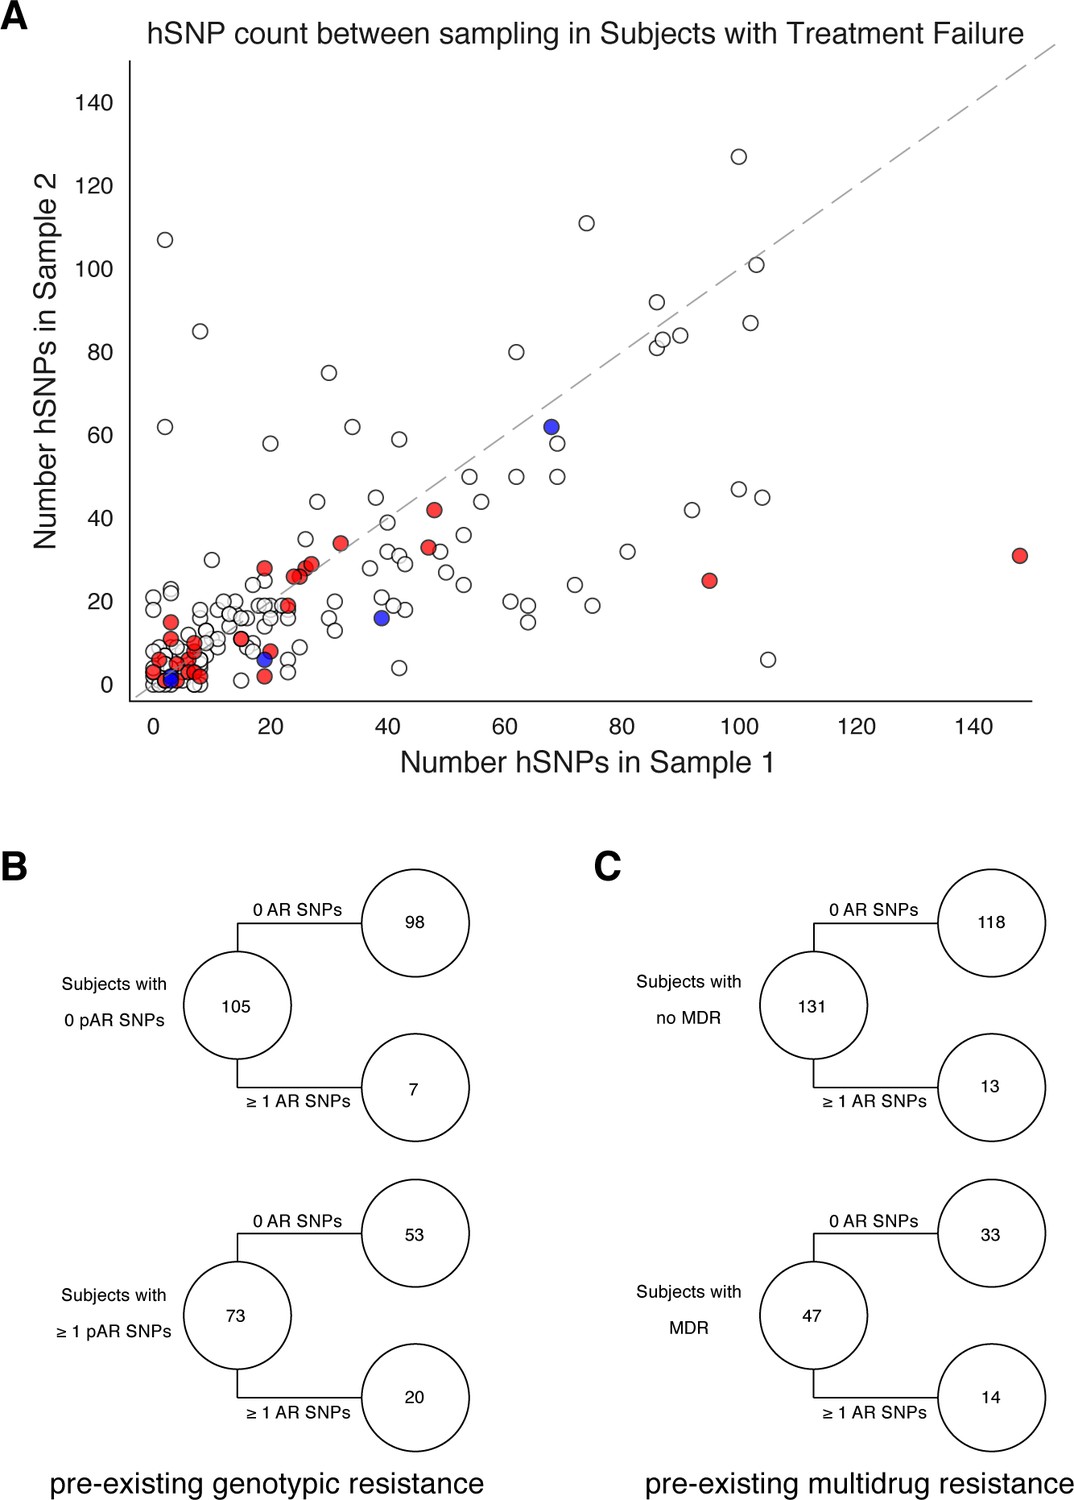
Pre-existing resistance is associated with resistance amplification.
We called heterozygous SNPs (hSNP) in each isolate from a patient with clonal infection classified as failing treatment (N = 178). We defined hSNPs as a SNP called in an isolate with an alternate allele frequency between 25% and 75% (Materials and methods). (A) The number of hSNPs called in the second sample isolated vs the number of hSNPs called in the first sample isolated from each of 178 patients (median T1 = 13.5 hSNPs, median T2 = 13.5 hSNPs). The dashed line is y = x. Red denotes 27/178 patients who had an antibiotic resistance in-host SNP arise between sampling (median T1 = 15.0 hSNPs, median T2 = 11.0 hSNPs), blue denotes 5/178 patients who had a putative host-adaptive in-host SNP (Rv1944c, Rv0095c, PPE18, PPE54, PPE60) arise between sampling (median T1 = 19.0 hSNPs, median T2 = 6.0 hSNPs). (B–C) Among patients who fail treatment, (B) patients with pre-existing mutations that confer antibiotic resistance and (C) those that have pre-existing MDR are more likely to acquire antibiotic resistance mutations throughout the course of infection.
Figure 4
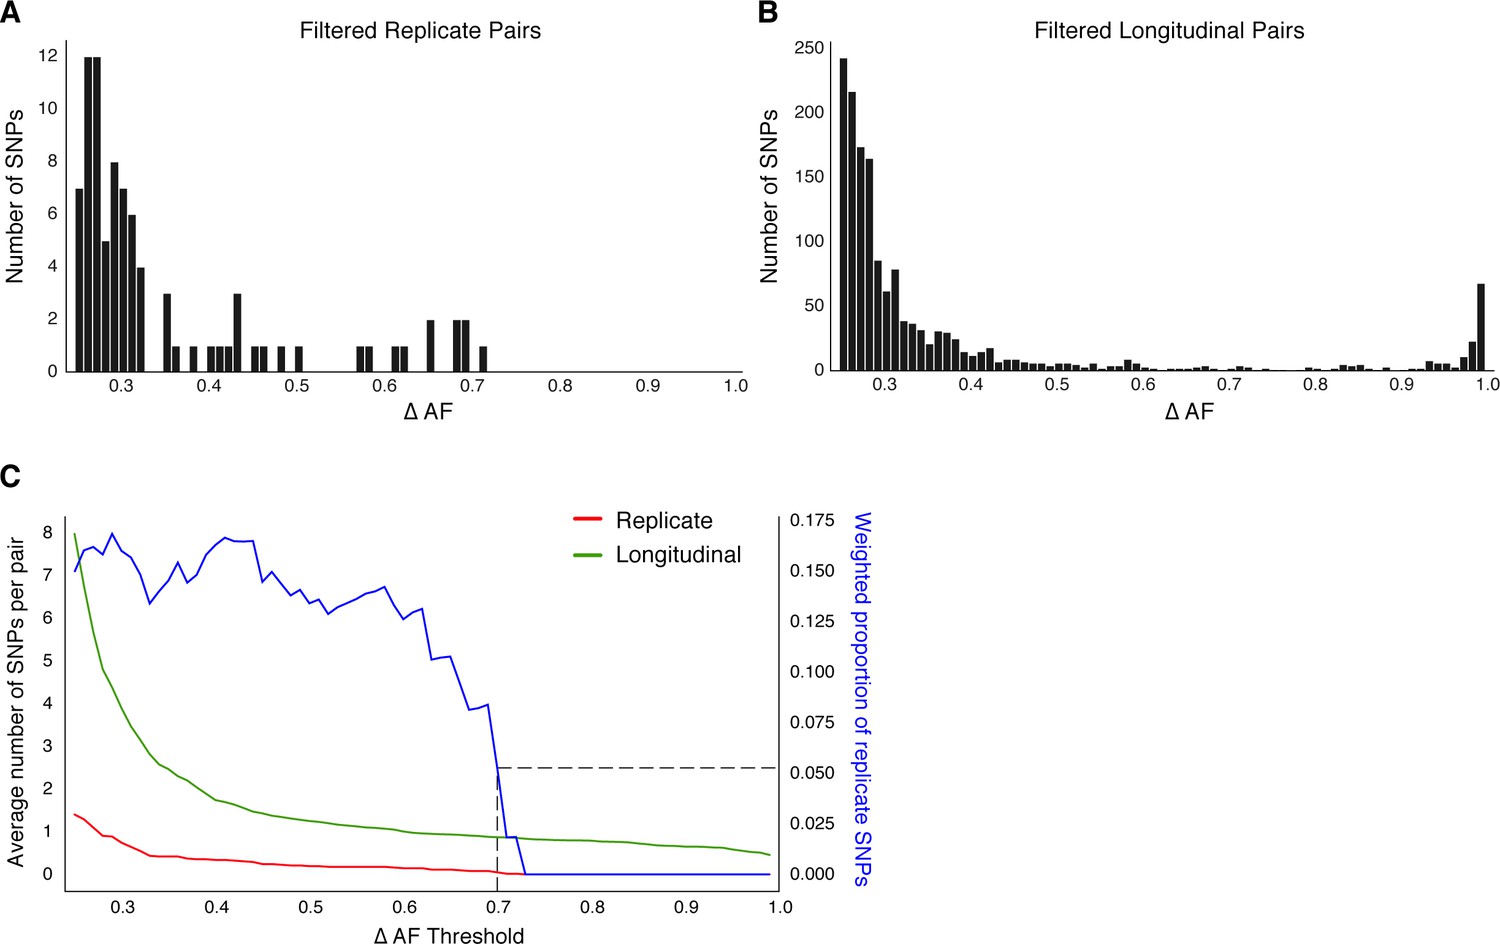
Replicate pairs reveal levels of biological noise associated with repeated sampling.
(A, B) We analyzed the distribution of ΔAF for all SNPs detected across all replicate pairs and longitudinal pairs for SNPs where ΔAF ≥25%. (B) SNPs were detectable at lower levels of ΔAF for both types of isolate pairs, but SNPs with higher values of ΔAF were only found in longitudinal pairs. (C) To determine a ΔAF threshold for calling SNPs representative of changes in bacterial population composition in-host, we calculated the average number of SNPs per pair of isolates at different ΔAF thresholds for both replicate and longitudinal pairs. At a ΔAF threshold of 70% the number of SNPs between replicate pairs represents 5.27% of the SNPs detected amongst all replicate and longitudinal pairs, weighted by the number of pairs in each group.
Figure 5 with 3 supplements
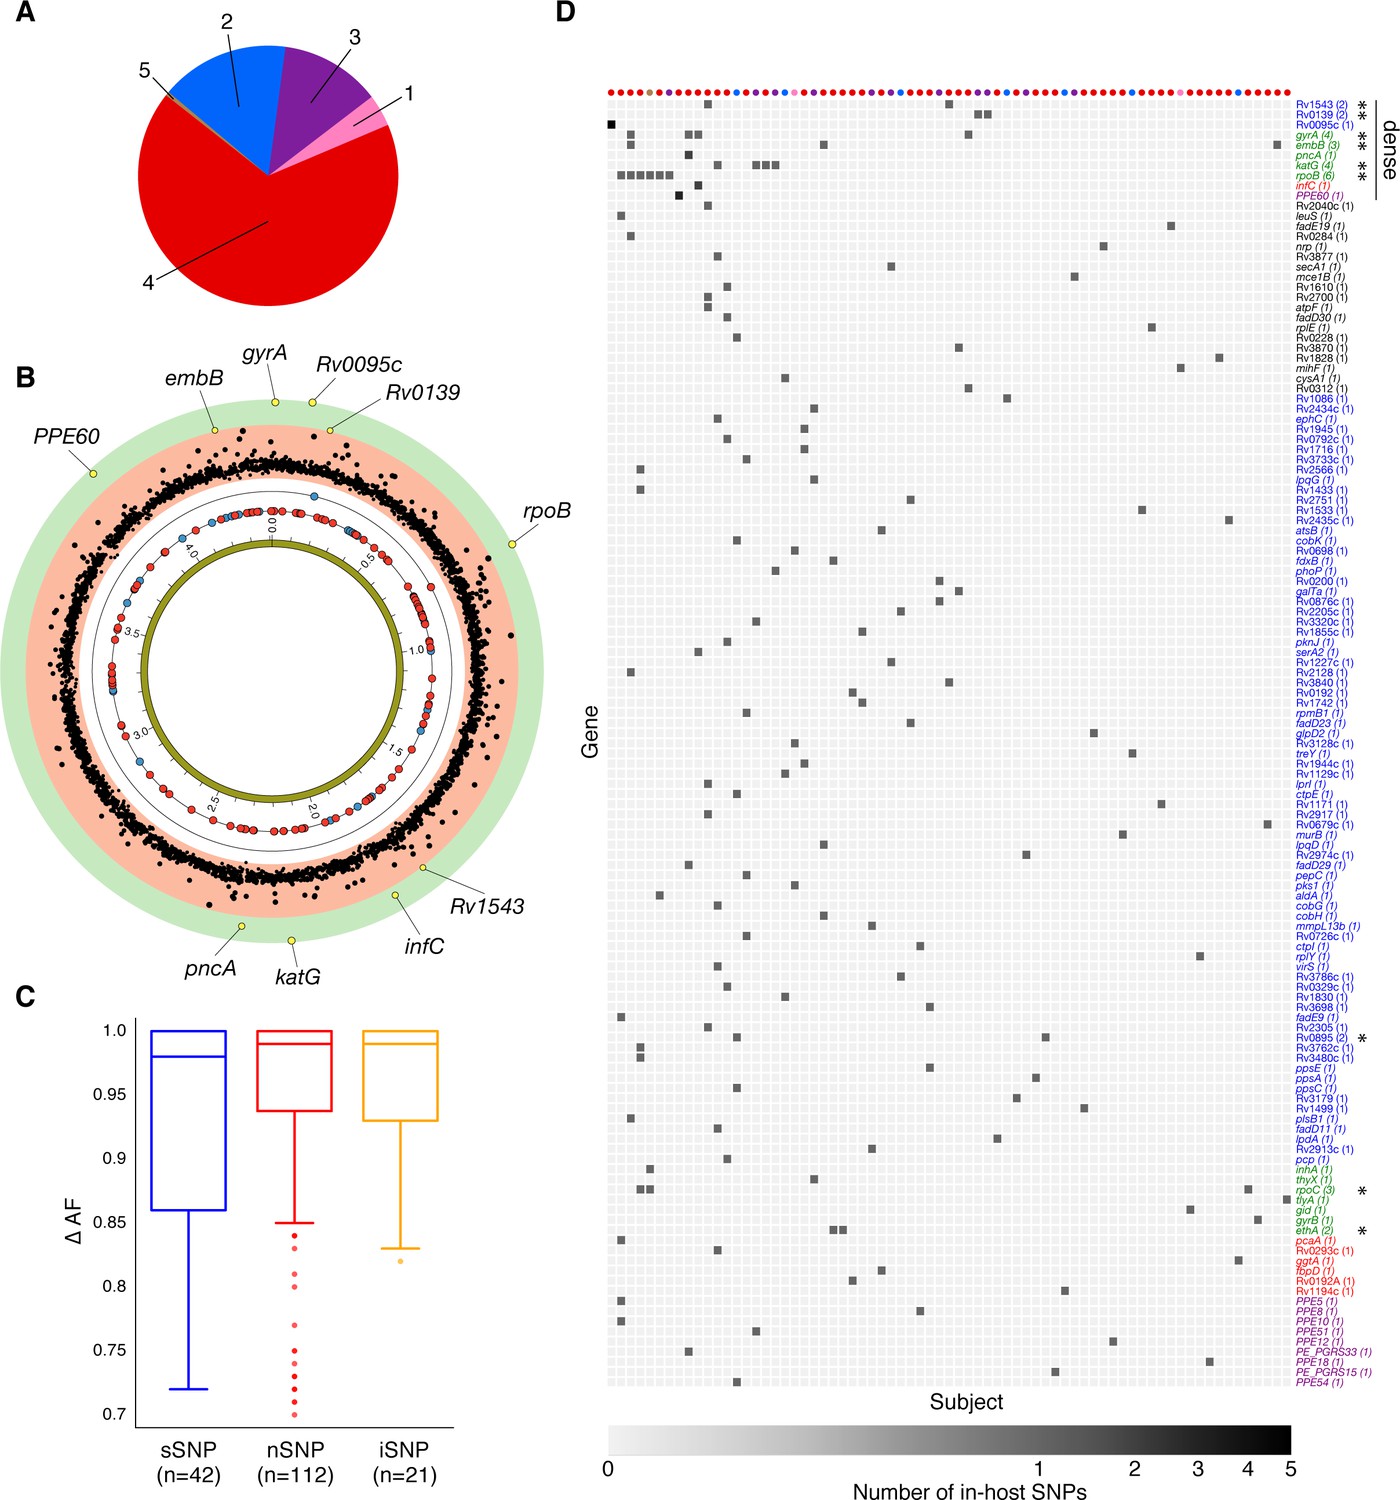
Genome-wide diversity in 200 clonal Mtbc infections.
(A) Distribution of five major Mtbc lineages among the 200 clonal Mtbc infections. (B) Distribution of 153 in-host SNPs within coding regions among the 200 longitudinal isolate pairs across the 4.41 Mbp Mtbc genome (blue circles: synonymous, red circles: non-synonymous). Blue and red circles on the innermost black ring indicate the locations of SNPs detected in one patient; circles on the next ring represent SNPs detected in two patients. The (p-value) of the mutational density test (Materials and methods) by gene is plotted in the outermost, red and green, regions. Labeled yellow circles represent genes significant at the bonferroni-corrected cutoff (). (C) Distribution of ΔAF by SNP type: sSNP: synonymous, nSNP: non-synonymous, iSNP: intergenic. (D) Heat-map of SNPs per gene (rows) and patient (columns). Colored circles across columns indicate the strain phylogenetic lineage (as represented in A). Gene names colored according to gene category (Figure 6D) with parentheses indicating the number of patients with an SNP in a given gene. *Indicates genes in which SNPs are detected within multiple patients.
Figure 5—figure supplement 1
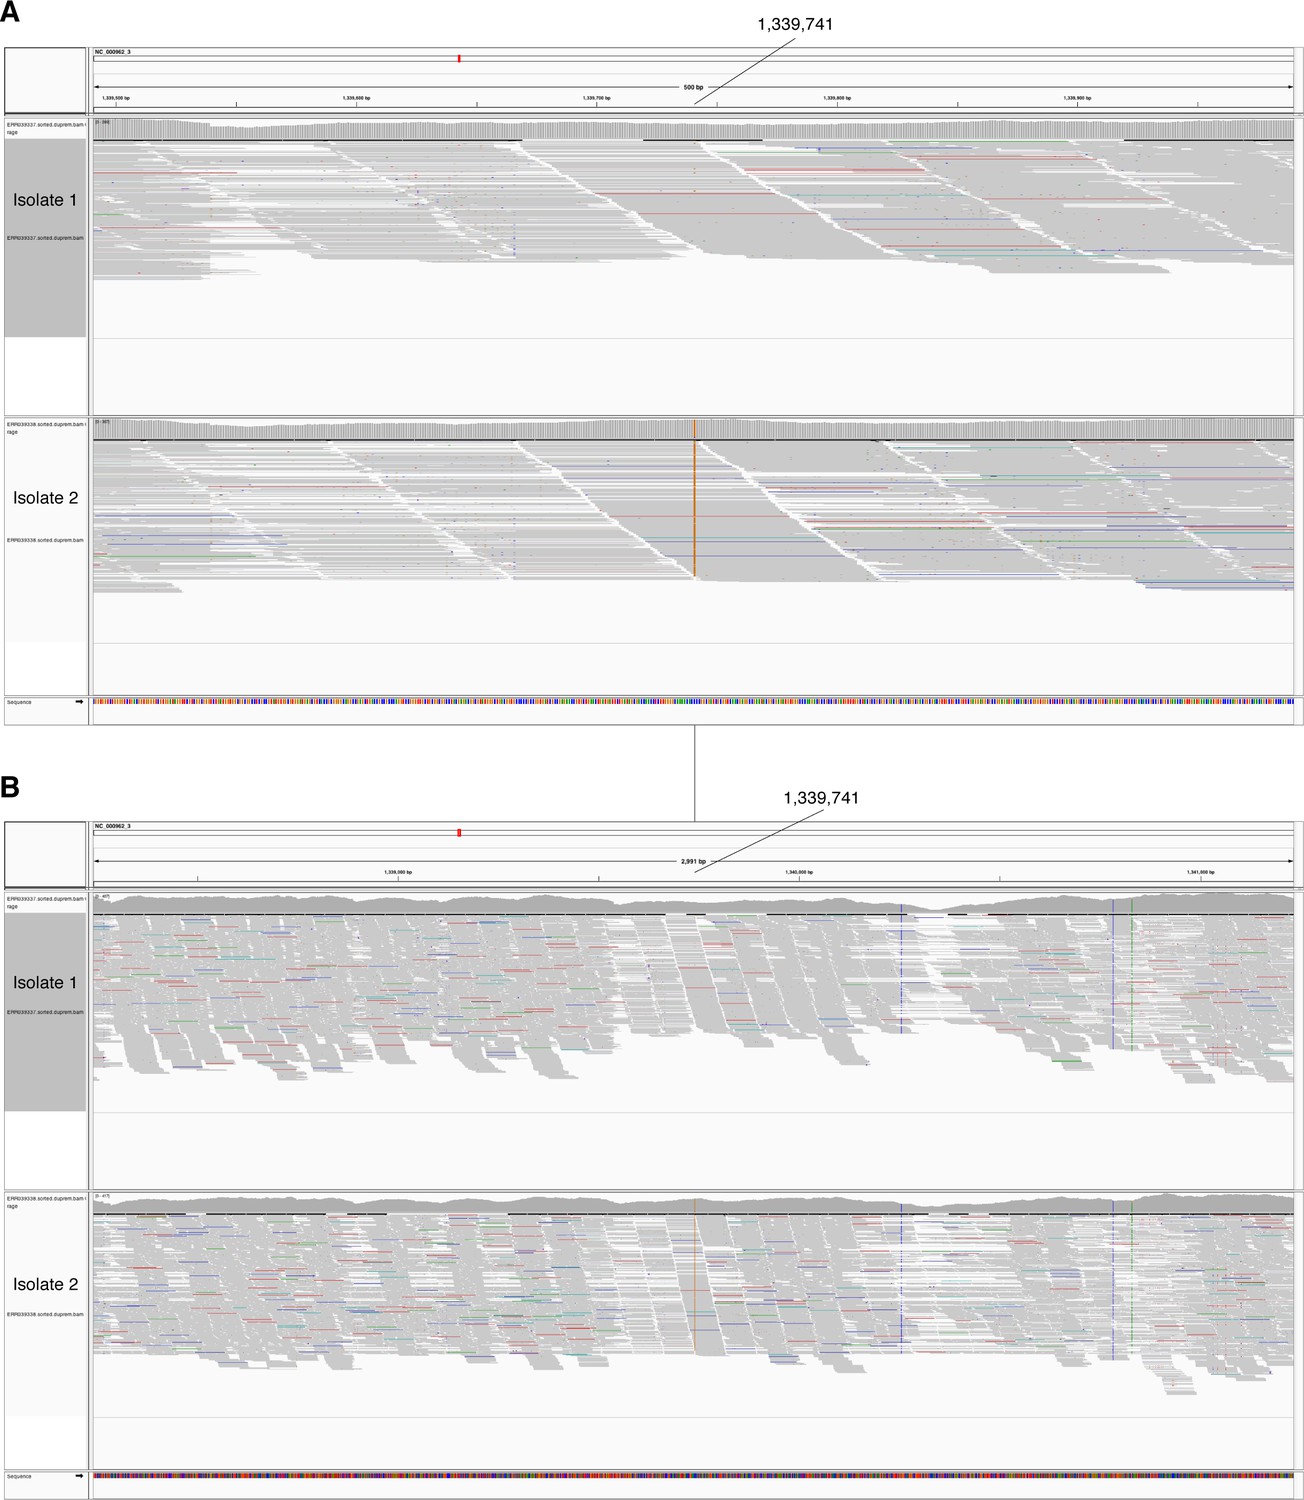
In-host SNP detected in PPE18.
IGV (Thorvaldsdóttir et al., 2013) image of BAM alignment (reads sorted by start location) for longitudinal clinical isolates that were cultured from sputum collected from patient P000183 (Walker et al., 2013). (A) 500 and (B) 3000 basepair windows centered at reference position 1339741. Isolate 1 is the BAM alignment for the isolate collected in 2003 and the reference position 1339741 matches the reference allele (C). Isolate 2 is the BAM alignment for isolate collected in 2008 and reference position 1339741 supports an alternate allele (G).
Figure 5—figure supplement 2
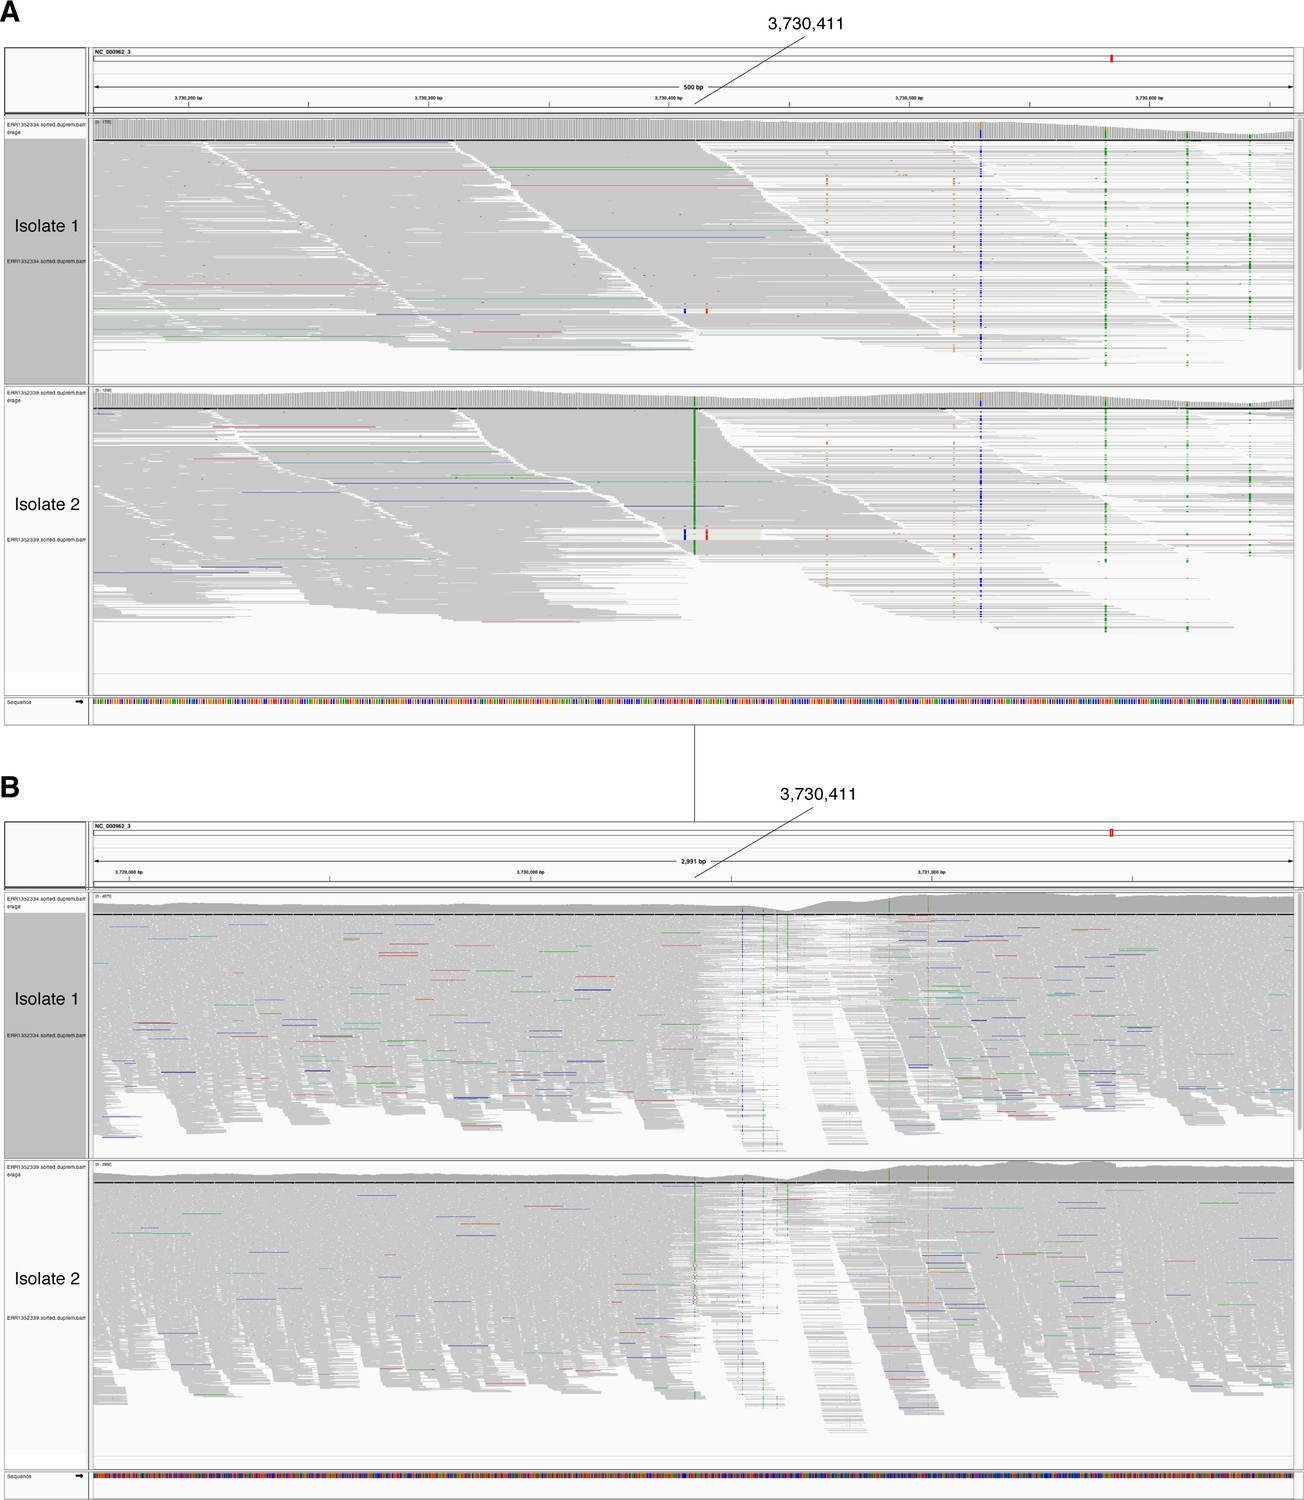
In-host SNP detected in PPE54.
IGV (Thorvaldsdóttir et al., 2013) image of BAM alignment (reads sorted by start location) for longitudinal clinical isolates that were cultured from sputum collected from patient P09 (Trauner et al., 2017). (A) 500 and (B) 3000 basepair windows centered at reference position 3730411. Isolate 1 is the BAM alignment for the isolate collected first and the reference position 3730411 matches the reference allele (G). Isolate 2 is the BAM alignment for isolate collected 24 weeks after isolate 1 and reference position 3730411 supports an alternate allele (A).
Figure 5—figure supplement 3
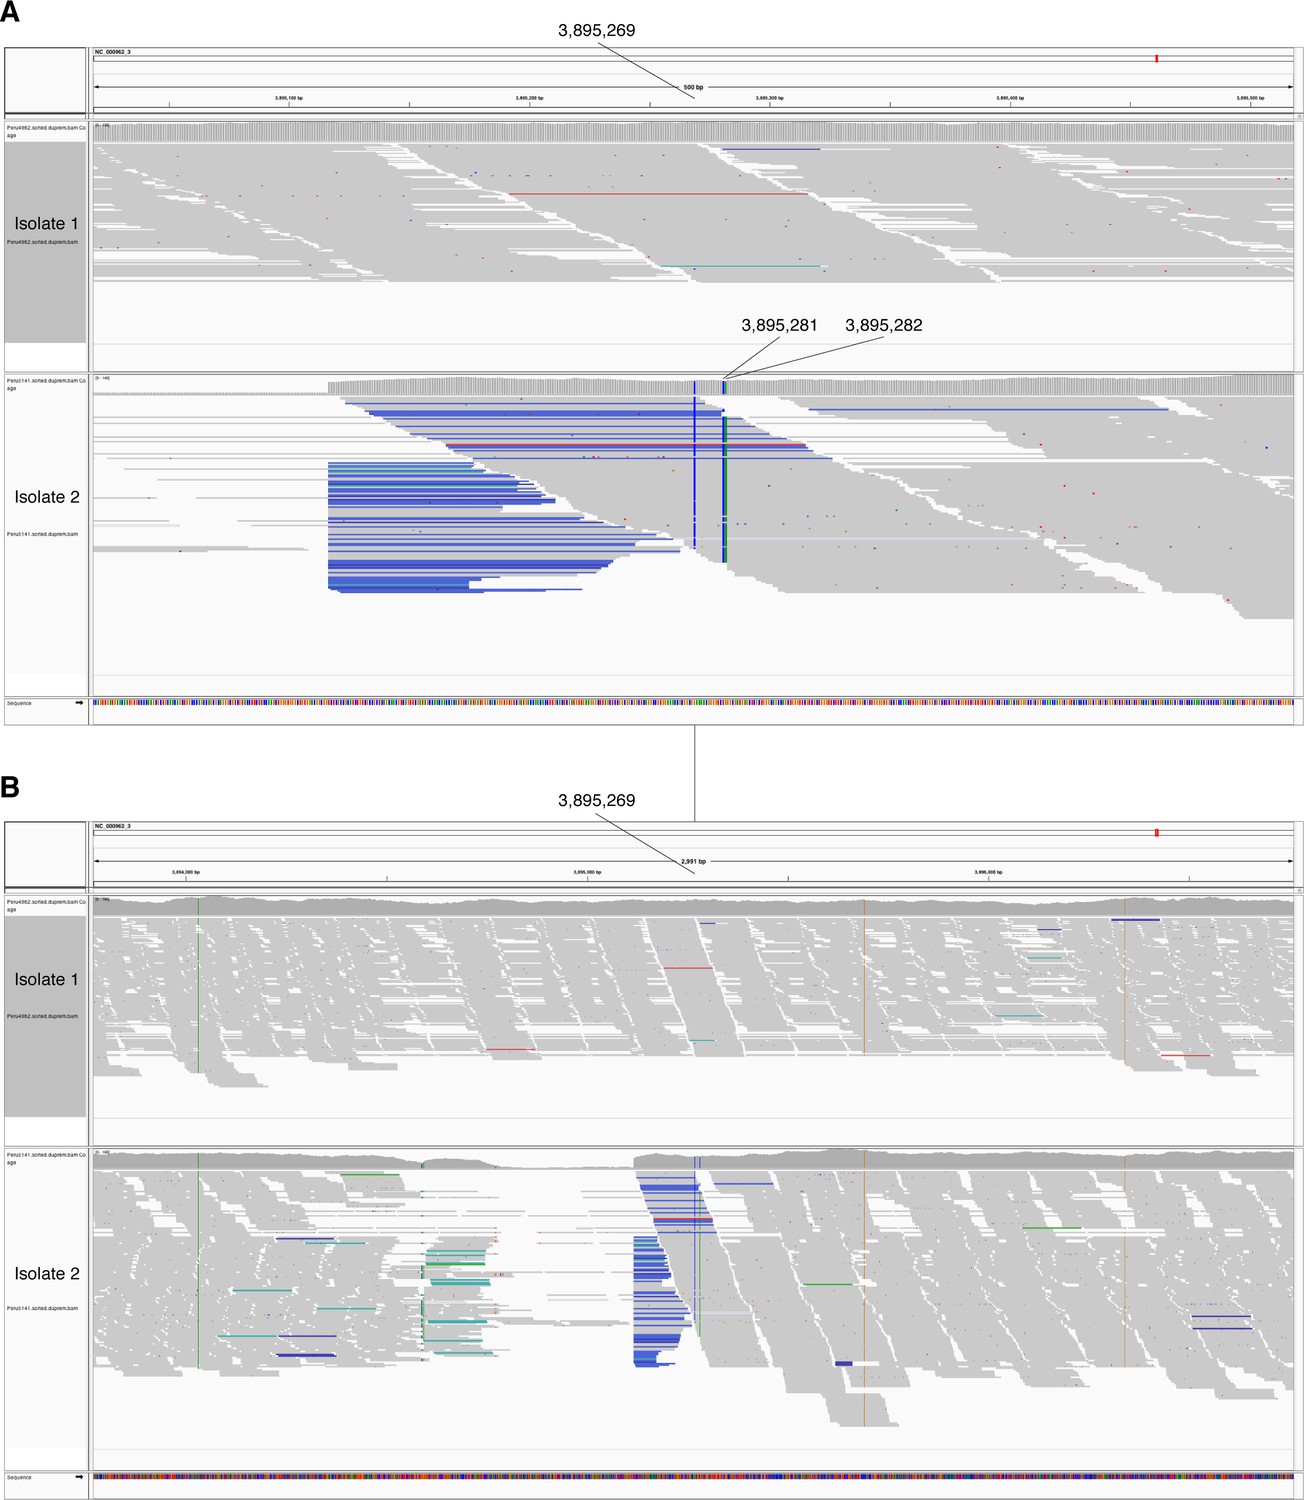
In-host SNPs detected in PPE60.
IGV (Thorvaldsdóttir et al., 2013) image of BAM alignment (reads sorted by start location) for longitudinal clinical isolates that were cultured from sputum collected from patient 3096 (Farhat et al., 2019). (A) 500 and (B) 3000 basepair windows centered at reference position 3895269. Isolate 1 is the BAM alignment for the isolate collected on September 25, 2001 and the reference positions 3895269, 3895281, 3895282 match the reference alleles (G,T,G respectively). Isolate 2 is the BAM alignment for isolate collected on October 18, 2002 and reference positions 3895269, 3895281, 3895282 support alternate alleles (C,C,A respectively).
Figure 6 with 2 supplements
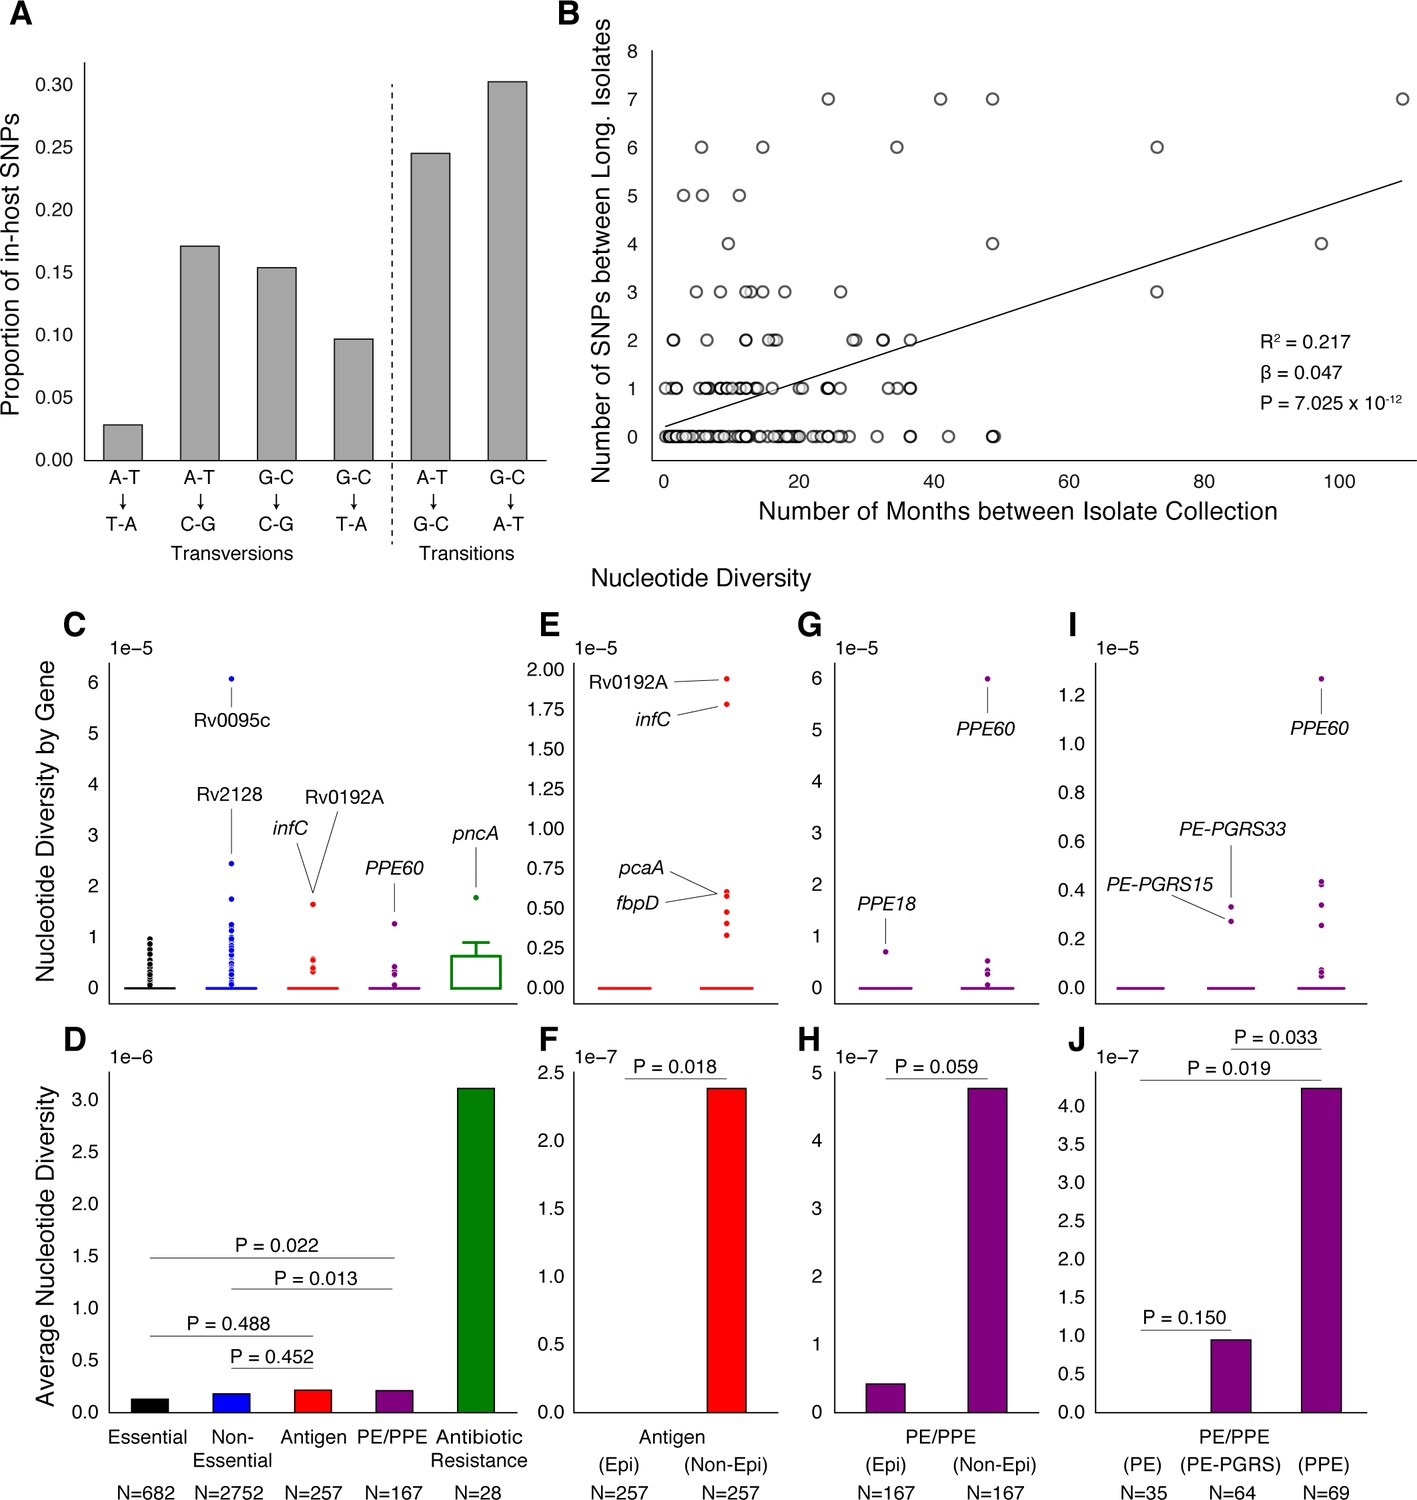
PE/PPE genes vary considerably within host while putative antigens remain conserved.
(A) Mutational spectrum of in-host SNPs. (B) In-host SNP counts vs. time between isolate collection (195/200 patients with dates shown, *W [Walker et al., 2013] isolates only had year of collection). (C) Boxplots of nucleotide diversity by gene within each of five non-redundant categories (see text; number of genes). (D) Average nucleotide diversity across genes by category. Nucleotide diversity in epitope and non-epitope region (Materials and methods) of each gene in the Antigen (E, F) and PE/PPE (G, H) gene categories. (l, J) PE/PPE genes separated into three non-redundant categories: PE, PE-PGRS, and PPE. (J) The average nucleotide diversity by category. (I) Box plot of nucleotide diversity by gene.
Figure 6—figure supplement 1
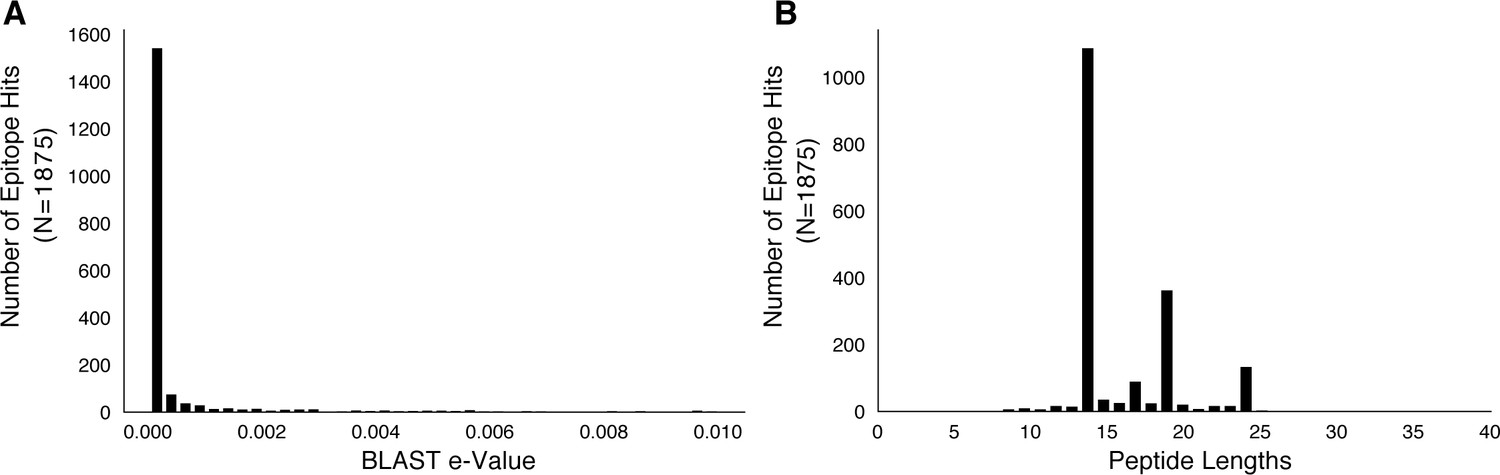
Basic characteristics of epitopes used in analysis.
We downloaded a set of 2031 epitope peptide sequences from IEDB (Vita et al., 2015) and used BLASTP to map these peptide sequences to H37Rv imposing an e-value cut-off of 0.01 (Materials and methods). (A) The distribution of e-values and (B) distribution of peptide lengths for the retained epitope mappings.
Figure 6—figure supplement 2
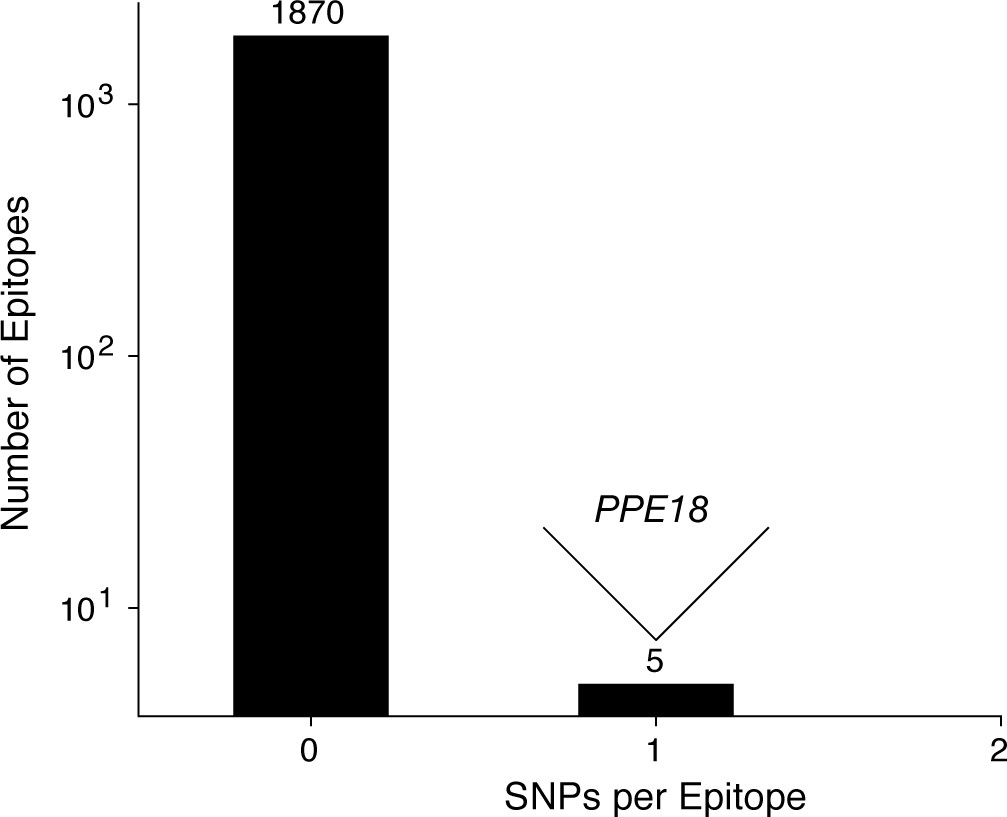
Most T cell epitopes remain conserved in-host during active TB disease.
No SNPs were detected in-host for a vast majority of CD4+ and CD8+ T cell epitopes, however, 1 SNP was detected in a small number of overlapping epitopes in PPE18. A list of these epitopes is given in Supplementary file 12.
Figure 7 with 2 supplements
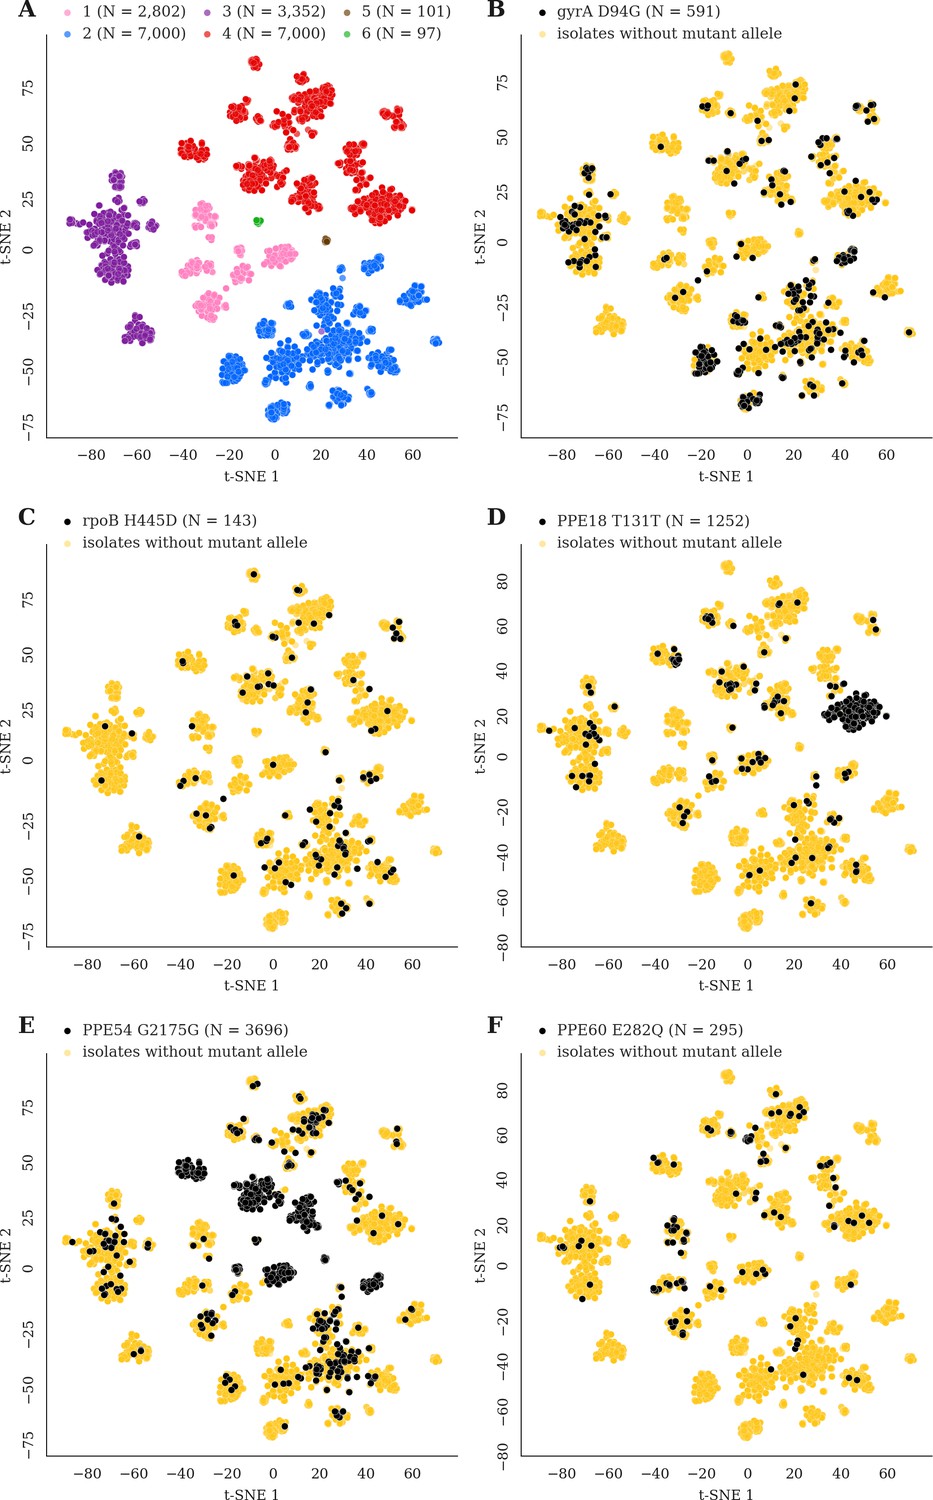
Mutations acquired in-host are phylogenetically convergent.
We constructed t-SNE plots from a pairwise SNP distance matrix for our global sample of 20,352 clinical isolates and 128,898 SNP sites (Materials and methods). (A) Labeling isolates by global lineage revealed that isolates cluster according to genetic similarity. Next, we labeled isolates by whether they carried a mutant allele that was also detected in-host. (B–F) Mutations in gyrA, rpoB, PPE18, PPE54, and PPE60 were detected in-host (Supplementary file 8), occur in a global collection of isolates (Supplementary file 18) and are scattered across the tSNE plots, indicating that they belong to genetically different clusters of isolates (Supplementary file 19). Furthermore, all mutations with a signal of phylogenetic convergence were detected in isolates belonging to different clusters, confirming that theses mutations must have arisen independently in different genetic backgrounds (Figure 7—figure supplements 1–2). Each plot is labeled with the gene name each mutation occurs within, amino acid encoded by the reference allele, H37Rv codon position, and amino acid encoded by the mutant allele. N = number of isolates with mutant allele.
Figure 7—figure supplement 1
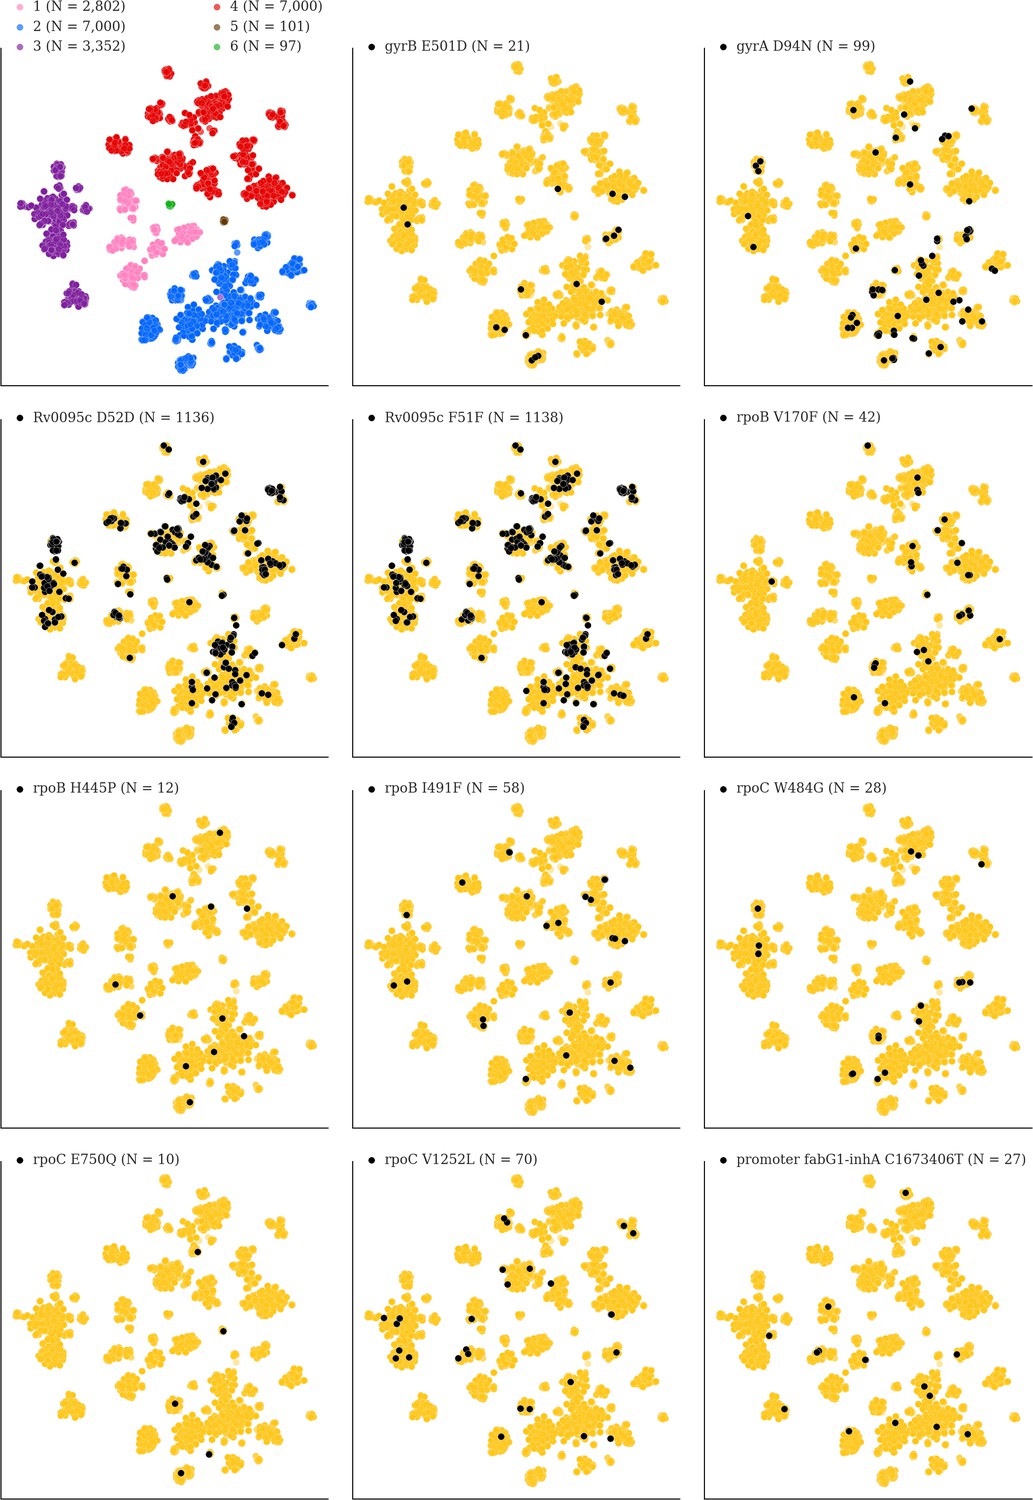
Mutations acquired in-host are phylogenetically convergent.
We constructed t-SNE plots from a pairwise SNP distance matrix for our global sample of 20,352 clinical isolates and 128,898 SNP sites (Materials and methods). Isolates are colored by global lineage in the first plot, the rest are colored by whether isolates had specific mutations in that were detected in-host (Supplementary file 8). These mutations occur in a global collection of isolates (Supplementary file 18) and are scattered across the tSNE plots, indicating that they belong to genetically different clusters of isolates (Supplementary file 19) and have arisen independently in different genetic backgrounds. Each plot is labeled with the gene name each mutation occurs within, amino acid encoded by the reference allele, H37Rv codon position, and amino acid encoded by the mutant allele (for intergenic mutations - reference allele, H37Rv genome coordinate, and mutant allele). N = number of isolates with mutant allele.
Figure 7—figure supplement 2
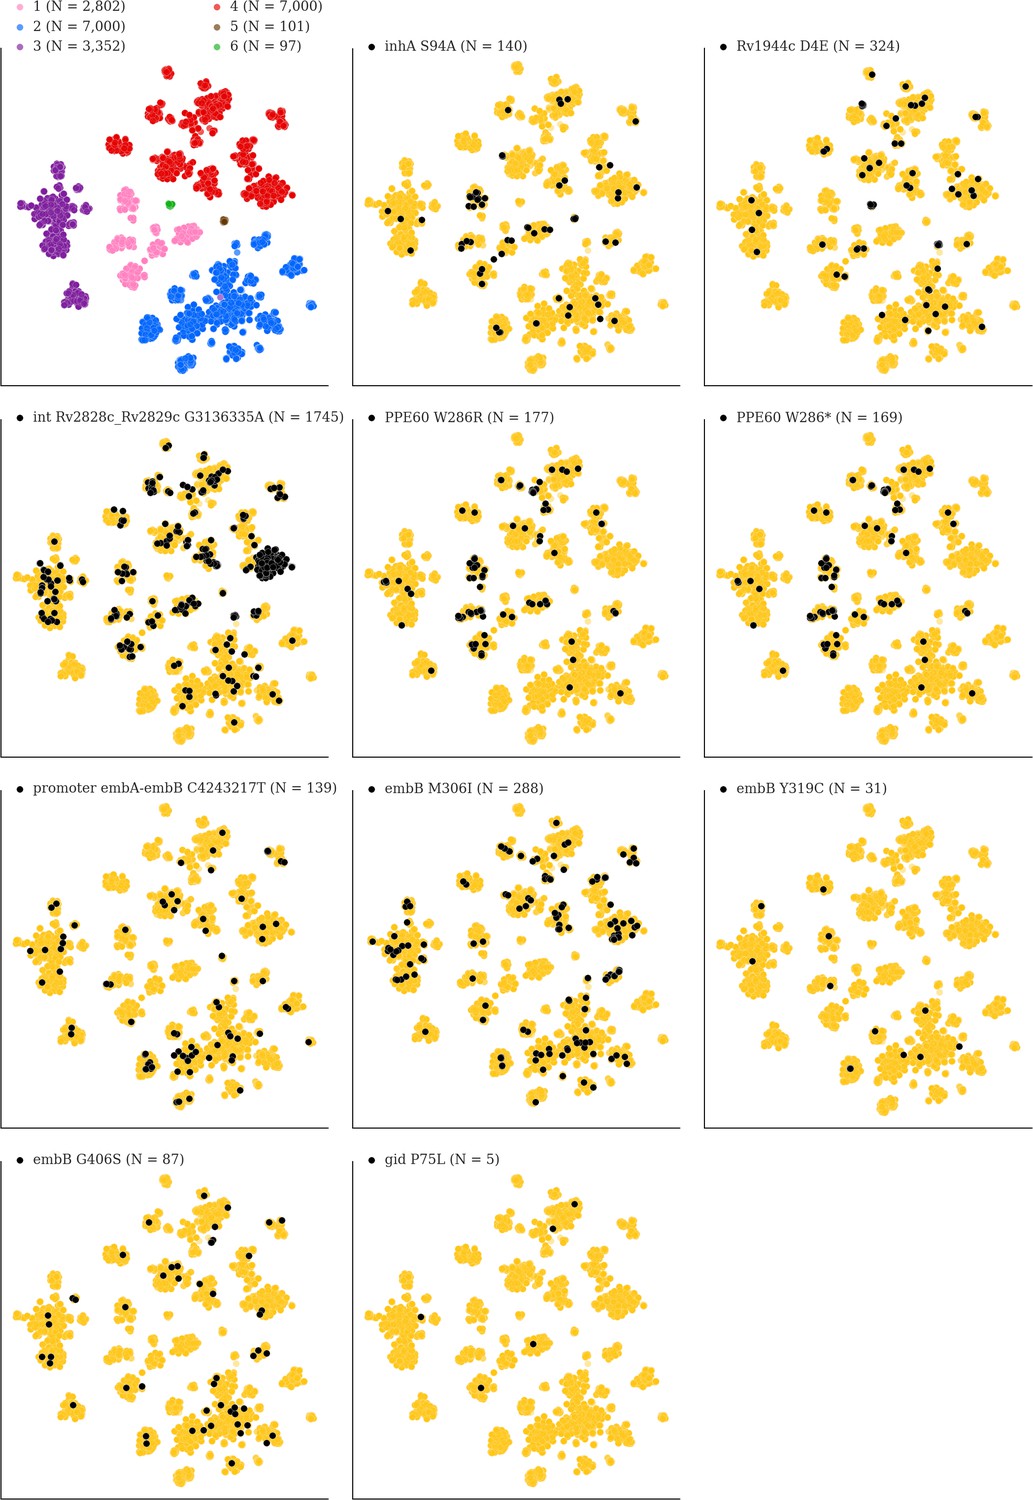
Mutations acquired in-host are phylogenetically convergent.
We constructed t-SNE plots from a pairwise SNP distance matrix for our global sample of 20,352 clinical isolates and 128,898 SNP sites (Materials and methods). Isolates are colored by global lineage in the first plot, the rest are colored by whether isolates had specific mutations in that were detected in-host (Supplementary file 8). These mutations occur in a global collection of isolates (Supplementary file 18) and are scattered across the tSNE plots, indicating that they belong to genetically different clusters of isolates (Supplementary file 19) and have arisen independently in different genetic backgrounds. Each plot is labeled with the gene name each mutation occurs within, amino acid encoded by the reference allele, H37Rv codon position, and amino acid encoded by the mutant allele (for intergenic mutations - reference allele, H37Rv genome coordinate, and mutant allele). N = number of isolates with mutant allele.
Appendix 1—figure 1
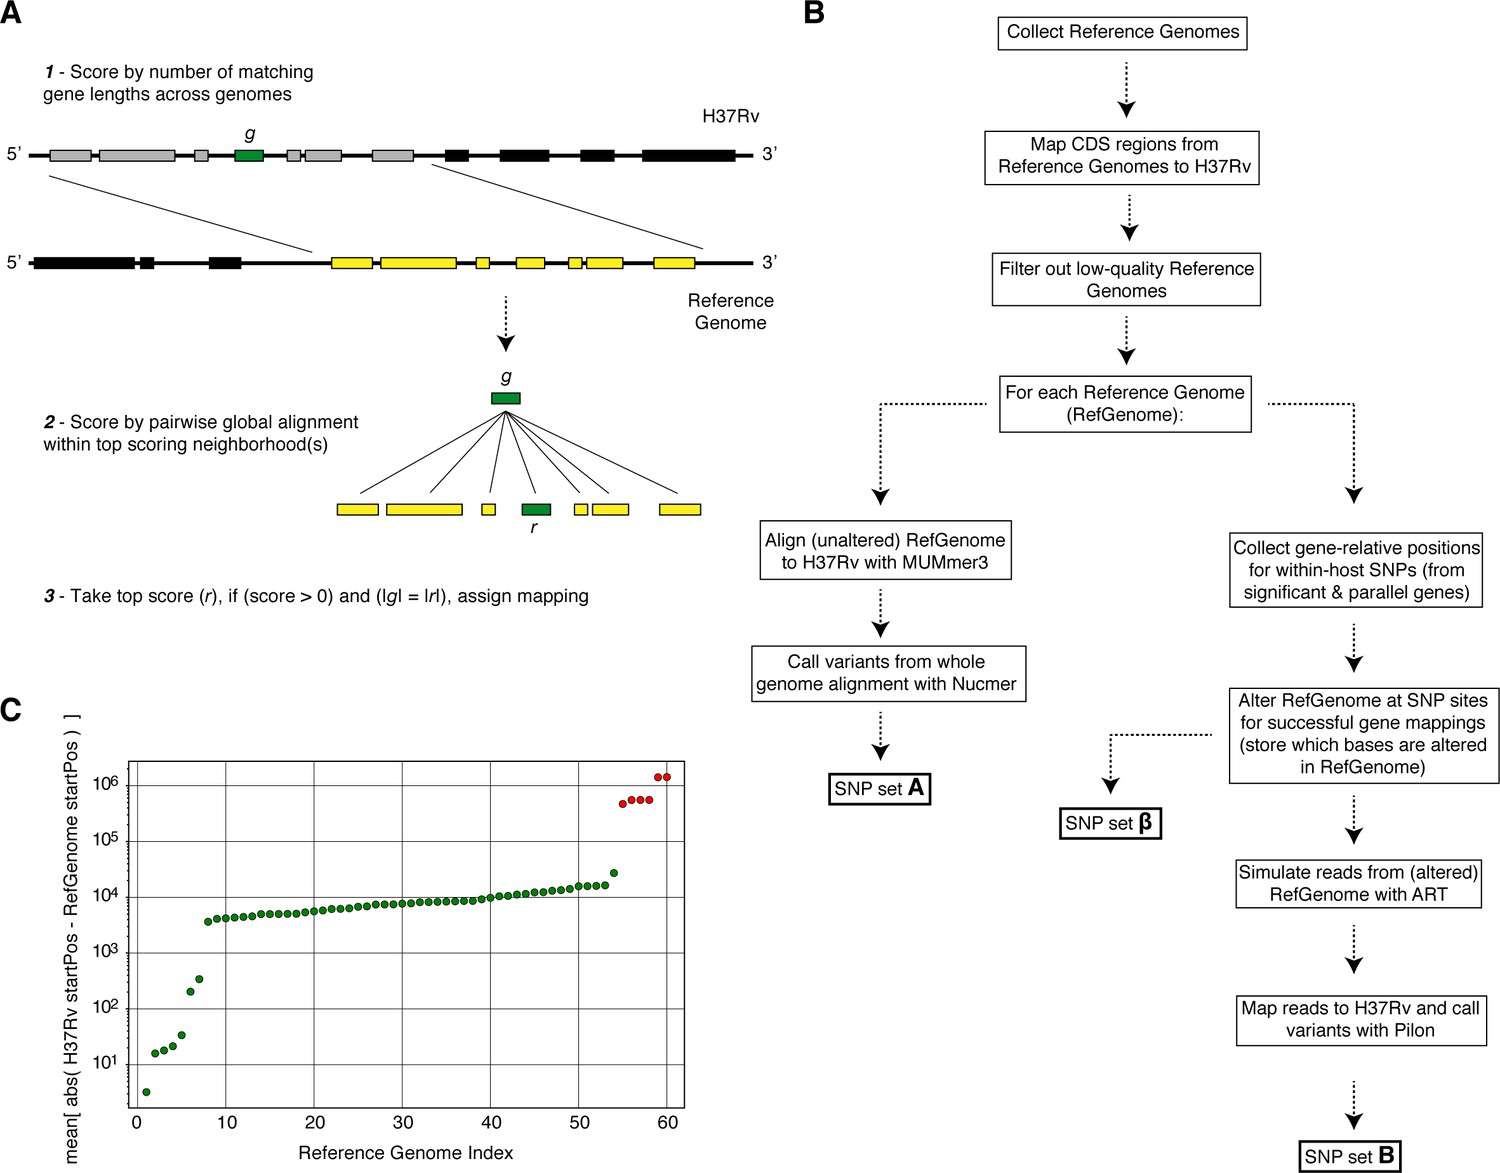
Overview of simulation methodology.
To test the accuracy of calling SNPs in repetitive regions with our workflow, we introduced mutations into complete Mycobacterium tuberculosis genomes (Reference Genomes), simulated reads from those genomes and assessed the accuracy recalling the mutations from the simulated reads while not introducing spurious mutations. (A) We used a sliding window of gene lengths along with a local alignment algorithm to map genes from the H37Rv reference genome to the set Reference Genomes. (C) We discarded Reference Genomes that mapped poorly (gene-to-gene) to the H37Rv reference genome (green-RefGenomes kept for simulations, red-discarded RefGenomes). (B) A schematic of our simulation methodology from Reference Genome collection to obtaining SNP sets , and which are used in our calculations of true positive and false positive calls for each gene.
Appendix 1—figure 2
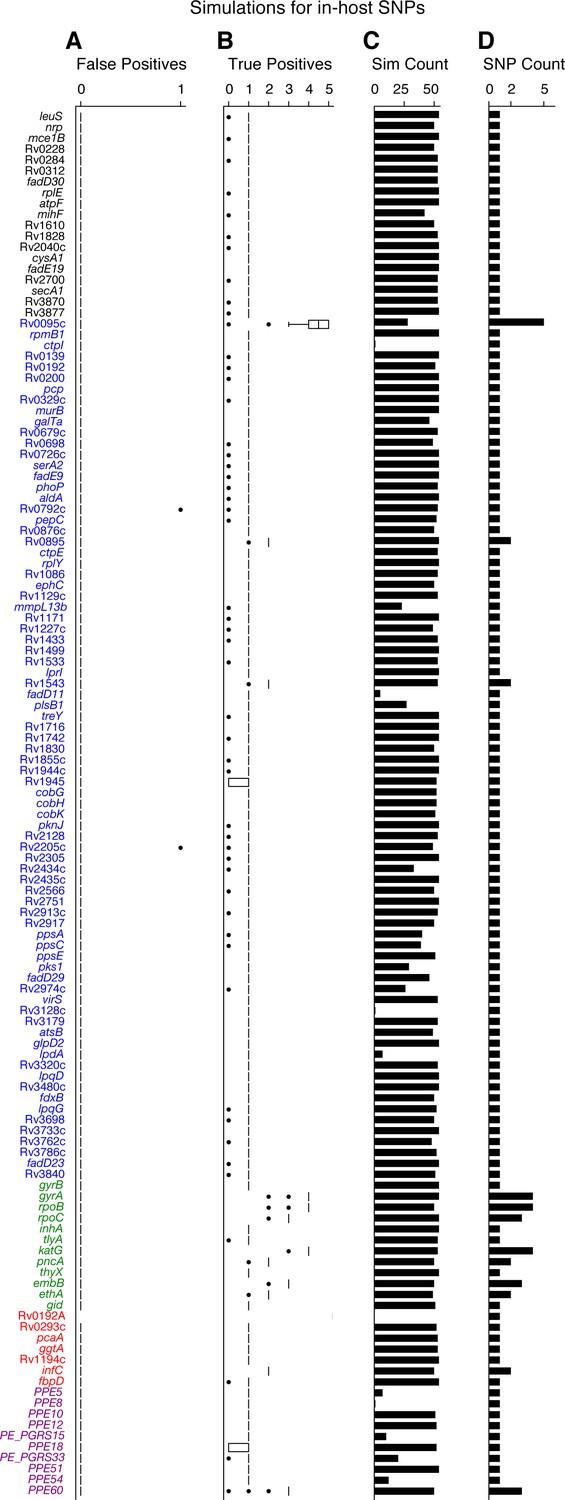
Simulations indicate that we can accurately recall most introduced SNPs while rarely making spurious SNP calls.
We tested the number of true and false positives for each gene with detectable in-host SNPs (Figure 5D). For each gene we collected a set of non-redundant in-host SNPs (genomic positions at which these SNPs were called) observed across all patients (Supplementary file 10), the number of SNPs collected for each gene is given in (D). We then introduced these mutations into 54 complete genomes (RefGenomes) (Supplementary file 9) and simulated reads after introducing the respective mutations. Only genes that were mapped from H37Rv to a given RefGenome were part of the simulation for that RefGenome. (C) The number of successful mappings for each gene (i.e. the number of times each gene was part of a simulation). This is also the number of times true and false positive estimates were calculated for each gene (one estimate / simulation). (A) False positive calls were rarely made across all genes and simulation runs indicating the rarity of false positive SNP calls (calling a mutation that wasn't introduced) made by our pipeline for observed in-host SNPs, even in repetitive regions. (B) The number of true positive calls across all genes (across most simulation runs) closely matched the number of introduced SNPs for each gene indicating the rarity of False Negative SNP calls (not calling a mutation that was introduced). We note that no true or false positive estimates for Rv0192A were computed since this gene did not map to H37Rv for any of the 54 Reference Genomes used for the simulations.
Appendix 3—figure 1
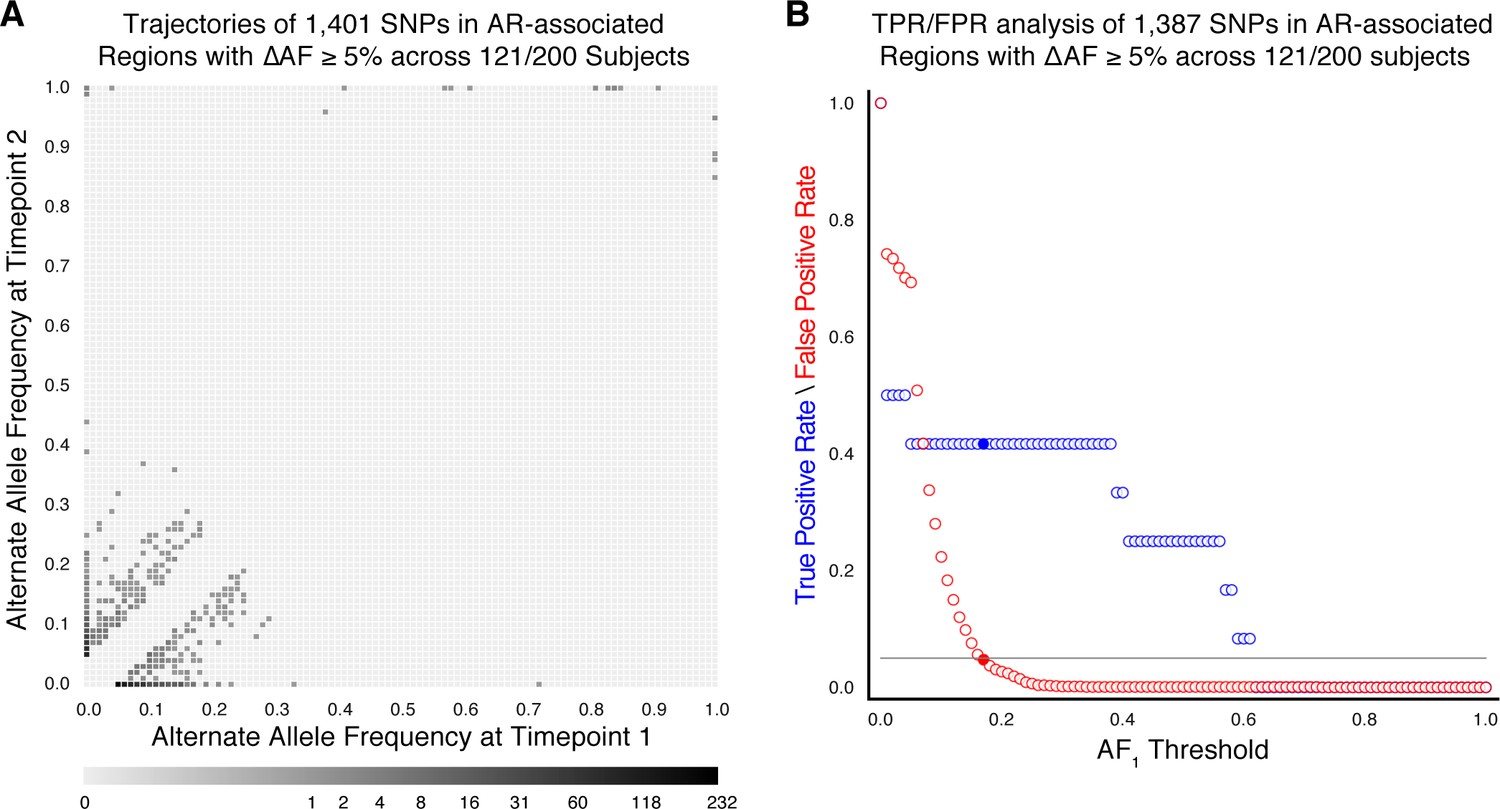
Allele frequency dynamics within antibiotic resistance loci in 121/200 confirmed failure/relapse patients.
(A) The allele frequency trajectories for SNPs that occur in patients over the course of infection can be used to study the prediction of further antibiotic resistance using the frequency of alternate alleles detected in the longitudinal isolates collected from patients. (B) Plot of true positive rate (TPR) and false positive rate (FPR) for detecting eventual fixation of a resistance allele ( 75%) as a function of initial allele frequency ().
Appendix 3—figure 2
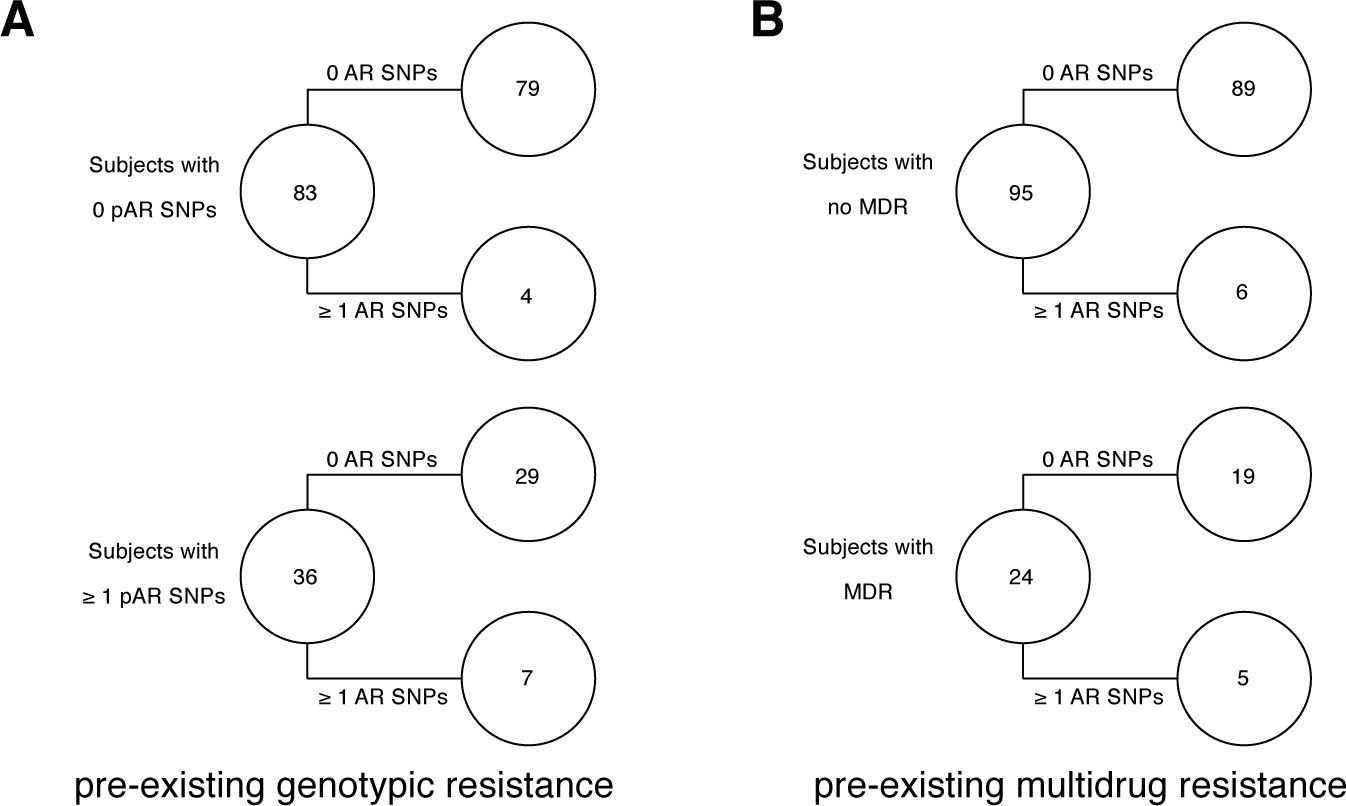
Pre-existing resistance is associated with resistance amplification in 121/200 confirmed failure/relapse patients.
Among patients who fail treatment, (A) patients with pre-existing mutations that confer antibiotic resistance and (B) those that have pre-existing MDR are more likely to acquire antibiotic resistance mutations throughout the course of infection.
Appendix 3—figure 3
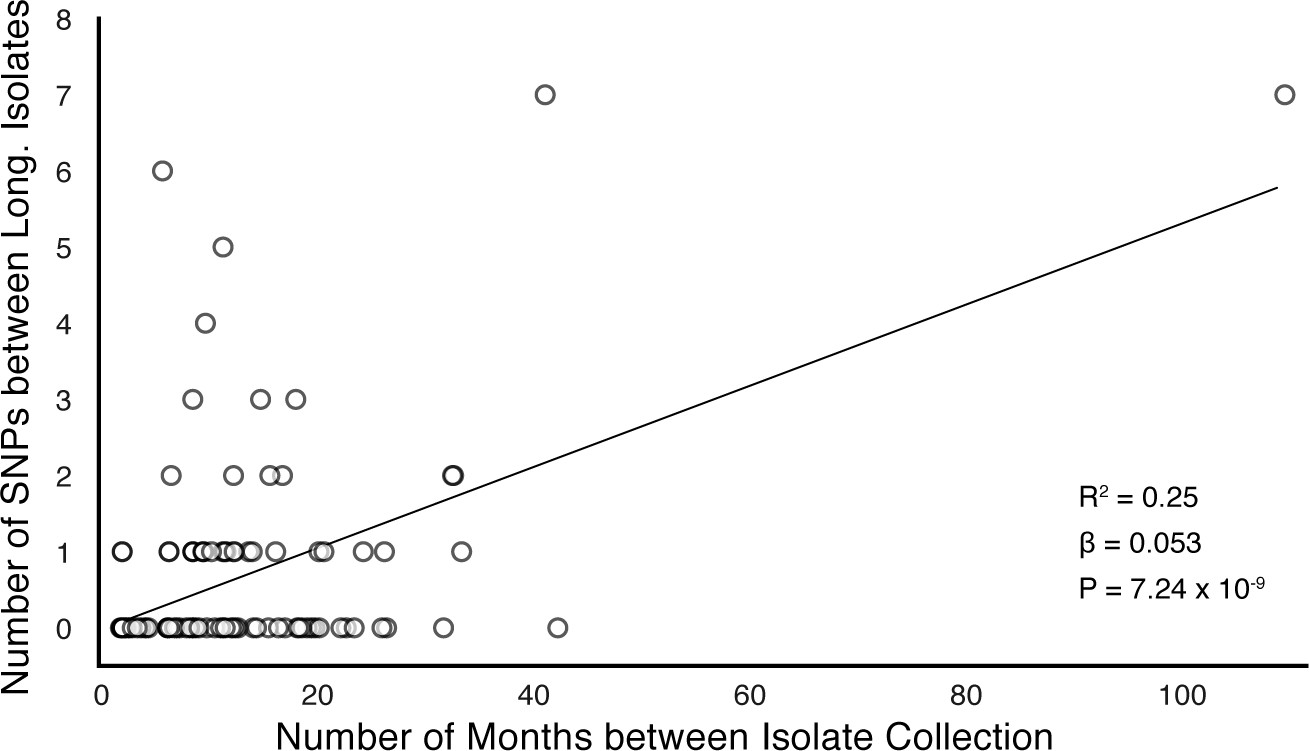
In-host SNP counts vs. time between isolate collection (119/121 confirmed failure/relapse patients with dates for both isolates shown).
Regressing the number of SNPs per patients on the timing between isolate collection, we found SNPs to accumulate at an average rate of 0.64 SNPs per genome per year ().
Additional files
-
Supplementary file 1
A table containing details for the eight studies; the sources for the longitudinal isolate pairs.
Information includes: (1) reference for each source study, (2) number of patients included in this study, (3) a description of the sample collection, (4) timing of when sputum samples were collected relative to treatment initiation/cessation (if available).
- https://cdn.elifesciences.org/articles/61805/elife-61805-supp1-v2.xlsx
-
Supplementary file 2
A table containing details for all replicate and longitudinal isolates before Kraken, F2, or pairwise SNP filtering.
Includes aggregated patient treatment from the source studies and metadata for each longitudinal isolate. We include columns that indicate the timing of sampling of Mtbc relative to treatment, the treatment regimen administered and final patient outcome (and relevant details). Patient outcomes are defined as follows: Delayed culture conversion (sputum culture positive at baseline and 2 months treatment initiation with genomic analysis consistent with clonal infection), Failure or Relapse (sputum culture positive at baseline and 4.5 months treatment initiation with genomic analysis consistent with clonal infection), Failure or Relapse or Default (sputum culture positive at interval of 4.5 months with genomic analysis consistent with clonal infection, only partial treatment data is available) or N/A if date data was of low resolution, not available or no treatment data was available. We also determined Reinfection and Mixed infection based on the genomic analysis. Legend for antibiotics: H = isoniazid, R = rifampicin, Rp = rifapentine, E = ethambutol, Z = pyrazinamide, C = capreomycin, S = cycloserine, P = para-aminosalicylic acid, Et = ethionamide, K = kanamycin, A = Amikacin, L = levofloxacin, Cf = ciprofloxacin, M = moxifloxacin, Sm = streptomycin.
- https://cdn.elifesciences.org/articles/61805/elife-61805-supp2-v2.xlsx
-
Supplementary file 3
A table containing details for all longitudinal isolates used for in-host analysis after filtering for contaminated and mixed isolate pairs.
- https://cdn.elifesciences.org/articles/61805/elife-61805-supp3-v2.xlsx
-
Supplementary file 4
A table with the gene categories assigned to each H37Rv locus tag.
- https://cdn.elifesciences.org/articles/61805/elife-61805-supp4-v2.xlsx
-
Supplementary file 5
A table containing a list of genomic regions (with H37Rv coordinates) associated with antibiotic resistance.
- https://cdn.elifesciences.org/articles/61805/elife-61805-supp5-v2.xlsx
-
Supplementary file 6
A table containing all SNPs (with ΔAF ≥ 5%) in loci associated with antibiotic resistance (Supplementary file 5) across our sample of 200 longitudinal isolate pairs.
- https://cdn.elifesciences.org/articles/61805/elife-61805-supp6-v2.xlsx
-
Supplementary file 7
A table containing all pre-existing antibiotic resistant SNPs detected in the first isolate collected from each patient with collection dates ≥2 months apart (178/200).
- https://cdn.elifesciences.org/articles/61805/elife-61805-supp7-v2.xlsx
-
Supplementary file 8
A table containing information for all 174 in-host SNPs detected across all longitudinal isolate pairs.
- https://cdn.elifesciences.org/articles/61805/elife-61805-supp8-v2.xlsx
-
Supplementary file 9
A table with details for the 54 publicly available completed (reference) genomes used in our simulations.
- https://cdn.elifesciences.org/articles/61805/elife-61805-supp9-v2.xlsx
-
Supplementary file 10
A table with the non-redundant in-host SNPs identified within genes and used for SNP calling simulations.
- https://cdn.elifesciences.org/articles/61805/elife-61805-supp10-v2.xlsx
-
Supplementary file 11
A table containing all of the epitopes downloaded from IEDB on May 23, 2018.
- https://cdn.elifesciences.org/articles/61805/elife-61805-supp11-v2.csv
-
Supplementary file 12
A table containing the epitopes belonging to PPE18 where an in-host SNP was detected.
- https://cdn.elifesciences.org/articles/61805/elife-61805-supp12-v2.xlsx
-
Supplementary file 13
A table of all genes identified as dense, along with assigned gene category and p-value from mutation density test.
- https://cdn.elifesciences.org/articles/61805/elife-61805-supp13-v2.xlsx
-
Supplementary file 14
A table of all genes identified as convergent, along with assigned gene category and the number of patients with an in-host SNP in each gene.
- https://cdn.elifesciences.org/articles/61805/elife-61805-supp14-v2.xlsx
-
Supplementary file 15
A table containing the downloaded SEED annotation for H37Rv.
- https://cdn.elifesciences.org/articles/61805/elife-61805-supp15-v2.tsv
-
Supplementary file 16
A table containing the list of H37Rv locus tags corresponding to each subsystem classified by SEED.
- https://cdn.elifesciences.org/articles/61805/elife-61805-supp16-v2.csv
-
Supplementary file 17
A table containing the pathways and (corresponding in-host SNPs) displaying evidence of parallel evolution.
- https://cdn.elifesciences.org/articles/61805/elife-61805-supp17-v2.xlsx
-
Supplementary file 18
A table with details for all SNP calls made in a global collection of 20,352 publicly available isolates after screening for in-host SNPs (Supplementary file 8).
- https://cdn.elifesciences.org/articles/61805/elife-61805-supp18-v2.xlsx
-
Supplementary file 19
A table with details for in-host SNPs (Supplementary file 8) that displayed a signature of phylogenetic convergence after screening a global collection of 20,352 publicly available isolates (Materials and methods).
The number of isolates with each unique mutation (broken down by global lineage) is given.
- https://cdn.elifesciences.org/articles/61805/elife-61805-supp19-v2.xlsx
-
Supplementary file 20
A table containing details for isolates that underwent Illumina and PacBio sequencing.
- https://cdn.elifesciences.org/articles/61805/elife-61805-supp20-v2.xlsx
-
Supplementary file 21
A table containing the genotypic resistance predictions for 13 antibiotics for all 614 longitudinal isolates from the 307 patients in our study (S: susceptible, R: resistant).
Legend for antibiotics: INH = isoniazid, RIF = rifampicin, EMB = ethambutol, PZA = pyrazinamide, CAP = capreomycin, PAS = para-aminosalicylic acid, ETH = ethionamide, KAN = kanamycin, AMK = Amikacin, LEVO = levofloxacin, CIP = ciprofloxacin, OFLX = ofloxacin, STR = streptomycin.
- https://cdn.elifesciences.org/articles/61805/elife-61805-supp21-v2.xlsx
-
Transparent reporting form
- https://cdn.elifesciences.org/articles/61805/elife-61805-transrepform-v2.pdf
Download links
A two-part list of links to download the article, or parts of the article, in various formats.
Downloads (link to download the article as PDF)
Open citations (links to open the citations from this article in various online reference manager services)
Cite this article (links to download the citations from this article in formats compatible with various reference manager tools)
In-host population dynamics of Mycobacterium tuberculosis complex during active disease
eLife 10:e61805.
https://doi.org/10.7554/eLife.61805


