An atlas of the binding specificities of transcription factors in Pseudomonas aeruginosa directs prediction of novel regulators in virulence
Figures
Figure 1 with 1 supplement
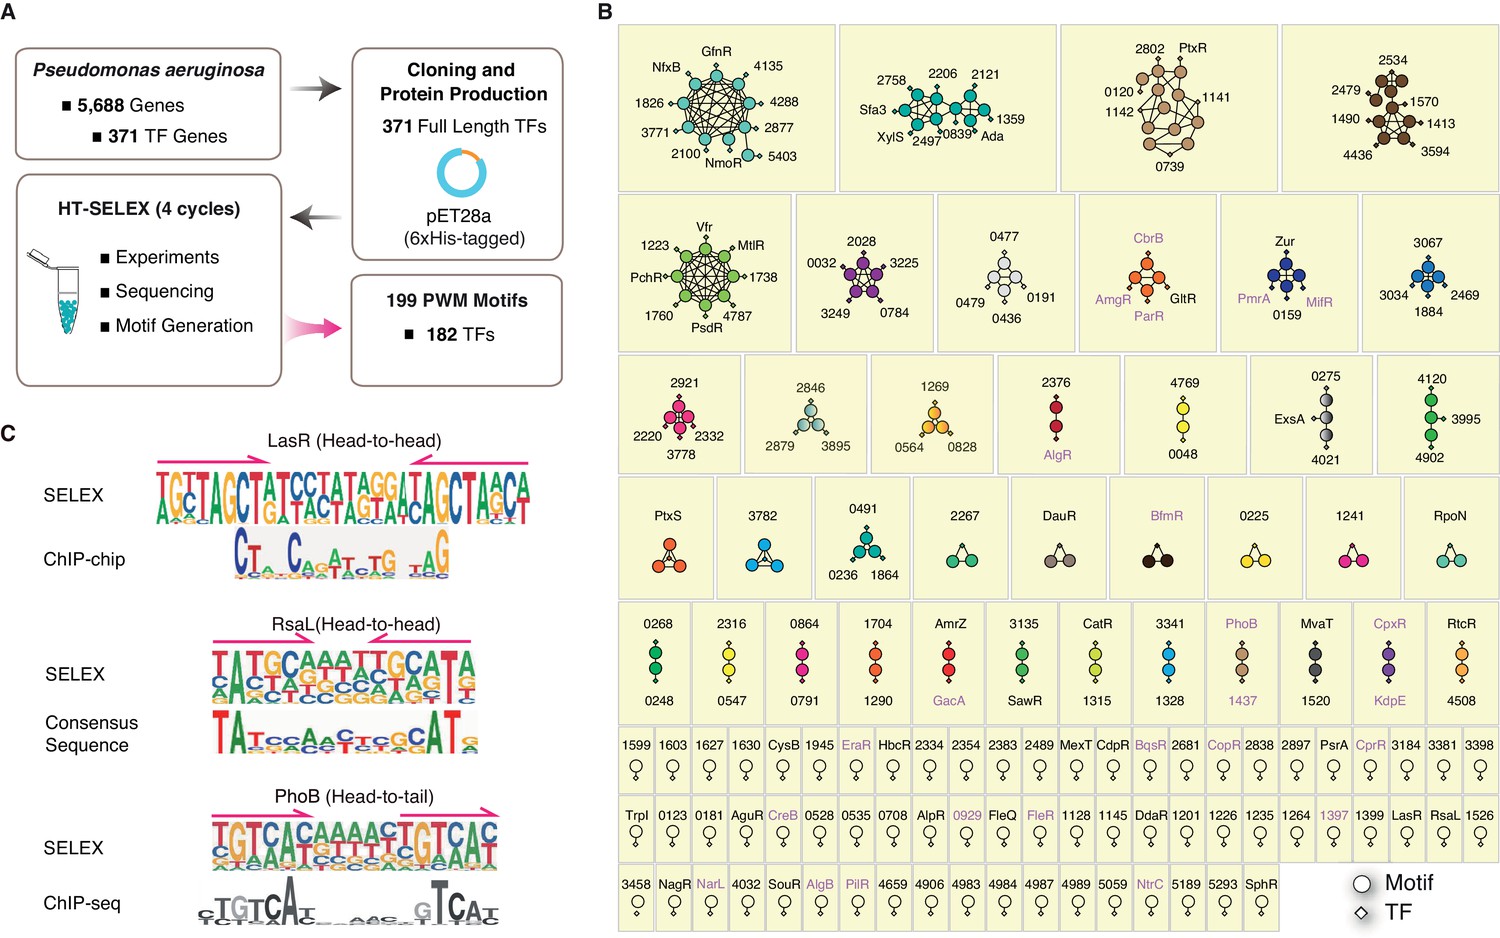
Summary of the HT-SELEX results in P. aeruginosa.
(A) Schematic description of protein expression and HT-SELEX procedure and output. (B) Network analysis of similarity of the obtained PWMs. Diamonds indicate TF genes, circles indicate individual PWMs. Edges are drawn between a TF and its PWM model, and between similar models if SSTAT similarity score >1.5e-05. To save space, ‘PA’ is omitted in all TFs names. The names of RRs of TCS are marked in pink font. (C) Comparison of the binding motifs of three TFs (LasR, RsaL, and PhoB) obtained from HT-SELEX (upper) and ChIP or cross-species sequence alignment methods (lower). Arrows indicate half-sites in dimeric sites. Also see Figure 1—figure supplement 1, Supplementary file 1.
Figure 1—figure supplement 1
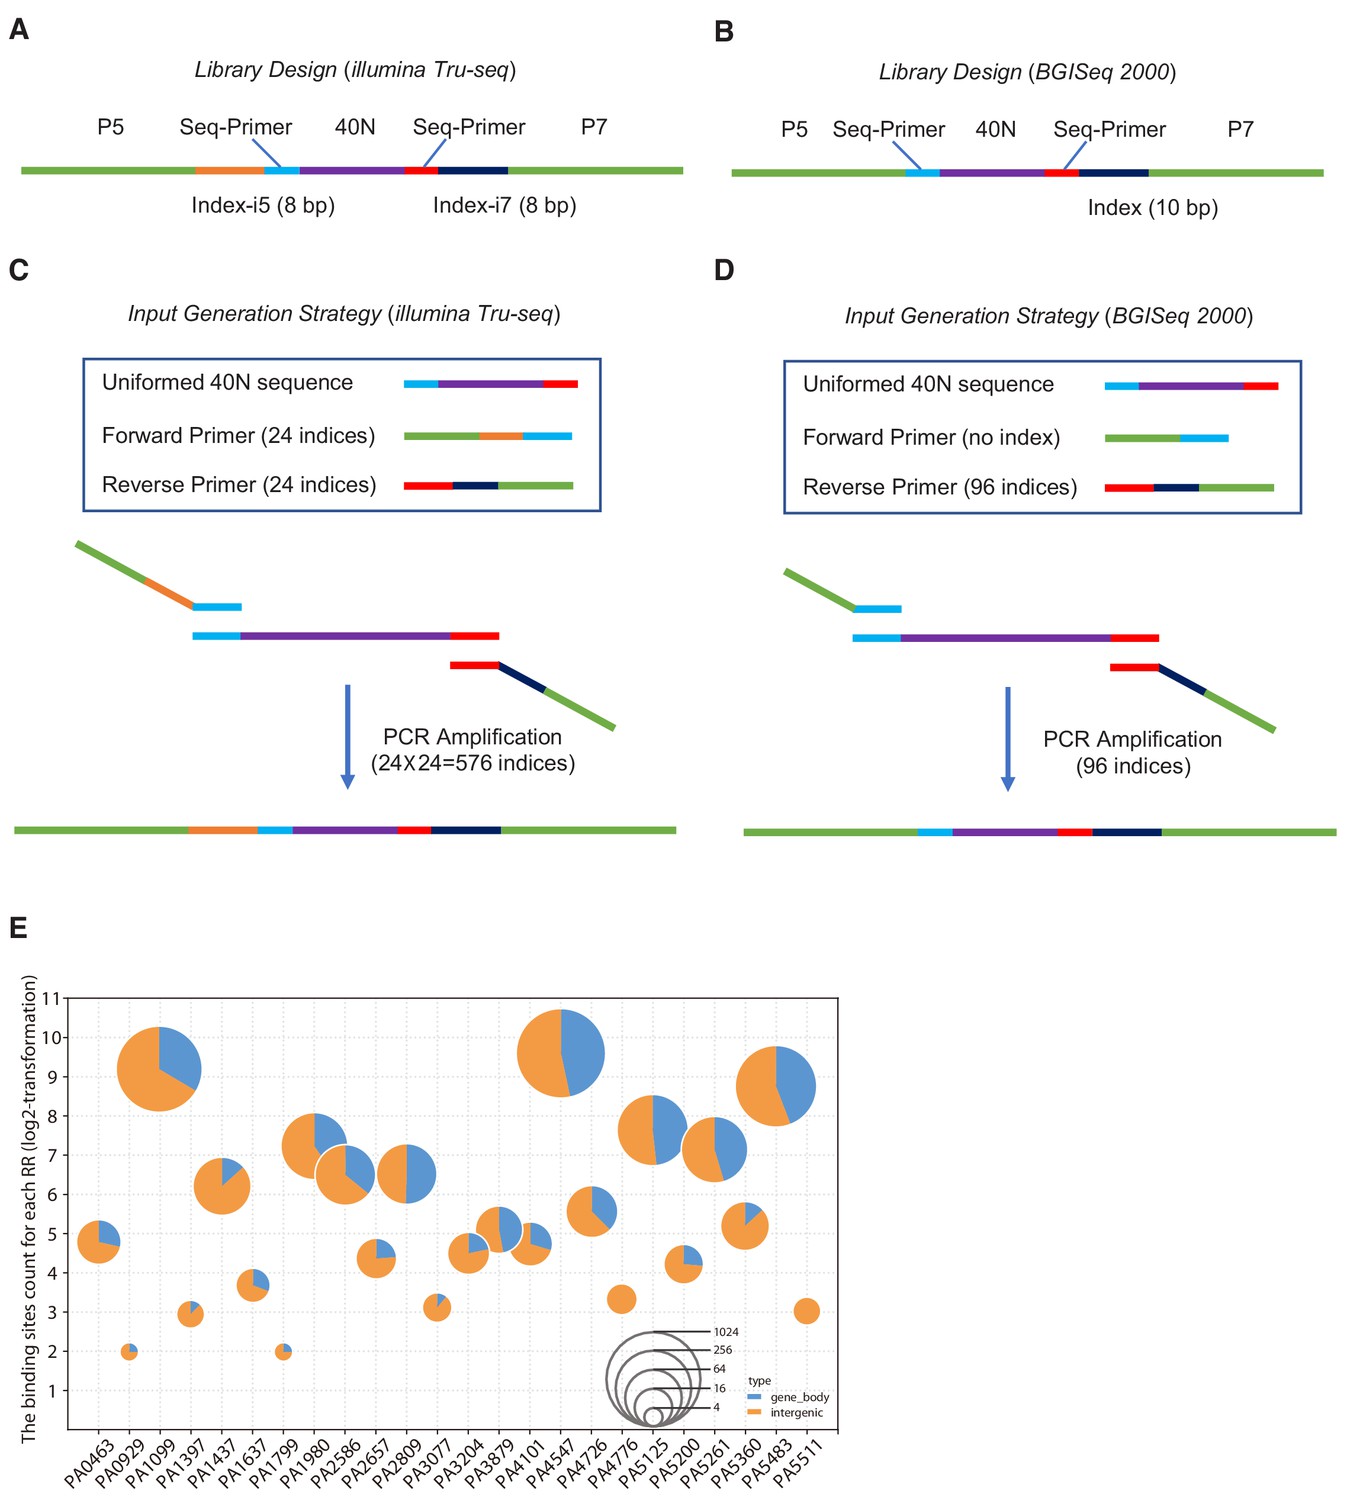
Ligand design of HT-SELEX and the distribution of the 24 RRs genomic binding, related to Figure 1A and Figure 1B, and Figure 2D.
(A–D) The schematic diagram for generating the input library for HT-SELEX. (E) The location and the number of binding sites for 24 RRs. The horizontal axis represents the name of each RR, and the positions annotation of 24 different RRs binding sites in the P. aeruginosa genome using pie charts, and the area of each pie chart represents the number of binding sites (log2-transformation).
Figure 2 with 12 supplements
Comparison of different TF-binding modes.
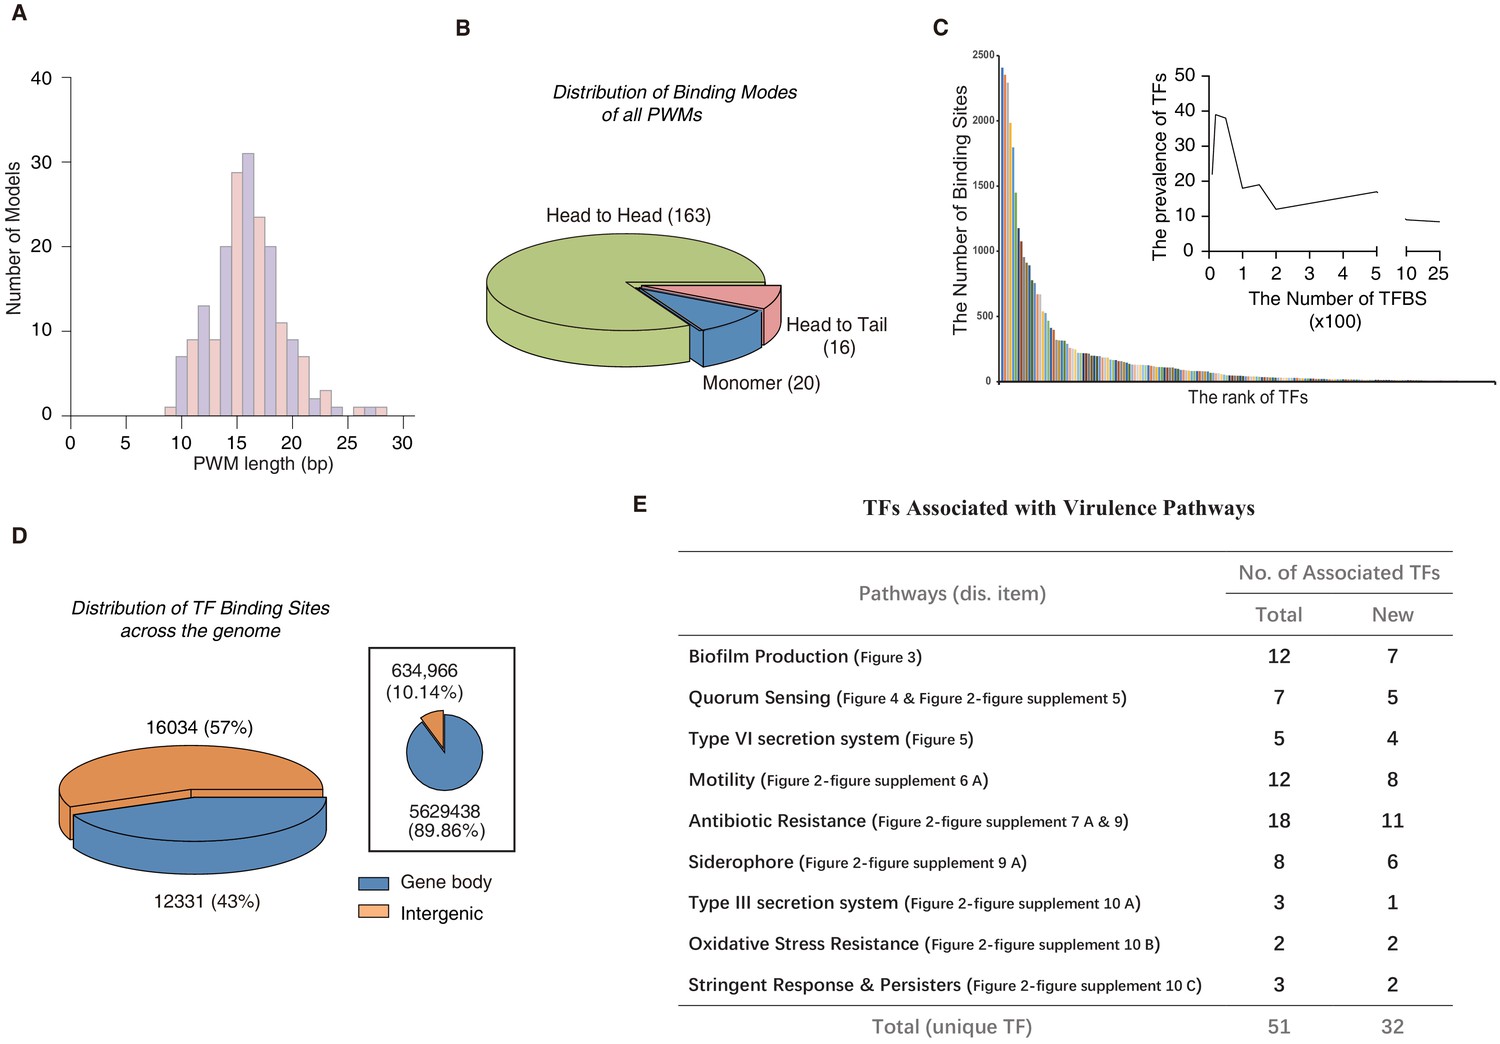
(A) Histogram shows the distribution of the lengths of all PWM models, using red for odds numbers and blue for even numbers for better illustration. (B) Pie chart shows the category of different TF-binding modes. Classification of all binding models into non-repetitive sites (monomer) and sites with two similar subsequences (dimer). The dimeric types are further classified as head-to-head (two TF protein molecules bind to opposite orientation on DNA) and head-to-tail (two TF protein molecules bind consecutively on the same orientation on DNA). (C) Bar chart shows the number of the binding sites per TF. Note that most of TFs target fewer than 100 genes, while eight TFs exceptionally bind to more than 1000 sites in the genome. The inset histogram shows the prevalence of TFs with the corresponding number of predicted TFBSs. (D) The position annotation of binding sites of all 182 TFs in the P. aeruginosa genome using pie charts. The pie chart area is proportional to the percentage of predicted binding site location for all TFs, either inside (blue) or outside (orange) gene body regions. The inset shows the fraction of gene body (blue) and intergenic (orange) regions in the genome, reflected by the area of the two colors in the pie chart. (E) The number of TFs potentially significantly associated with nine virulence-associated pathways. The corresponding transcriptional regulatory network and validation details for each pathway are indicated in the parenthesis (display item). Note that newly associated TFs indicate that the TFs are uncharacterized genes. Also see Figure 2—figure supplement 12.
-
Figure 2—source data 1
Source data for Figure 2A.
- https://cdn.elifesciences.org/articles/61885/elife-61885-fig2-data1-v2.xlsx
-
Figure 2—source data 2
Source data for Figure 2C.
- https://cdn.elifesciences.org/articles/61885/elife-61885-fig2-data2-v2.xlsx
Figure 2—figure supplement 1
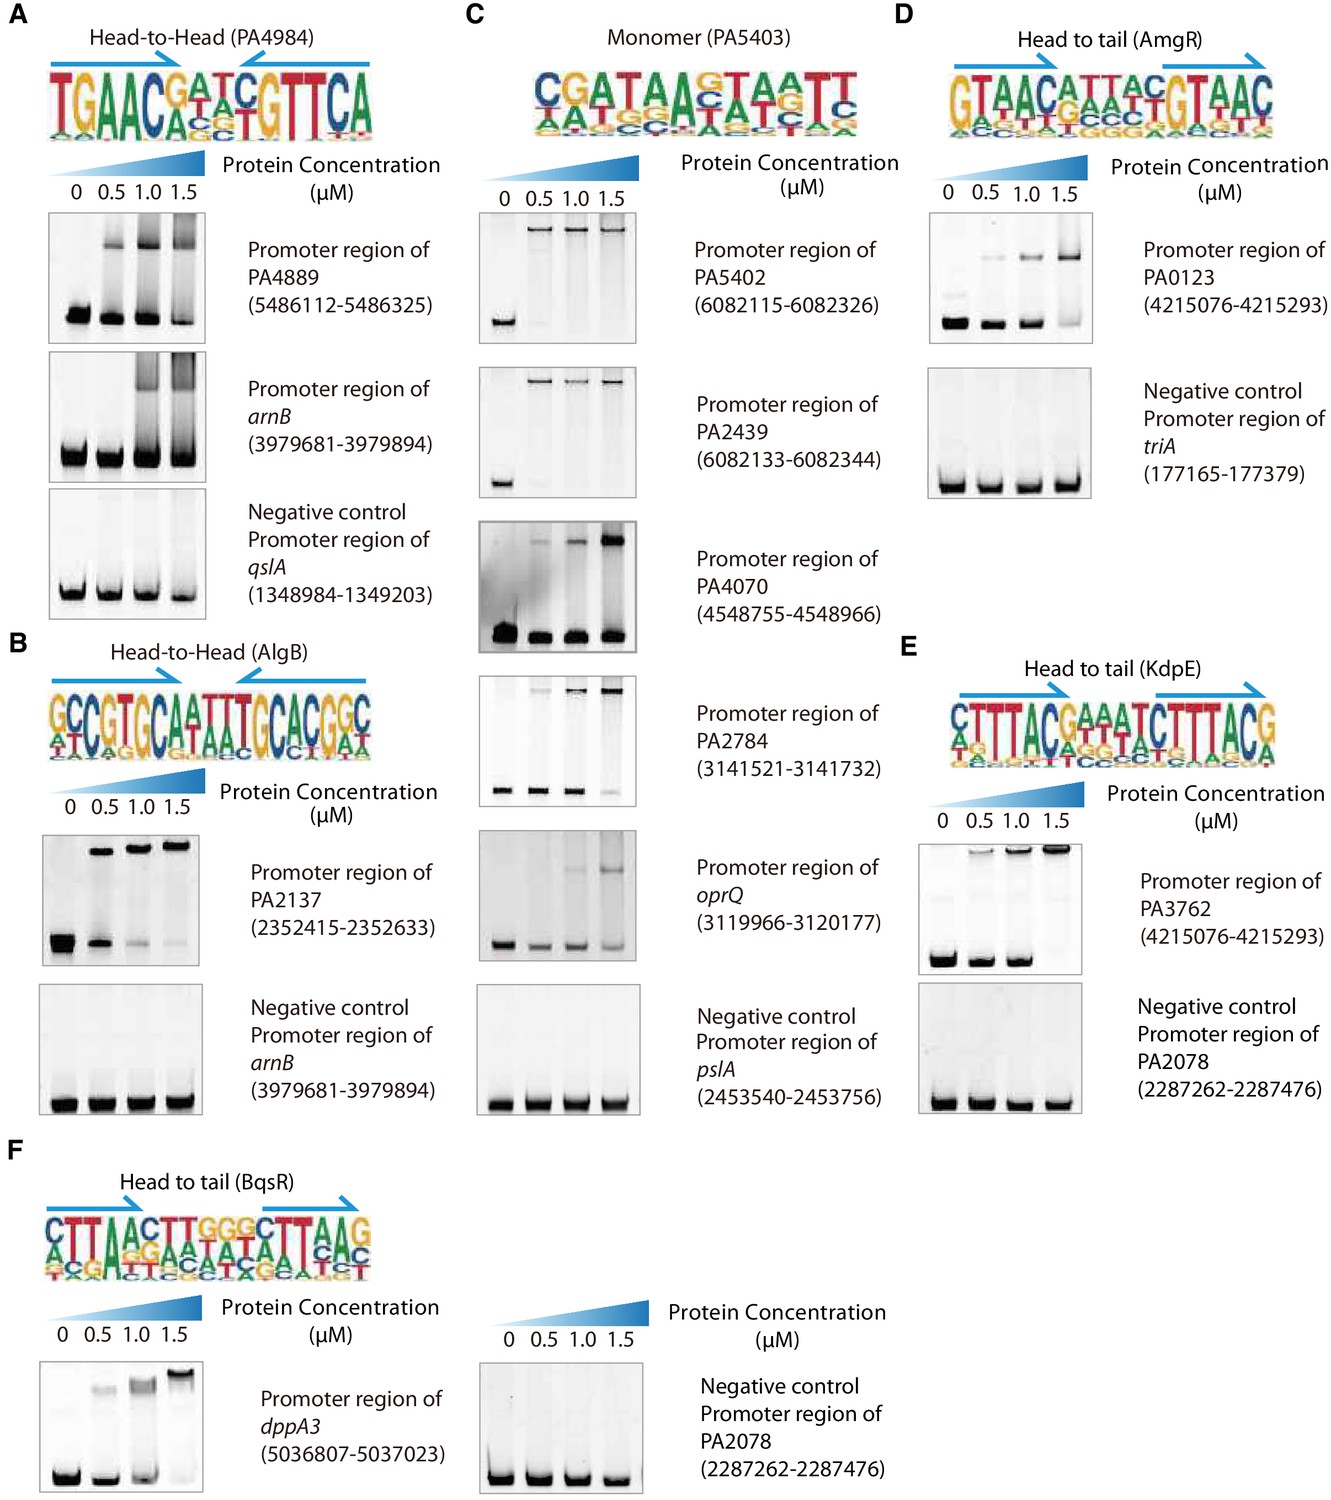
Validation of different modes of TF binding, related to Figure 2.
(A) Electrophoretic mobility shift assay (EMSA) validation (head-to-head) for the predicted binding of PA4984 in the promoters of the genes PA4889 and arnB. By contrast, the promoter fragment of qslA is used as the negative control for PA4984. (B) EMSA validation (head-to-head) for the predicted binding of AlgB in the promoters of the genes PA2137. By contrast, the promoter fragment of arnB is used as the negative control for AlgB. (C) EMSA validation (monomer) for predicted binding of PA5403 in five promoters (PA5402, PA2439, PA4070, PA2784, and oprQ). By contrast, the promoter fragment of pslA is used as the negative control for PA5403. (D) EMSA validation (head-to-tail) for predicted binding of AmgR in PA0123 promoter. By contrast, the promoter fragment of triA is used as the negative control for AmgR. (E) EMSA validation (head-to-tail) for predicted binding of KdpE in the promoters of the gene PA3762. By contrast, the promoter fragment of PA2078 is used as the negative control for KdpE. (F) EMSA validation (head-to-tail) for the predicted binding of BqsR in the promoters of the gene dppA3. By contrast, the promoter fragment of PA2078 is used as the negative control for BqsR. Note that the up-shift bands of DNA in gel were observed for all samples. By contrast, the promoter fragments of negative control DNA showing no binding to PA4984, AlgB, PA5403, AmgR, KdpE, and BqsR, respectively. The TF motifs are shown in the upper panel of EMSA, respectively. Arrows indicate half-sites in dimeric binding.
Figure 2—figure supplement 2
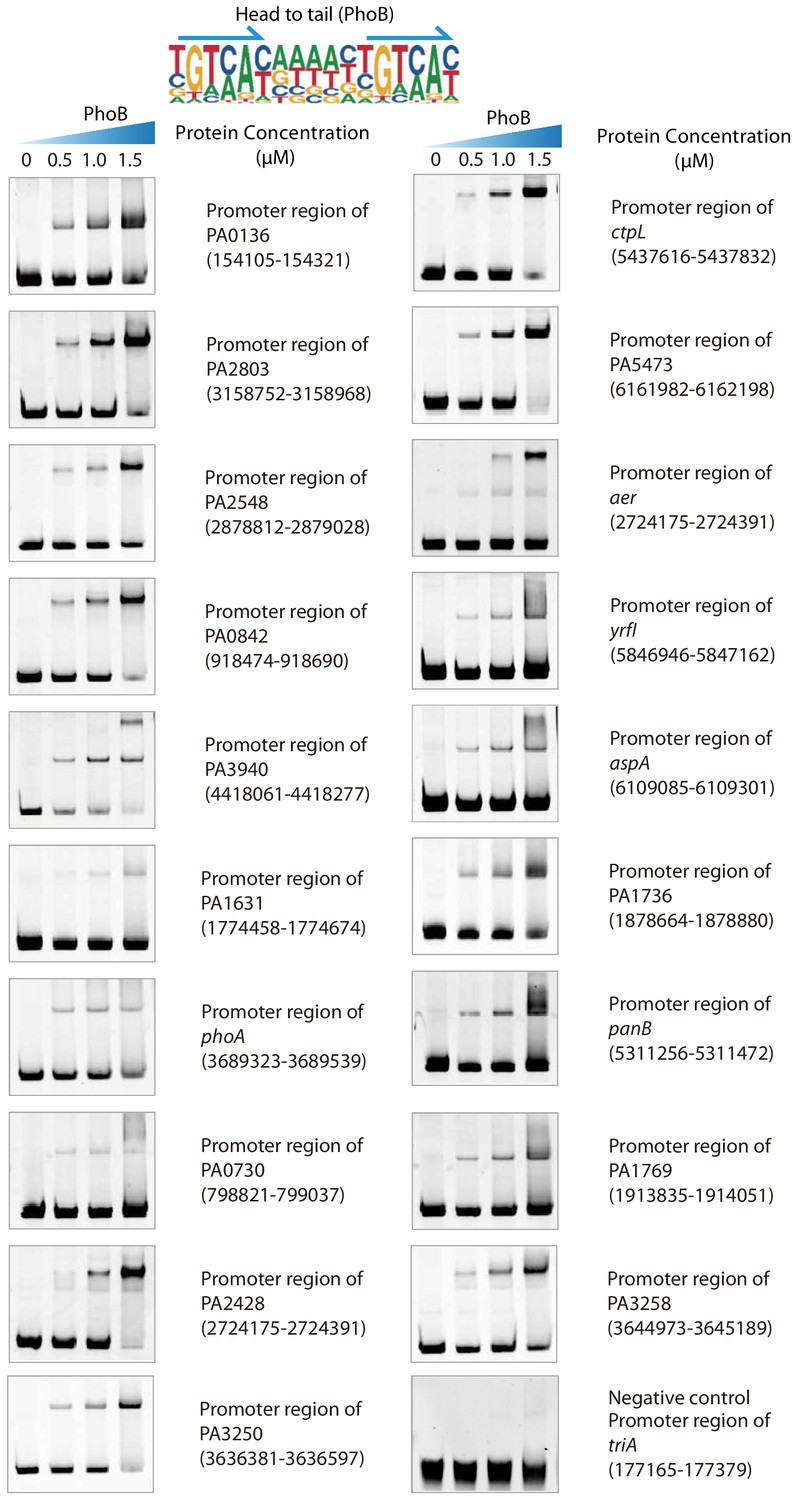
Validation of different modes of PhoB binding, related to Figure 2.
Electrophoretic mobility shift assay (EMSA) validation (head-to-tail) for the predicted binding of PhoB in the promoters of PA0136, PA2803, PA2548, PA0842, PA3940, PA1631, phoA, PA0730, PA2428, PA3250, ctpL, PA5473, aer, yrfI, aspA, PA1736, panB, PA1769, and PA3258. By contrast, the promoter fragment of triA is used as the negative control for PhoB binding. Note that the up-shift bands of DNA in gel were observed in all experiments. By contrast, the fragments of negative control DNA showed no binding to PhoB. The TF motif of PhoB is shown in the upper panel of EMSA. Arrows indicate half-sites in dimeric binding.
Figure 2—figure supplement 3
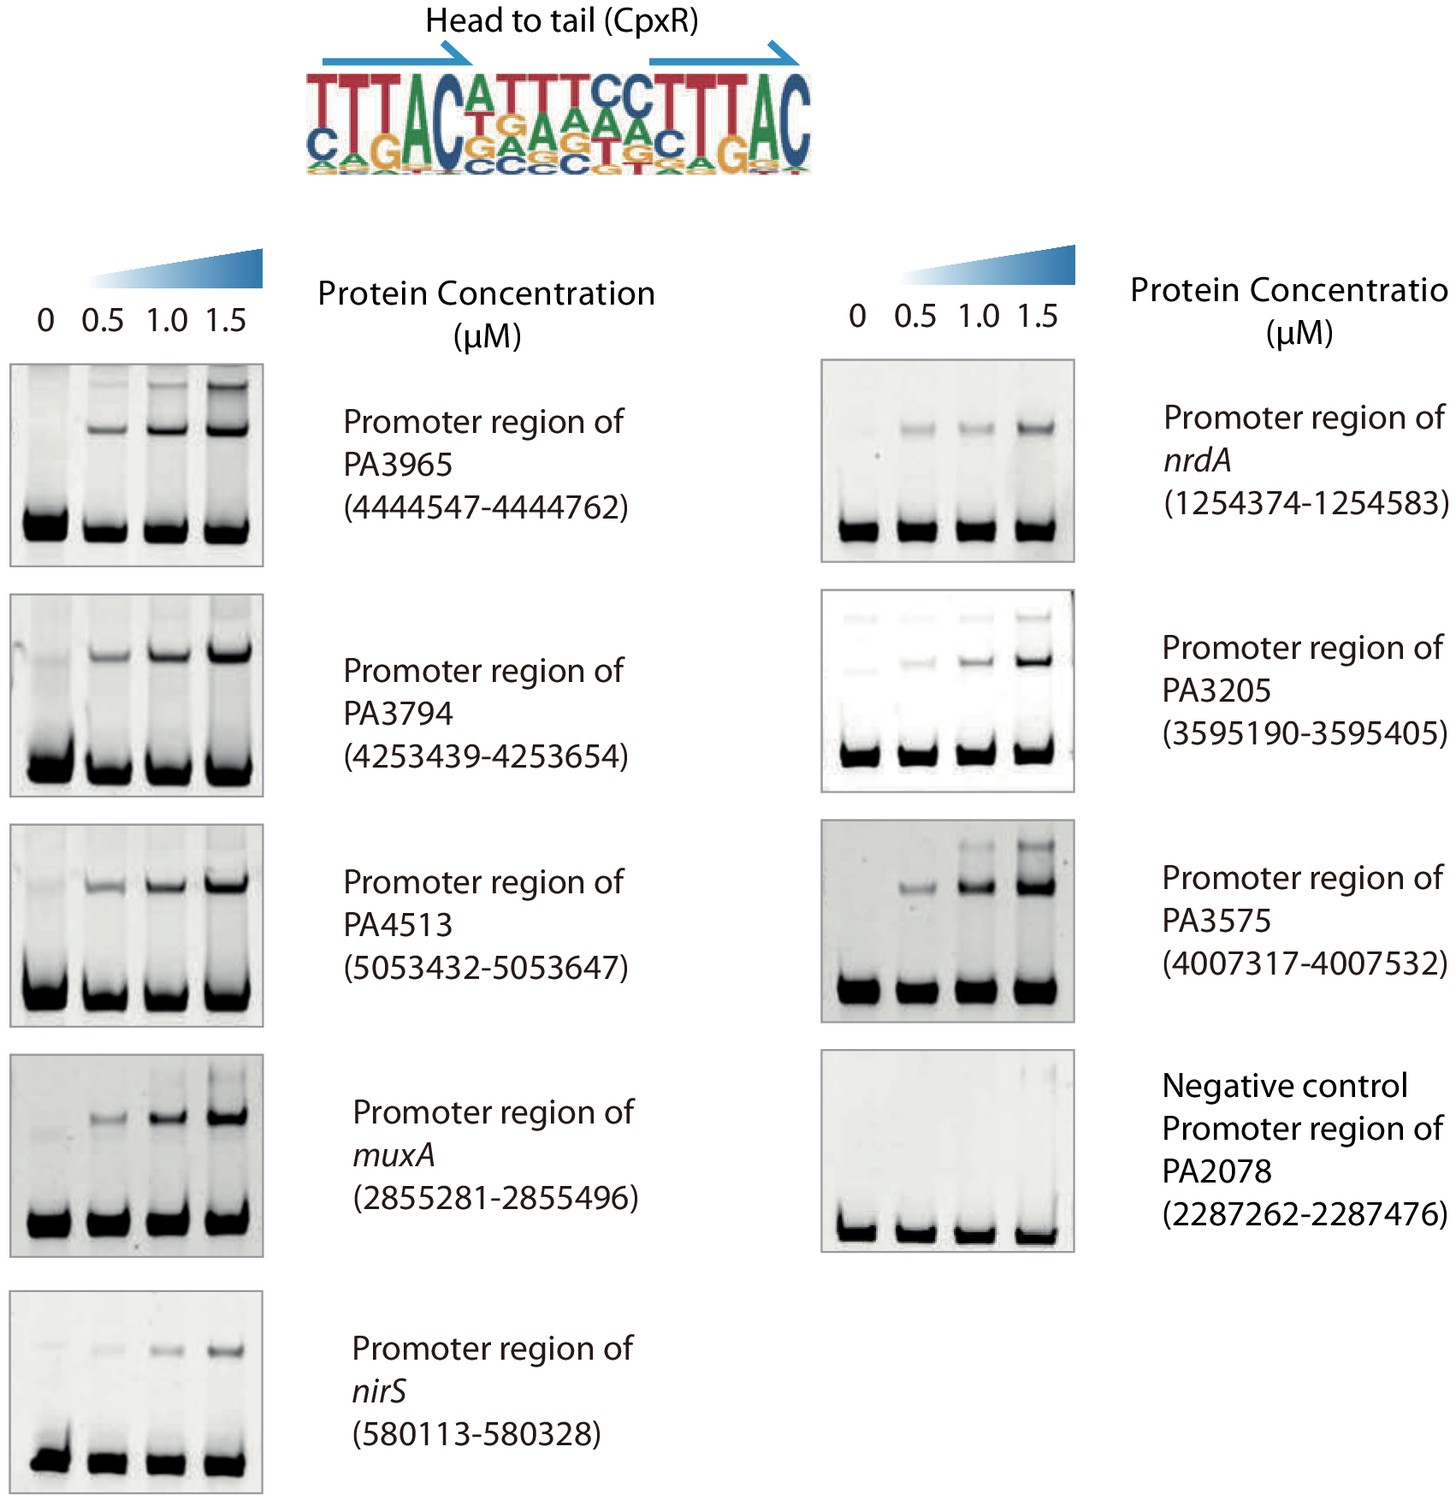
Validation of different modes of CpxR binding, related to Figure 2.
Electrophoretic mobility shift assay (EMSA) validation (head-to-tail) for the predicted binding of CpxR in the promoters of PA3965, PA3794, PA4513, muxA, nirS, nrdA, PA3205, and PA3575. By contrast, the promoter fragment of PA2078 is used as the negative control for CpxR binding. Note that the up-shift bands of DNA in gel are observed in all experiments. By contrast, the fragments of negative control DNA showed no binding to CpxR. The TF motif of CpxR is shown in the upper panel of EMSA. Arrows indicate half-sites in dimeric binding.
Figure 2—figure supplement 4
Transcriptional regulation in biofilm pathway, related to Figure 2.
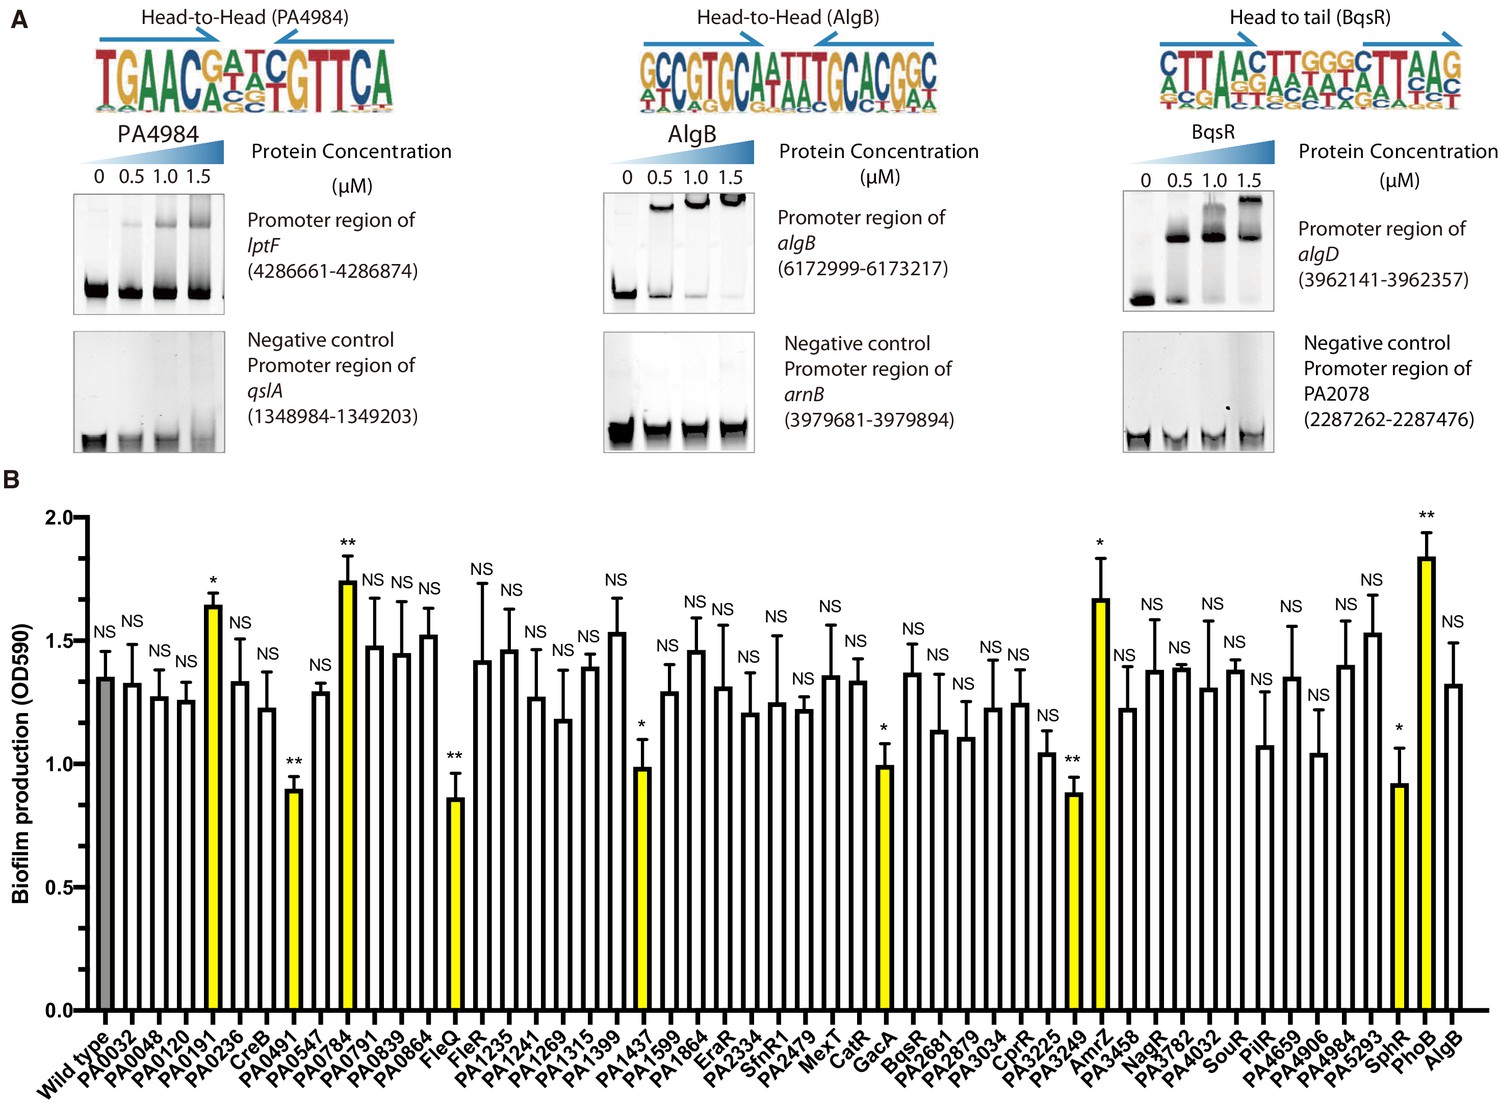
(A) Electrophoretic mobility shift assay (EMSA) validation (head-to-head) for predicted binding of PA4984 in the promoter of iptF. By contrast, the promoter fragment of qslA is used as the negative control for PA4984. Note that the up-shift bands of DNA in gel were observed in the experiment. The fragments of negative control DNA showed no binding to PA4984. The TF motif of PA4984 is shown in the upper panel of EMSA. Arrows indicate half-sites in dimeric binding (left). EMSA validation (head-to-head) for predicted binding of AlgB in the promoter of algB. By contrast, the promoter fragment of arnB is used as the negative control for AlgB. Note that the up-shift bands of DNA in gel were observed in the experiment. The fragments of negative control DNA showed no binding to AlgB. The TF motif of AlgB is shown in the upper panel of EMSA. Arrows indicate half-sites in dimeric binding (middle). EMSA validation (head-to-tail) for predicted binding of BqsR in the promoter of algD. By contrast, the promoter fragment of PA2078 is used as the negative control for BqsR. Note that the up-shift bands of DNA in gel were observed in the experiment. The fragments of negative control DNA showed no binding to BqsR. The TF motif of BqsR is shown in the upper panel of EMSA. Arrows indicate half-sites in dimeric binding (right). (B) Crystal violet assay for 53 transposon insertion mutants. Bar chart shows the biofilm production of the 53 transposon insertion mutant strains in relative to the wild-type strain. *p<0.05, **p<0.01, NS, not significant. The significant mutants were highlighted in yellow color.
-
Figure 2—figure supplement 4—source data 1
Source data for Figure 2—figure supplement 4B.
- https://cdn.elifesciences.org/articles/61885/elife-61885-fig2-figsupp4-data1-v2.xlsx
Figure 2—figure supplement 5

Transcriptional regulation in QS pathway, related to Figure 2.
(A) The network illustrates rest of the regulatory relationship between TFs and their target genes in QS pathway. Circles indicate TF proteins, and squares indicate target genes. Diamond highlights the gene with auto-regulation. Red arrows show the binding sites located in the putative promoters of the target genes, establishing the regulatory relationship. To save space, ‘PA’ is omitted in the names of all TFs and their target genes. (B–F) The electrophoretic mobility shift assay (EMSA) validation of predicted binding of PA0479 (B), CatR (C), PA1315 (D), PA2758 (E), and PA2206 (F) to the promoter of qslA, respectively. By contrast, the promoter fragment of katB, nrdA, rocA1, nrdA, and PA3829 were used as the negative controls, respectively. Note that the up-shift bands of DNA in gel were observed in the experiments but not in negative controls. The TF motifs for TFs are respectively shown in the upper panel of EMSA. Arrows indicate half-sites in dimeric binding. (G) EMSA validation (head-to-tail) for predicted binding of CprR to the promoter of higB. By contrast, the promoter fragment of desT is used as the negative control for CprR. Note that the up-shift bands of DNA in gel were observed in the experiment. The fragments of negative control DNA showed no binding to CprR. The TF motif of CprR is shown in the upper panel of EMSA. Arrows indicate half-sites in dimeric binding. (H) EMSA validation (head-to-head) for predicted binding of CreB to the promoters of pstS and mvaU. By contrast, the promoter fragment of PA0530 is used as the negative control for CreB binding. Note that the up-shift bands of DNA in gel were observed in the experiments. The fragments of negative control DNA showed no binding to CreB. The TF motif of CreB is shown in the upper panel of EMSA. Arrows indicate half-sites in dimeric binding. (I) EMSA validation (head-to-head) for predicted binding of PA1864 to the promoter of PA0506. By contrast, the promoter fragment of PA3360 is used as the negative control for PA1864. Note that the up-shift bands of DNA in gel were observed in the experiment. The fragments of negative control DNA showed no binding to PA1864. The TF motif of PA1864 is shown in the upper panel of EMSA. Arrows indicate half-sites in dimeric binding.
Figure 2—figure supplement 6
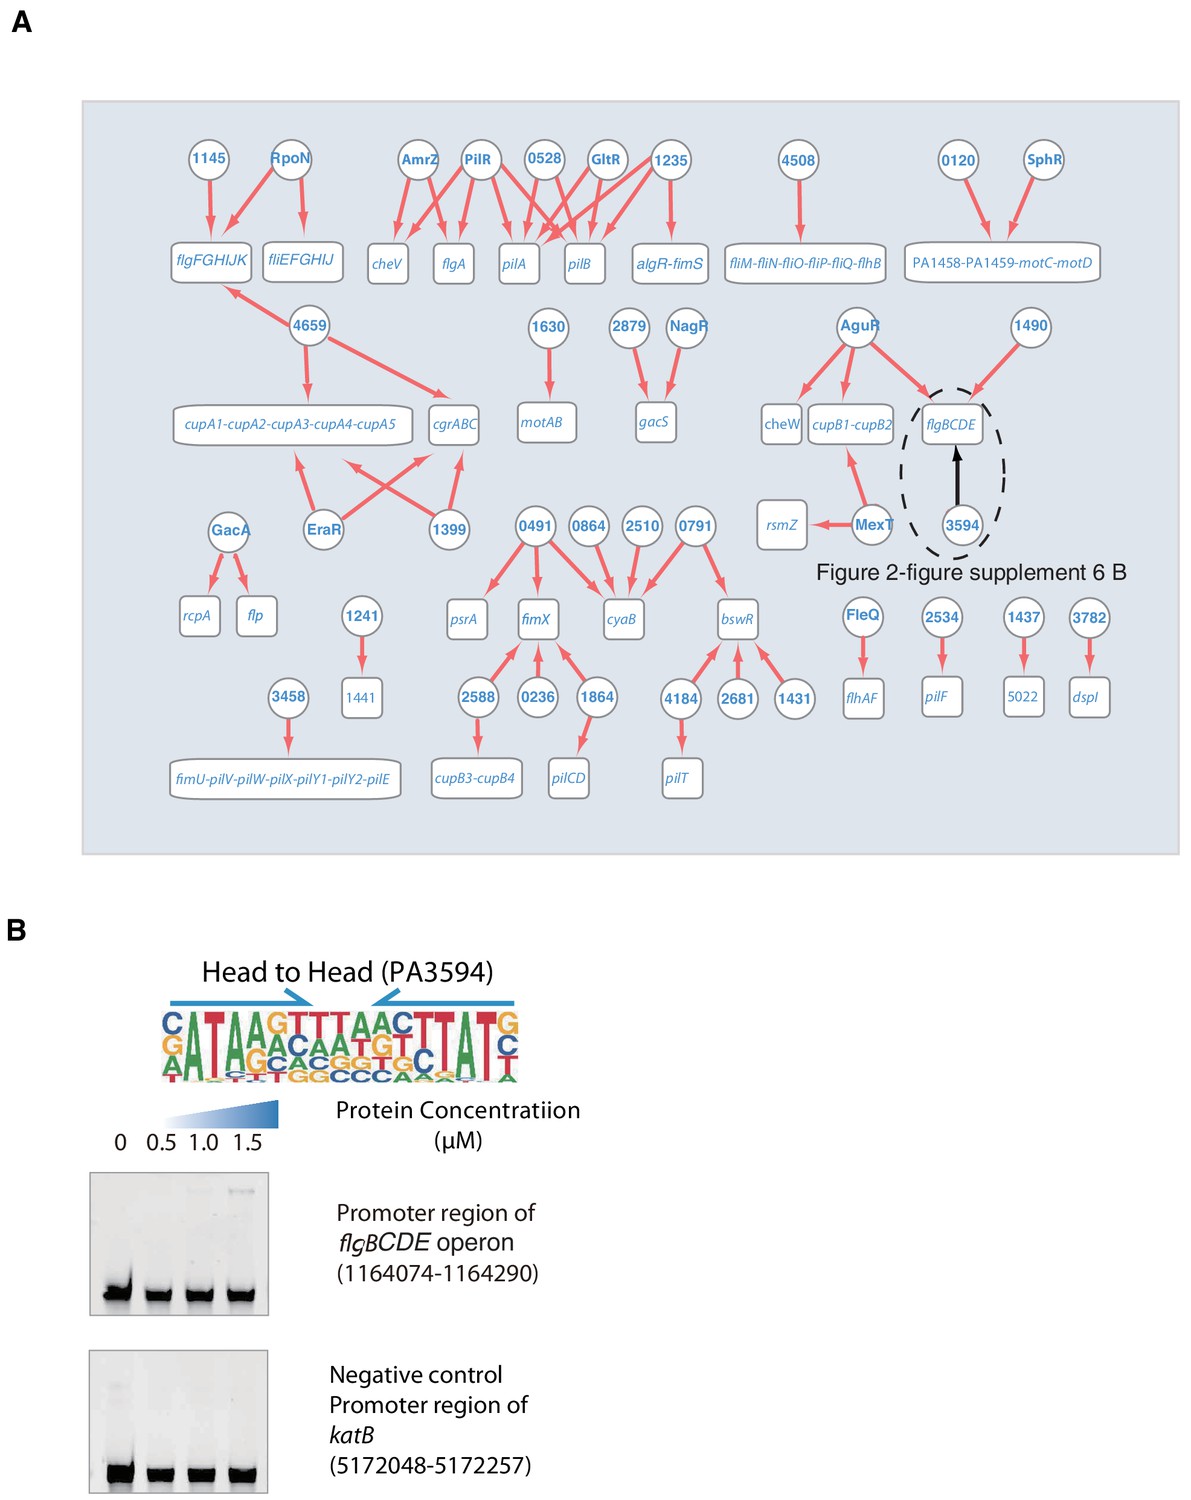
Transcriptional regulation in motility pathway.
(A) Network illustrates the regulatory relationship between TFs and their target genes in motility pathway. Circles indicate TF proteins, and squares indicate target genes. Red arrows show the binding sites located in the putative promoters of the target genes, establishing the regulatory relationship. Black arrows indicate that we did electrophoretic mobility shift assay (EMSA) validation, demonstrated in panel B. To save space, ‘PA’ is removed in the names of all TFs and their target genes. (B) EMSA validation (head-to-head) for predicted binding of PA3594 to the promoter of flgB. By contrast, the promoter fragment of katB is used as the negative control for P PA3594. Note that the up-shift bands of DNA in gel were observed in the experiment. The fragments of negative control DNA showed no binding to PA3594. The TF motif of PA3594 is shown in the upper panel of EMSA. Arrows indicate half-sites in dimeric binding.
Figure 2—figure supplement 7
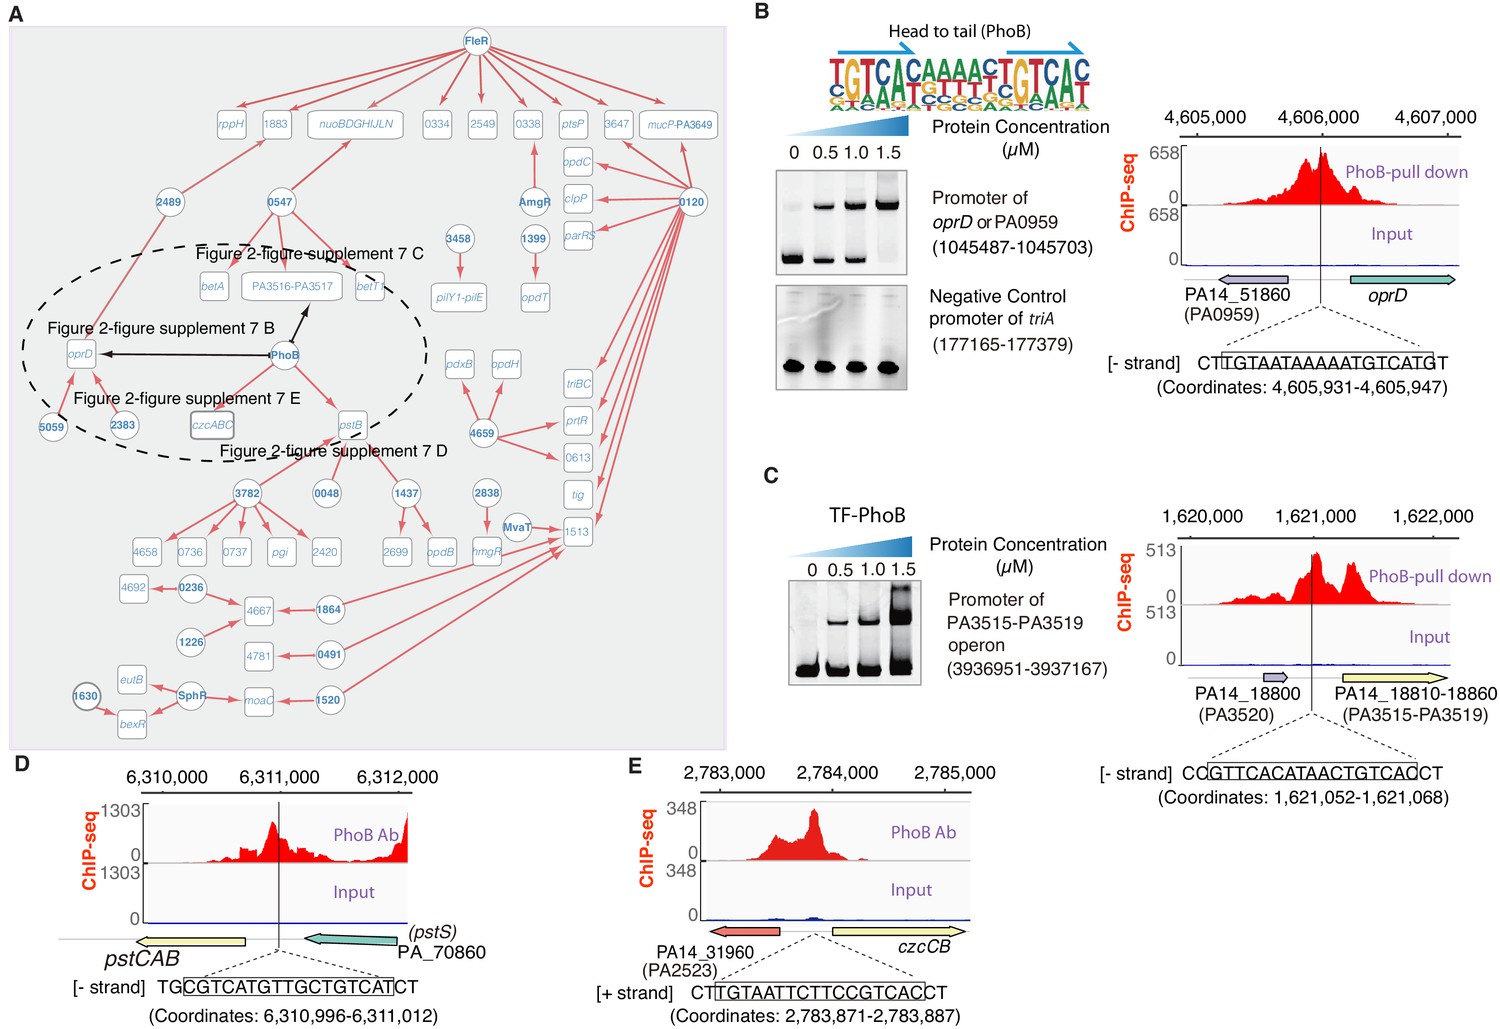
Transcriptional regulation in antibiotic resistance pathway.
(A) Network illustrates part of the regulatory relationship between TFs and their target genes in antibiotic resistance pathway. The other part is shown in Figure 2—figure supplement 8. Circles indicate TF proteins, and squares indicate target genes. Red arrows show the binding sites located in the putative promoters of the target genes, establishing the regulatory relationship. Black arrows indicate that we did experimental validations, demonstrated in panels B–E. To save space, ‘PA’ is removed in the names of all TFs and their target genes. (B) The validation on the binding of PhoB to the shared promoter of PA0959 or oprD. Electrophoretic mobility shift assay (EMSA) experiment (left) validated the binding of PhoB to the promoter. Note that a binding-caused up-shift of the DNA bands in gel was observed. By contrast, the promoter fragment of triA was used as the negative control showing no binding to PhoB. The motif of PhoB is shown in above the EMSA result. Arrows indicate half-sites in dimeric binding. The right panel validates the binding of PhoB to a predicted site in the promoter of the PA0959 orthologue TF PA14_51860 in Pseudomonas aeruginosa UCBPP-PA14, by a ChIP-seq peak identified in an independent study (Bielecki et al., 2015). (C) The validation on the binding of PhoB to the promoter of PA3515-PA3519 operon. EMSA experiment (left) validated the binding of PhoB to the promoter of PA3515–PA3519 operon. The binding-caused up-shift of the DNA bands in gel was observed. The negative control is the same as panel B. The right panel validates the binding of PhoB to a predicted site in the promoter of the PA3515-PA3519 operon orthologue TF PA14_18810 in Pseudomonas aeruginosa UCBPP-PA14, by a ChIP-seq peak identified in an independent study (Bielecki et al., 2015). (D and E) Binding of PhoB to a predicted site in the promoters of pstCAB operon (D) and the shared promoter of czcCB operon and PA2523 orthologue PA14_31960 (E) is supported by a ChIP-seq peak identified in an independent study (Bielecki et al., 2015).
Figure 2—figure supplement 8
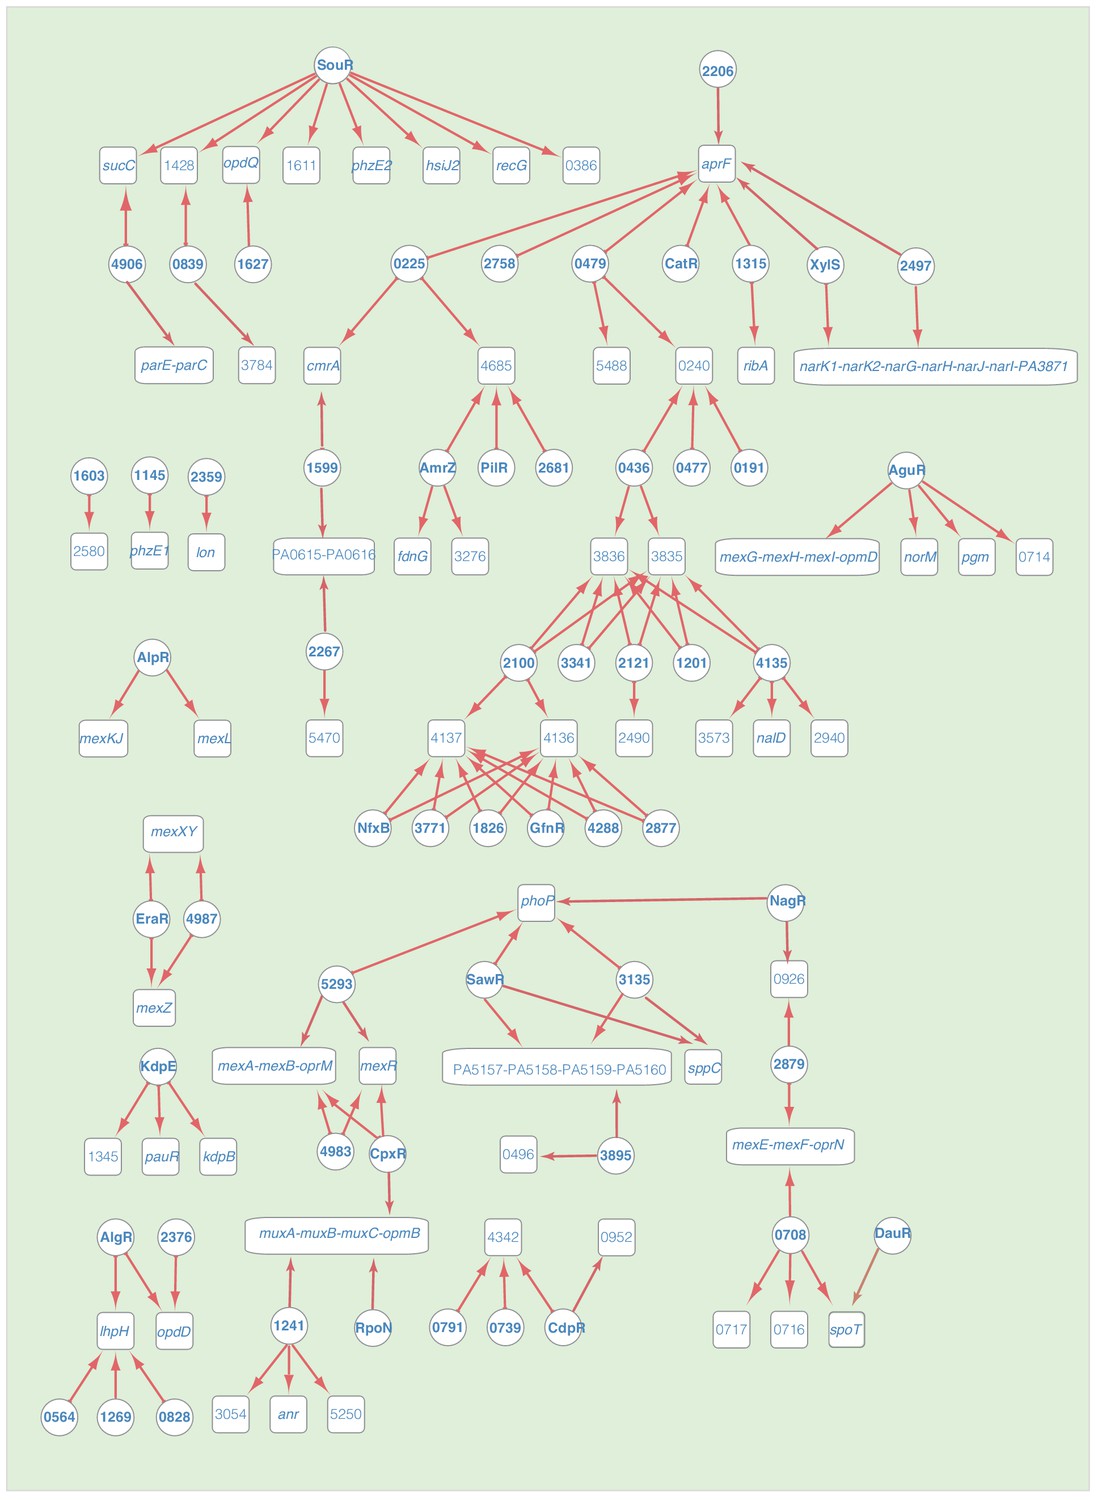
Transcriptional regulation in antibiotic resistance pathway, related to Figure 2—figure supplement 7.
The remaining network illustrates the regulatory relationship between TFs and their target genes in antibiotic resistance pathway. Circles indicate TF proteins, and squares indicate target genes. Red arrows show the binding sites located in the putative promoters of the target genes, establishing the regulatory relationship. To save space, ‘PA’ is removed in the names of all TFs and their target genes.
Figure 2—figure supplement 9
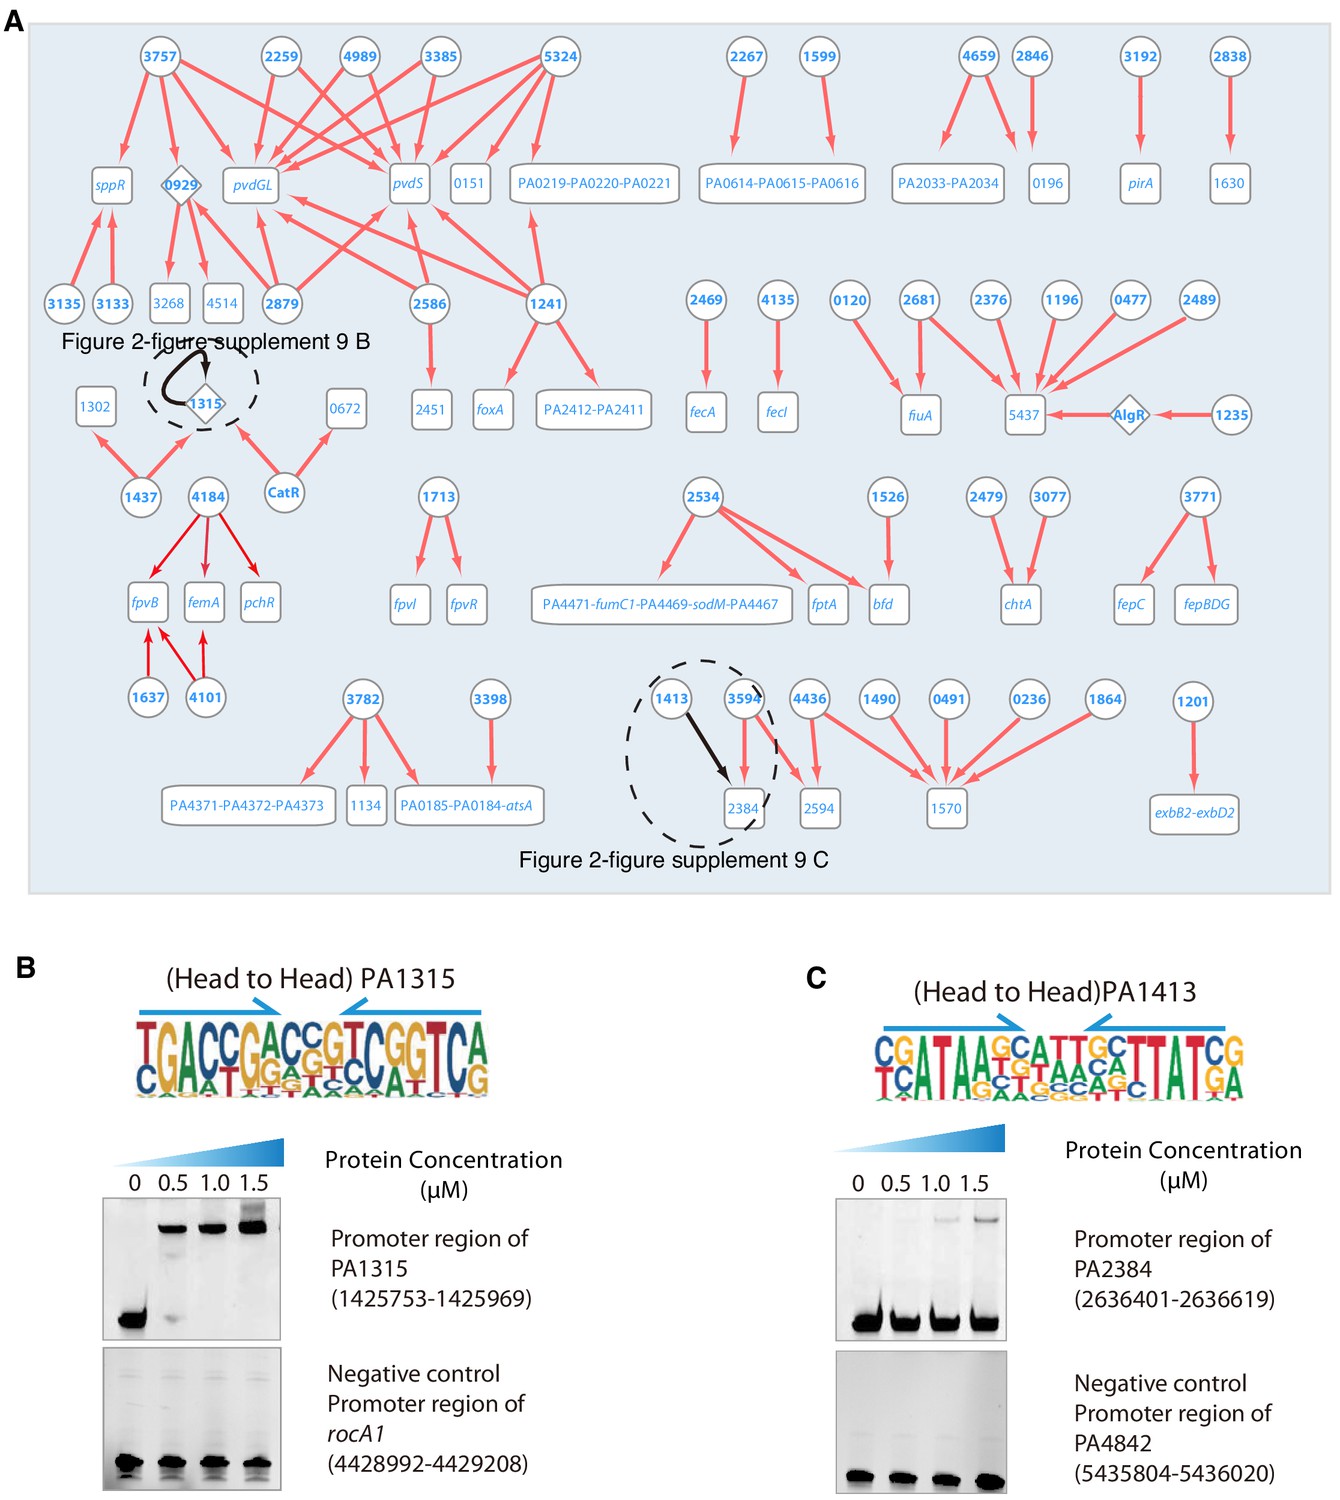
Transcriptional regulation in siderophore synthesis pathway.
(A) Network illustrates the regulatory relationship between TFs and their target genes in siderophore synthesis pathway. Circles indicate TF proteins, and squares indicate target genes. Diamond highlights the gene with auto-regulation. Red arrows show the binding sites located in the putative promoters of the target genes, establishing the regulatory relationship. Black arrows highlight the binding with additional experimental validation, shown in panels B and C. To save space, ‘PA’ is removed in the names of all TFs and their target genes. (B) Electrophoretic mobility shift assay (EMSA) experiment validates the binding of PA1315 (head-to-head) in its own promoter. By contrast, the promoter fragment of rocA1 is used as the negative control. Note that the up-shift bands of DNA in gel were observed in the experiment. The fragments of negative control DNA showed no binding to PA1315. The TF motif of PA1315 is shown in the upper panel of EMSA. Arrows indicate half-sites in dimeric binding. (C) Validation of the predicted binding for PA1413 (head-to-head) in the promoters of PA2384 were conducted using EMSA. Note that a binding-caused up-shift of the DNA bands were observed. By contrast, the promoter of PA4842 was used as the negative controls showing no binding. The TF motif of PA1413 is shown in the upper panel of EMSA. Arrows indicate half-sites in dimeric binding.
Figure 2—figure supplement 10
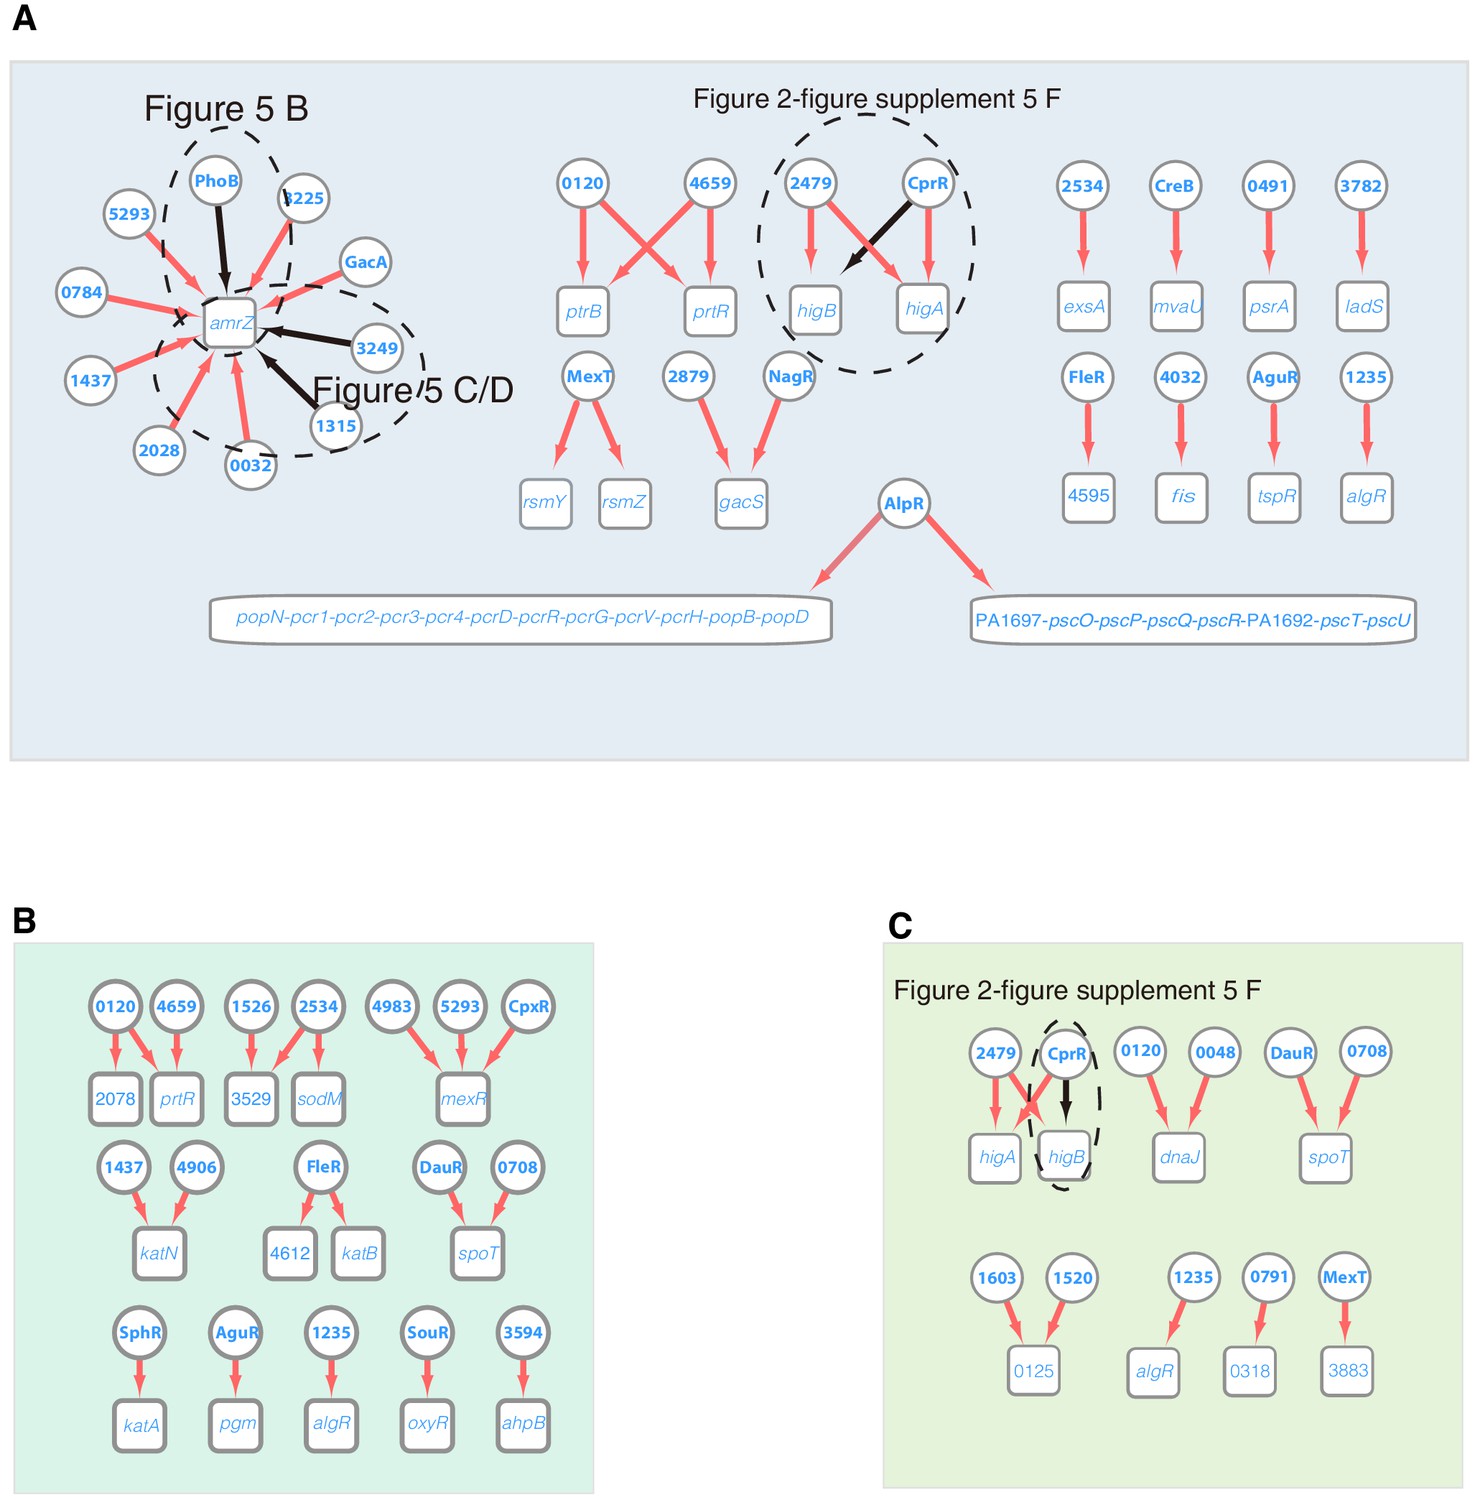
Transcriptional regulation in T3SS, ROS, and SR and persister pathways.
Networks illustrate the regulatory relationship between TFs and their target genes in T3SS (A), ROS (B), SR and persister (C) pathways. Circles indicate TF proteins, and squares indicate target genes. Red arrows show the binding sites located in the putative promoters of the target genes, establishing the regulatory relationship. Black arrows highlight the binding with additional experimental validation and indicating the panels of the experimental results. To save space, ‘PA’ is removed in the names of all TFs and their target genes.
Figure 2—figure supplement 11
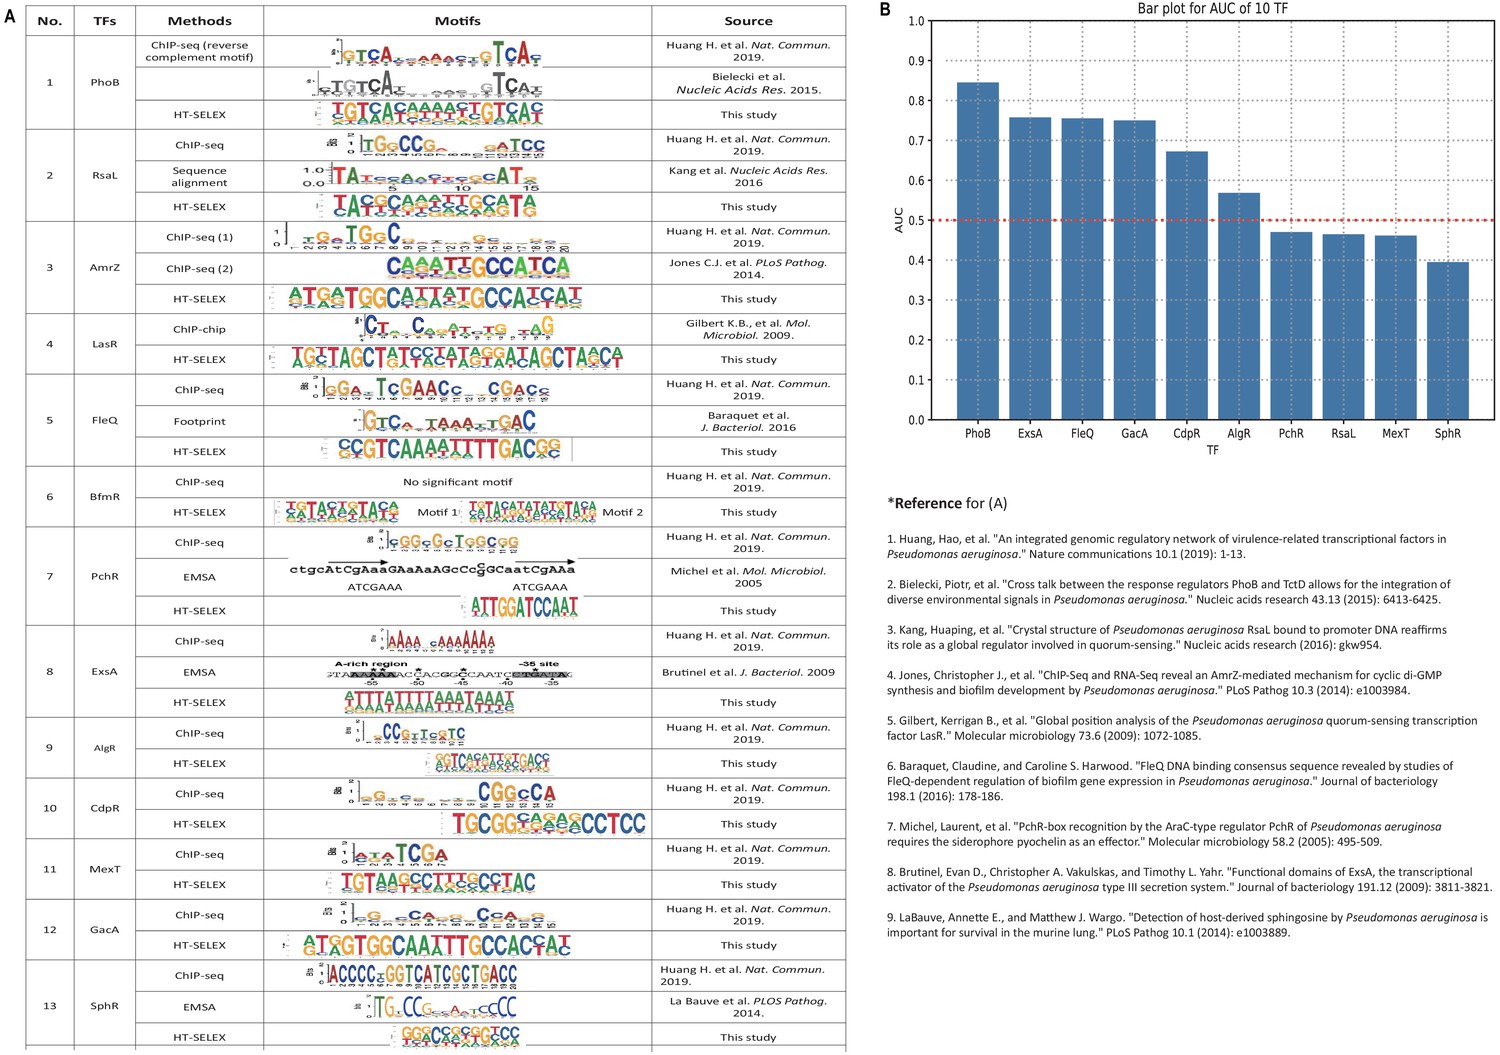
Comparison of motifs derived from HT-SELEX and other methods.
(A) A table lists motifs derived from different methods, such as ChIP-seq, ChIP-chip, and sequence alignment. (B) Bar chart shows the area under the precision-recall curve for the 10 TFs that were analyzed by both ChIP-seq and HT-SELEX.
Figure 2—figure supplement 12
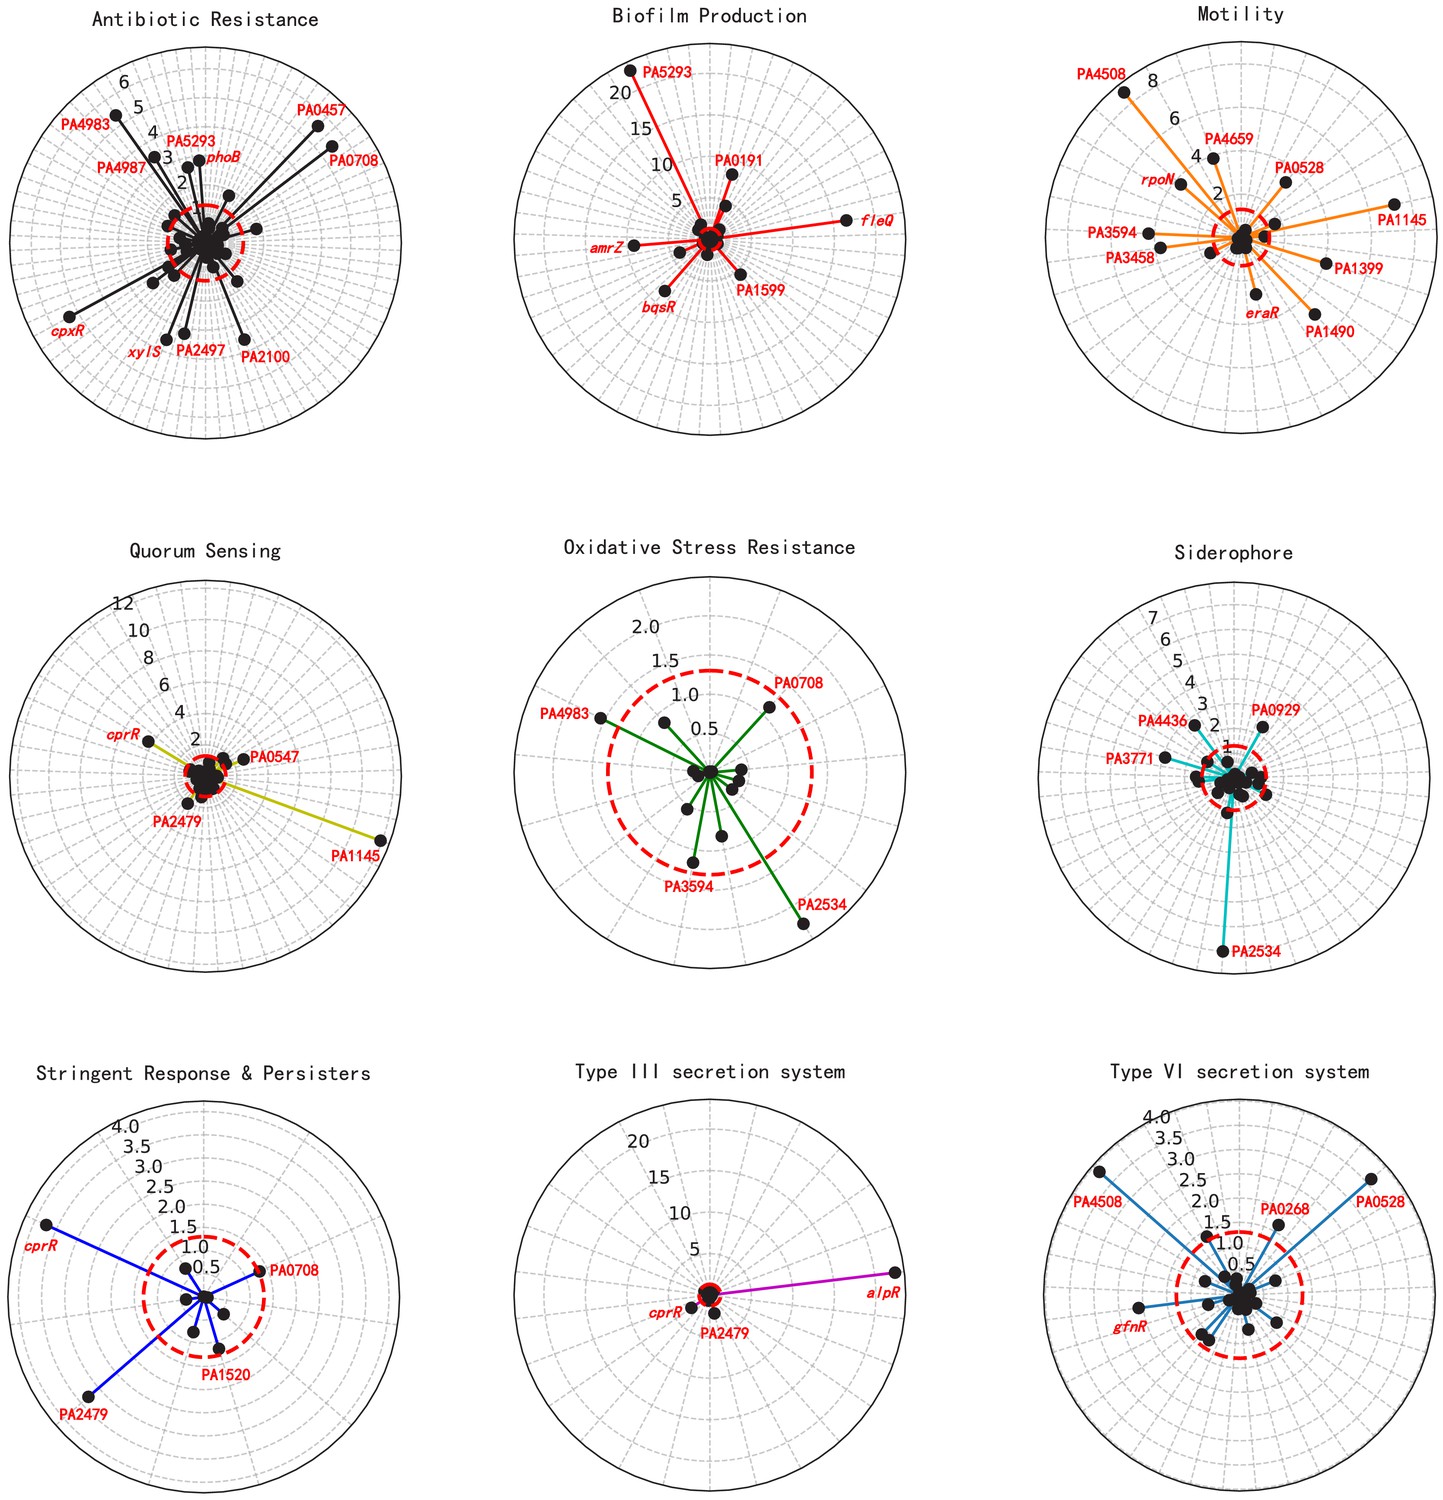
Significant association of putative TFs with various virulence-associated pathways.
Radar plots show the putative regulators significantly associated with different virulence pathways (from top left to bottom right): antibiotic resistance, biofilm production, motility, quorum sensing, oxidative stress resistance, siderophore, stringent response and persisters, type III secretion system, and type VI secretion system. Each radiation line represents one TF, and the length of colored radius is proportional to the -log10 (p-value), reflecting the significance of the enrichment of the network analysis-predicted TF targets within the pathway-associated genes. The names of regulators are marked in red type-face.
Figure 3
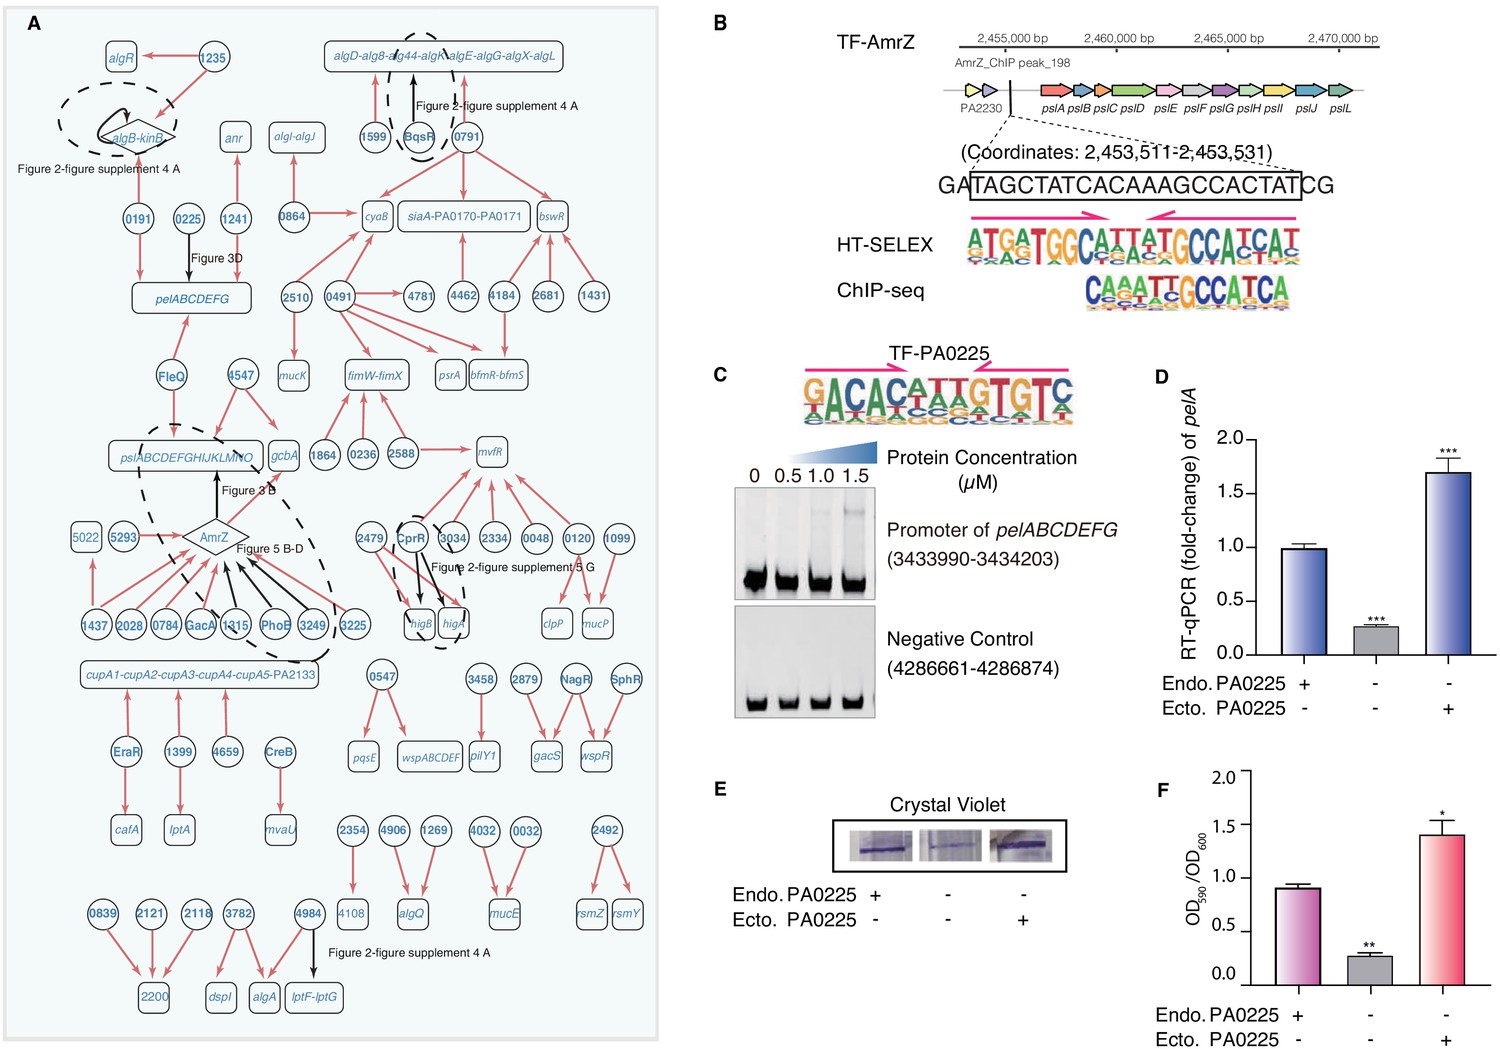
Transcriptional regulatory network in biofilm production pathway.
(A) Network illustrates part of the regulatory relationship between TFs and their target genes in the biofilm pathway. Circles indicate TF proteins, and squares indicate target genes. Diamond highlights the gene with auto-regulation. Red arrows show that the binding sites are located in the putative promoters of the target genes, establishing the regulatory relationship. Black arrows highlight the binding with additional experimental validation. To save space, ‘PA’ is removed in the names of all TFs and their target genes. The dashed ovals and letters highlight regulatory relation validated in the corresponding figures and panels. (B) Comparison of binding motif of AmrZ derived by HT-SELEX (‘SELEX’) in the current study with a motif developed from a previous ChIP-seq study (upper). Arrows indicate half-sites in dimeric binding. Binding of AmrZ to a predicted site in the promoter of the psl operon is supported by a peak identified by a previous ChIP-seq study (lower) (Jones et al., 2014). (C) Electrophoretic mobility shift assay (EMSA) experiment validates the binding of PA0225, with its motif shown at the upper panel, to the promoter of pelABCDEFG. Arrows indicate half-sites in dimeric binding. Note that a binding-caused up-shift of the DNA band in gel is observed. By contrast, a negative control is used showing no binding to PA0225. (D) RT-qPCR shows that the transcription of pelA is significantly lower in PA0225 mutant cells compared with the wild-type cells (***p<0.001, Student’s t-test). ‘Endo. PA0225’ indicates endogenous expression of PA0225. ‘Ecto. PA0225’ indicates the ectopic expression of PA0225 delivered by the transformed plasmid pAK1900. Three technical replicates were performed. (E) The biofilm formation detection in the wild-type, PA0225 mutant, and PA0225 complemented strains using a crystal violate staining assay. ‘Endo. PA0225’ indicates endogenous expression of PA0225. ‘Ecto. PA0225’ indicates the ectopic expression of PA0225 by the transformed plasmid pAK1900. (F) The quantification of biofilm production in the wild-type, PA0225 mutant, and PA0225 complemented strains using a crystal violate staining assay. ‘Endo. PA0225’ indicates endogenous expression of PA0225. ‘Ecto. PA0225’ indicates the ectopically expression of PA0225 by the transformed plasmid pAK1900. Three technical replicates were conducted (*p<0.05; **p<0.01, Student’s t-test).
-
Figure 3—source data 1
Source data for Figure 3D.
- https://cdn.elifesciences.org/articles/61885/elife-61885-fig3-data1-v2.xlsx
-
Figure 3—source data 2
Source data for Figure 3F.
- https://cdn.elifesciences.org/articles/61885/elife-61885-fig3-data2-v2.xlsx
Figure 4
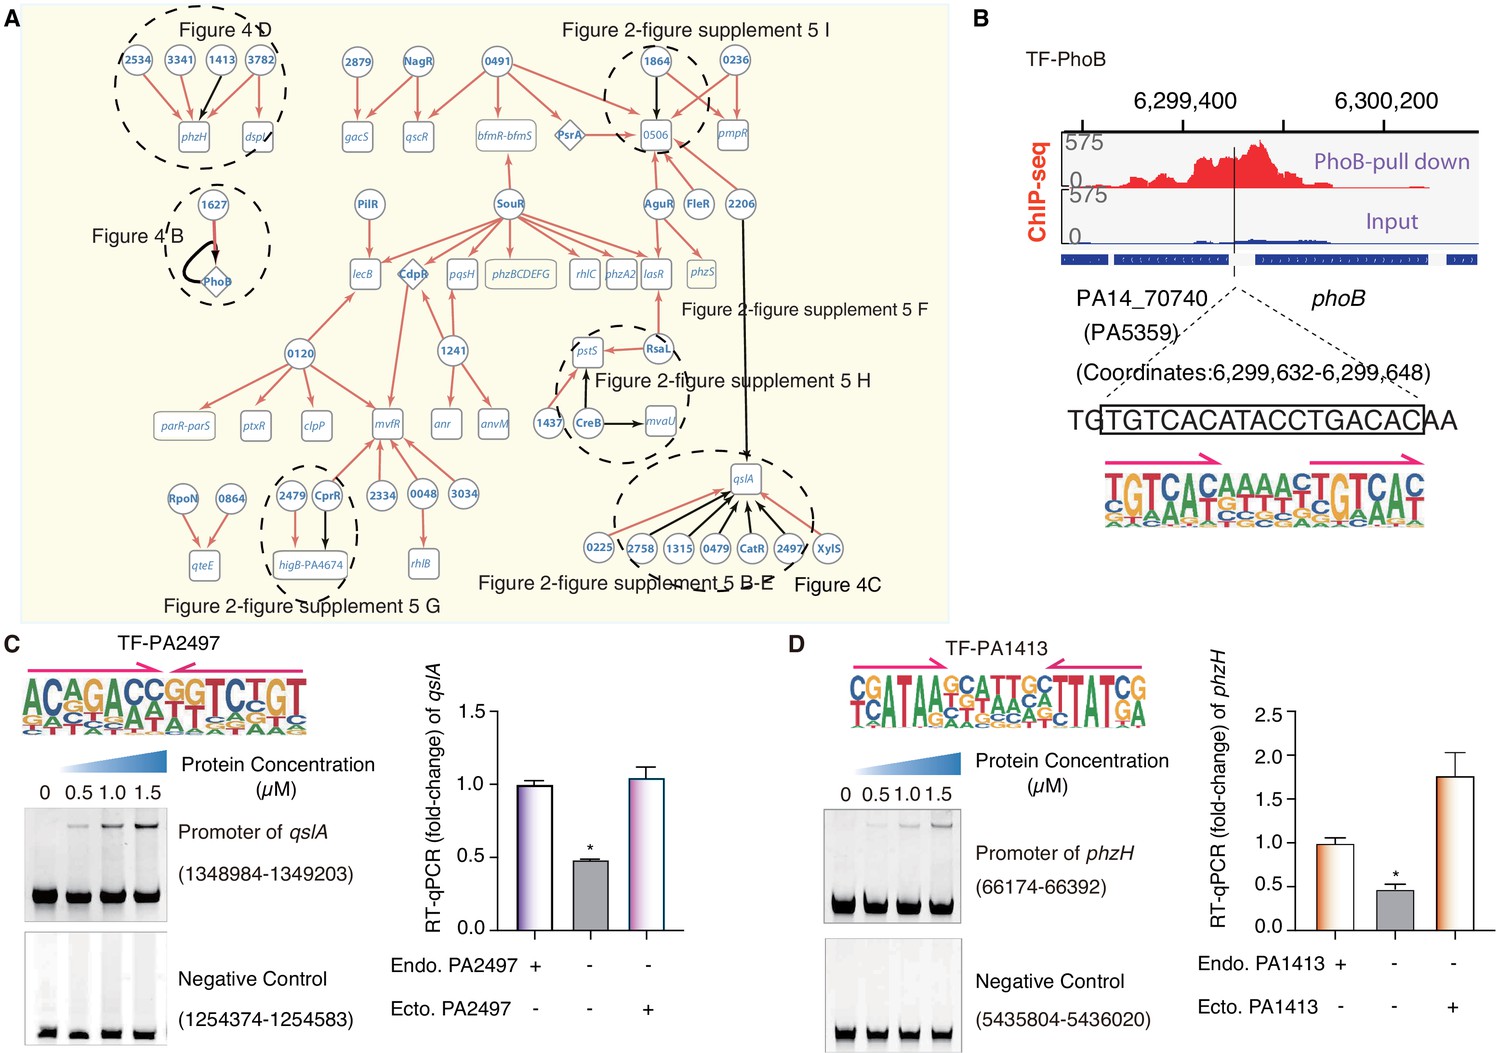
TF-target networks in QS pathway.
(A) Network illustrates part of the regulatory relationship between TFs and their target genes in the QS pathway. The rest of the part is shown in Figure 2—figure supplement 5. Circles indicate TF proteins, and squares indicate target genes. Diamond highlights the gene with auto-regulation. Red arrows show that the binding sites are located in the putative promoters of the target genes, establishing the regulatory relationship. Black arrows highlight the binding with additional experimental validation. To save space, ‘PA’ is removed in the names of all TFs and their target genes. The dashed ovals and letters highlight regulatory relation validated in the corresponding figures and panels. (B) Arrows indicate half-sites in dimeric binding. Binding of PhoB to a predicted site in its own promoter, which was supported by a ChIP-seq peak. Input signal is shown for reference. The genomic coordinates are shown above the track and the genes (blue blocks) are indicated below the track. The exact binding site identified by our PhoB PWM is also highlighted. (C) Electrophoretic mobility shift assay (EMSA) and RT-qPCR validation of the predicted binding of PA2497 in the promoter of qslA. Left, EMSA experiment validates the binding of PA2497, with its motif shown at the upper panel, to the promoter of qslA. Arrows indicate half-sites in dimeric binding. Note that a binding-caused up-shift of the DNA band in gel was observed. By contrast, a negative control is used showing no binding to PA2497. Right, RT-qPCR shows that the qslA transcription is significantly lower in PA2497 mutant cells compared with the wild-type cells (*p<0.05, Student’s t-test). ‘Endo. PA2497’ indicates endogenous expression of PA2497. ‘Ecto. PA2497’ indicates the ectopic expression of PA2497 by the transformed plasmid. Three technical replicates were conducted. (D) EMSA and RT-qPCR validation of the predicted binding of PA1413 in the promoter of phzH. Left, EMSA experiment validates the binding of PA1413, with its motif shown at the upper panel, to the promoter of phzH. Arrows indicate half-sites in dimeric binding. Note that a binding-caused up-shift of the DNA band in gel was observed. By contrast, a negative control is used showing no binding to PA1413. Right, RT-qPCR shows that the phzH transcription is significantly lower in PA1413 mutant cells compared with the wild-type cells (*p<0.05, Student’s t-test). ‘Endo. PA1413’ indicates endogenous expression of PA1413. ‘Ecto. PA1413’ indicates the ectopic expression of PA1413 by the transformed plasmid. Three technical replicates were conducted.
-
Figure 4—source data 1
Source data for Figure 4C.
- https://cdn.elifesciences.org/articles/61885/elife-61885-fig4-data1-v2.xlsx
-
Figure 4—source data 2
Source data for Figure 4D.
- https://cdn.elifesciences.org/articles/61885/elife-61885-fig4-data2-v2.xlsx
Figure 5

Transcriptional regulation in T6SS pathway.
(A) Network illustrates the regulatory relationship between TFs and their target genes in T6SS pathway. Circles indicate TF proteins, and squares indicate target genes. Diamond highlights the gene with auto-regulation. Red arrows show that the binding sites are located in the putative promoters of the target genes, establishing the regulatory relationship. Black arrows highlight the binding with additional experimental validation. To save space, ‘PA’ is removed in the names of all TFs and their target genes. The dashed ovals and letters highlight regulatory relation validated in the corresponding figures and panels. (B) Left panel shows an electrophoretic mobility shift assay (EMSA) experiment to validate the binding of PhoB, with its motif shown at the upper panel, to the promoter of amrZ (left). Arrows indicate half-sites in dimeric binding. Note that a binding-caused up-shift of the DNA band in gel was observed. By contrast, a negative control was used showing no binding to PhoB. Right panel shows the binding of PhoB to a predicted site in the promoter of amrZ, which was supported by a ChIP-seq peak. Input signal is shown for reference. The genomic coordinates are shown above the track and the genes are indicated below the track. The exact binding site identified by our PhoB PWM is also highlighted. (C) EMSA experiment validates the binding of PA1315, with its motif shown at the upper panel, to the promoter of amrZ. Arrows indicate half-sites in dimeric binding. Note that a binding-caused up-shift of the DNA band in gel was observed. By contrast, a negative control was used showing no binding to PA1315. (D) EMSA experiment validated the binding of PA3249, with its motif shown at the upper panel, to the promoter of amrZ. Arrows indicate half-sites in dimeric binding. Note that a binding-caused up-shift of the DNA band in gel was observed. By contrast, a negative control was used showing no binding to PA3249. (E) EMSA validation of the predicted binding of PA0535, with its motif shown at the upper panel, to the promoter of vgrG4. Arrows indicate half-sites in dimeric binding. Note that a binding-caused up-shift of the DNA band in gel was observed. By contrast, a negative control was used showing no binding to PA0535.
Figure 6
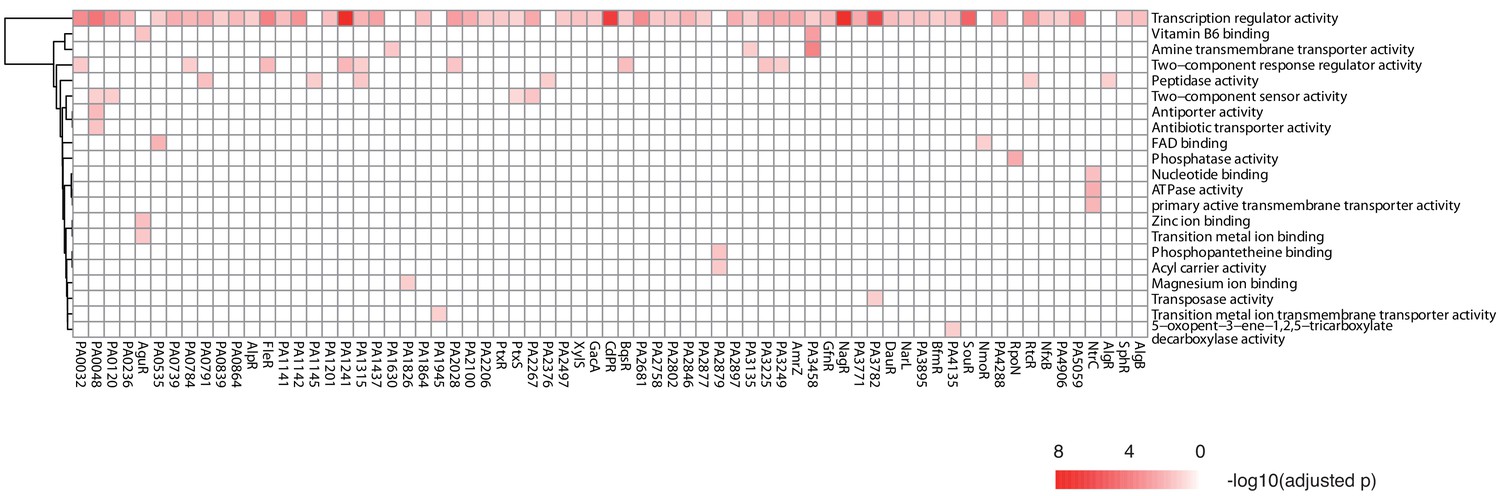
TF clustering by function of the putative targets.
The heat map shows the functional annotation enrichment of TF targets in 29 gene ontology (GO) terms. The color key indicates the -log10 (p-value).
Author response image 1
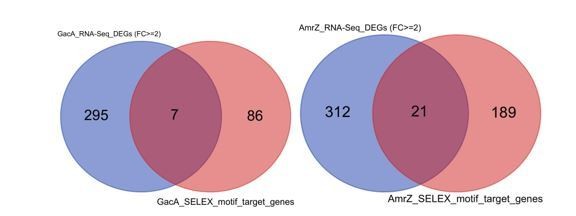
Venn diagrams show the comparison of predicted GacA (left) or AmrZ (right) target genes (red) and differentially expressed genes upon deletion of GacA or AmrZ (blue).
Author response image 2
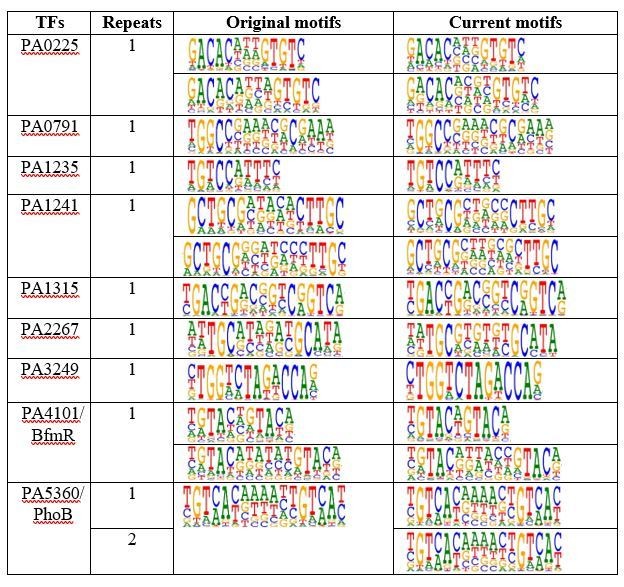
A table shows comparison of motifs discovered in different replicative experiments of TF HT-SELEX.
Note that the proteins and input DNA were both independently synthesized and all motifs for the same TF were identical.
Author response image 3
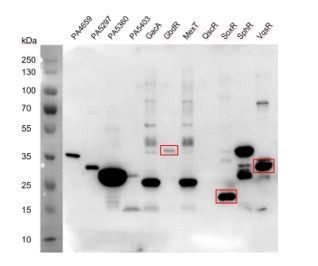
SDS-PAGE results detecting the TF protein expression.
The three TFs, GbdR, SoxR, and VqsR showing abundant expression did not recover any specific DNA binding motifs.
Author response image 4
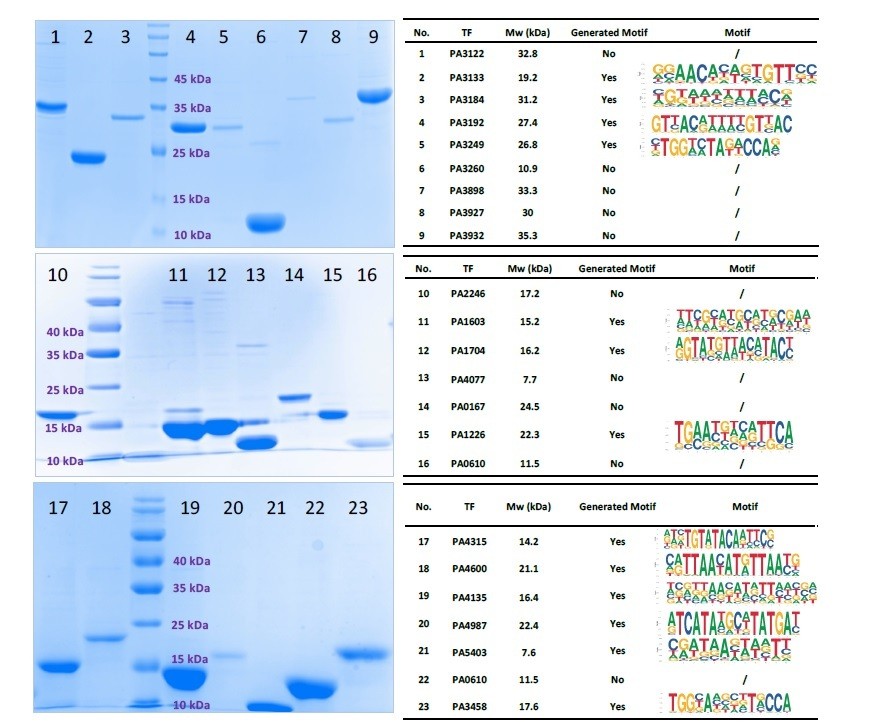
SDS-PAGE gel result for 23 purified TFs (Left).
All TFs expressed successfully. Only 13 TFs had HT-SELEX-generated motifs.
Author response image 5
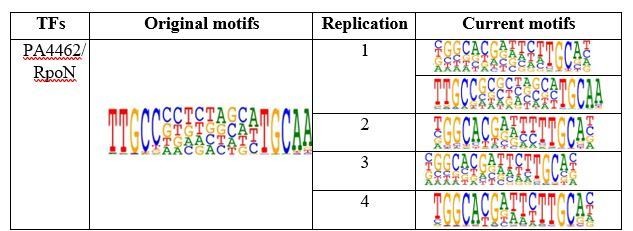
Table shows comparison of RpoN motifs.
Original motif shows the PWM logo of RpoN binding we obtained in original submission while the current motifs shows the replicative experiments in revision. Note that we repeated the HT-SELEX for 4 times with different input DNA ligands. Except in the replication 1 that we detected both conventional RopN motif and the motif we obtained in first batch, the other 3 replicates only detected the conventional RopN motif.
Author response image 6
Author response image 7
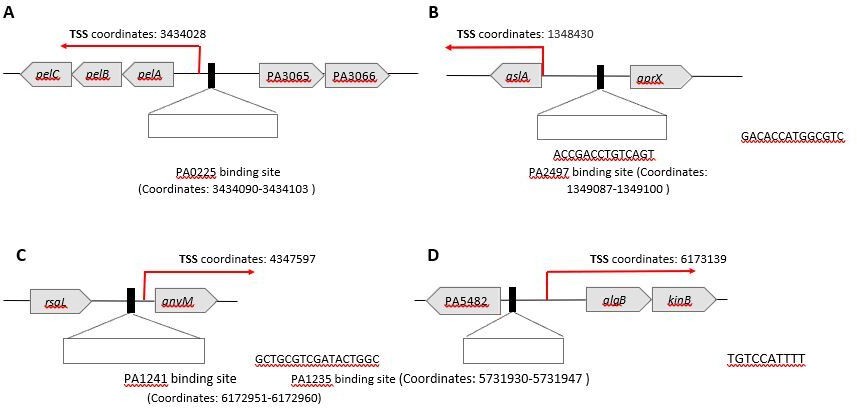
The association between predicted TSS and TF binding sites for PA0225 and PA2497.
Additional files
-
Supplementary file 1
General information of the materials used in the study.
(A) Strains, primers, and plasmids, related to Figure 1. (B) DBD family catalogues for 371 TFs, related to Figure 1, Figure 1—figure supplement 1.
- https://cdn.elifesciences.org/articles/61885/elife-61885-supp1-v2.xlsx
-
Supplementary file 2
Enriched motifs for HT-SELEX experiments, related to Figure 1.
- https://cdn.elifesciences.org/articles/61885/elife-61885-supp2-v2.xlsx
-
Supplementary file 3
The 104 distinct modules of the obtained PWMs for 182 TFs.
Diamonds indicate TFs, and circles indicate individual PWMs. The dashed lines show the motif of the TF. The TFs without names are named with their locus tag omitting ‘PA’, related to Figure 1B.
- https://cdn.elifesciences.org/articles/61885/elife-61885-supp3-v2.pdf
-
Supplementary file 4
Direct interactions between PWMs and their corresponding DNA sequences by scanning the genome-wide.
TFBSs in the P. aeruginosa PAO1 reference genome using the FIMO software, related to Figures 3–5, Figure 1—figure supplement 1, and Figure 2—figure supplements 1–12.
- https://cdn.elifesciences.org/articles/61885/elife-61885-supp4-v2.xlsx
-
Supplementary file 5
List of TFs associated with nine known virulence pathways.
- https://cdn.elifesciences.org/articles/61885/elife-61885-supp5-v2.xlsx
-
Transparent reporting form
- https://cdn.elifesciences.org/articles/61885/elife-61885-transrepform-v2.pdf
Download links
A two-part list of links to download the article, or parts of the article, in various formats.
Downloads (link to download the article as PDF)
Open citations (links to open the citations from this article in various online reference manager services)
Cite this article (links to download the citations from this article in formats compatible with various reference manager tools)
An atlas of the binding specificities of transcription factors in Pseudomonas aeruginosa directs prediction of novel regulators in virulence
eLife 10:e61885.
https://doi.org/10.7554/eLife.61885


