Metage2Metabo, microbiota-scale metabolic complementarity for the identification of key species
- Univ Rennes, Inria, CNRS, IRISA, France
- Inria Bordeaux Sud-Ouest, France
- Gut Microbes and Heath, Quadram Institute, United Kingdom
- Digital Biology, Earlham Institute, United Kingdom
- Inria, UMR IGEPP, BioInformatics Platform for Agroecosystems Arthropods (BIPAA), France
- Inria, IRISA, GenOuest Core Facility, France
Figures
Figure 1
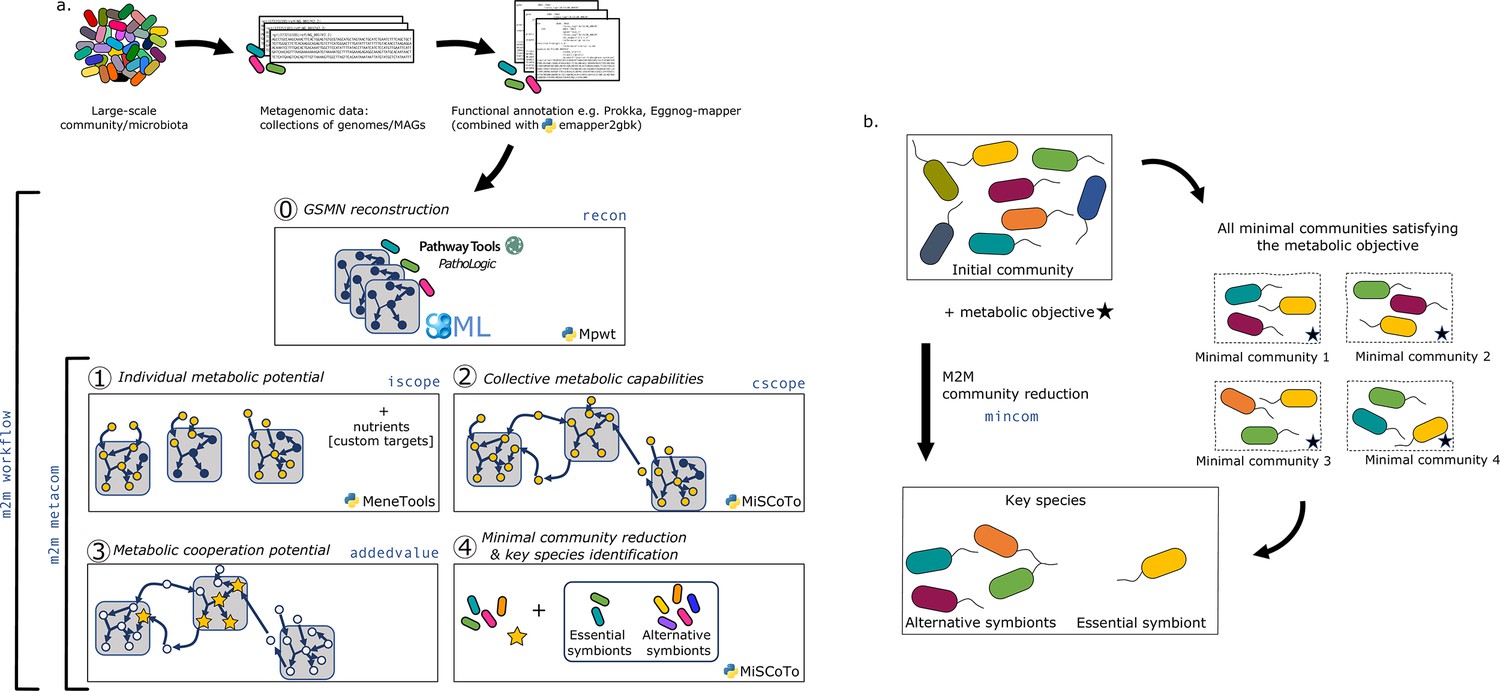
Overview of the Metage2Metabo (M2M) pipeline.
(a) Main steps of the M2M pipeline and associated tools. The software’s main pipeline (m2m workflow) takes as inputs a collection of annotated genomes that can be reference genomes or metagenomic-assembled genomes. The first step of M2M consists in reconstructing metabolic networks with Pathway Tools (step 0). This first step can be bypassed and genome-scale metabolic networks (GSMNs) can be directly loaded in M2M. The resulting metabolic networks are analysed to identify individual (step 1) and collective (step 2) metabolic capabilities. The added-value of cooperation is calculated (step 3) and used as a metabolic objective to compute a minimal community and key species (step 4). Optionally, one can customise the metabolic targets for community reduction. The pipeline without GSMN reconstruction can be called with m2m metacom, and each step can also be called independently (m2m iscope, m2m cscope, m2m addedvalue, m2m mincom). (b) Description of key species. Community reduction performed at step 4 can lead to multiple equivalent communities. M2M provides one minimal community and efficiently computes the full set of species that occur in all minimal communities, without the need for a full enumeration, thanks to projection modes. It is possible to distinguish the species occurring in every minimal community (essential symbionts), from those occurring in some (alternative symbionts). Altogether, these two groups form the key species.
Figure 2 with 6 supplements
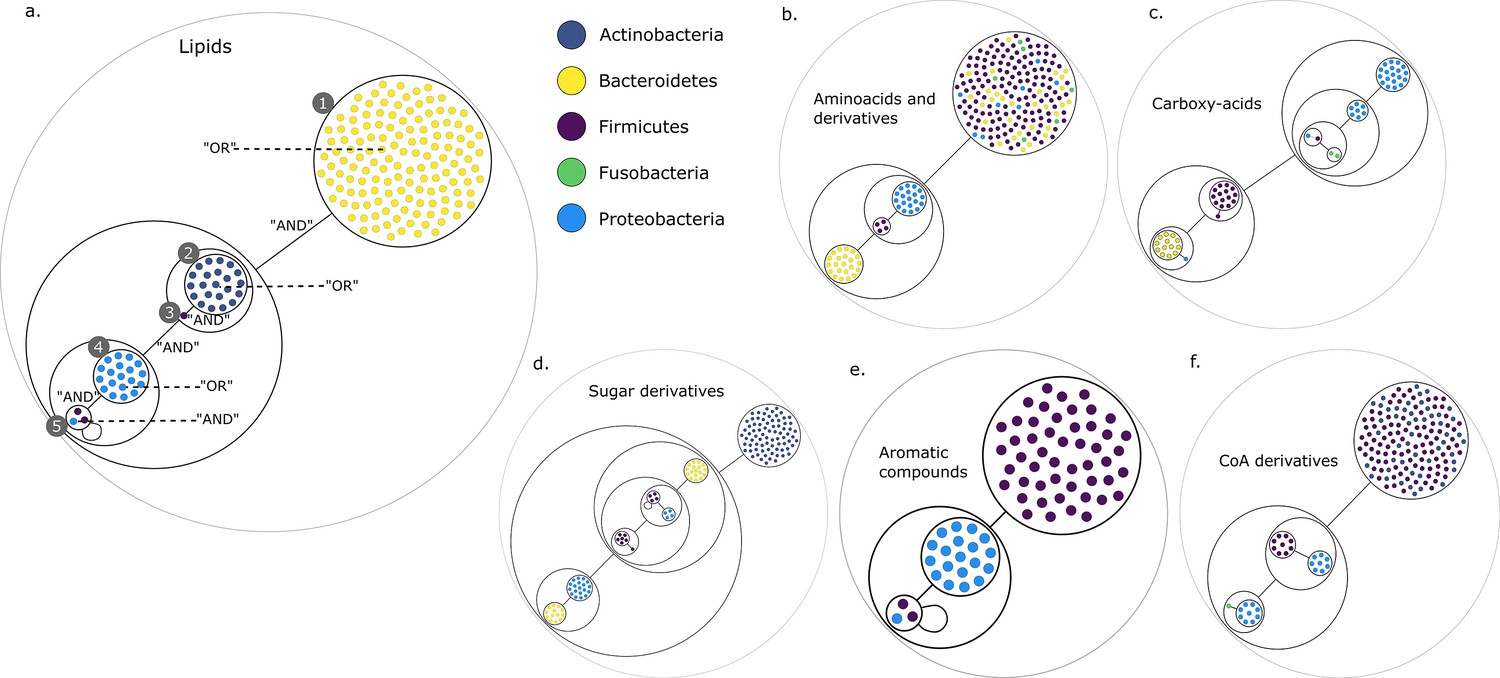
Power graph analysis of predicted microbial associations within communities for the human gut dataset.
Each category of metabolites predicted as newly producible in the gut was defined as a target set for community selection among the 1520 genome-scale metabolic networks (GSMNs) from the gut microbiota reference genomes dataset. For each metabolic group, key species and the full enumeration of all minimal communities were computed. Association graphs were built to associate members that are found together in at least one minimal community among the enumeration. These graphs were compressed as power graphs to identify patterns of associations and groups of equivalence within key species. Power graphs a., b., c., d., e., f. were generated for the sets of lipids, aminoacids and derivatives, carboxy-acids, sugar derivatives, aromatic compounds, and coenzyme A derivative compounds, respectively. Node colour describes the phylum associated to the GSMN. Figure (a) has an additional description to ease readability. Edges symbolise conjunctions ('AND’) and the co-occurrences of nodes in regular power nodes (as in power node 1, 2, 4) symbolise disjunctions ('OR’) related to alternative symbionts. Power nodes with a loop (e.g. power node 5) indicate conjunctions. Therefore, each enumerated minimal community for lipid production is composed of the two Firmicutes and the Proteobacteria from power node 5, the Firmicutes node 3 (the four of them being the essential symbionts), and one Proteobacteria from power node 4, one Actinobacteria from power node 2 and 1 Bacteroidetes from power node 1. Members from an inner power node are interchangeable with respect to the metabolic objective. A version of the figures with species identification is available in Figure 2—figure supplement 1, Figure 2—figure supplement 2, Figure 2—figure supplement 3, Figure 2—figure supplement 4, Figure 2—figure supplement 5, Figure 2—figure supplement 6 (see Supplementary file 1 - Table 4 for a mapping between identifiers and taxonomy). Power graphs can be generated with m2m_analysis. The figures display one visual representation for each power graph although such representations are not unique. The number of power edges is minimal, which leads to nesting of (power) nodes.
Figure 2—figure supplement 1
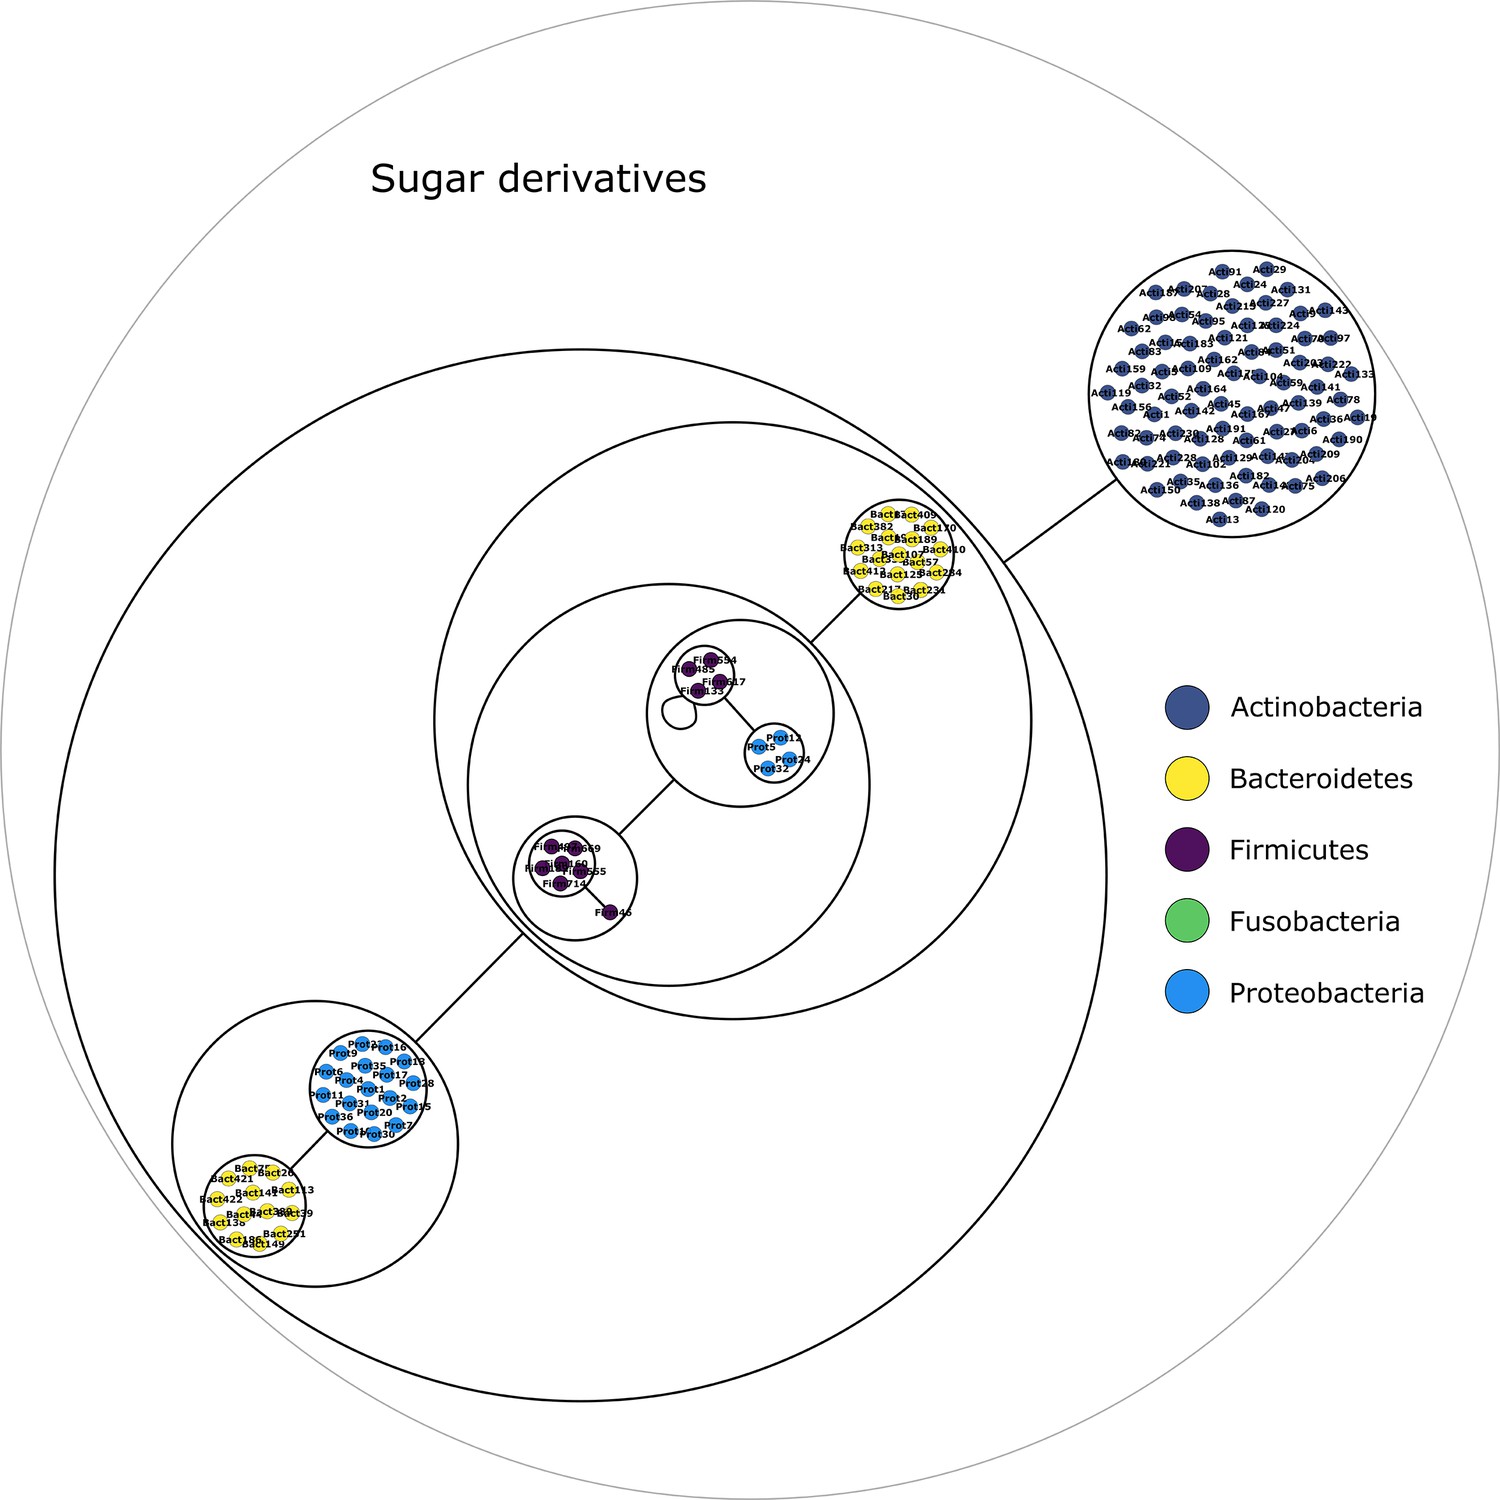
Sugars derivatives power graph.
Power graph associated to the minimal communities producing the sugars derivatives group of targets.
Figure 2—figure supplement 2
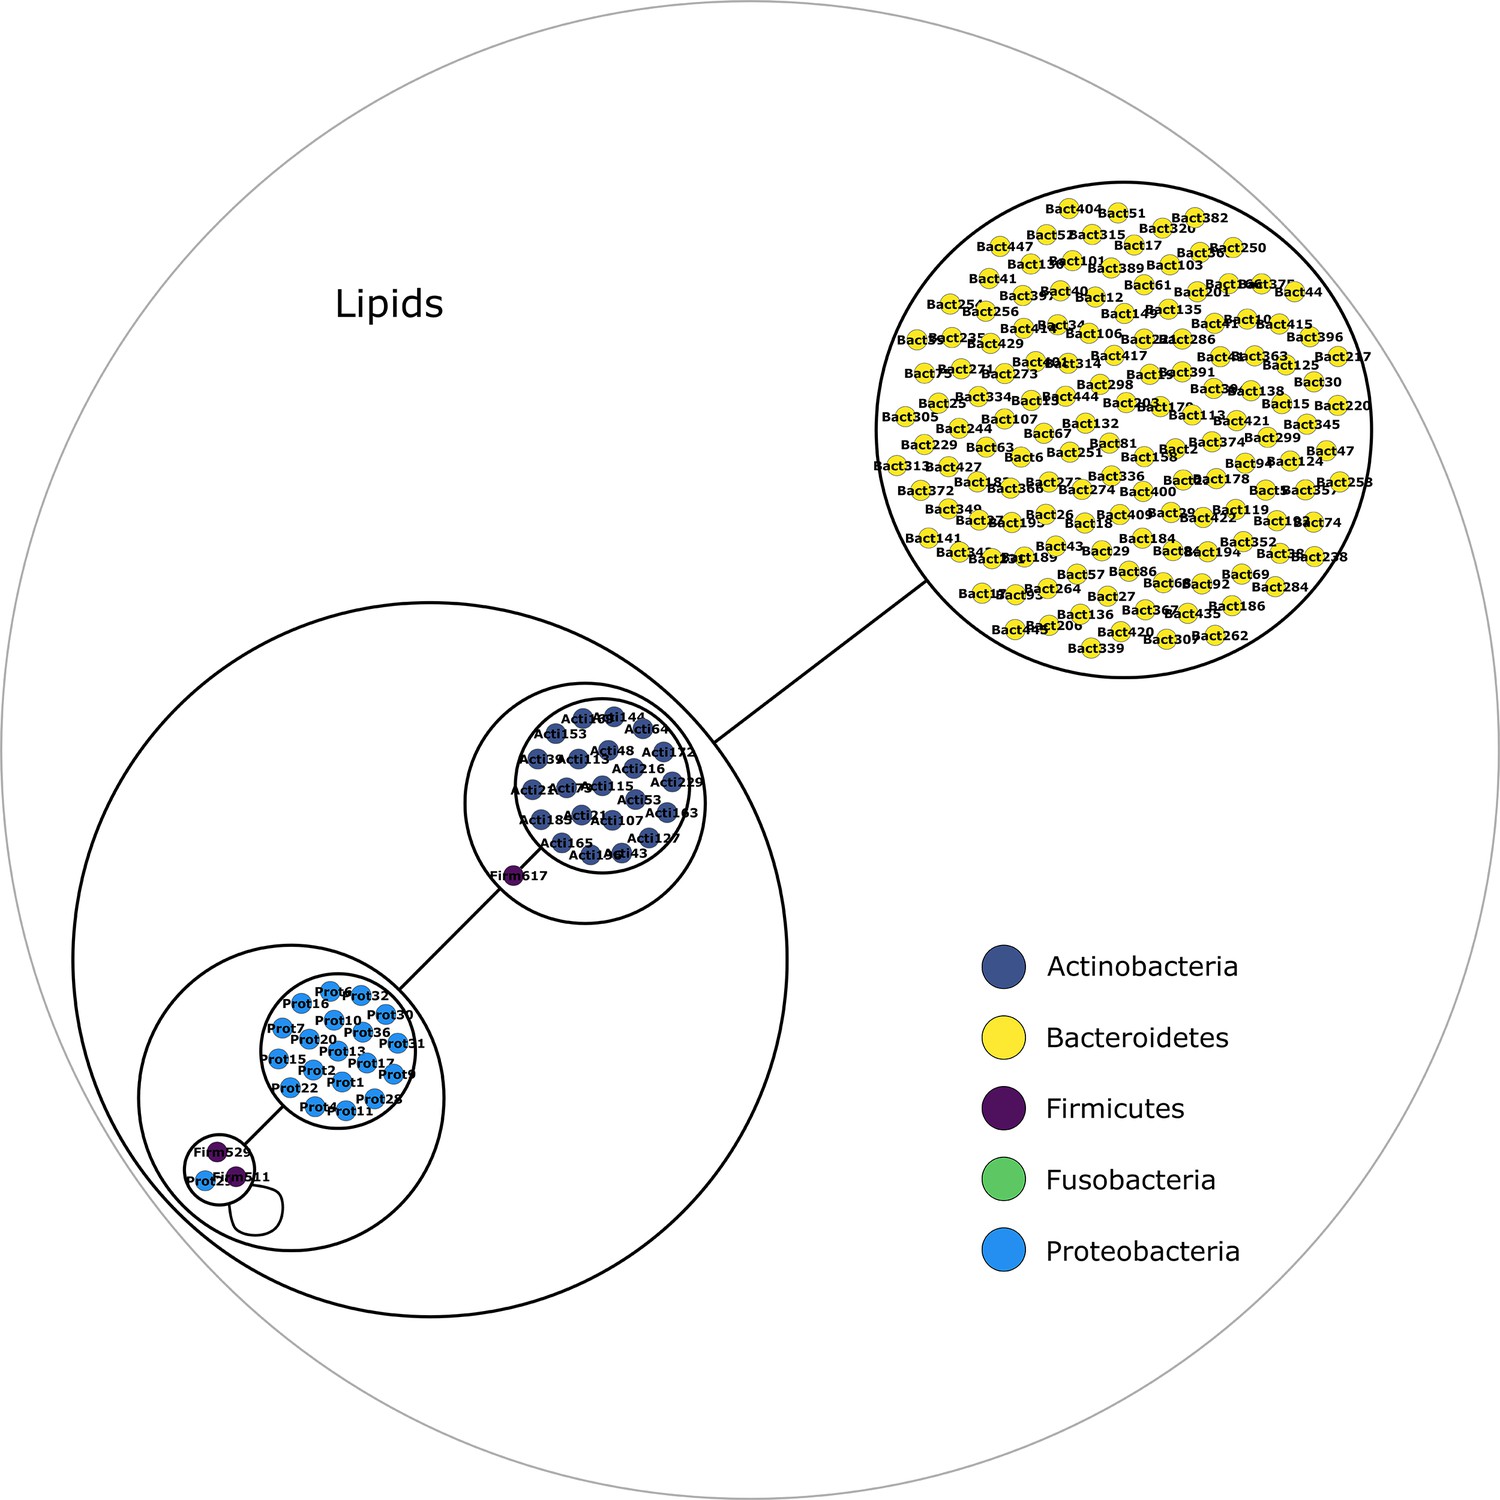
Lipids derivatives power graph.
Power graph associated to the minimal communities producing the lipids derivatives group of targets.
Figure 2—figure supplement 3
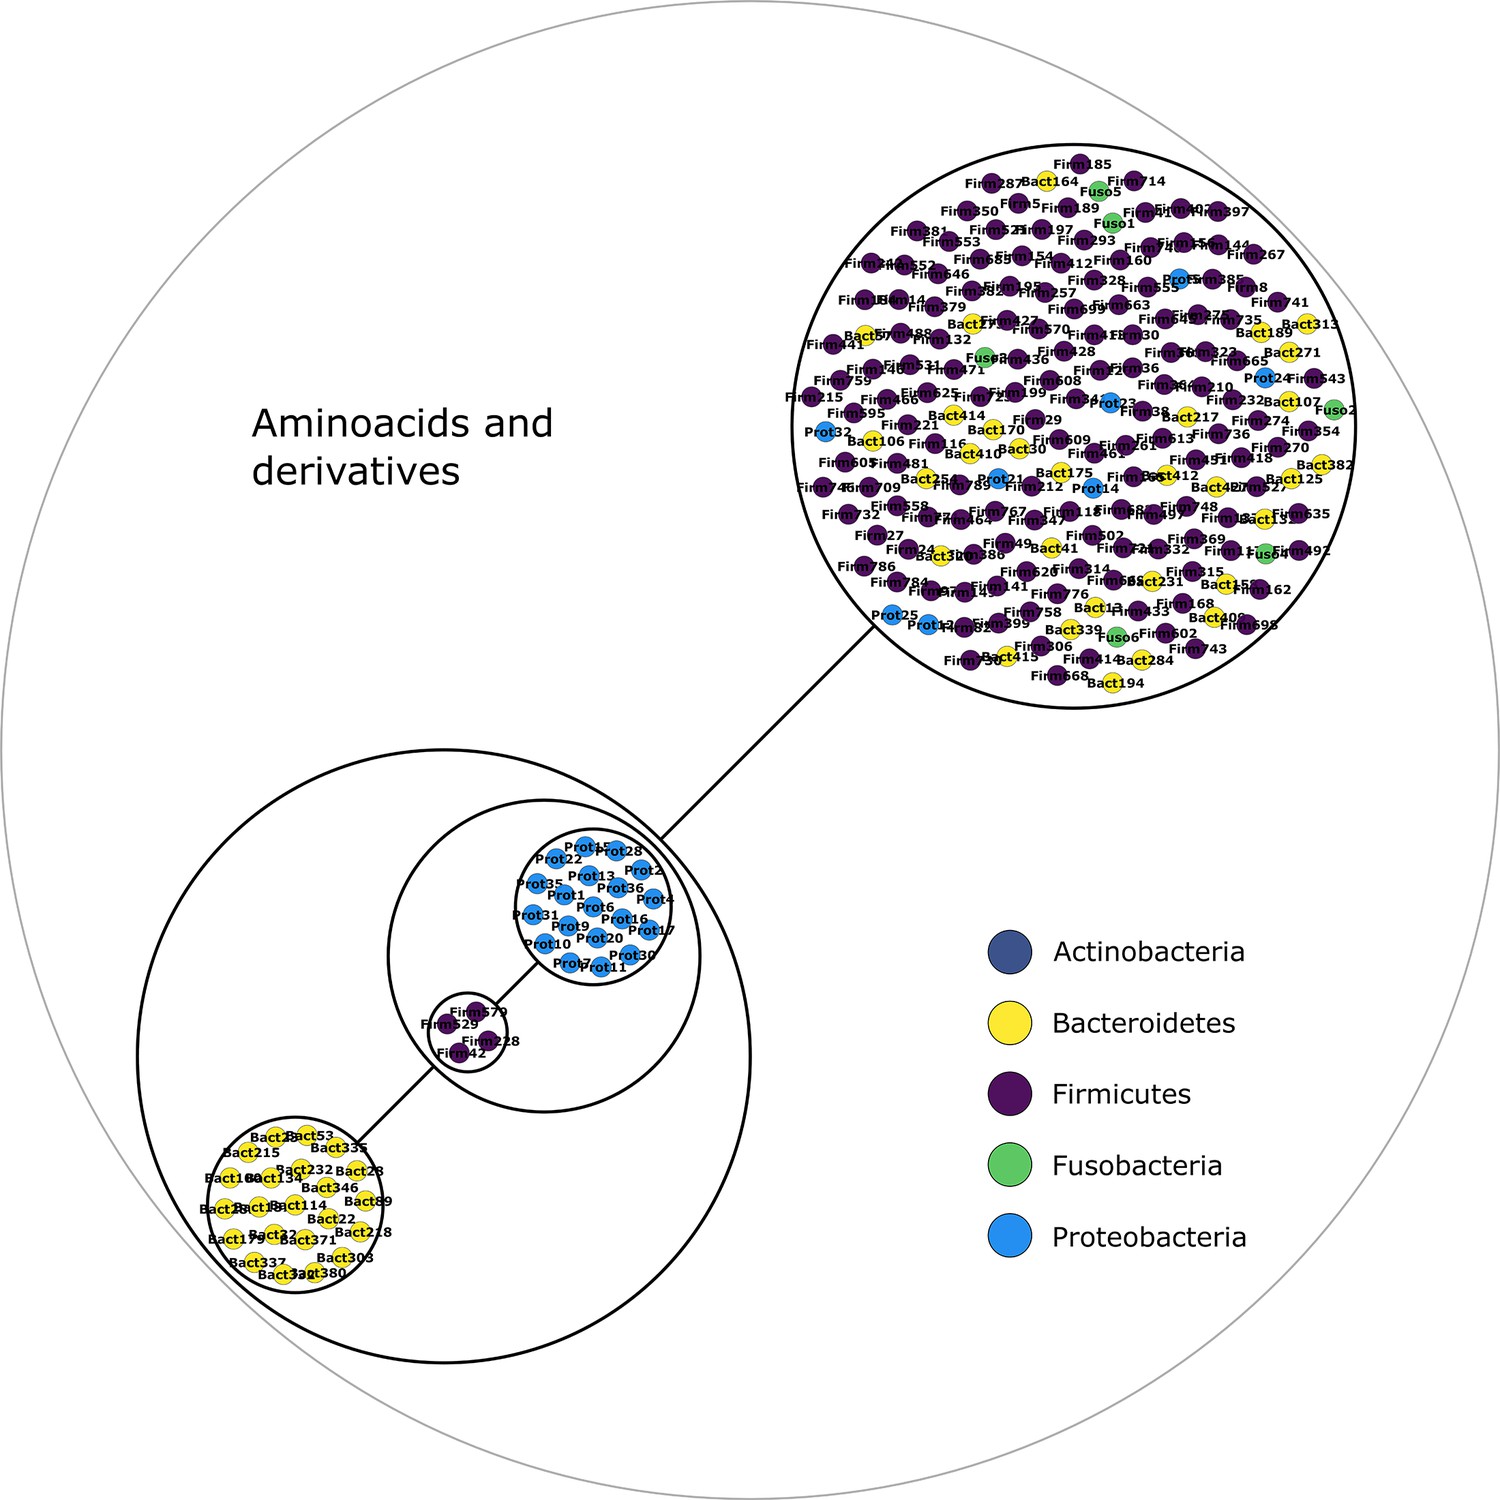
Amino acids and derivatives power graph.
Power graph associated to the minimal communities producing the amino acids and derivatives group of targets.
Figure 2—figure supplement 4
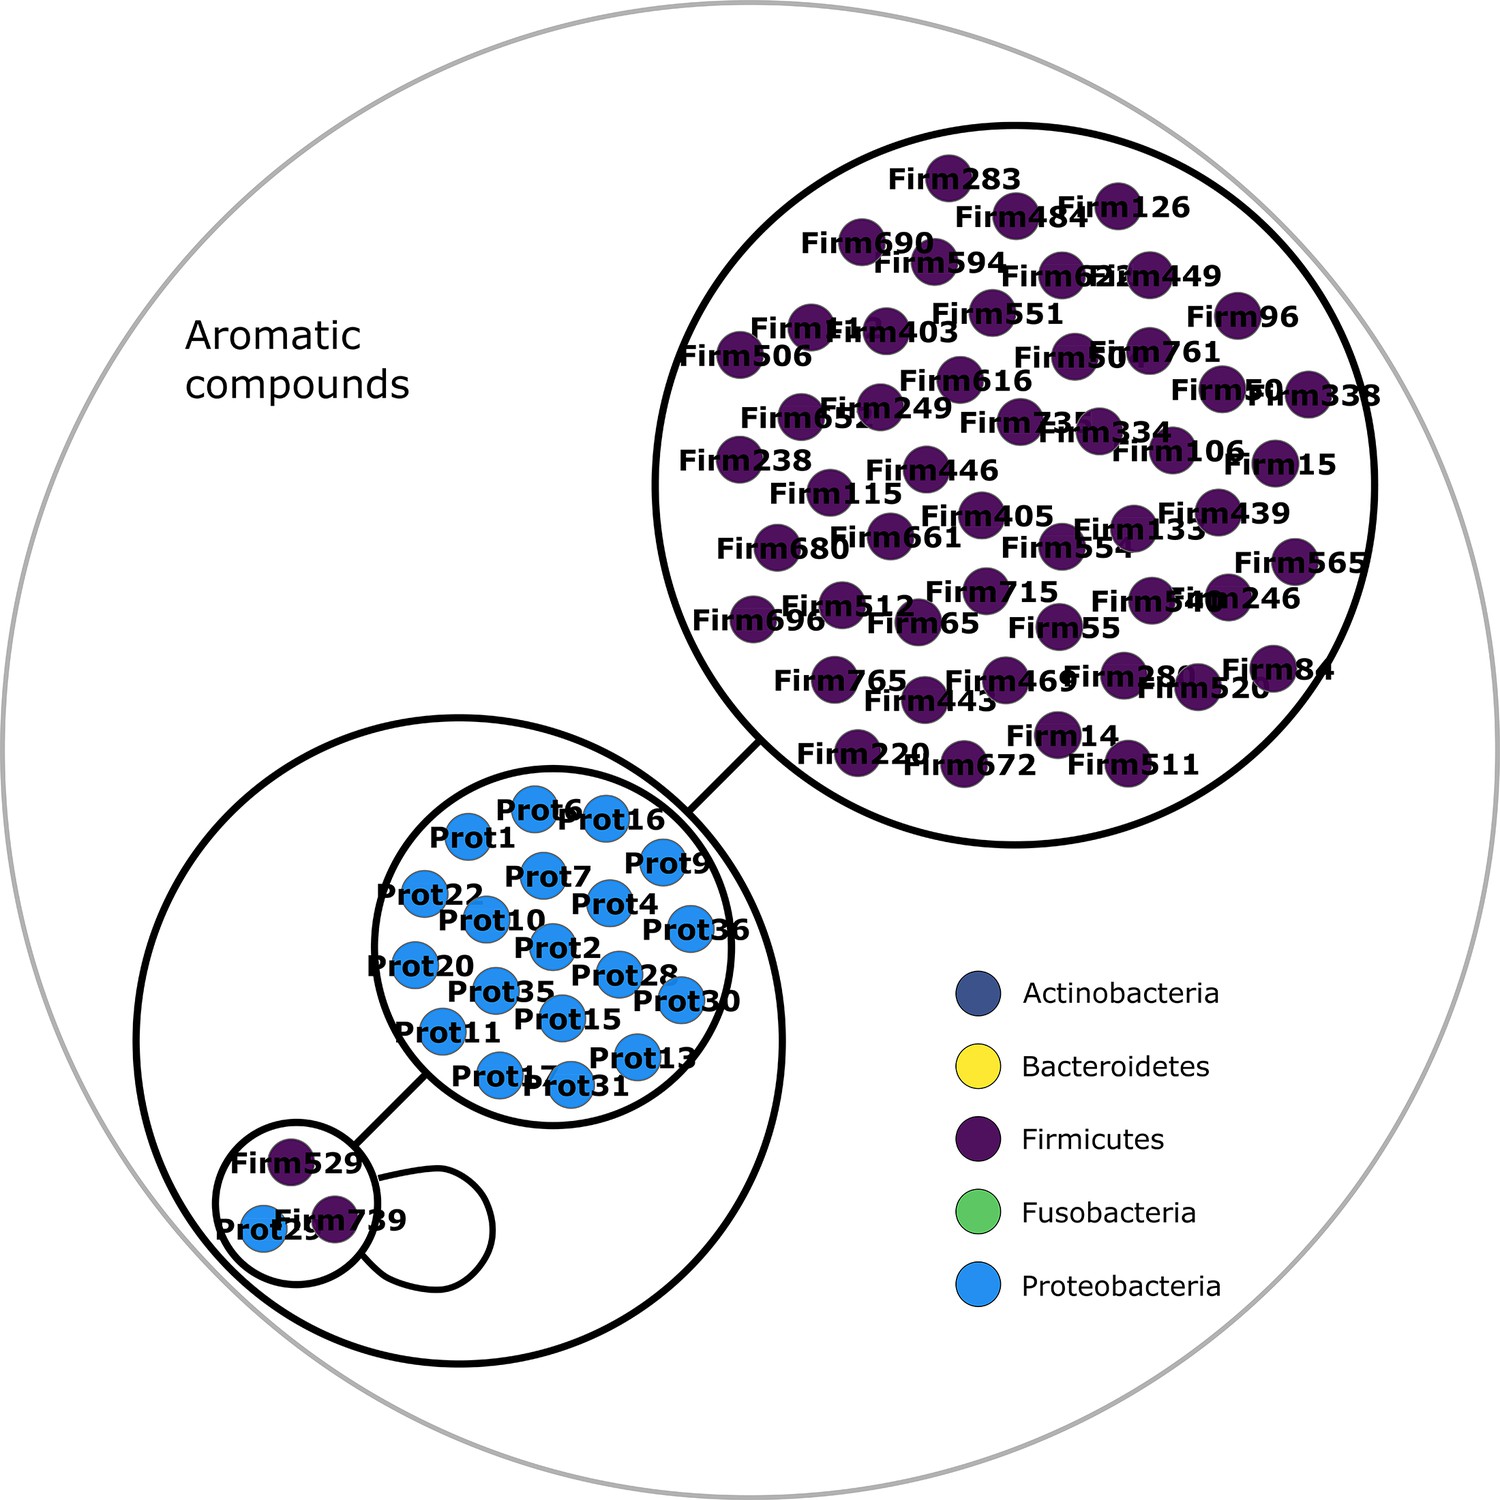
Aromatic compounds power graph.
Power graph associated to the minimal communities producing the aromatic compounds group of targets.
Figure 2—figure supplement 5
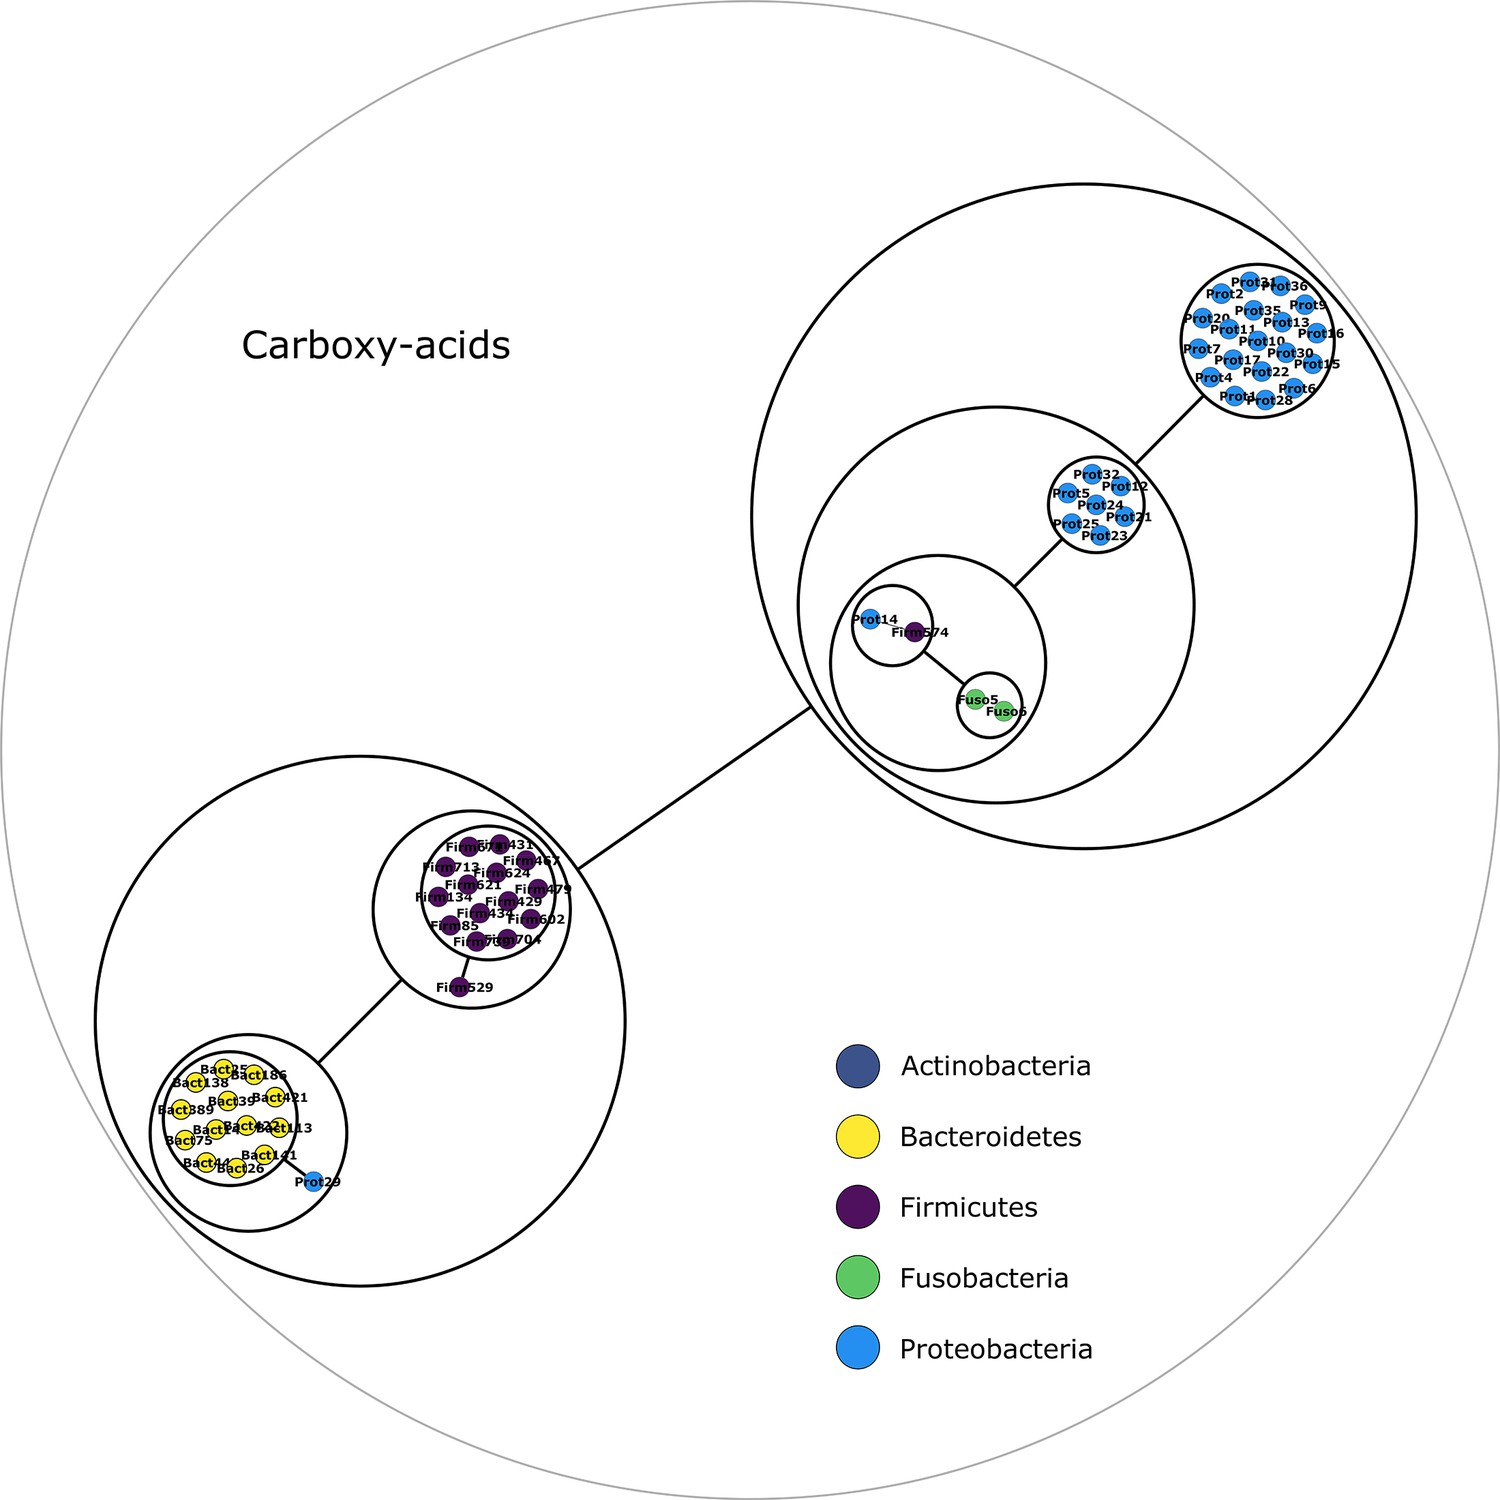
Carboxy-acids compounds power graph.
Power graph associated to the minimal communities producing the carboxy-acids group of targets.
Figure 2—figure supplement 6
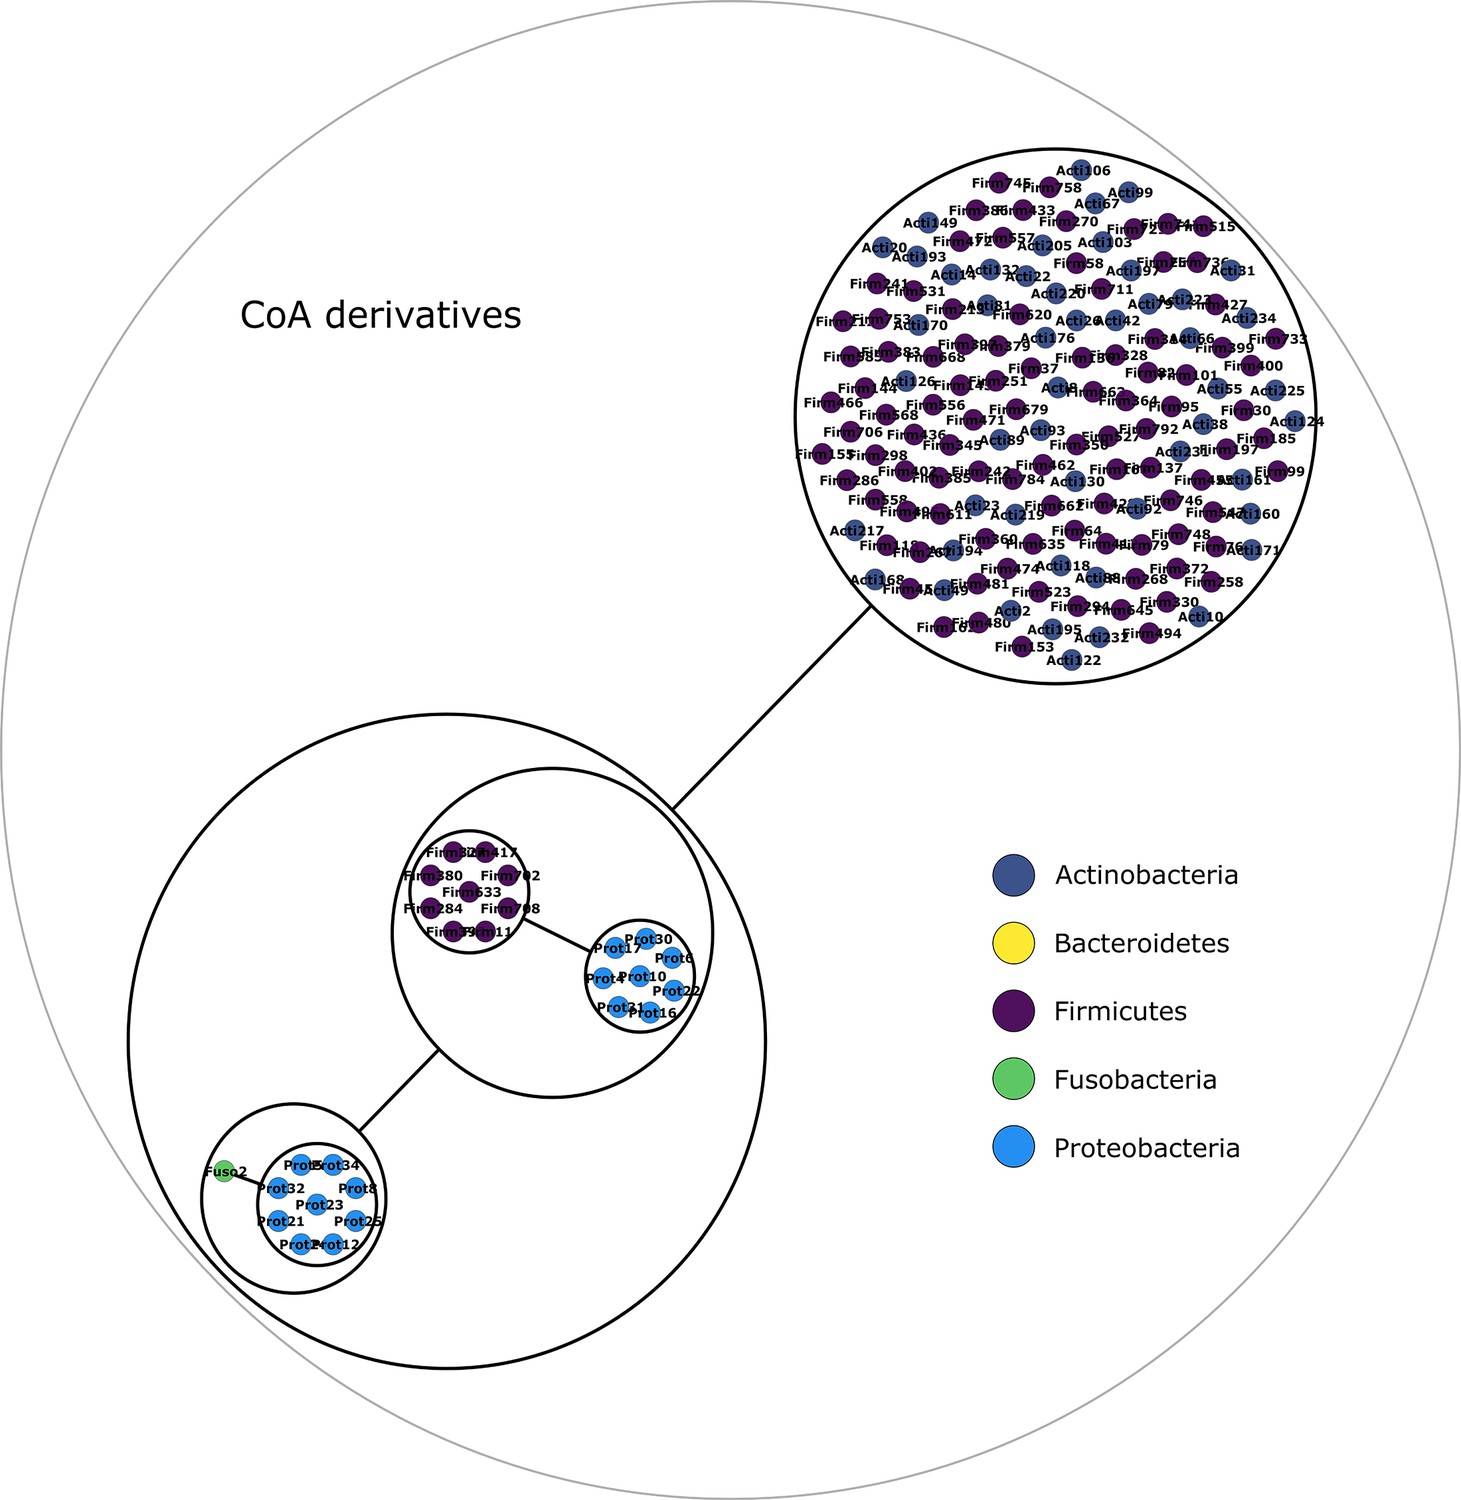
Coenzyme A derivatives power graph.
Power graph associated to the minimal communities producing the coenzyme A derivatives group of targets.
Figure 3
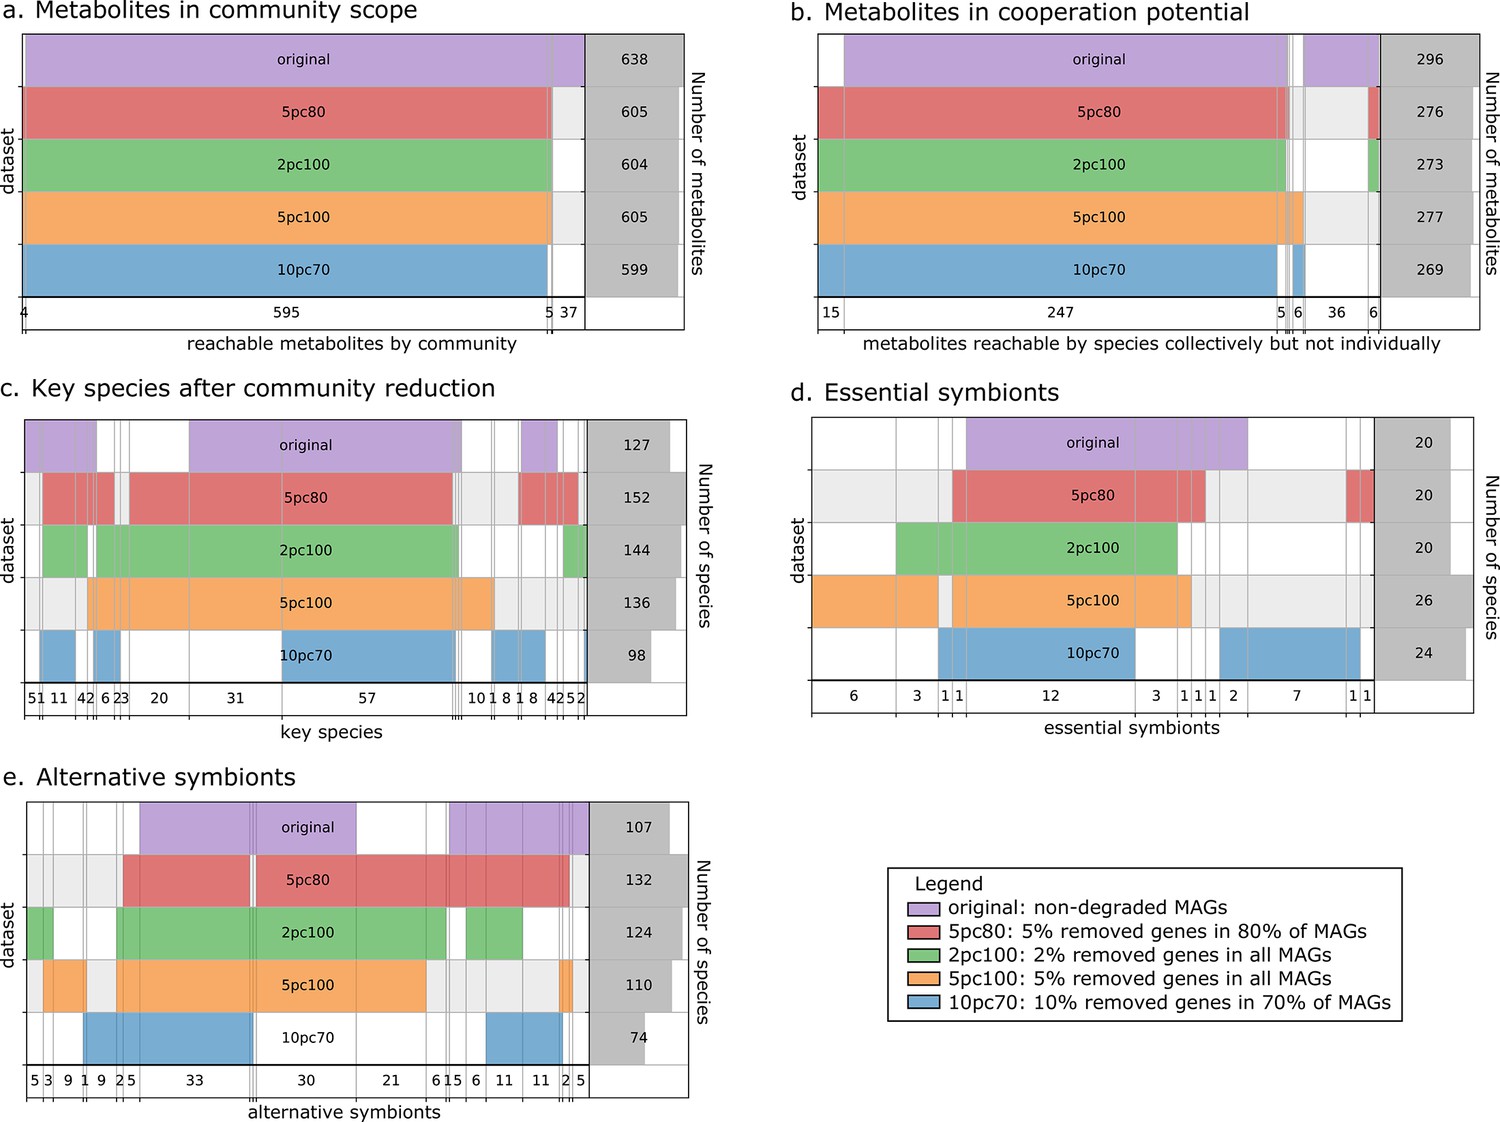
Robustness analysis of Metage2Metabo (M2M) results on datasets of altered metagenome-assembled genomes (MAGs).
A proportion of genes were randomly removed from all or a random subset of the 913 rumen MAGs: 2% from all genomes (2pc100), 5% from 80% of the genomes (5pc80), 5% from all genomes (5pc100) and 10% from 70% of the genomes (10pc70). M2M pipeline was ran on these four datasets and comparison was made with respect to the initial non-altered dataset of MAGs (original). Subfigures a to e each represent one piece of information computed by M2M and compared between the five experiments. (a) Set of producible compounds by all metabolic networks in a cooperative system (community scope); supervenn representation. Each dataset of metabolic networks obtained from the original or degraded genomes is represented horizontally, with a unique colour. The right panel of the supervenn diagram indicates the number of metabolites in the community scope of the corresponding dataset. Vertical overlaps between sets represent intersections (e.g groups of metabolites retrieved in several datasets) whose size is indicated on the X axis. For example, there is a set of 37 metabolites that are producible in the original dataset only, and a set of 5 metabolites predicted as producible in all datasets but the one where 70% of genomes were 10%-degraded. A full superimposition of all the coloured bars would indicate a complete stability of the community scope between datasets. (b) Comparison of the cooperation potential between the five experiments. (c) Comparison of key species that gather essential symbionts (d) and alternative symbionts (e).
Figure 4

Effect of the disease status on the metabolism of communities in MHD samples.
M2M was run on collections of genome-scale metabolic networks (GSMNs) associated to metagenome-assembled genomes (MAGs) identified in metagenomic samples from a cohort of healthy and diabetic individuals. Panel (a) describes the distributions of community sizes for all metagenomic samples according to the disease status: T1D: Type-1 Diabetes, T2D: Type-2 Diabetes. Panels (b) and (c) show the distribution of the community scope sizes and cooperation potential sizes respectively, according to the disease status. Panel (d) is the receiver operating curve (ROC) of an SVM classification experiment aiming at predicting the disease status for the MHD cohort (control n = 49 or diabetes n = 66) based on the community scope composition. Panel (e) illustrates the community scope composition in terms of metabolites for all samples. Disease status is indicated by the colour at the left side of each row. Panel (f) illustrates the composition of the cooperation potential according to the belonging of metabolites to Metacyc families of compounds. Disease status is indicated by the colour at the left side of each row. Panel (g) describes the taxonomic distribution at the phylum level of groups of species before and after community reduction, according to the disease status. Selection of communities was performed with the objective of making producible by the reduced communities the set of metabolites in the cooperation potential. init: initial composition of communities, KS: key species, AS: alternative symbionts, ES: essential symbionts. T1D: Type-1 Diabetes, T2D: Type-2 Diabetes.
Appendix 1—figure 1
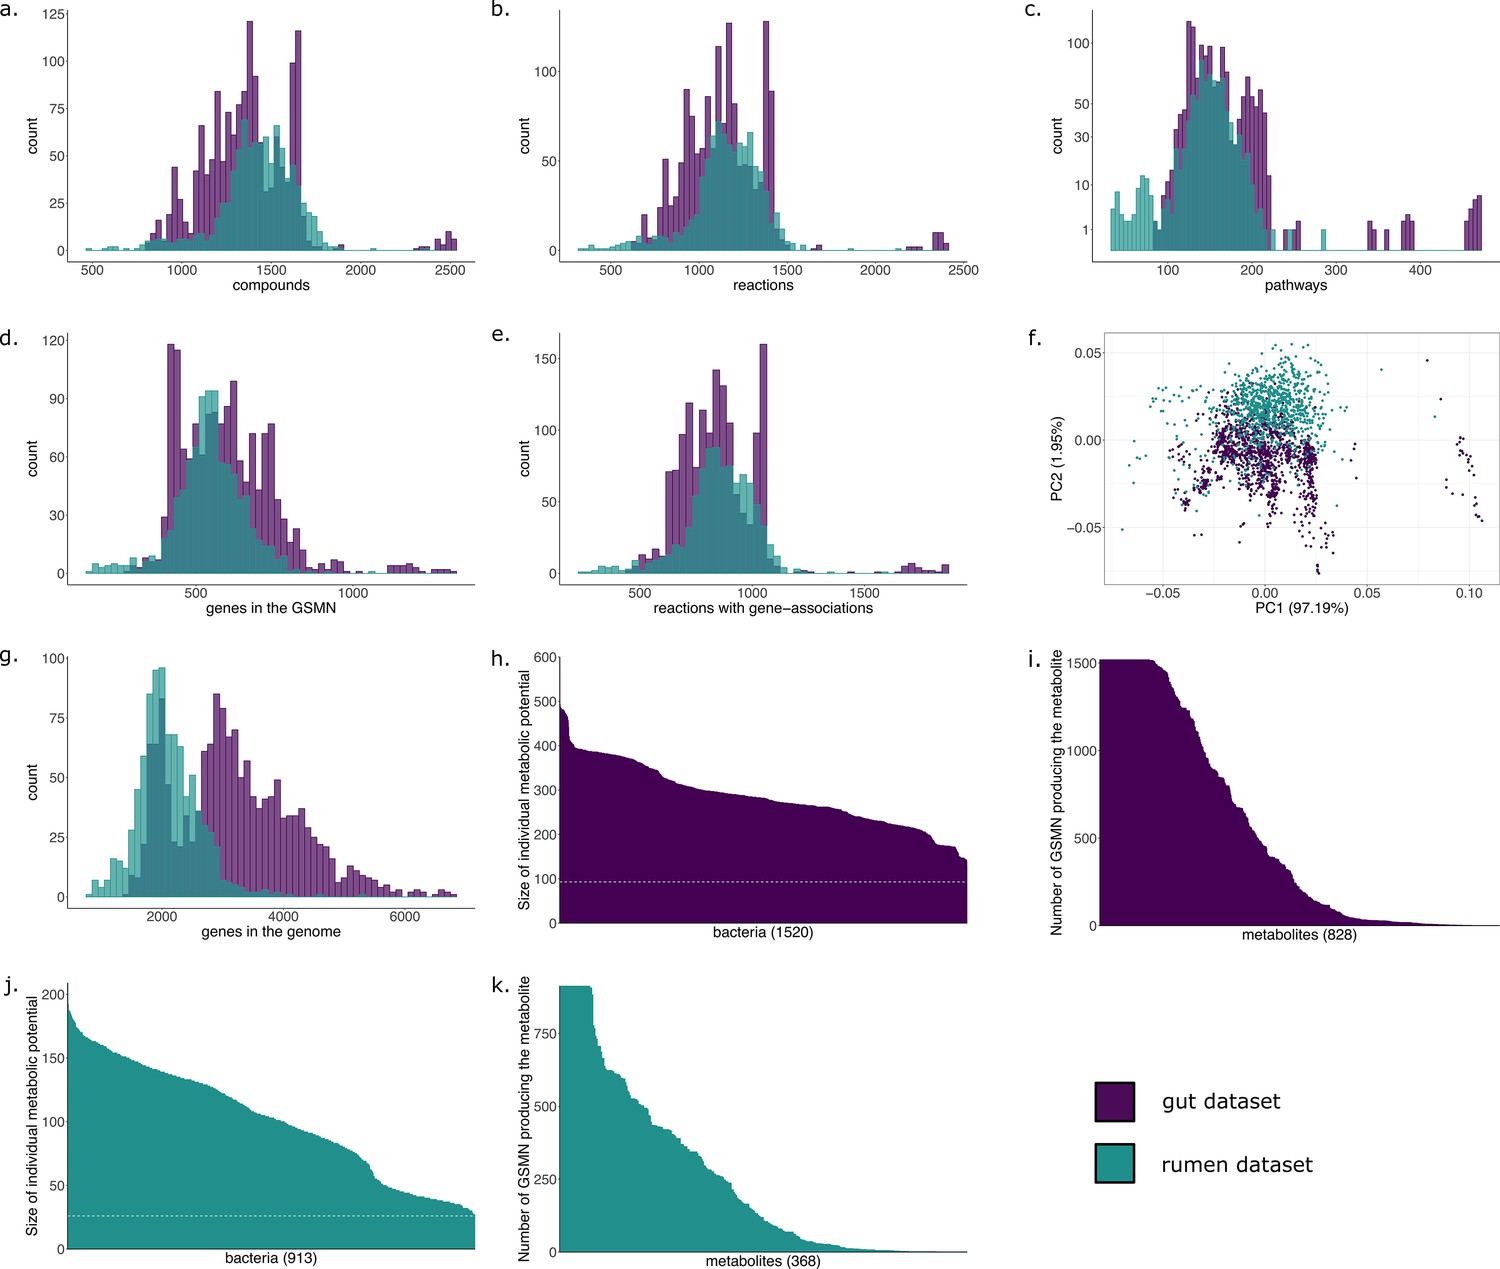
Characteristics of the metabolic networks built for the gut and the rumen datasets.
(a) Distribution of the number of metabolic compounds in genome-scale metabolic networks (GSMNs) reconstructed for the gut dataset (purple) and the rumen dataset (green). (b) Distribution of the number of metabolic reactions. (c) Distribution of the number of complete pathways according to the MetaCyc database. (d) Distribution of the number of genes included into the GSMNs. (e) Distribution of the number of reactions associated to genes. (f) Principal component analysis of the GSMNs reconstructions based on the previous characteristics (a. to e.). (g) Distribution of the number of genes (not necessarily related to metabolism) in the initial genomes/MAGs. (h) Individual metabolic potentials (scopes) for the gut bacteria, dotted line represents the number of seeds (nutrients) used in the algorithm. (i) Reachability of metabolites by gut bacteria. (j) Individual metabolic potentials (scopes) for the rumen bacteria, dotted line represents the number of seeds (nutrients) used in the algorithm. (k) Reachability of metabolites by rumen bacteria.
Appendix 2—figure 1
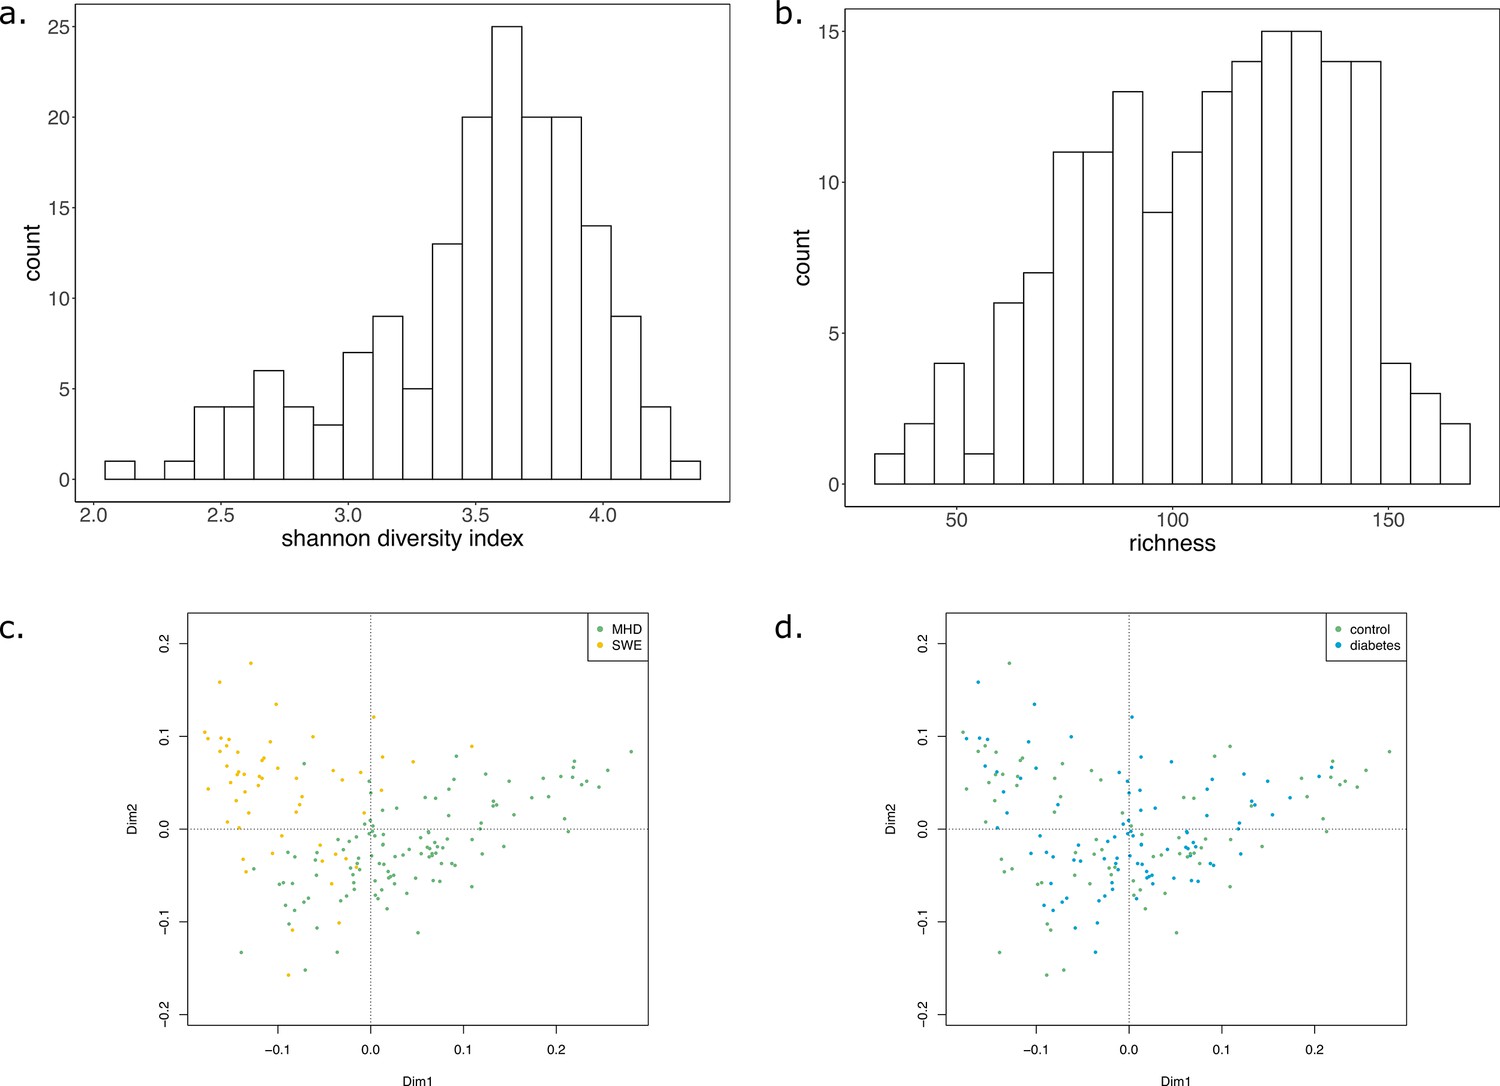
Shannon diversity index, richness, and metabolic distance of the samples.
(a) Histogram depicting the Shannon diversity index of the samples. (b) Histogram depicting the richness of the samples. (c and d) Principal coordinate analysis (PCoA) of the Bray-Curtis distance calculated on the KO composition of samples coloured by dataset (c) or disease status (d).
Appendix 2—figure 2
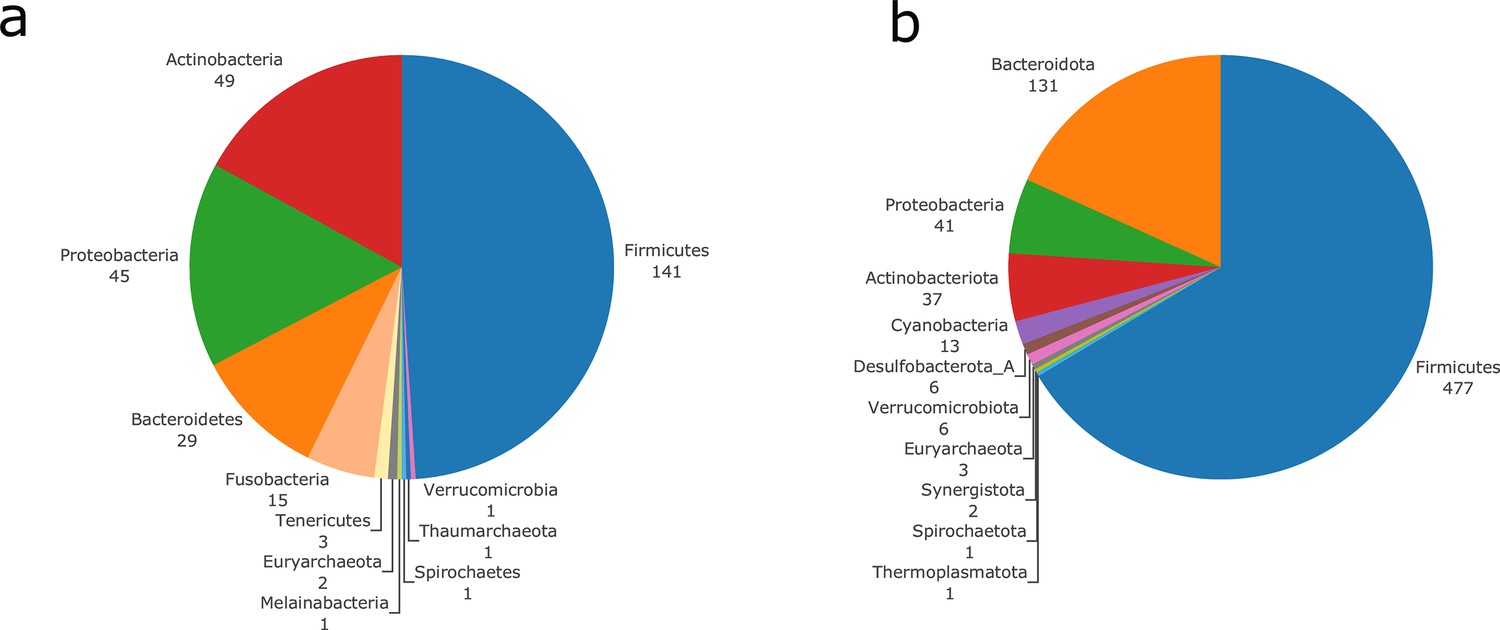
Taxonomic diversity of the genomes used for genome-scale metabolic networks (GSMNs) reconstruction using OTU mapping (at species level) to curated metabolic models (a), or reconstructed metagenomic species (MGS) (b).
Phyla composition of the genomes, and number of distinct representatives for each phylum.
Appendix 2—figure 3
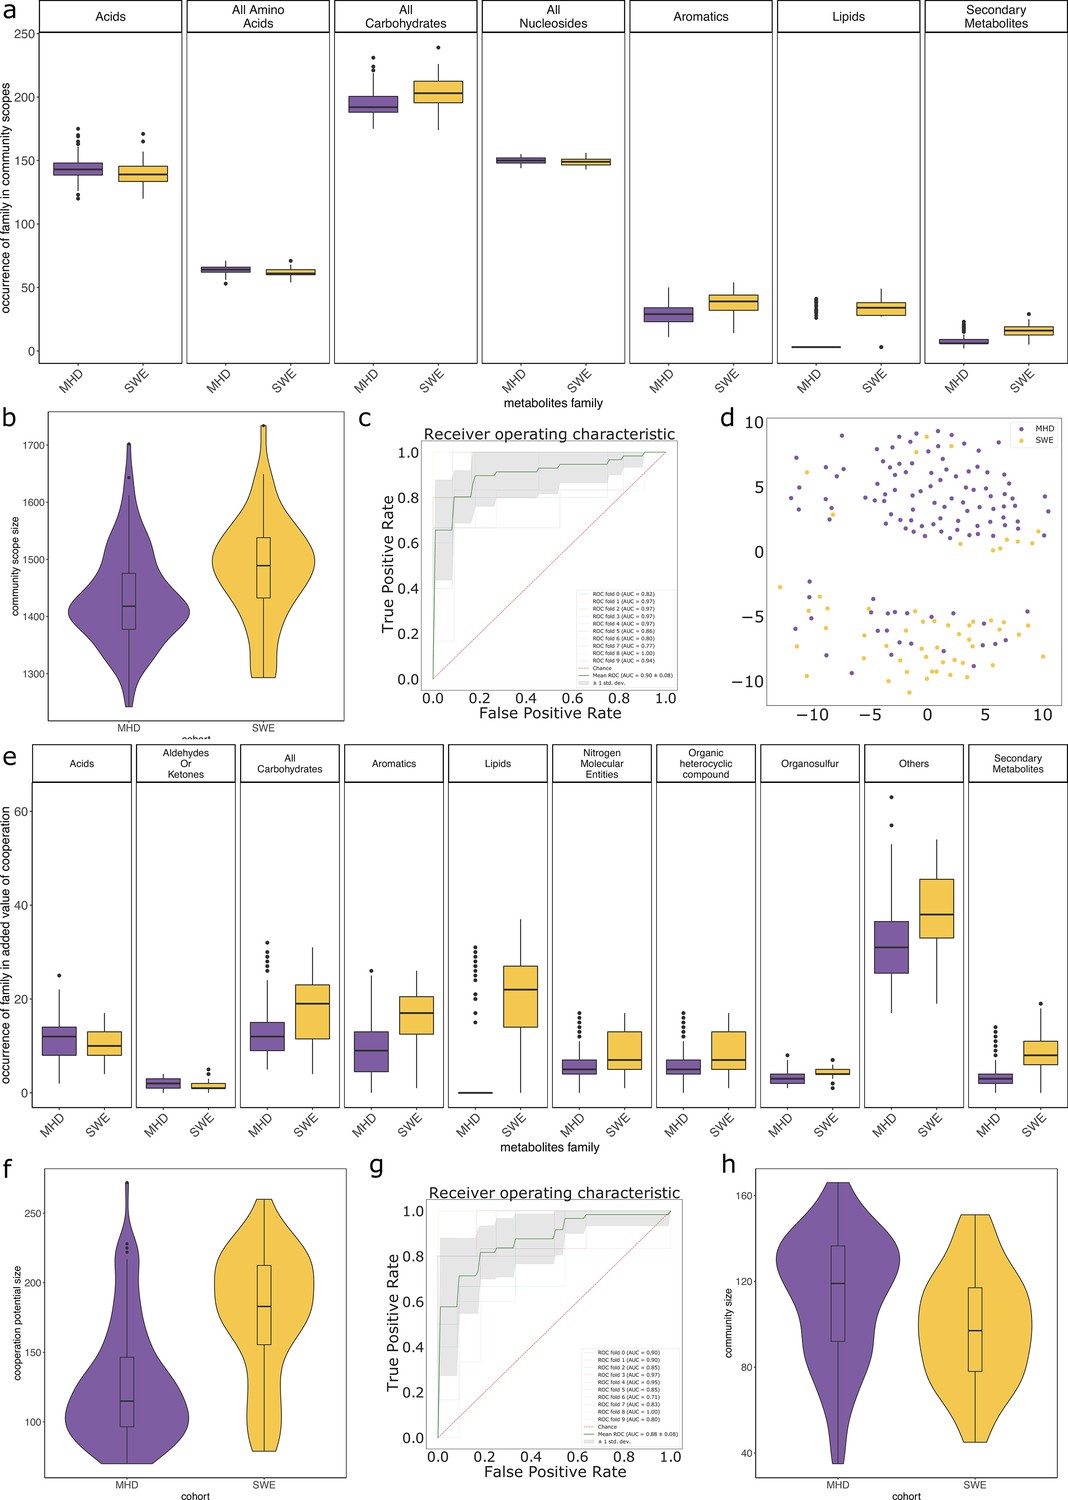
Impact of the cohort when studying the metabolisms of individuals from the metagenomic dataset.
Panels (a) to (d) focus on the community scope, that is the set of metabolites reachable by the community associated to a sample. Panel (d) shows the representation of a multidimensional scaling (MDS) on the community scope composition between cohorts. Panels (e) to (g) focus on the cooperation potential, that is the set of metabolites that are not expected to be produced by individual members of communities and instead require cooperation. Panels (a) and (e) describe families of metabolites whose occurrences significantly differ between cohorts in the corresponding group (community scope or cooperation potential). Panels (b) and (f) illustrate the size of the community scope and cooperation potential respectively in samples from the two cohorts. Panels c (resp. g) are receiving operating curves (ROC) of a classification experiment aiming at separating the cohort (MHD n = 115, SWE n = 55) based on the occurrences of metabolites in the community scope (resp. cooperation potential). Panel (h) describes the size of the initial community associated to samples of both cohorts according to abundance data of MGS.
Appendix 2—figure 4

Impact of the status when studying the metabolisms of individuals from the MHD metagenomic dataset.
Panel (a) is the receiver operating curve (ROC) of the classification experiment aiming at deciphering the disease status for the MHD cohort (control n = 49, Type-1 Diabetes n = 31 or Type-2 Diabetes n = 35) based on the cooperation potential composition. Panel (b) illustrates the cooperation potential composition in terms of metabolites for all samples. Disease status is indicated by the colour at the left side of each row. Panel (c) describes the taxonomic distribution at the phylum level of groups of species before and after community reduction, according to the disease status. Selection of communities was performed with the objective of making producible by the reduced communities the set of metabolites in the cooperation potential. init: initial composition of communities, KS: key species, AS: alternative symbionts, ES: essential symbionts. T1D: Type-1 Diabetes, T2D: Type-2 Diabetes.
Tables
Table 1
List and description of Metage2Metabo (M2M) commands.
| Command | Action |
|---|---|
| m2m workflow | Runs the whole m2m workflow |
| m2m metacom | Runs the workflow with already-reconstructed metabolic networks |
| m2m recon | Reconstructs metabolic networks using Pathway Tools |
| m2m iscope | Computes scopes for individual metabolic networks |
| m2m cscope | Computes the community scope |
| m2m addedvalue | Computes the cooperation potential |
| m2m mincom | Selects a minimal community and computes key species |
| m2m seeds | Creates a SBML file for nutrients |
| m2m test | Runs m2m workflow on a sample dataset |
| m2m_analysis | Runs additional analyses on community selection |
Table 2
Results of the genome-scale metabolic network (GSMN) reconstruction step and metabolic potential analysis for the three datasets presented in the article (Avg = Average, '±' precedes standard deviation).
| Gut dataset | Rumen dataset | Diabetes dataset | |
|---|---|---|---|
| Initial data | Draft reference genomes | MAGs | MAGs |
| Number of genomes | 1520 | 913 | 778 |
| GSMN reconstruction | |||
| All reactions | 3932 | 4418 | 5554 |
| All metabolites | 4001 | 4466 | 5386 |
| Avg reactions per GSMN | 1144 (±255) | 1155 (±199) | 1640 (±368) |
| Avg metabolites per GSMN | 1366 (±262) | 1422 (±212) | 1925 (±361) |
| Avg genes per mn | 596 (±150) | 543 (±107) | 1658 (±469) |
| % reactions associated to genes | 74.6 (±2.17) | 73.8 (±2.61) | 79.57 (±1.60) |
| Avg pathways per mn | 163 (±49) | 146 (±32) | 220 (±58) |
| Metabolic potential | |||
| Number of seeds | 93 | 26 | 175 |
| Avg scope per mn | 286 (±70) | 101 (±44) | 508 (±83) |
| Union of individual scopes | 828 | 368 | 1326 |
Table 3
Community reduction analysis of the target categories in the gut.
All minimal communities were enumerated, starting from the set of 1520 genome-scale metabolic networks (GSMNs). KS: key species, ES: essential symbionts, AS: alternative symbionts, Firm.: Firmicutes, Bact.: Bacteroidetes, Acti.: Actinobacteria, Prot.: Proteobacteria, Fuso.: Fusobacteria.
| Firm. | Bact. | Acti. | Prot. | Fuso. | Total | ||
|---|---|---|---|---|---|---|---|
| Aminoacids and derivatives (5 targets)4 bact. per community120,329 communities | KS | 142 | 52 | 0 | 27 | 6 | 227 |
| ES | 0 | 0 | 0 | 0 | 0 | 0 | |
| AS | 142 | 52 | 0 | 27 | 6 | 227 | |
| Aromatic compounds (11 targets)5 bact. per community950 communities | KS | 52 | 0 | 0 | 20 | 0 | 72 |
| ES | 2 | 0 | 0 | 1 | 0 | 3 | |
| AS | 50 | 0 | 0 | 19 | 0 | 69 | |
| Carboxyacids (14 targets)9 bact. per community48,412 communities | KS | 16 | 13 | 0 | 28 | 2 | 59 |
| ES | 2 | 0 | 0 | 2 | 0 | 4 | |
| AS | 14 | 13 | 0 | 26 | 2 | 55 | |
| CoA derivatives (10 targets)5 bact. per community95,256 communities | KS | 106 | 0 | 50 | 17 | 1 | 174 |
| ES | 0 | 0 | 0 | 0 | 1 | 1 | |
| AS | 106 | 0 | 50 | 17 | 0 | 173 | |
| Lipids (28 targets)7 bact. per community58,520 communities | KS | 3 | 140 | 22 | 20 | 0 | 185 |
| ES | 3 | 0 | 0 | 1 | 0 | 4 | |
| AS | 0 | 140 | 22 | 19 | 0 | 181 | |
| Sugar derivatives (58 targets)11 bact. per community7,860,528 communities | KS | 11 | 30 | 78 | 23 | 0 | 142 |
| ES | 5 | 0 | 0 | 0 | 0 | 5 | |
| AS | 6 | 30 | 78 | 23 | 0 | 137 |
Appendix 1—table 1
Effect of MAG degradation on genome-scale metabolic network (GSMN) reconstructions.
Numbers are averages. '±' precedes standard deviation values. 'original’: initial MAGs prior degradation, '2pc100’: 2% gene removal in all MAGs, '5pc80’: 5% gene removal in 80% of MAGs, '5pc100’: 5% gene removal in all MAGs, '10pc70’: 10% gene removal in 70% of MAGs.
| Original | 2pc100 | 5pc80 | 5pc100 | 10pc70 | |
|---|---|---|---|---|---|
| Genes in MAGs | 2100 (±501) | 2058 (±491) | 2016 (±484) | 1994 (±478) | 1954 (±480) |
| Reactions in GSMNs | 1155 (±199) | 1131 (±192) | 1116 (±192) | 1108 (±190) | 1094 (±192) |
| Metabolites in GSMNs | 1422 (±212) | 1402 (±207) | 1388 (±208) | 1381 (±206) | 1366 (±208) |
| Genes in GSMNs | 543 (±108) | 532 (±106) | 521 (±105) | 515 (±103) | 505 (±105) |
| % reactions with genes | 73.84% | 74.05% | 73.82% | 73.72% | 73.61% |
| Gene loss in MAGs | — | 1.98% | 4.01% | 5.03% | 6.94% |
| Reaction loss in GSMNs | — | 1.96% | 3.30% | 3.89% | 5.17% |
| Metabolite loss in GSMNs | — | 1.37% | 2.41% | 2.91% | 3.92% |
| Gene loss in GSMNs | — | 2.09% | 4.17% | 5.11% | 7.02% |
Additional files
-
Supplementary file 1
Supplementary tables 1 to 25.
- https://cdn.elifesciences.org/articles/61968/elife-61968-supp1-v2.xlsx
-
Transparent reporting form
- https://cdn.elifesciences.org/articles/61968/elife-61968-transrepform-v2.pdf
Download links
A two-part list of links to download the article, or parts of the article, in various formats.
Downloads (link to download the article as PDF)
Open citations (links to open the citations from this article in various online reference manager services)
Cite this article (links to download the citations from this article in formats compatible with various reference manager tools)
Metage2Metabo, microbiota-scale metabolic complementarity for the identification of key species
eLife 9:e61968.
https://doi.org/10.7554/eLife.61968


